

Abstract
Fragile histidine triad (FHIT) gene deletions are among the earliest and most frequent events in carcinogenesis, particularly in carcinogen-exposed tissues. Though FHIT has been established as an authentic tumor suppressor, the mechanism underlying tumor suppression remains opaque. Most experiments designed to clarify FHIT function have analyzed the consequence of re-expressing FHIT in FHIT-negative cells. However, carcinogenesis occurs in cells that transition from FHIT-positive to FHIT-negative. To better understand cancer development, we induced FHIT loss in human bronchial epithelial cells with RNA interference. Because FHIT is a demonstrated target of carcinogens in cigarette smoke, we combined FHIT silencing with cigarette smoke extract (CSE) exposure and measured gene expression consequences by RNA microarray. The data indicate that FHIT loss enhances the expression of a set of oxidative stress response genes after exposure to CSE, including the cytoprotective enzyme heme oxygenase 1 (HMOX1) at the RNA and protein levels. Data are consistent with a mechanism in which Fhit protein is required for accumulation of the transcriptional repressor of HMOX1, Bach1 protein. We posit that by allowing superinduction of oxidative stress response genes, loss of FHIT creates a survival advantage that promotes carcinogenesis.
Keywords: BACH1, Cigarette smoke, FHIT, HMOX1, NRF2, Oxidative Stress
Abbreviations
- ApppA
diadenosine triphosphate
- ARE
antioxidant response element
- BACH1
BTB and CNC homology 1 gene
- BMC
bone marrow cell
- CPT
camptothecin
- CSE
cigarette smoke extract
- FHIT
fragile histidine triad gene
- HMOX1
heme oxygenase 1 gene
- MMC
mitomycin C
- Nrf2
nuclear factor erythroid derived 2-like 2 protein
- qRT-PCR
quantitative real time PCR
- RNAi
RNA interference
- ROS
reactive oxygen species
- siRNA
short interfering RNA
Introduction
The fragile histidine triad gene (FHIT) is a tumor suppressor that spans the most common fragile site in the human genome, FRA3B.1-3 FHIT is constitutively expressed in most tissues, and its loss is associated with a diverse set of malignancies, including lung, stomach, colon, breast and skin carcinomas.1,4-11 Tumors expressing loss of FHIT are typically of epithelial origin, and FHIT has been shown to be a common target of carcinogens, particularly cigarette smoke.12-15 Exposure to cigarette smoke is associated with FHIT exon deletion and translocation, as well as hypermethylation of the FHIT promoter with consequent loss of Fhit protein and development of malignancy.5,9,16,17
Previous work clearly demonstrates the tumor suppressor activity of FHIT. Mice heterozygous at the locus are more susceptible to spontaneous tumor formation.1,18 Tumor formation is accelerated by treatment with chemical carcinogens and can be prevented with FHIT gene therapy.1,3,19 Cell culture models show that re-expression of FHIT in FHIT-negative cells induces apoptosis, but the precise molecular mechanisms underlying tumor suppression remain unclear.4,6,20 Recent experiments demonstrate that Fhit deficiency promotes epithelial-mesenchymal transition, that FHIT expression protects genome integrity after carcinogen treatment, and also establish a role for Fhit in mitochondrial biology.21-27
Hanahan and Weinberg summarized that cancer cells are marked by the gain of 6 abnormal behaviors.12,14,28 Genome instability and subsequent genetic alterations underlie the acquisition of the hallmarks of cancer, as successive alterations in DNA produce genotypes that confer selective advantages. Frequent loss of FHIT in tumors is well documented.5,9,16,29 Of equal significance, FHIT inactivation occurs early in the process of carcinogenesis, particularly in lung cancer,18,30 suggesting that loss of this gene may facilitate acquisition of the additional alterations required for cell transformation.
Carcinogenesis occurs when cells lose expression of tumor suppressor genes. However, most experiments designed to dissect the mechanism of the FHIT gene were performed by converting FHIT− cells to FHIT+. Here we used RNA interference (RNAi) to model early FHIT loss in bronchial epithelial cells. When FHIT deficient cells were exposed to cigarette smoke, we saw that expression of a set of genes involved in the oxidative stress response was enhanced, including the cytoprotective enzyme heme oxygenase 1 (HMOX1).
HMOX1 expression is induced in response to various insults such as exposure to heavy metals, ultraviolet light, inflammation, and oxidative stress.19,31 HMOX1 expression protects cells from dying during acute exposure to stresses, but the mechanisms underlying this function are not fully understood. It has been proposed that the byproducts of Hmox1-catalyzed breakdown of heme, carbon monoxide and bilirubin, underlie cytoprotection by maintaining reactive oxygen species (ROS) homeostasis and promoting a cellular anti-oxidant state.20,32 However, expression of a catalytically inactive Hmox1 mutant promotes cell survival after stress as well as the wild type protein, suggesting that Hmox1 cytoprotection functions through an independent, yet to be elucidated mechanism.28,33 Early events that occur after Hmox1 expression include increased cell proliferative capacity,29,34 decreased cell adhesion,30,35 increased migration potential,31,35,36 and evasion of apoptosis.32,37 It follows that HMOX1 overexpression is detected in many cancers, including prostate malignancies, melanoma, glioma, adenocarcinoma, and others.17,33,38
Here, we demonstrate that loss of Fhit in bronchial epithelial cells promotes enhanced and sustained induction of Hmox1 in response to cigarette smoke exposure. We investigated the mechanism by which Fhit modulates Hmox1 expression and determined that Fhit loss is associated with decreased expression of a primary transcriptional repressor of HMOX1, Bach1. Thus, Fhit may be required for the normal cellular response to oxidative stress. We propose that by inactivating a system that attenuates anti-oxidant responses, loss of FHIT provides epithelial cells a survival advantage that promotes carcinogenesis.
Results
Gene expression changes in response to FHIT knockdown
The mechanism by which FHIT functions as a tumor suppressor has not been fully explained by experiments in which the FHIT gene has been reintroduced to FHIT negative cells. To investigate the hypothesis that Fhit acts as a regulator of gene expression in bronchial epithelial cells, we performed microarray analysis of cells after knocking down FHIT expression with siRNA. HBEC3-TK is an immortalized bronchial epithelial cell line that has been used to study the consequences of gene inactivation in lung cancer.13,35 These cells display normal epithelial morphology, are not transformed, have an intact p53 pathway, and have been used by others to study the pathogenesis of lung cancer.35,36,39 We first determined that treatment of HBEC3-TK cells with 2 unique siRNAs robustly silences FHIT expression at both the mRNA and protein level (Fig. 1 A, B). Total RNA from treated cells was analyzed by microarray to assess transcriptome changes due to FHIT loss. After restricting the data set to expression changes ≥1.5-fold with P ≤ 0.05 followed by multiple testing correction with a false discovery rate, we observed changes in only 3 genes, suggesting that FHIT loss does not have a large impact on gene expression in this model (Table 1).
Figure 1.
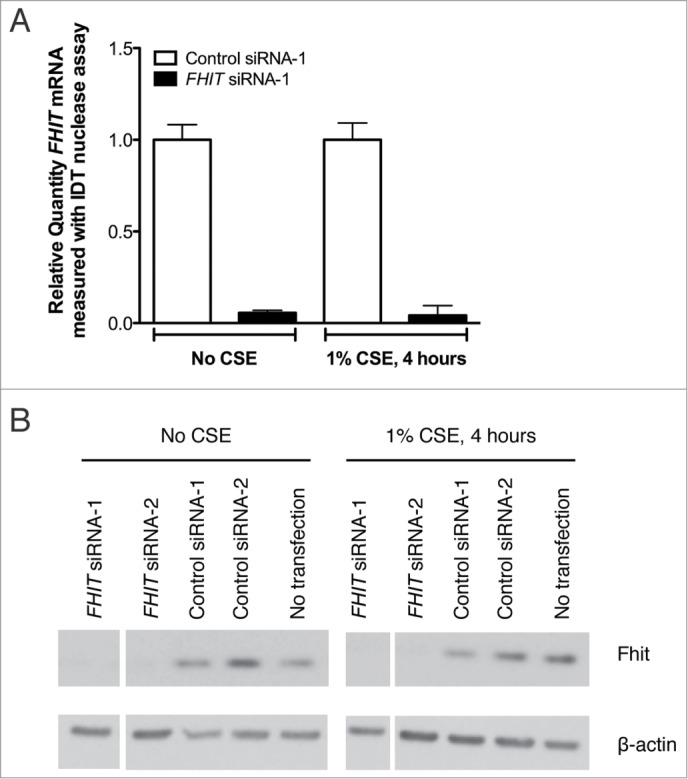
FHIT siRNA significantly reduces expression of FHIT mRNA and protein. HBEC3-TK cells were transfected with control or FHIT-targeting siRNAs for 48 hours. Cells were then exposed to 1% CSE for 4 hours or were left untreated. (A) Decreased FHIT expression was determined by qRT-PCR. Data represent the results of five experiments. (B) Fhit protein abundance was assessed by western blot. Treatment with 2 FHIT-targeting siRNAs significantly reduces Fhit protein levels and treatment with 2 negative control siRNAs does not affect Fhit protein levels. β-actin serves as an internal standard for loading control. Data represent the results of five experiments.
Table 1.
Gene expression changes in siFHIT versus siControl treated HBEC3-TK cells
| Gene_assignment | Gene Symbol | p-value | Ratio | Fold Change siFHIT over siControl |
|---|---|---|---|---|
|
NM_021155 // CD209 // CD209 molecule // 19p13 // 30835 /// NR_026692 // CD209 // CD209 |
CD209 |
0.0338 |
2.04 |
2.04 |
|
AK126520 // BIVM // basic, immunoglobulin-like variable motif containing // 13q33.1 // |
BIVM |
0.0158 |
2.57 |
2.57 |
| ENST00000391728 // KIR3DL1 // killer cell immunoglobulin-like receptor, three domains, | KIR3DL1 | 0.0340 | 3.04 | 3.04 |
The FHIT gene, which encompasses the common fragile site at 3p14.2, is a known target of environmental carcinogens including cigarette smoke. Loss of heterozygosity at 3p14 occurs more commonly in smokers than in nonsmokers.37,40 Preneoplastic lesions of the lung and cervix show a greater frequency of FHIT loss in smokers than in non-smokers.17,38,41 Rats exposed to cigarette smoke for short time intervals show a time dependent decrease in FHIT expression at both mRNA and protein levels in bronchial epithelial cells.15,42. Furthermore, peripheral blood samples show that active smokers express fragility at the FHIT locus.13,43-45 Relying on these data, we hypothesized that FHIT plays a role in mediating the cellular response to cigarette smoke. To test this, siRNA-treated HBEC3-TK cells were exposed to 1% CSE for 4 hours prior to RNA extraction and microarray analysis. We first aimed to establish that our CSE treatment protocol impacted gene expression in an expected manner. To do this, we compared gene expression in cells treated with siControl plus 1% CSE to gene expression in cells treated with siControl only. After restricting the dataset to expression changes ≥1.5-fold with P ≤ 0.05 followed by multiple testing correction with a false discovery rate, we observed changes in 378 genes, indicating that the CSE treatment had a strong effect on gene expression. These differentially expressed genes were analyzed with Ingenuity Pathway Analysis (IPA, Ingenuity Systems, www.ingenuity.com) to determine what molecular pathways were altered by CSE treatment. The significant canonical pathways associated with the differentially expressed genes are presented (Fig. 2). The affected pathways included NRF2-mediated oxidative stress response, glutathione biosynthesis, aryl hydrocarbon receptor signaling, and xenobiotic metabolism signaling, among others. This result is consistent with previous reports that these pathways are affected by exposing cells in culture to cigarette smoke.46-50 To assess the combined effect of FHIT knockdown and CSE treatment, we applied the same analysis criteria used for cells that were not treated with CSE to analyze the gene expression consequences of CSE treatment in control and FHIT knockdown cells (Tables 2, 3). We determined that a set of genes involved in the cytoprotective oxidative stress response were either only activated in FHIT knockdown cells, or were activated in both FHIT knockdown and control cells, but gene expression was enhanced by FHIT loss. Notably, a subset of the dysregulated genes have annotated roles in the oxidative stress response, suggesting that this pathway may be superinduced in FHIT deficient cells (Fig. 3A). We validated the gene expression changes of a subset of these genes by quantitative RT-PCR (qRT-PCR) (Fig. 3B). The data indicate that, in the absence of cigarette smoke, FHIT loss does not significantly alter gene expression. However, a set of genes involved in the cytoprotective oxidative stress response induced by CSE is superinduced by CSE when FHIT is lost. \raster="rgFigKCCY_A_946858_F0002_B"
Figure 2.
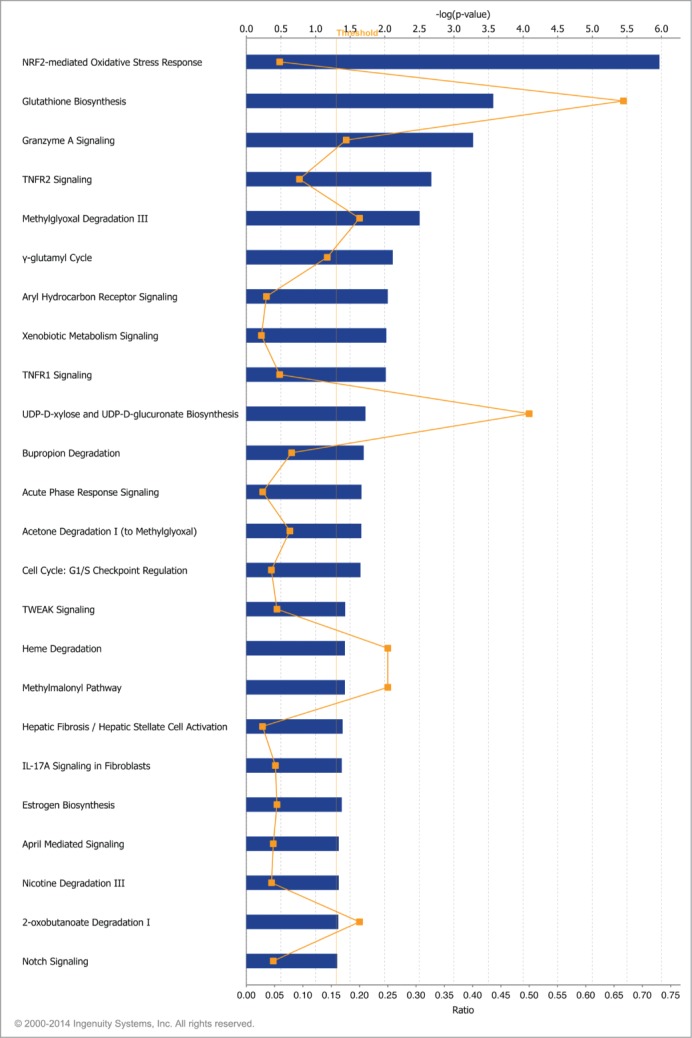
Canonical pathways affected by cigarette smoke exposure. Gene expression changes between cells treated with siControl (48 h) plus 1% CSE (4 h) and cells treated with siControl (48 h) alone were determined by microarray. IPA core analysis was used to generate a list of top biological functions affected by CSE exposure. The significant canonical pathways affected by CSE exposure are represented. x-axis bars represent the [–log(p-value)] of the pathway, calculated by Fisher's exact test. The threshold for this analysis was set to P-value≤0.05. x-axis points (orange) represent the ratio calculated by dividing the number of differentially expressed genes that map to a particular pathway by the total number of genes in that pathway.
Table 2.
Gene expression changes in response to treatment with 1% CSE in siControl treated HBEC3-TK cells
| Gene assignment | Gene symbol | Gene description | p-value | Fold change: siControl plus CSE over siControl no CSE |
|---|---|---|---|---|
| NM_002133 | HMOX1 | Heme oxygenase decycling 1 | 8.67E-05 | 13.63 |
| NM_02099 | AKR1B10 | Aldo-ketoreductase family 1, member B10 | 6.31E-05 | 6.41 |
| NM_014331 | SLC7A11 | Solute carrier family 7 | 1.61E-04 | 6.16 |
| NM_002061 | GCLM | Glutamate-cysteine ligase, modifier subunit | 7.87E-06 | 4.19 |
| NM_032145 | FBX030 | F-box protein 30 | 1.28E-06 | 3.03 |
| NM_001354 | AKR1C2 | Aldo-ketoreductase family 1, member C2 | 1.32E-04 | 2.94 |
| NM_000146 | FTL | Ferritin, light polypeptide | 1.13E-04 | 2.86 |
| NM_007034 | DNAJB4 | DnaJ (Hsp40) homolog, subfamily B, member 4 | 3.31E-05 | 2.79 |
| NM_032717 | AGPAT9 | Acylglycerol-3-phosphate O-acyltransferase 9 | 1.19E-07 | 2.61 |
| NM_080725 | SRXN1 | Sulfiredoxin 1 | 8.73E-06 | 2.48 |
| NM_00330 | TXNRD1 | Thioredoxin reductase 1 | 2.15E-06 | 2.48 |
| NM_006912 | RIT1 | Ras-like without CAAX 1 | 5.69E-06 | 2.38 |
| NM_001498 | GCLC | Glutamate-cysteine ligase, catalytic subunit | 5.12E-05 | 2.33 |
| NM_003714 | STC2 | Stanniocalcin 2 | 9.40E-05 | 2.29 |
| NM_003359 | UGHD | UDP-glucose 6-dehydrogenase | 4.24E-06 | 2.22 |
| NM_012124 | CHORDC1 | Cysteine and histidine-rice domain (CHORD)-containing 1 | 9.51E-06 | 1.99 |
| NM_001037330 | TRIM16L | Tripartite motif-containing 16-like | 1.45E-06 | 1.93 |
| NM_022060 | ABHD4 | Abhydrolase domain containing 4 | 7.20E-05 | 1.82 |
| NM_001432 | EREG | Epiregulin | 1.64E-04 | 1.77 |
| NM_018169 | C12orf35 | Chromosome 12 open reading frame 35 | 8.07E-05 | 1.65 |
| NM_002032 | FTH1 | Ferritin, heavy polypeptide 1 | 4.26E-06 | 1.62 |
| NM_000903 | NQO1 | NADPH dehydrogenase, quinone 1 | 1.09E-05 | 1.56 |
| NM_005186 | CAPN1 | Calpain 1, large subunit | 3.64E-05 | −1.54 |
| NR_027244 | LOC151009 | Hypothetical LOC151009 | 5.22E-05 | −1.57 |
| NM_014640 | TTLL4 | Tubulin tyrosine ligase-like family, member 4 | 6.87E-05 | −1.58 |
| NM_152683 | CCDC111 | Coiled-coil domain containing 111 | 5.51E-07 | −1.59 |
| NM_003545 | HIST1H4E | Histone cluster 1, H4e | 1.44E-04 | −1.64 |
| NM_183047 | ZMYND8 | Zinc finger, MYND-type containing 8 | 1.13E-04 | −1.66 |
| NM_020529 | NFKBIA | Nuclear factor of kappa light polypeptide gene enhancer in B-cell | 2.24E-06 | −1.80 |
| NR_002433 | SNORD12C | Small nucleolar RNA, C/D box 12C | 1.13E-04 | −1.80 |
| NM_002192 | INHBA | Inhibin, β A | 1.14E-04 | −2.50 |
| NM_006977 | ZBTB25 | Zinc finger and BTB domain containing 25 | 1.10E-04 | −2.56 |
Table 3.
Gene expression changes in response to treatment with 1% CSE in siFHIT treated HBEC3-TK cells
| Gene assignment | Gene symbol | Gene description | p-value | Fold change: siFHIT plus CSE over siControl no CSE |
|---|---|---|---|---|
| NM_002133 | HMOX1 | Heme oxygenase decycling 1 | 8.41E-06 | 36.63 |
| NM_02099 | AKR1B10 | Aldo-ketoreductase family 1, member B10 | 6.48E-06 | 12.62 |
| NM_014331 | SLC7A11 | Solute carrier family 7 | 1.14E-04 | 6.88 |
| NM_002061 | GCLM | Glutamate-cysteine ligase, modifier subunit | 3.39E-06 | 4.97 |
| NM_032145 | FBXO30 | F-box protein 30 | 7.44E-07 | 3.29 |
| NM_001143818 | SERPINB2 | Serpin peptidase inhibitor, clade B, member 2 | 3.23E-04 | 3.93 |
| NM_001354 | AKR1C2 | Aldo-ketoreductase family 1, member C2 | 4.42E-06 | 5.55 |
| NM_000146 | FTL | Ferritin, light polypeptide | 1.09E-05 | 4.29 |
| NR_033752 | LOC344887 | NmrA-like family domain containing 1 pseudogene | 2.18E-05 | 8.71 |
| NM_007034 | DNAJB4 | DnaJ (Hsp40) homolog, subfamily B, member 4 | 1.01E-05 | 3.35 |
| NM_032717 | AGPAT | 1-acylglycerol-3-phosphate O-acyltransferase | 2.06E-07 | 2.44 |
| NM_080725 | SRXN1 | Sulfiredoxin 1 | 2.48E-06 | 2.93 |
| NM_00330 | TXNRD1 | Thioredoxin reductase 1 | 8.43E-07 | 2.79 |
| NM_006912 | RIT1 | Ras-like without CAAX1 | 1.16E-06 | 2.91 |
| NM_001498 | GCLC | Glutamate-cysteine ligase, catalytic subunit | 1.49E-05 | 2.72 |
| NM_003714 | STC2 | Stanniocalcin 2 | 2.06E-05 | 2.79 |
| NM_003359 | UGDH | UDP-glucose 6-dyhydrogenase | 2.53E-06 | 2.35 |
| NM_000104 | CYP1B1 | Cytochrome P450, family 1, subfamily B | 1.44E-04 | 3.81 |
| NM_003739 | AKR1C3 | Aldo-ketoreductase family 1, member C3 | 3.45E-04 | 3.51 |
| NM_012124 | CHORDC1 | Cysteine and histidine-rich domain (CHORD)-containing 1 | 2.97E-05 | 1.80 |
| NM_021127 | PMAIP1 | Phorbol-12-myristate-13-acetate-induced protein 1 | 1.73E-04 | 2.06 |
| NM_006470 | TRIM16 | Tripartite motif-containing 16 | 3.17E-04 | 1.94 |
| NM_012328 | DNAJB9 | DNAJ (Hsp40) homolog, subfamily B, member 9 | 1.47E-04 | 2.45 |
| NM_001037330 | TRIM16L | Tripartite motif-containing 16-like | 3.46E-07 | 2.21 |
| NM_002359 | MAFG | v-maf musculoaponeurotic fibrosarcoma oncogene homolog G (avian) | 5.23E-04 | 2.21 |
| NM_022060 | ABHD4 | Abhydrolase domain containing 4 | 8.89E-06 | 2.22 |
| NM_014220 | TM4SF1 | Transmembrane 4 L 6 family member 1 | 1.03E-04 | 1.88 |
| NM_001432 | EREG | Epiregulin | 3.28E-05 | 2.05 |
| NM_021963 | NAP1L2 | Nucleosome assembly protein 1-like 2 | 5.24E-04 | 1.80 |
| NM_031412 | GABARAPL1 | GABA(A) receptor-associated protein like 1 | 2.86E-04 | 2.27 |
| NM_018252 | TMEM206 | Transmembrane protein 206 | 2.24E-04 | 1.95 |
| NM_001080493 | ZNF823 | Zinc finger protein 823 | 3.03E-05 | 2.45 |
| NM_018169 | C12orf35 | Chromosome 12 open reading frame 35 | 2.50E-05 | 1.53 |
| NM_001102429 | ZFAND4 | Zinc finger, AN1-type domain 5 | 1.56E-04 | 1.80 |
| NM_002083 | GPX2 | Glutathione peroxidase 2 | 5.66E-05 | 3.05 |
| NM_002032 | FTH1 | Ferritin, heavy polypeptide | 3.30E-07 | 1.97 |
| NM_013390 | TMEM2 | Transmembrane protein 2 | 2.29E-06 | 3.07 |
| NM_000903 | NQO1 | NADPH dehydrogenase, quinone 1 | 1.91E-07 | 2.12 |
| NM_003900 | SQSTM1 | Sequestome 1 | 1.98E-04 | 2.23 |
| NM_080632 | UPF3B | UPF3 regulator of nonsense transcripts homolog B (yeast) | 9.18E-05 | 1.64 |
| NM_021187 | CYP4F11 | Cytochrome P450, family 4, subfamily F, polypeptide 11 | 9.87E-05 | 2.03 |
| NM_182485 | CPEB2 | Cytoplasmic polyadenylation element binding protein 2 | 1.34E-04 | 1.81 |
| NM_014117 | C16orf72 | Chromosome 16 open reading frame 72 | 6.56E-04 | 1.74 |
| NM_014518 | ZNF229 | Zinc finger protein 229 | 3.84E-04 | 1.71 |
| NM_002603 | PDE7A | Phosphodiesterase 7A | 6.83E-04 | 1.82 |
| NM_004346 | CASP3 | Caspase 3, apoptosis-related cystein polypeptide | 1.54E-04 | 1.63 |
| NM_013370 | OSGIN1 | Oxidative stress induced growth inhibitor 1 | 7.05E-04 | 1.81 |
| NM_181659 | NCOA3 | Nuclear receptor coactivator 3 | 8.15E-06 | 1.87 |
| NR_027405 | MTHFD2 | Methylenetetrahydrofolate dehydrogenase (NADP+ dependent) | 1.65E-04 | 1.58 |
| NM_014743 | KIAA0232 | 6.37E-07 | 2.38 | |
| NM_018047 | RBM22 | RNA binding motif protein 22 | 2.63E-04 | 1.63 |
| NM_001912 | CTSL1 | Cathepsin L1 | 4.01E-05 | 1.93 |
| NM_017853 | TXNL4B | Thioredoxin-like 4B | 2.04E-04 | 1.80 |
| NM_001146108 | PTGR1 | Prostaglandin reductase 1 | 3.34E-04 | 1.56 |
| NM_003043 | SCL6A6 | Solute carrier family 6 | 9.87E-06 | 1.92 |
| NM_005080 | XBP1 | X-box binding protein 1 | 6.23E-04 | 1.58 |
| NM_173601 | GXYLT1 | Glucoside xylotransferase 1 | 4.54E-04 | 1.84 |
| NM_001145045 | ZNF286B | zinc finger protein 286B | 1.13E-04 | 1.86 |
| NM_018259 | TTC17 | tetratricopeptide repeat domain 17 | 1.79E-04 | 1.56 |
| NM_020772 | NUFIP2 | nuclear fragile X mental retardation protein interacting protein | 8.91E-06 | 1.53 |
| NM_020928 | ZSWIM6 | zinc finger, SWIM-type containing 6 | 1.54E-04 | 1.62 |
| NM_001012661 | SLC3A2 | solute carrier family 3 (activators of dibasic and neutral am | 6.21E-05 | 1.67 |
| NR_026562 | C20orf24 | Chromosome 20 open reading frame 24 | 7.56E-04 | 1.58 |
| NM_015971 | MRPS7 | mitochondrial ribosomal protein S7 | 1.76E-04 | 1.50 |
| NM_018566 | YOD1 | YOD1 OTU deubiquinating enzyme 1 homolog (S. cerevisiae) | 3.06E-05 | 1.91 |
| NM_005734 | HIPK3 | Homeodomain interacting protein | 5.14E-04 | 1.63 |
| NM_018403 | DCP1A | DCP1 decapping enzyme homolog A | 8.23E-04 | 2.28 |
| NM_001353 | AKR1C1 | Aldo-ketoreductase family 1, member C1 | 5.74E-04 | 1.74 |
| NM_001135643 | DCTN4 | Dynactin 4 | 7.34E-04 | 1.69 |
| NM_198965 | PTHLH | Parathyroid hormone-like hormone | 5.11E-05 | 1.71 |
| NM_001031617 | COX19 | Cytochrome c oxidase assembly homolog | 4.35E-04 | 1.59 |
| NM_004973 | JARID2 | Jumonji, AT rich interactive domain 2 | 8.27E-05 | 1.57 |
| NM_001949 | E2F3 | E2F transcription factor 3 | 2.63E-04 | 2.01 |
| NM_018941 | CLM8 | Ceroid-lipfuscinosis, neuronal 8 | 5.89E-04 | 1.65 |
| NM_001099270 | DICER1 | Dicer 1, ribonuclease type III | 6.27E-05 | 1.71 |
| NM_006154 | NEDD4 | Neural precursor cell expressed, developmentally downregulated 4 | 7.23E-04 | 1.52 |
| NM_005017 | PCTY1A | Phosphate cytydylyltransferase 1, choline, alpha | 9.91E-05 | 1.62 |
| NM_016535 | UBAP1 | Ubiquitin associated protein 1 | 6.23E-04 | 1.53 |
| NM_004101 | F2RL2 | Coagulation factor II (thrombin) receptor-like 2 | 1.51E-04 | 1.52 |
| NM_181453 | GCC2 | GRIP and coiled-coil domain containing 2 | 2.73E-04 | 1.52 |
| NM_178819 | AGPAT6 | 1-acylgylcerol-3-phosphate O-acyltransferase 6 | 2.54E-04 | 1.63 |
| NM_017921 | NPLOC4 | Nuclear protein localization 4 homolog | 7.51E-05 | 1.67 |
| NM_024852 | EIF2C3 | Eukaryotic transcription initiation factor 2C, 3 | 8.33E-04 | 1.51 |
| NM_015428 | ZNF473 | Zinc finger protein 472 | 3.28E-05 | 1.53 |
| NM_002657 | PLAGL2 | Pleiomorphic adenoma gene-like 2 | 5.10E-05 | 1.61 |
| NM_014494 | TNRC6A | Trinucleotide repeat containing 6A | 1.81E-06 | 1.78 |
| NM_004096 | EIF4EBP2 | Eukaryotic translation initiation factor 4E binding protein 2 | 1.23E-04 | 1.66 |
| NM_014822 | SEC24D | SEC24 family, member D | 2.24E-04 | 1.59 |
| NM_198275 | MPZL3 | Myelin protein zero-like 3 | 6.88E-04 | 1.54 |
| NM_014761 | KIAA0174 | 1.83E-04 | 1.55 | |
| NM_004846 | EIF4E2 | Eukaryotic translation initiation factor 4E family member 2 | 3.73E-04 | 1.55 |
| NM_004615 | TSPAN7 | Tetraspanin 7 | 1.15E-04 | 1.69 |
| NM_003071 | HLTF | Helicase-like transcription factor | 7.77E-04 | −1.63 |
| NM_199229 | RPE | Ribulose-5-phosphate-3-epimerase | 2.01E-05 | −1.54 |
| NM_020240 | CDC42SE2 | CDC42 small effector 2 | 4.65E-05 | −1.62 |
| NM_017858 | TIPIN | TIMELESS interacting protein | 5.77E-04 | −1.52 |
| NM_001004301 | ZNF813 | Zinc finger protein 813 | 1.34E-04 | −1.81 |
| NM_000064 | C3 | Complement component 3 | 2.45E-05 | 1.70 |
| NM_000435 | SNCA | Synuclein, alpha (non A4 component of amyloid precursor) | 7.55E-04 | −1.5 |
| NM_001037540 | SCML1 | Sex comb on midleg-like 1 | 6.77E-04 | −1.64 |
| NM_016133 | INSIG2 | Insulin induced gene 2 | 3.25E-05 | −1.75 |
| NM_002894 | RBBP8 | Retinoblastoma binding protein 8 | 6.89E-06 | −1.76 |
| NM_032438 | L2MBTL3 | L(3)mbt-like 3 (Drosophila) | 1.77E-04 | −1.65 |
| NM_003534 | HIST1H3G | Histone cluster 1, H3g | 4.01E-04 | −1.73 |
| NM_182909 | FILIP1L | Filamin A interacting protein-like | 1.45E-04 | −1.64 |
| NR_027244 | LOC151009 | Hypothetical LOC151009 | 4.11E-04 | −1.69 |
| NM_002065 | GLUL | Glutamate-ammonia ligase | 4.33E-04 | −1.53 |
| NM_020529 | NFKBIA | Nuclear factor of kappa light polypeptide gene enhancer in B-cell | 1.47E-05 | −1.58 |
Figure 3.

FHIT knockdown enhances expression of oxidative stress response genes after cigarette smoke treatment. HBEC3-TK cells were transfected with control or FHIT-targeting siRNAs for 48 hours. Cells were then exposed to 1% CSE for 4 hours or were left untreated. (A) Gene expression after siRNA treatment was analyzed with microarray. The left panel demonstrates that enhanced expression of a set of oxidative stress response genes was detected in FHIT knockdown cells after exposure to 1% CSE. All of the genes in this set pass FDR correction after ANOVA, P≤ 0.05. The right panel demonstrates enhanced expression of genes in FHIT knockdown cells. In these cases, upregulation passed FDR in FHIT knockdown cells but did not pass this statistical screen in siControl treated cells. (B) qRT-PCR validation of the microarray data. Data represent the results of at least three independent experiments. A 2-tailed paired t-test was used to assess significance of the data; *P ≤ 0.05; **P ≤ 0.01. Error bars represent standard deviations.
Hmox1 expression is enhanced by FHIT knockdown in CSE stressed cells
One of the CSE-induced genes that is superinduced in FHIT knockdown cells is HMOX1. HMOX1 is a member of a battery of stress response genes whose expression is controlled, in part, by promoter stress response elements.39,51-53 We validated the upregulation of Hmox1 observed in the microarray experiment by qRT-PCR (Fig. 4A). In the absence of CSE, HMOX1 mRNA is present in amounts approaching the threshold of qRT-PCR detection and the protein is undetectable by western blot (Fig. 4A, B). CSE treatment induces HMOX1 mRNA and protein expression to readily detectable levels (Fig. 4A, B). CSE exposure combined with FHIT knockdown markedly increases the level of Hmox1 protein (Fig. 4B). There are at least 2 heme oxygenase isoforms in mammals, HMOX1 and HMOX2. While HMOX2 is expressed constitutively and confers protection to basal levels of oxidation, HMOX1 is strictly induced in response to stress.40,54,55 Thus, the expression pattern we detected in HBEC3-TK cells is normal. To ascertain that the increase in HMOX1 is not due to an off-target effect of one of the siRNAs, we transfected cells in parallel with a second control and second FHIT-targeting siRNA. In doing so, we confirmed that the increase in HMOX1 is due to FHIT loss (Fig. 4B). Importantly, the induction of HMOX1 is not affected by the transfection procedure, as indicated by the equivalent results in cells treated with control siRNA and those not treated with siRNA (Fig. 4B). These data indicate that in the presence of CSE, FHIT knockdown superinduces HMOX1 expression.
Figure 4.
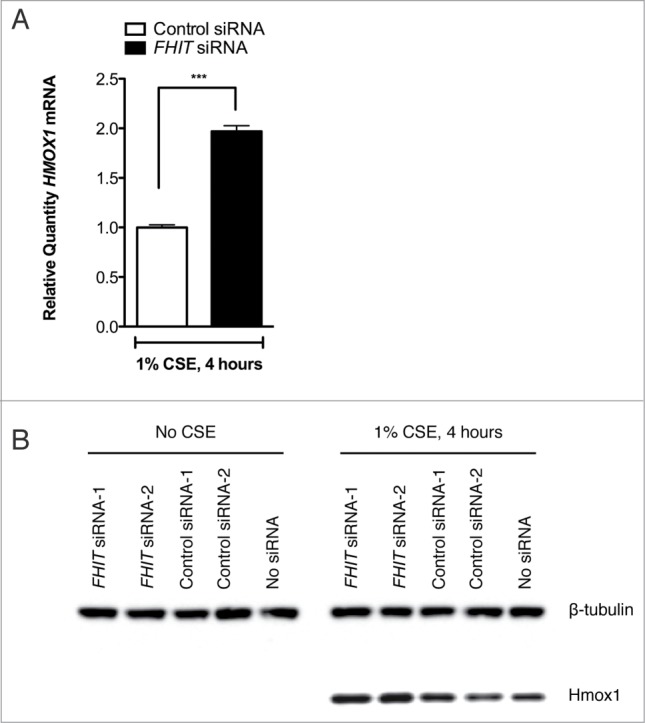
FHIT knockdown enhances the expression of HMOX1 after cigarette smoke. HBEC3-TK cells were transfected with control or FHIT-targeting siRNAs. After transfection, cells were either treated for 4 hours with 1% CSE or were left untreated. (A) HMOX1 was quantified by qRT-PCR. Data represent results of 6 independent experiments. A 2-tailed paired t-test was used to assess significance; ***P≤ 0.001. (B) Hmox1 protein abundance was assessed by western blot. Treatment with 2 FHIT-targeting siRNAs increases Hmox1 expression relative to cells treated with 2 negative control siRNAs. Western blot data are representative of 4 independent experiments.
To confirm that the FHIT knockdown-mediated enhancement of HMOX1 induction is not unique to HBEC3-TK cells, we replicated the experiment in 2 unrelated cell lines. We first used an immortalized tracheal airway epitheial cell line, TERT-T106.20,41 In these cells, HMOX1 is not detected in the absence of CSE (Fig. 5A). As observed in HBEC3-TK cells, Hmox1 protein expression is induced by CSE and superinduced when FHIT is knocked down (5A). We then tested if the effect was present in immortalized human foreskin keratinocytes (TERT-HFK)20,29,31,42,56 and obtained an equivalent result (Fig. 5B). These findings indicate that the role of FHIT in limiting Hmox1 expression is not dependent on a specific genetic background or unique cell type.
Figure 5.
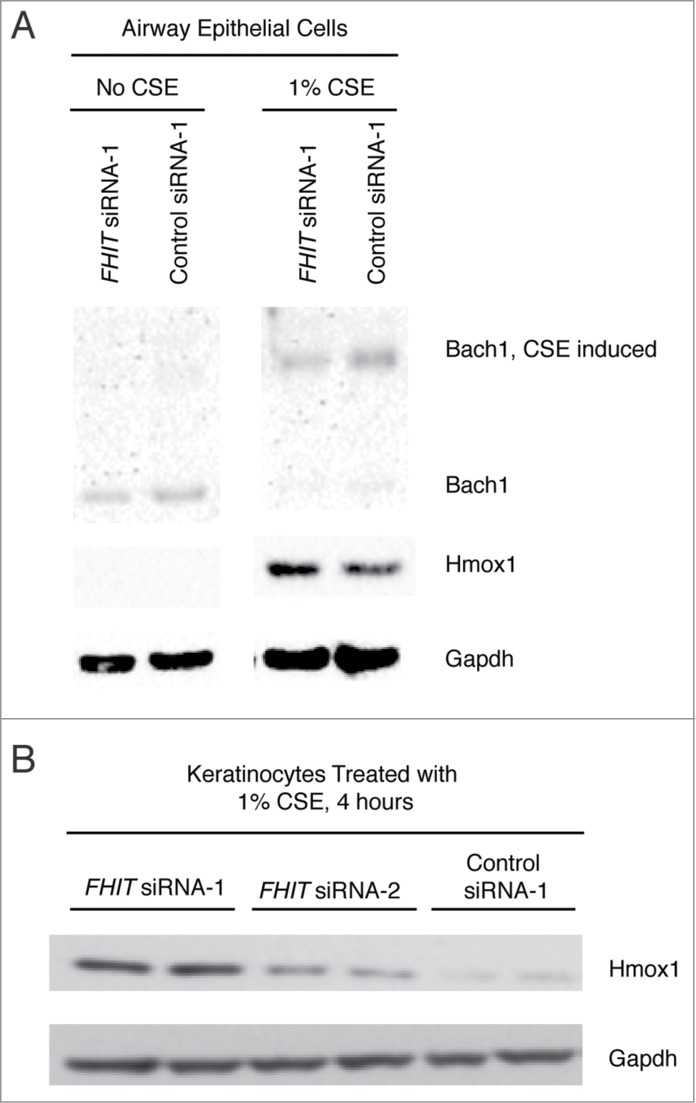
FHIT loss enhances Hmox1 expression in TERT-HFK and TERT-T-106 cells. (A) Human foreskin keratinocytes or (B) tracheal airway epithelial (T106) cells were transfected with control or FHIT-targeting siRNAs. After knockdown, cells were exposed to 1% CSE for 4 hours. Hmox1 protein abundance was assessed by western blot. The data show that Hmox1 expression is enhanced by FHIT knockdown in these cells, demonstrating that the role of FHIT in modulating Hmox1 expression does not require a specific genetic background.
Hmox1 induction occurs earlier and is more sustained in FHIT knockdown cells
To determine whether FHIT knockdown modulates the kinetics of protein accumulation, we exposed siRNA-treated HBEC3-TK cells to CSE for different time intervals and measured the level of Hmox1 by western blot. Hmox1 protein is detected earlier in FHIT knockdown cells and, consistent with previous results, is superinduced at the protein level (Fig. 6A). Typically, Hmox1 levels increase in response to an acute stress. Once the stress is removed, Hmox1 levels return to baseline. To test if FHIT knockdown affects the rate at which Hmox1 levels decay, we exposed siRNA-treated HBEC3-TK cells to 1% CSE for 4 hours and allowed the cells to recover in fresh media for various time intervals. Loss of FHIT increases expression of Hmox1 at each time point, but the rate of protein decay was not altered (Fig. 6B).\raster="rgFigKCCY_A_946858_F0006_B"
Figure 6.
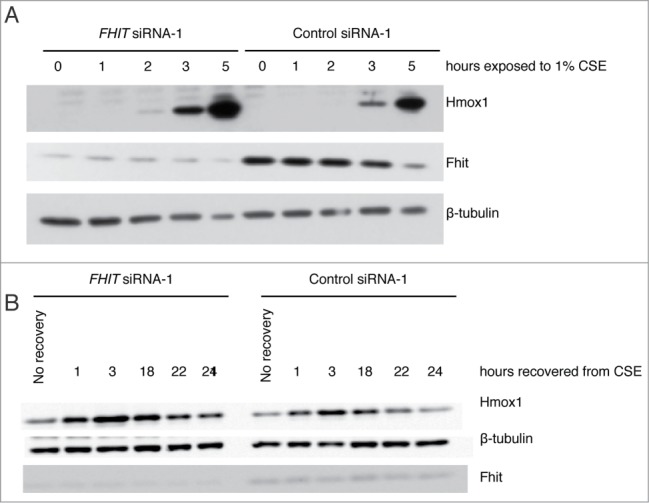
FHIT knockdown induces early and sustained expression of Hmox1. HBEC3-TK cells were transfected with control or FHIT siRNAs and exposed to 1% CSE for increasing time points, up to 4 hours. After 4 hours, cells were recovered in fresh media for increasing amounts of time. (A) Hmox1 protein is detected earlier in FHIT knockdown cells and (B) Hmox1 expression is enhanced at all time points by FHIT loss. Data represent the results of three independent experiments. At each time point, there is approximately 2-fold greater Hmox1 in FHIT knockdown cells.
Mechanism of Hmox1 superinduction in response to FHIT loss
Previous studies have demonstrated that FHIT expression affects calcium signaling, attenuates NF-κB signaling, and promotes phosphorylation and activation of AKT.43-45,57 Notably, modulation of these pathways has also been demonstrated to affect HMOX1 expression.51-53,58-60 For this reason, we asked whether the superinduction of HMOX1 seen after FHIT knockdown might be mediated through one or more of these pathways. However, we found that these pathways do not contribute to upregulation of HMOX1 in our model (Figs. 7–10).
Figure 8.
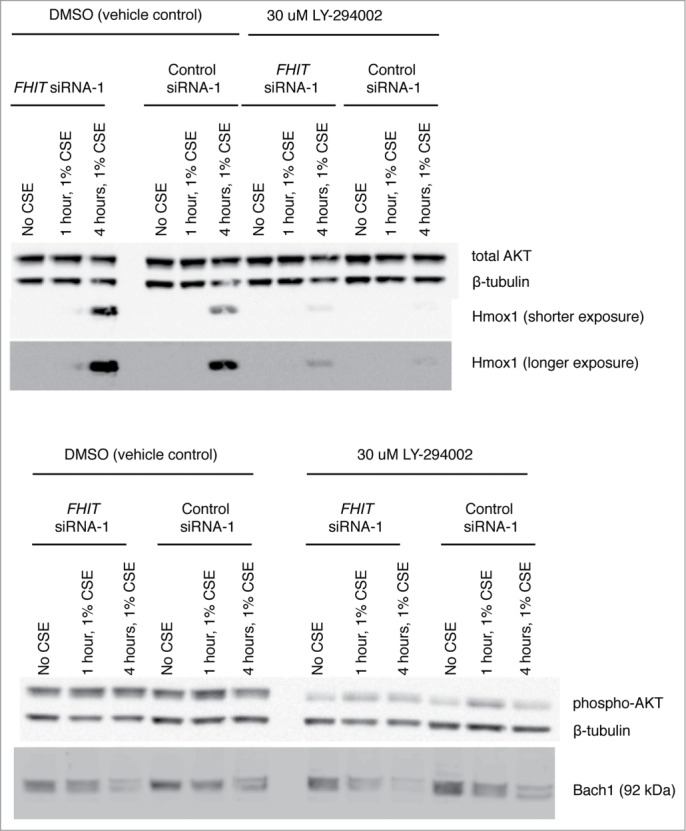
PI3K inhibition blunts the induction of Hmox1 but does not effect FHIT mediated repression of Hmox1. Treatment with LY294002 inhibits phosphorylation of AKT and blunts induction of Hmox1 in response to CSE. Hmox1 remains superinduced in FHIT knockdown cells.
Figure 9.
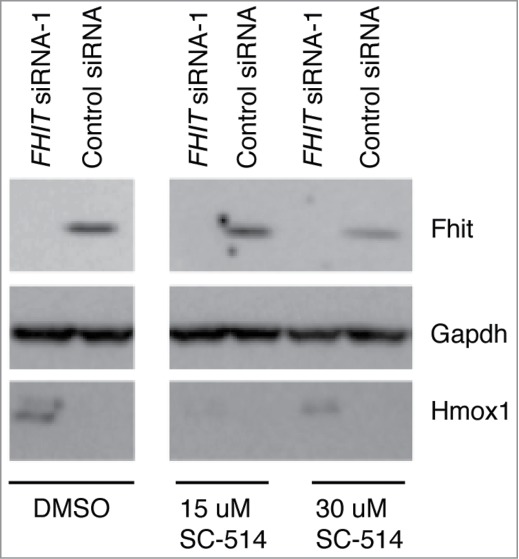
NFkB inhibition blunts the induction of Hmox1 but does not effect FHIT-mediated repression of Hmox1. SC-514 is a selective inhibitor of IKK2 and blocks NF-kB dependent gene expression. HBEC3-TK cells were treated with control or FHIT siRNA for 48 hours. Cells were pretreated with 15 μM SC-514, 30 μM SC-514, or DMSO vehicle for 2 hours. Cells were then treated with 1% CSE supplemented with DMSO vehicle or indicated concentrations of SC-514. Western blot was used to detect levels of Hmox1 in the samples. While IKK2 inhibition blunts the induction of Hmox1, the protein is still superinduced in FHIT knockdown cells.
Figure 7.
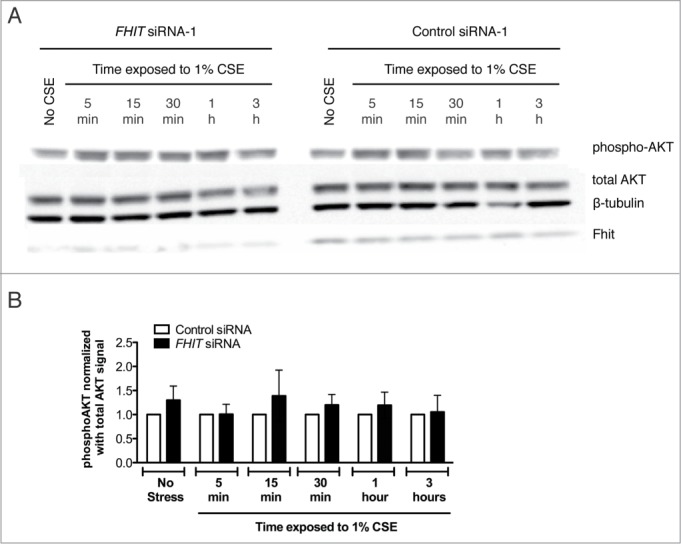
PI3K inhibition does not affect expression of FHIT. HBEC3-TK cells were treated with control or FHIT siRNA for 48 hours. Cells were pretreated with 30 μM LY294002 or DMSO vehicle for 1 hour and then treated with 1% CSE supplemented with 30 μM LY294002 or DMSO for the indicated time intervals. (A) Western blot demonstrates that FHIT knockdown does not affect phosphorylation of AKT. AKT is phosphorylated in response to CSE but is not altered in degree of activation by FHIT knockdown. (B) Densitometry measurements of three independent experiments. p-values were determined with a 2-tailed t-test; * P≤ 0.05. Error bars indicate standard deviations of triplicate samples.
Figure 10.
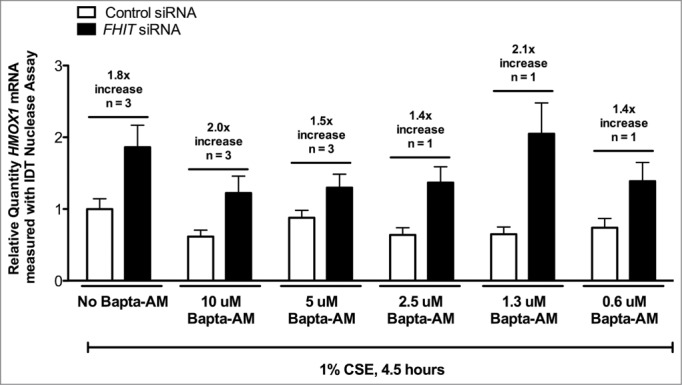
Calcium chelation does not affect FHIT-mediated repression of HMOX1. HBEC3-TK cells were treated with control or FHIT siRNA for 48 hours. Cells were treated with DMSO vehicle, 10 μM BAPTA-AM, or 5 μM BAPTA-AM for 30 minutes. Cells were then treated with 1% CSE for 4.5 hours. qRT-PCR was used to detect HMOX1 expression in the cells. While BAPTA-AM blunts the induction of HMOX1 in response to CSE, HMOX1 expression is still superinduced by FHIT knockdown.
Upon excluding these pathways, we analyzed the regulation of the well-characterized Bach1-Nrf2 oxidative stress response axis. Nrf2 and Bach1 are canonical regulators of HMOX1 transcription that bind DNA cis-elements to activate or repress target gene transcription, respectively.54,55,61 We found that Nrf2 mRNA and protein levels are unchanged in response to FHIT knockdown in both CSE treated and untreated cells (Fig. 11A and B). Additionally, while knockdown of NFE2L2, the gene that encodes Nrf2, blunts the induction of HMOX1 in response to stress, simultaneous knockdown of FHIT and NFE2L2 still yields a superinduction of HMOX1 (Fig. 11C). These data indicate that the ability of FHIT to dampen HMOX1 expression does not require Nrf2.
Figure 11.

FHIT-mediated repression of HMOX1 does not require Nrf2. HBEC3-TK cells were transfected with control, FHIT, or NFE2L2 siRNAs. After transfection, cells were either treated for 4 hours with 1% CSE or left untreated. (A) NFE2L2 (Nrf2) expression was quantified by qRT-PCR. FHIT knockdown does not effect NFE2L2 mRNA levels before or after CSE treatment. The data represent the results of three independent experiments. (B) Nrf2 protein abundance was assessed by protein gel blot. Nrf2 migrates at the expected molecular weight in both CSE and non-CSE treated samples. A slow migrating species of Nrf2 (∼ 75 kD) appears in CSE treated cells. Treatment with NFE2L2 siRNA confirms both isoforms as Nrf2. FHIT knockdown has no effect on Nrf2 protein abundance. (C) RNA was collected from cells transfected with control, FHIT siRNA, or NFE2L2 siRNA alone, or FHIT and NFE2L2 siRNA together. Knockdown of NFE2L2 blunts the induction of HMOX1 after CSE exposure. Concurrent knockdown of FHIT and NFE2L2 yields a superinduction of HMOX1 to a magnitude similar to that when only FHIT is depleted. Data represent the results of three independent experiments.
As with Nrf2, BACH1 mRNA levels were not dependent on FHIT expression or the application of CSE (Fig. 12A). In addition, Bach1 protein levels were unchanged in response to FHIT knockdown in the absence of stress (Fig. 12B). However, two observations about Bach1 protein were made in CSE-treated cells. First, CSE treatment produced a slowly migrating species of Bach1 (Fig. 12B). This species was confirmed to be Bach1 by siRNA knockdown in an independent experiment (Fig. 12C). Second, the total level of Bach1 protein was decreased in FHIT knockdown cells. Quantification of the results of multiple experiments indicates that FHIT knockdown combined with CSE stress results in a ∼40% reduction in Bach1 protein (Fig. 12D). To test whether a reduction in Bach1 is sufficient to induce Hmox1 protein, we titrated BACH1 siRNA into HBEC3 cells and saw a clear and inverse relationship between Bach1 and Hmox1 levels (Fig. 13A and B). Interestingly, we also note that the levels of Fhit and Bach1 protein are inversely correlated. Taken together, the data indicate that the superinduction of HMOX1 in FHIT knockdown cells may be mediated through decreased stability or translation of Bach1 protein in cells that have both lost FHIT and are stressed with cigarette smoke. \raster="rgFigKCCY_A_946858_F0013_B"
Figure 12.
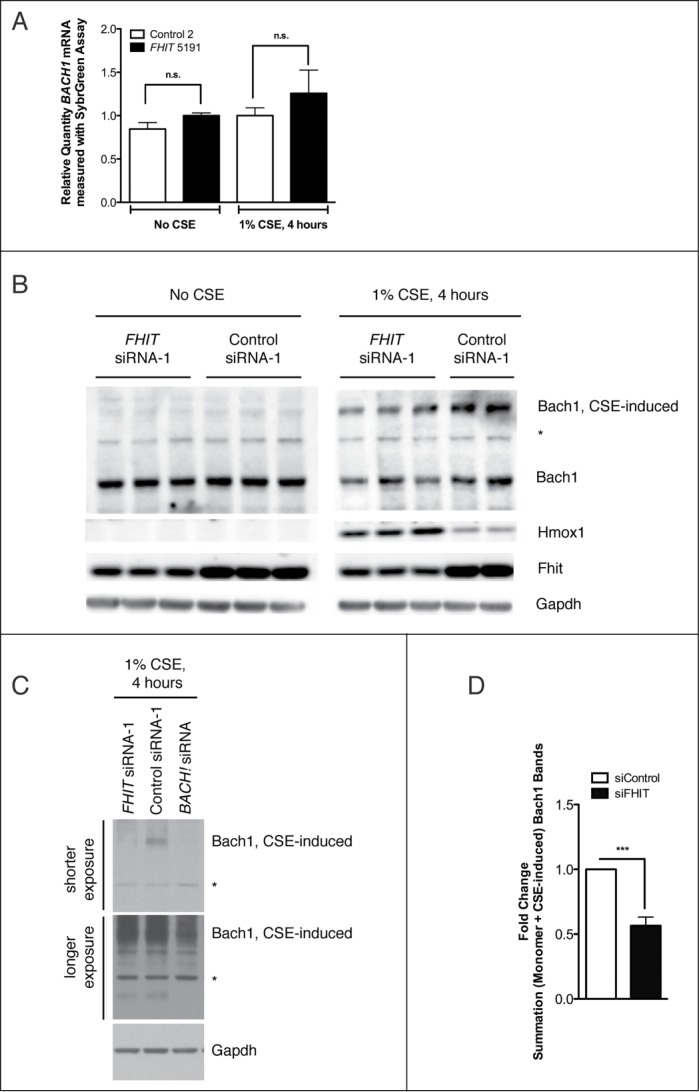
FHIT loss is associated with reduced Bach1 protein levels. HBEC3-TK cells were transfected with control or FHIT-targeting siRNAs. After transfection, cells were either treated with 1% CSE for 4 hours or left untreated. (A) BACH1 mRNA was quantified with qRT-PCR. FHIT knockdown does not significantly affect BACH1 mRNA levels before or after CSE treatment. Data represent the results of three independent experiments. (B) Bach1 protein abundance was assessed by western blot. Bach1 protein levels are not affected by FHIT knockdown in the absence of CSE. In CSE treated cells, Bach1 migrates as 2 species. A fast migrating species exists at the expected molecular weight (92 kD), and a slow migrating species exists at a higher molecular weight (∼ 150 kD). Total Bach1 protein levels are reduced in FHIT knockdown CSE-treated cells. Western data represent the results of 4 independent experiments (C) BACH1 siRNA treatment confirms both bands to be Bach1. (D) Relative protein quantification. Error bars represent mean +/− SEM of results from three independent experiments; ***P < 0.001.
Figure 13.
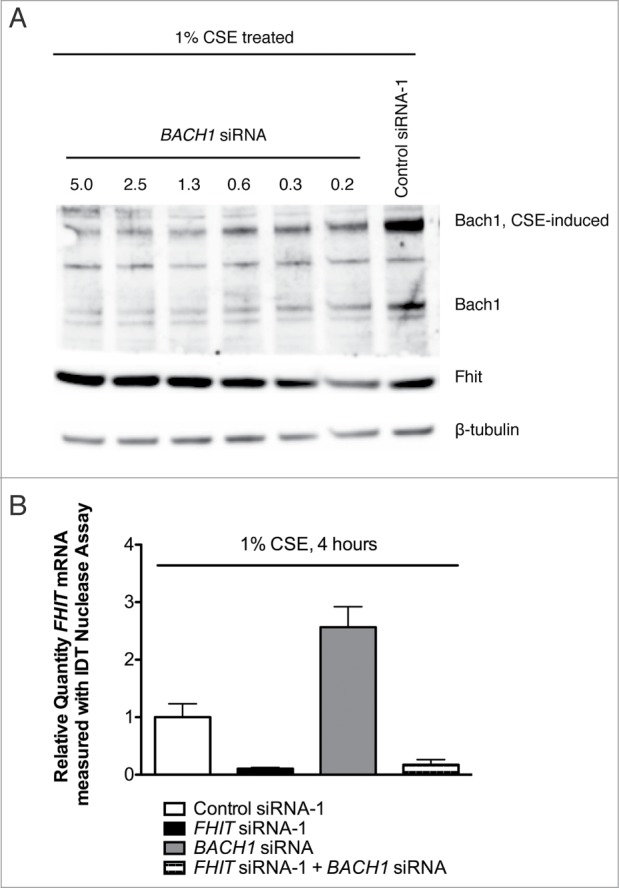
Fhit and Bach1 expression levels are inversely correlated. (A) HBEC3-TK cells were transfected with control or BACH1 siRNA. After transfection, cells were treated with 1% CSE for 4 hours. Protein abundance was measured by western blot. Hmox1 and Fhit protein levels are inversely correlated with Bach1 protein abundance. (B) HBEC3-TK cells were transfected with control, BACH1, or FHIT siRNA. FHIT expression was measured by qRT-PCR. BACH1 knockdown increases FHIT expression approximately 2-fold. Data represent the results of three independent experiments. Error bars represent standard deviations.
Discussion
This work provides evidence of a role for FHIT in the cellular response to oxidative stress, demonstrating that when FHIT is depleted from cells exposed to cigarette smoke, the induction of a subset of oxidative stress response genes, including HMOX1, is enhanced. Several studies have illustrated a key role for HMOX1 in promoting cell survival during inflammation, and HMOX1 expression has multiple functions in smoking-mediated lung cancers.20,62-65 Because HMOX1 promotes cell proliferation and increases resistance to oxidative stress, overexpression of HMOX1 imparts a selective advantage to cells in the early stages of carcinogenesis and correlates with resistance to many chemotherapeutics in malignancy.20,29,31,56 Thus, our data link loss of Fhit to a key pathway in the establishment and maintenance of the malignant state.
A multitude of signaling pathways impact the expression of HMOX1. We investigated several implicated pathways and identified a relationship between loss of Fhit and reduced protein levels of Bach1. The Bach1 transcription factor suppresses the expression of a battery of stress response genes. In the absence of stress, Bach1 binds to DNA antioxidant response elements (AREs) and strongly represses gene transcription. Upon application of stress, Bach1 is released from DNA and is exported to the cytoplasm where it is targeted for ubiquitylation and proteasome-mediated degradation.57 Concomitant with Bach1 export, the activating transcription factor Nrf2 translocates into the nucleus and occupies AREs previously bound by Bach1, promoting a coordinated induction of stress response genes. Aberrant transcriptional activity of Bach1 and Nrf2 underlie several diseases, including many cancers. Our study suggests that FHIT knockdown decreases protein levels of Bach1, which is sufficient to enhance expression of HMOX1 in epithelial cells. An outstanding question is how FHIT loss leads to decreased Bach1 protein levels. Bach1 is targeted for ubiquitylation by the E3 ligase HOIL-1 (RBCK1), but to date we have not seen differences in HOIL-1 expression levels in FHIT knockdown relative to control treated HBEC3-TK cells, nor have we seen differences in HOIL-1 splice variants (unpublished data). Additionally, we have not detected a difference in nuclear export of Bach1 that depends on Fhit expression (unpublished results). Importantly, it is clear that BACH1 mRNA levels are not affected by FHIT loss, so we hypothesize that Fhit modulates the stability or translation of Bach1 protein. Strikingly, the inverse relationship between levels of Fhit and Bach1 protein implies that the FHIT gene may be a target of repression by Bach1. This finding is interesting as it suggests that the proteins participate in a regulatory feedback loop during control of the oxidative stress response in cancer-promoting environments.
Substantive evidence implicates Fhit in tumor suppression but the precise mechanism underlying the function has not been elucidated. Fhit protein is a dimeric histidine triad protein that binds and hydrolyzes diadenosine triphosphate (ApppA) and related nucleotides.58-60 ApppA, a product of reactions catalyzed by tRNA synthetases and other enzymes, has been proposed to have several intracellular functions including signaling stress responses.61 Indeed, the intracellular concentration of ApppA increases in cells exposed to oxidative stressors.62-65 Because mutation of the Fhit enzyme active site histidine residue greatly retards ApppA cleavage without a strong effect on ApppA binding or proapoptotic activity in a reexpression assay, it has been argued that the Fhit-ApppA complex may mediate the function of Fhit.2,66-68 While these experiments were valuable in dissection of the amino acids and nucleotide interactions linked to Fhit function, the Fhit re-expression system may have biased the result to an apoptotic pathway. In contrast, our model recapitulates the process of carcinogenesis by analyzing the cellular consequence of FHIT loss. It will be interesting to probe the relationship between CSE and induction of ApppA and related nucleotides in the control of oxidative stress genes.
Since its discovery in 1996, hundreds of papers have described the FHIT gene. Many of these studies attempt to dissect the mechanism of Fhit-mediated tumor suppression, but they present disparate explanations for the phenomenon, and a unifying theory has proved to be elusive. Our proposal that Fhit limits cell growth by attenuating the oxidative stress response is supported by independently published studies that connect Fhit function with the accumulation of intracellular ROS. For example, FHIT-deficient bone marrow cells (BMC) have lower levels of ROS after hydroquinone challenge. A reduction in intracellular levels of ROS are detected in FHIT negative BMCs relative to wild-type, and this reduction in ROS accumulation is linked to failure to induce apoptosis as the phenotype is reversed with application of the antioxidant N-acetyl-L-cysteine.1,5,7-9,69 Several studies that connect Fhit expression to increased sensitivity to anti-cancer drugs may also serve to substantiate the link between Fhit function and oxidative stress. Re-expression of Fhit in Fhit-negative cancer-derived cell lines increases sensitivity to mitomycin C (MMC), camptothecin (CPT), and cisplatin. 13,15,70,71 While the canonical role of each drug involves modulation of DNA topography to induce DNA damage,16,17,72-74 each agent also effects ROS production, and the production of ROS has been demonstrated to underlie the toxic effect of each compound.1,75-79 Resupplying FHIT to FHIT-negative cells increases cell death after MMC, CPT, and cisplatin treatments, but this phenomenon has not explained mechanistically. Thus the ability of Fhit to dampen expression of antioxidant response genes may not only explain the effects of FHIT gene loss in this study but the effect of FHIT reexpression in many studies.
Materials and Methods
Cell culture
HBEC3-TK bronchial epithelial cells were a kind gift from Dr. John Minna (UT Southwestern). TERT-HFK human foreskin keratinocytes and TERT-T106 tracheal airway epithelial cells were generous gifts of Dr. Aloysius Klingelhutz (University of Iowa). Cells were cultured on bovine collagen coated plastic dishes (Sigma, Cat #C4243). Cells were maintained in Keratinocyte Serum Free Media (KSFM) supplemented with BPE (12.5 g/ml) and EGF (5.0 ng/ml) (Gibco Cat #17005-075). Cells were grown in humidified 37°C, 5% CO2 incubators.
siRNA transfection
Cells were seeded at densities of 400,000 cells/plate (10 cm dishes), 125,000 cells per well (6 well dishes), or 30,000 cells/well (12 well dishes). After overnight incubation, cells were transfected with 15 nM siRNA and Lipofectamine RNAiMax (Invitrogen, Carlsbad CA) according to the manufacturer's protocol. siRNAs were obtained from commercial vendors. FHIT siRNA-1 (Cat #4390843), FHIT siRNA-2 (Cat #AM16706), Control siRNA-1 (Cat #4390843), and Control siRNA-2 (Cat #4390846) were purchased from Ambion (Life Technologies). BACH1 siRNA (Cat # HSC.RNAI.N001186.12.1) and NFE2L2 siRNA (Cat #HSC.RNAI.N001145412.12) were purchased from IDT (Coralville, IA). After 4.5 hours of siRNA incubation, transfection media were replaced with fresh KSFM. Cells were incubated for 48 hours.
Cigarette smoke extract preparation
Research grade cigarettes were purchased from the University of Kentucky. After removing the filter, the cigarette was combusted and smoke extracted into 10 ml of KSFM, as described previously.15,34 This preparation was termed “100% CSE.” The extract was filtered though a 0.22 μm pore membrane (Millipore Cat #SCGP00525). CSE was diluted to 1% in KSFM and added to cells in culture for the indicated times. CSE treated cells were incubated separately from non-CSE treated cells.
RNA extraction, cDNA synthesis, and RT-PCR analysis
Total RNA was extracted from cells using the RNeasy Mini kit (Qiagen, Cat #74104) after homogenizing cells with Qiashredder spin columns (Qiagen, Cat #79654). RNA was DNase treated with the Turbo DNA-free kit (Ambion, Cat #AM1907). 500 ng total RNA was reverse transcribed with the iScript cDNA synthesis kit (BioRad, Cat #170–8890) or 1.5 μg total RNA was reverse transcribed with the High Capacity cDNA synthesis kit (Applied Biosystems, Cat #4368814). RT-PCR was performed with iQ SYBR Green Supermix (BioRad, Cat #170–880) and designed primers or with TaqMan Gene Expression Master Mix (Applied Biosystems, Cat #4369016) and PrimeTime nuclease primer/probe assays (IDT). Nuclease assays used in this study are: NFE2L2, IDT Catalog Hs.PT.49a.36704, GAPDH, IDT Catalog Hs.PT.47.1164609, FHIT, IDT Catalog Hs.PT.47.3317107, and HMOX1, IDT Catalog Hs.PT.53a.22439609. Primers used in SYBR Green assays are listed in 5’-3’ direction as follows: AKR1B10 – GCCACAGGGATTCAAGTCT and CTTTCACCAGCCCCTCATC; AKR1C1 – GCCGTGGAGAAGTGTAAAGATG and CTGGTTGAAGTAAGGATGACATTC; AKR1C2 – TAAAGCCAGGTGAGGAAGTG and CTGTGGTTGAAGTTGGACAC; AKR1C3 - AACAAGCCAGGACTCAAGTAC and CAGAGCACTATAGGCAACCAGl NQO1 – CCGCAGACCTTGTGATATTCC and ACTCGCTCAAACCAGCCTTTCAGA; GPX2 – GCTTCCCTTGCAACCAATTTG and TTCTGCCCATTCACCTCAC; SERPINB2 – CAGTAGACTTCCTAGAATGTGCAG and AAGTAGACAGCATTCACCAGG; SRXN1 – CAAGGTGCAGAGCCTCG and CTTTGATCCAGAGGACATCGA; BACH1 – TCTTGAATCAGAAATTGAGAAGCTG and TGGCAAAGTCCAGTTAGGTTCTGCT; GAPDH – ACATCGCTCAGACACCATG and TGTAGTTGAGGTCAATG- AAGGG.
Immunoblotting
Cells were suspended in ice-cold RIPA buffer (50 mM Tris-Cl (pH 8), 1% NP-40, 0.5% Na deoxycholate, 0.1% SDS, 150 mM NaCl, 5 mM EDTA) supplemented with protease inhibitors (Roche Cat #11836170001) and phosphatase inhibitors (Roche Cat #04906845001). Cells were lysed on ice for 20 minutes before clarifying (4°C, 13 K rpm, 10 minutes). Protein content was quantified with the BCA Protein Assay (Pierce Cat #23225). Equivalent amounts of protein were reduced with 50 mM DTT, denatured with LDS, heated, and loaded on NuPage 4–12% Bis-Tris gels (Invitrogen) and electrophoresed in 1x MOPS buffer. Protein gels were transferred to nitrocellulose membranes, which were blocked with 5% milk. Primary antibodies were incubated with membranes overnight at 4°C. Secondary antibody incubations were performed at room temperature for 30 minutes. Blots were developed with ECL - SuperSignal West Pico (Pierce), Supersignal West Femto (Pierce), or Quantum (Advansta) reagents. Images were collected with GE ImageQuant LAS4000 and quantification performed with ImageQuant TL7.0 software (GE). Fhit antibody was obtained from Millipore (Cat #07–172). Bach1 (Cat #sc-14700), Nrf2 (Cat #sc-365949), and HRP conjugated donkey-anti-goat (Cat #sc-2020) antibodies were purchased from Santa Cruz Biotechnology. Hmox1 (Cat #4643), β-tubulin (Cat #2128), Gapdh (Cat #5174), AKT (Cat #9272), phosphoAKT (Cat #4060), HRP-anti-mouse (Cat #7076), and HRP-anti-rabbit (Cat #7074) antibodies were purchased from Cell Signaling Technologies. β-actin (Cat #A2066) antibody was obtained from Sigma.
Treatment with inhibitors
Stock solutions of inhibitors were prepared in anyhydrous DMSO, aliquoted, and stored at −20° C. Compounds were diluted to working concentrations in KSFM immediately before use. The PI3K inhibitor LY294002 was purchased from Cell Signaling Technologies (Cat #9901). The IKK2 inhibitor SC-514 was purchased from Cayman Chemical (Cat #10010267). The cell permeable Ca2+ chelator BAPTA-AM was purchased from Invitrogen (Cat #B-6769).
DNA microarray
Microarray hybridizations were performed at the University of Iowa DNA Facility. Briefly, 50 ng total RNA was converted to single primer isothermal amplification (SPIA) cDNA using the WT-Ovation Pico RNA Amplification System, v1 (NuGEN Technologies, San Carlos, CA, Cat #3300) according to the manufacturer's protocol. The amplified cDNA product was purified through a QIAGEN MinElute Reaction Cleanup column (QIAGEN Cat #28204) according to modifications from NuGEN. DNA product (4.0 μg) was then used to generate sense target cDNA using the WT-Ovation Exon Module v1 (NuGEN Technologies, Cat #2000) and again cleaned up with the Qiagen column. Sense target cDNA product (5.0 μg) was fragmented (average fragment size = 85 bases) and biotin-labeled using the NuGEN FL-Ovation cDNA Biotin Module, v2 (NuGEN Technologies, Cat #4200) by the manufacturer's protocol. The biotin-labeled cDNA was mixed with Affymetrix eukaryotic hybridization buffer (Affymetrix, Inc., Santa Clara, CA) and hybridized to Affymetrix Human Gene 1.0 ST Arrays at 45°C for 18 h with 60 rpm rotation in an Affymetrix Model 640 Genechip Hybridization Oven. Following hybridization, the arrays were washed, stained with streptavidin-phycoerythrin (Molecular Probes, Inc., Eugene, OR) and with antistreptavidin antibody (Vector Laboratories, Inc., Burlingame, CA) using the Affymetrix Model 450 Fluidics Station. Arrays were scanned with the Affymetrix Model 3000 scanner (7 G upgrade) and data were collected using the GeneChip operating software v 1.4.
Microarray data analysis
The array data were analyzed for significant changes in expression using Partek Genomics Suite Software (Partek, Inc.). Three biological replicates for each treatment were processed and analyzed. Briefly, the expression value estimates generated by microarray scanners were normalized using the robust multi-array averaging algorithm. Analysis of variation followed by multiple testing correction using the false-discovery rate was used to assess significant changes in expression profile between samples. Expression data for siControl +/− CSE were analyzed with Ingenuity Pathway Analysis (IPA, Ingenuity Systems, www.ingenuity.com). The IPA Canonical Pathways Analysis tool was used to identify the pathways from the IPA Library of Canonical Pathways that were most significant in the data. A dataset containing gene identifiers with expression fold change and associated p-value was uploaded to the application. The data were then limited to fold change +/− 1.5 and p-value ≤0.05. A core analysis was performed to identify gene function and a canonical pathway analysis was used to identify the pathways to which the genes mapped. Significance is measured within IPA by 2 means: 1.) Determination of a ratio calculated by dividing the number of differentially expressed genes that map to a particular pathway by the total number of genes in that pathway; 2.) Calculation of a p-value by Fisher's exact test to determine the probability that the association between the genes in the data set and the canonical pathway can be explained by chance.
Funding Statement
Work was supported by National Cancer Institute grant CA075954 to CB. The DNA Facility is supported by the Holden Comprehensive Cancer Center (P30CA086862).
Disclosure of Potential Conflicts of Interest
No potential conflicts of interest were disclosed.
Acknowledgments
The authors thank Drs. Kevin Knudson and Thomas Bair in the Iowa Institute of Human Genetics Genomics Division for assistance with performing and analyzing microarrays.
Supplemental Materials
Supplemental data for this article can be accessed on the publisher's website.
References
- 1. Zanesi N, Fidanza V, Fong LY, Mancini R, Druck T, Valtieri M, Rüdiger T, McCue PA, Croce CM, Huebner K. The tumor spectrum in FHIT-deficient mice. Proc Natl Acad Sci USA 2001; 98:10250-5; PMID:11517343; http://dx.doi.org/ 10.1073/pnas.191345898 [DOI] [PMC free article] [PubMed] [Google Scholar]
- 2. Ohta M, Inoue H, Cotticelli MG, Kastury K, Baffa R, Palazzo J, Siprashvili Z, Mori M, McCue P, Druck T, et al. The FHIT gene, spanning the chromosome 3p14.2 fragile site and renal carcinoma-associated t(3;8) breakpoint, is abnormal in digestive tract cancers. Cell 1996; 84:587-97; PMID:8598045; http://dx.doi.org/ 10.1016/S0092-8674(00)81034-X [DOI] [PubMed] [Google Scholar]
- 3. Dumon KR, Ishii H, Fong LY, Zanesi N, Fidanza V, Mancini R, Vecchione A, Baffa R, Trapasso F, During MJ, et al. FHIT gene therapy prevents tumor development in Fhit-deficient mice. Proc Natl Acad Sci USA 2001; 98:3346-51; PMID:11248081; http://dx.doi.org/ 10.1073/pnas.061020098 [DOI] [PMC free article] [PubMed] [Google Scholar]
- 4. Trapasso F, Krakowiak A, Cesari R, Arkles J, Yendamuri S, Ishii H, Vecchione A, Kuroki T, Bieganowski P, Pace HC, et al. Designed FHIT alleles establish that Fhit-induced apoptosis in cancer cells is limited by substrate binding. Proc Natl Acad Sci USA 2003; 100:1592-7; PMID:12574506; http://dx.doi.org/ 10.1073/pnas.0437915100 [DOI] [PMC free article] [PubMed] [Google Scholar]
- 5. Sozzi G, Tornielli S, Tagliabue E, Sard L, Pezzella F, Pastorino U, Minoletti F, Pilotti S, Ratcliffe C, Veronese ML, et al. Absence of Fhit protein in primary lung tumors and cell lines with FHIT gene abnormalities. Cancer Res 1997; 57(23):5207-12; PMID:9393735.12649173 [PubMed] [Google Scholar]
- 6. Sevignani C, Calin GA, Cesari R, Sarti M, Ishii H, Yendamuri S, Vecchione A, Trapasso F, Croce CM. Restoration of fragile histidine triad (FHIT) expression induces apoptosis and suppresses tumorigenicity in breast cancer cell lines. Cancer Res 2003; 63:1183-7; PMID:12649173 [PubMed] [Google Scholar]
- 7. Gemma A, Hagiwara K, Ke Y, Burke LM, Khan MA, Nagashima M, Bennett WP, Harris CC. FHIT mutations in human primary gastric cancer. Cancer Res 1997; 57:1435-7; PMID:9108441 [PubMed] [Google Scholar]
- 8. Petursdottir TE, Hafsteinsdottir SH, Jonasson JG, Moller PH, Thorsteinsdottir U, Huiping C, Egilsson V, Ingvarsson S. Loss of heterozygosity at the FHIT gene in different solid human tumours and its association with survival in colorectal cancer patients. Anticancer Res 2002; 22:3205-12; PMID:12530066 [PubMed] [Google Scholar]
- 9. Kowara R, Golebiowski F, Chrzan P, Skokowski J, Karmolinski A, Pawelczyk T. Abnormal FHIT gene transcript and c-myc and c-erbB2 amplification in breast cancer. Acta Biochim Pol 2002; 49:341-50; PMID:12362975 [PubMed] [Google Scholar]
- 10. Gao G, Kasperbauer JL, Tombers NM, Wang V, Mayer K, Smith DI. A selected group of large common fragile site genes have decreased expression in oropharyngeal squamous cell carcinomas. Gene Chromosomes Canc 2014; 53:392-401; PMID: 24481768; http://dx.doi.org/ 10.1002/gcc.22150 [DOI] [PubMed] [Google Scholar]
- 11. McAvoy S, Ganapathiraju SC, Ducharme-Smith AL, Pritchett JR, Kosari F, Perez DS, Zhu Y, James CD, Smith DI. Non-random inactivation of large common fragile site genes in different cancers. Cytogenet Genome Res 2007; 118:260-9; PMID:18000379; http://dx.doi.org/ 10.1159/000108309 [DOI] [PubMed] [Google Scholar]
- 12. Hanahan D, Weinberg RA. Hallmarks of Cancer: The Next Generation. Cell [Internet] 2011; 144:646-74. Available from: http://linkinghub.elsevier.com/retrieve/pii/S0092867411001279 [DOI] [PubMed] [Google Scholar]
- 13. Stein CK, Glover TW, Palmer JL, Glisson BS. Direct correlation between FRA3B expression and cigarette smoking. Gene Chromosomes Canc 2002; 34:333-40; PMID:12007194; http://dx.doi.org/ 10.1002/gcc.10061 [DOI] [PubMed] [Google Scholar]
- 14. Hanahan D, Weinberg RA. The hallmarks of cancer. Cell 2000; 100:57-70; PMID:10647931; http://dx.doi.org/ 10.1016/S0092-8674(00)81683-9 [DOI] [PubMed] [Google Scholar]
- 15. D'Agostini F. Early Loss of Fhit in the Respiratory Tract of Rodents Exposed to Environmental Cigarette Smoke. Cancer Res 2006; 66:3936-41; PMID:16585223; http://dx.doi.org/ 10.1158/0008-5472.CAN-05-3666 [DOI] [PubMed] [Google Scholar]
- 16. Kim JS. Aberrant methylation of the FHIT gene in chronic smokers with early stage squamous cell carcinoma of the lung. Carcinogenesis 2004; 25:2165-71; PMID:15231689; http://dx.doi.org/ 10.1093/carcin/bgh217 [DOI] [PubMed] [Google Scholar]
- 17. Sozzi G, Sard L, De Gregorio L, Marchetti A, Musso K, Buttitta F, Tornielli S, Pellegrini S, Veronese ML, Manenti G, et al. Association between cigarette smoking and FHIT gene alterations in lung cancer. Cancer Res 1997; 57:2121-3; PMID:9187107 [PubMed] [Google Scholar]
- 18. Sozzi G, Pastorino U, Moiraghi L, Tagliabue E, Pezzella F, Ghirelli C, Tornielli S, Sard L, Huebner K, Pierotti MA. Loss of FHIT function in lung cancer and preinvasive bronchial lesions. Cancer Res 1998; 58:5032-7; PMID:9823304 [PubMed] [Google Scholar]
- 19. Ferrandiz ML, Devesa I. Inducers of heme oxygenase-1. Curr pharm design 2008; 14:473-86; PMID: 18289074; http://dx.doi.org/ 10.2174/138161208783597399 [DOI] [PubMed] [Google Scholar]
- 20. Gozzelino R, Jeney V, Soares MP. Mechanisms of Cell Protection by Heme Oxygenase-1. Annu Rev Pharmacol Toxicol 2010; 50:323-54; PMID: 20055707; http://dx.doi.org/ 10.1146/annurev.pharmtox.010909.105600 [DOI] [PubMed] [Google Scholar]
- 21. Joannes A, Grelet S, Duca L, Gilles C, Kileztky C, Dalstein V, Birembaut P, Polette M, Nawrocki-Raby B. Fhit Regulates EMT Targets through an EGFR/Src/ERK/Slug Signaling Axis in Human Bronchial Cells. Mol Cancer Res 2014; 12(5):775-83; PMID:24464917; http://dx.doi.org/ 10.1158/1541-7786.MCR-13-0386-T [DOI] [PubMed] [Google Scholar]
- 22. Joannes A, Bonnomet A, Bindels S, Polette M, Gilles C, Burlet H, Cutrona J, Zahm J-M, Birembaut P, Nawrocki-Raby B. Fhit regulates invasion of lung tumor cells. Oncogene 2009; 29:1203-13; PMID: 19935706; http://dx.doi.org/ 10.1038/onc.2009.418 [DOI] [PubMed] [Google Scholar]
- 23. Saldivar JC, Miuma S, Bene J, Hosseini SA, Shibata H, Sun J, Wheeler LJ, Mathews CK, Huebner K. Initiation of Genome Instability and Preneoplastic Processes through Loss of Fhit Expression. PLoS Genet 2012; 8:e1003077; PMID:23209436; http://dx.doi.org/ 10.1371/journal.pgen.1003077 [DOI] [PMC free article] [PubMed] [Google Scholar]
- 24. Saldivar JC, Bene J, Hosseini SA, Miuma S, Horton S, Heerema NA, Huebner K. Characterization of the role of Fhit in suppression of DNA damage. AdvBiol Regulation 2013; 53:77-85; PMID:23102829; http://dx.doi.org/ 10.1016/j.jbior.2012.10.003 [DOI] [PMC free article] [PubMed] [Google Scholar]
- 25. Miuma S, Saldivar JC, Karras JR, Waters CE, Paisie CA, Wang Y, Jin V, Sun J, Druck T, Zhang J, et al. Fhit deficiency-induced global genome instability promotes mutation and clonal expansion. PLoS ONE 2013; 8:e80730-0; PMID:24244712; http://dx.doi.org/ 10.1371/journal.pone.0080730 [DOI] [PMC free article] [PubMed] [Google Scholar]
- 26. Trapasso F, Pichiorri F, Gaspari M, Palumbo T, Aqeilan RI, Gaudio E, Okumura H, Iuliano R, Di Leva G, Fabbri M. Fhit interaction with ferredoxin reductase triggers generation of reactive oxygen species and apoptosis of cancer cells. J Biol Chem 2008; 283:13736-44; PMID:18319262; http://dx.doi.org/ 10.1074/jbc.M709062200 [DOI] [PMC free article] [PubMed] [Google Scholar] [Retracted]
- 27. Pichiorri F, Okumura H, Nakamura T, Garrison PN, Gasparini P, Suh S-S, Druck T, McCorkell KA, Barnes LD, Croce CM. Correlation of fragile histidine triad (Fhit) protein structural features with effector interactions and biological functions. J Biol Chem 2009; 284:1040-9; PMID:19004824; http://dx.doi.org/ 10.1074/jbc.M806638200 [DOI] [PMC free article] [PubMed] [Google Scholar]
- 28. Hori R. Gene Transfection of H25A Mutant Heme Oxygenase-1 Protects Cells against Hydroperoxide-induced Cytotoxicity. J Biol Chem 2002; 277:10712-8; PMID:11786534; http://dx.doi.org/ 10.1074/jbc.M107749200 [DOI] [PubMed] [Google Scholar]
- 29. Clark JE, Green CJ, Motterlini R. Involvement of the heme oxygenase-carbon monoxide pathway in keratinocyte proliferation. Biochem Bioph Res Co 1997; 241:215-20; PMID:9425252; http://dx.doi.org/ 10.1006/bbrc.1997.7742 [DOI] [PubMed] [Google Scholar]
- 30. Seldon MP, Silva G, Pejanovic N, Larsen R, Gregoire IP, Filipe J, Anrather J, Soares MP. Heme oxygenase-1 inhibits the expression of adhesion molecules associated with endothelial cell activation via inhibition of NF-kappaB RelA phosphorylation at serine 276. J Immunol 2007; 179:7840-51; PMID:18025230; http://dx.doi.org/ 10.4049/jimmunol.179.11.7840 [DOI] [PubMed] [Google Scholar]
- 31. Jozkowicz A, Huk I, Nigisch A, Weigel G, Dietrich W, Motterlini R, Dulak J. Heme oxygenase and angiogenic activity of endothelial cells: stimulation by carbon monoxide and inhibition by tin protoporphyrin-IX. Antioxid Redox Signal 2003; 5:155-62; PMID:12716475; http://dx.doi.org/ 10.1089/152308603764816514 [DOI] [PubMed] [Google Scholar]
- 32. Nowis D, Legat M, Grzela T, Niderla J, Wilczek E, Wilczynski GM, Głodkowska E, Mrówka P, Issat T, Dulak J, et al. Heme oxygenase-1 protects tumor cells against photodynamic therapy-mediated cytotoxicity. Oncogene 2006; 25:3365-74; PMID: 16462769; http://dx.doi.org/ 10.1038/sj.onc.1209378 [DOI] [PMC free article] [PubMed] [Google Scholar]
- 33. Jozkowicz A, Was H, Dulak J. Heme Oxygenase-1 in Tumors: Is It a False Friend? Antioxid Redox Signal 2007; 9:2099-118; PMID:17822372; http://dx.doi.org/ 10.1089/ars.2007.1659 [DOI] [PMC free article] [PubMed] [Google Scholar]
- 34. Nyunoya T, Monick MM, Klingelhutz A, Yarovinsky TO, Cagley JR, Hunninghake GW. Cigarette Smoke Induces Cellular Senescence. Am J Resp Cell Mol Biol 2006; 35:681-8; PMID:16840774; http://dx.doi.org/ 10.1165/rcmb.2006-0169OC [DOI] [PMC free article] [PubMed] [Google Scholar]
- 35. Ramirez RD, Sheridan S, Girard L, Sato M, Kim Y, Pollack J, Peyton M, Zou Y, Kurie JM, Dimaio JM, et al. Immortalization of human bronchial epithelial cells in the absence of viral oncoproteins. Cancer Res 2004; 64:9027-34; PMID:15604268; http://dx.doi.org/ 10.1158/0008-5472.CAN-04-3703 [DOI] [PubMed] [Google Scholar]
- 36. Sato M. Multiple Oncogenic Changes (K-RASV12, p53 Knockdown, Mutant EGFRs, p16 Bypass, Telomerase) Are Not Sufficient to Confer a Full Malignant Phenotype on Human Bronchial Epithelial Cells. Cancer Res 2006; 66:2116-28; PMID:16489012; http://dx.doi.org/ 10.1158/0008-5472.CAN-05-2521 [DOI] [PubMed] [Google Scholar]
- 37. Holschneider CH. The Fragile Histidine Triad Gene: A Molecular Link Between Cigarette Smoking and Cervical Cancer. Clin Cancer Res 2005; 11:5756-63; PMID:16115913; http://dx.doi.org/ 10.1158/1078-0432.CCR-05-0234 [DOI] [PubMed] [Google Scholar]
- 38. Tseng JE, Kemp BL, Khuri FR, Kurie JM, Lee JS, Zhou X, Liu D, Hong WK, Mao L. Loss of Fhit is frequent in stage I non-small cell lung cancer and in the lungs of chronic smokers. Cancer Res 1999; 59:4798-803; PMID:10519387 [PubMed] [Google Scholar]
- 39. Choi AM, Alam J. Heme oxygenase-1: function, regulation, and implication of a novel stress-inducible protein in oxidant-induced lung injury. Am J Resp Cell Mol Biol 1996; 15:9-19; PMID:8679227; http://dx.doi.org/ 10.1165/ajrcmb.15.1.8679227 [DOI] [PubMed] [Google Scholar]
- 40. Maines MD, Gibbs PEM. 30 some years of heme oxygenase: From a “molecular wrecking ball” to a ‘mesmerizing’ trigger of cellular events. Biochem Bioph Res Commun 2005; 338:568-77; PMID: 16183036; http://dx.doi.org/ 10.1016/j.bbrc.2005.08.121 [DOI] [PubMed] [Google Scholar]
- 41. Klingelhutz AJ, Qian Q, Phillips SL, Gourronc FA, Darbro BW, Patil SR. Amplification of the chromosome 20q region is associated with expression of HPV-16 E7 in human airway and anogenital epithelial cells. Virology 2005; 340:237-44; PMID: 16051300; http://dx.doi.org/ 10.1016/j.virol.2005.06.027 [DOI] [PMC free article] [PubMed] [Google Scholar]
- 42. Kiyono T, Foster SA, Koop JI, McDougall JK, Galloway DA, Klingelhutz AJ. Both Rb/p16INK4a inactivation and telomerase activity are required to immortalize human epithelial cells. Nature 1998; 396:84-8; PMID:9817205; http://dx.doi.org/ 10.1038/23962 [DOI] [PubMed] [Google Scholar]
- 43. Rimessi A, Marchi S, Fotino C, Romagnoli A, Huebner K, Croce CM, Pinton P, Rizzuto R. Intramitochondrial calcium regulation by the FHIT gene product sensitizes to apoptosis. Proc Nat Acad Sci 2009; 106:12753-8; MPID:19622739; http://dx.doi.org/ 10.1073/pnas.0906484106 [DOI] [PMC free article] [PubMed] [Google Scholar]
- 44. Nakagawa Y, Akao Y. Fhit protein inhibits cell growth by attenuating the signaling mediated by nuclear factor-κB in colon cancer cell lines. Exp Cell Res 2006; 312:2433-42; PMID:16733051; http://dx.doi.org/ 10.1016/j.yexcr.2006.04.004 [DOI] [PubMed] [Google Scholar]
- 45. Mir Mohammadrezaei F, Mohseni kouchesfehani H, Montazeri H, Gharghabi M, Ostad SN, Ghahremani MH. Signaling crosstalk of FHIT, CHK2 and p38 in etoposide induced growth inhibition in MCF-7 cells. Cell Signal 2013; 25:126-32; PMID:23000346; http://dx.doi.org/ 10.1016/j.cellsig.2012.09.019 [DOI] [PubMed] [Google Scholar]
- 46. Lau WKW, Chan SCH, Law ACK, Ip MSM, Mak JCW. The role of MAPK and Nrf2 pathways in ketanserin-elicited attenuation of cigarette smoke-induced IL-8 production in human bronchial epithelial cells. Toxicol Sci 2012; 125:569-77; PMID: 22048642; http://dx.doi.org/ 10.1093/toxsci/kfr305 [DOI] [PubMed] [Google Scholar]
- 47. Maunders H, Patwardhan S, Phillips J, Clack A, Richter A. Human bronchial epithelial cell transcriptome: gene expression changes following acute exposure to whole cigarette smoke in vitro. AJP: Lung Cell Mol Phys 2007; 292:L1248-56; PMID:22048642; http://dx.doi.org/20015843 10.1152/ajplung.00290.2006 [DOI] [PubMed] [Google Scholar]
- 48. Pickett G, Seagrave J, Boggs S, Polzin G, Richter P, Tesfaigzi Y. Effects of 10 cigarette smoke condensates on primary human airway epithelial cells by comparative gene and cytokine expression studies. Toxicol Sci 2010; 114:79-89; PMID:20015843; http://dx.doi.org/ 10.1093/toxsci/kfp298 [DOI] [PMC free article] [PubMed] [Google Scholar]
- 49. Gümüş ZH, Du B, Kacker A, Boyle JO, Bocker JM, Mukherjee P, Subbaramaiah K, Dannenberg AJ, Weinstein H. Effects of tobacco smoke on gene expression and cellular pathways in a cellular model of oral leukoplakia. Cancer Prevention Res 2008; 1:100-11; PMID:19138943; http://dx.doi.org/ 10.1158/1940-6207.CAPR-08-0007 [DOI] [PMC free article] [PubMed] [Google Scholar]
- 50. Baglole CJ, Maggirwar SB, Gasiewicz TA, Thatcher TH, Phipps RP, Sime PJ. The aryl hydrocarbon receptor attenuates tobacco smoke-induced cyclooxygenase-2 and prostaglandin production in lung fibroblasts through regulation of the NF-kappaB family member RelB. J Biol Chem 2008; 283:28944-57; PMID:18697742; http://dx.doi.org/ 10.1074/jbc.M800685200 [DOI] [PMC free article] [PubMed] [Google Scholar]
- 51. Jorquera G, Juretic N, Jaimovich E, Riveros N. Membrane depolarization induces calcium-dependent upregulation of Hsp70 and Hmox-1 in skeletal muscle cells. AJP: Cell Phys 2009; 297:C581-90. [DOI] [PubMed] [Google Scholar]
- 52. Alam J, Cook JL. How Many Transcription Factors Does It Take to Turn On the Heme Oxygenase-1 Gene? Am J Resp Cell Mol Biol 2006; 36:166-74; PMID:16990612; http://dx.doi.org/ 10.1165/rcmb.2006-0340TR [DOI] [PubMed] [Google Scholar]
- 53. Zhang X, Bedard EL, Potter R, Zhong R, Alam J, Choi AMK, Lee PJ. Mitogen-activated protein kinases regulate HO-1 gene transcription after ischemia-reperfusion lung injury. Am J Physiol Lung Cell Mol Physiol 2002; 283:L815-29; PMID:12225959; http://dx.doi.org/ 10.1152/ajplung.00485.2001 [DOI] [PubMed] [Google Scholar]
- 54. Sun J, Hoshino H, Takaku K, Nakajima O, Muto A, Suzuki H, Tashiro S, Takahashi S, Shibahara S, Alam J, et al. Hemoprotein Bach1 regulates enhancer availability of heme oxygenase-1 gene. EMBO J 2002; 21:5216-24; PMID:12356737; http://dx.doi.org/ 10.1093/emboj/cdf516 [DOI] [PMC free article] [PubMed] [Google Scholar]
- 55. Reichard JF, Motz GT, Puga A. Heme oxygenase-1 induction by NRF2 requires inactivation of the transcriptional repressor BACH1. Nucleic Acids Res 2007; 35:7074-86; PMID:17942419; http://dx.doi.org/ 10.1093/nar/gkm638 [DOI] [PMC free article] [PubMed] [Google Scholar]
- 56. Loboda A, Was H, Jozkowicz A, Dulak J. Janus face of Nrf2-HO-1 axis in cancer–friend in chemoprevention, foe in anticancer therapy. Lung Cancer (Amsterdam, Netherlands) 2008; 60:1; PMID:18063196; http://dx.doi.org/ 10.1016/j.lungcan.2007.10.024 [DOI] [PubMed] [Google Scholar]
- 57. Zenke-Kawasaki Y, Dohi Y, Katoh Y, Ikura T, Ikura M, Asahara T, Tokunaga F, Iwai K, Igarashi K. Heme Induces Ubiquitination and Degradation of the Transcription Factor Bach1. Mol Cell Biol 2007; 27:6962-71; PMID:17682061; http://dx.doi.org/ 10.1128/MCB.02415-06 [DOI] [PMC free article] [PubMed] [Google Scholar]
- 58. Draganescu A, Hodawadekar SC, Gee KR, Brenner C. Fhit-nucleotide specificity probed with novel fluorescent and fluorogenic substrates. J Biol Chem 2000; 275:4555-60; PMID:10671479; http://dx.doi.org/ 10.1074/jbc.275.7.4555 [DOI] [PMC free article] [PubMed] [Google Scholar]
- 59. Brenner C, Pace HC, Garrison PN, Robinson AK, Rosler A, Liu XH, Blackburn GM, Croce CM, Huebner K, Barnes LD. Purification and crystallization of complexes modeling the active state of the fragile histidine triad protein. Protein Eng 1997; 10:1461-3; PMID:9543008; http://dx.doi.org/ 10.1093/protein/10.12.1461 [DOI] [PMC free article] [PubMed] [Google Scholar]
- 60. Pace HC, Garrison PN, Robinson AK, Barnes LD, Draganescu A, Rosler A, Blackburn GM, Siprashvili Z, Croce CM, Huebner K, et al. Genetic, biochemical, and crystallographic characterization of Fhit-substrate complexes as the active signaling form of Fhit. Proc Natl Acad Sci USA 1998; 95:5484-9; PMID:9576908; http://dx.doi.org/16547961 10.1073/pnas95.10.5484 [DOI] [PMC free article] [PubMed] [Google Scholar]
- 61. Campiglio M, Bianchi F, Andriani F, Sozzi G, Tagliabue E, Ménard S, Roz L. Diadenosines as FHIT-ness instructors. J Cell Physiol 2006; 208:274-81; PMID:16547961; http://dx.doi.org/ 10.1002/jcp.20633 [DOI] [PubMed] [Google Scholar]
- 62. Fisher DI, McLennan AG. Correlation of intracellular diadenosine triphosphate (Ap3A) with apoptosis in Fhit-positive HEK293 cells. Cancer Lett 2008; 259:186-91; PMID:18006149; http://dx.doi.org/ 10.1016/j.canlet.2007.10.007 [DOI] [PubMed] [Google Scholar]
- 63. Jovanovic A, Alekseev AE, Terzic A. Intracellular diadenosine polyphosphates: a novel family of inhibitory ligands of the ATP-sensitive K+ channel. Biochem Pharmacol 1997; 54:219-25; PMID:9271325; http://dx.doi.org/ 10.1016/S0006-2952(97)00262-1 [DOI] [PubMed] [Google Scholar]
- 64. Brevet A, Plateau P, Best-Belpomme M, Blanquet S. Variation of Ap4A and other dinucleoside polyphosphates in stressed Drosophila cells. J Biol Chem 1985; 260:15566-70; PMID:4066685 [PubMed] [Google Scholar]
- 65. Bochner BR, Lee PC, Wilson SW, Cutler CW, Ames BN. AppppA and related adenylylated nucleotides are synthesized as a consequence of oxidation stress. Cell 1984; 37:225-32; PMID:6373012; http://dx.doi.org/ 10.1016/0092-8674(84)90318-0 [DOI] [PubMed] [Google Scholar]
- 66. Brenner C, Bieganowski P, Pace HC, Huebner K. The histidine triad superfamily of nucleotide-binding proteins. J Cell Physiol 1999; 181:179-87; PMID:10497298; http://dx.doi.org/ 10.1002/(SICI)1097-4652(199911)181:2%3c179::AID-JCP1%3e3.0.CO;2-8 [DOI] [PMC free article] [PubMed] [Google Scholar]
- 67. Brenner C. Hint, Fhit, and GalT: function, structure, evolution, and mechanism of three branches of the histidine triad superfamily of nucleotide hydrolases and transferases. Biochemistry 2002; 41:9003-14; PMID:12119013; http://dx.doi.org/ 10.1021/bi025942q [DOI] [PMC free article] [PubMed] [Google Scholar]
- 68. McLennan AG, Barnes LD, Blackburn GM, Brenner C, Guranowski A, Miller AD, Rovira JM, Rotllán P, Soria B, Tanner JA. Recent progress in the study of the intracellular functions of diadenosine polyphosphates. Drug develop res 2001; 52:249-59; http://dx.doi.org/ 10.1002/ddr.1122 [DOI] [Google Scholar]
- 69. Ishii H, Mimori K, Ishikawa K, Okumura H, Pichiorri F, Druck T, Inoue H, Vecchione A, Saito T, Mori M, et al. Fhit-Deficient Hematopoietic Stem Cells Survive Hydroquinone Exposure Carrying Precancerous Changes. Cancer Res 2008; 68:3662-70; PMID:18483248; http://dx.doi.org/ 10.1158/0008-5472.CAN-07-5687 [DOI] [PubMed] [Google Scholar]
- 70. Ottey M, Han S-Y, Druck T, Barnoski BL, McCorkell KA, Croce CM, Raventos-Suarez C, Fairchild CR, Wang Y, Huebner K. Fhit-deficient normal and cancer cells are mitomycin C and UVC resistant. Br J Cancer 2004; 91(9):1669-77; PMID:15494723;http://dx.doi.org/ 10.1038/sj.bjc.6602058 [DOI] [PMC free article] [PubMed] [Google Scholar]
- 71. Andriani F, Perego P, Carenini N, Sozzi G, Roz L. Increased Sensitivity to Cisplatin in Non–Small Cell Lung Cancer Cell Lines after FHIT Gene Transfer. NEO 2006; 8:9-17; PMID:16533421; http://dx.doi.org/3103215 10.1593/neo.05517 [DOI] [PMC free article] [PubMed] [Google Scholar]
- 72. Tomasz M, Lipman R, Chowdary D, Pawlak J, Verdine GL, Nakanishi K. Isolation and structure of a covalent cross-link adduct between mitomycin C and DNA. Science 1987; 235:1204-8; PMID:3103215; http://dx.doi.org/ 10.1126/science.3103215 [DOI] [PubMed] [Google Scholar]
- 73. Pommier Y. Eukaryotic DNA topoisomerase I: genome gatekeeper and its intruders, camptothecins. Semin oncol 1996; 23(1 Suppl 3):3-10; PMID:8633251 [PubMed] [Google Scholar]
- 74. Siddik ZH. Cisplatin: mode of cytotoxic action and molecular basis of resistance. Oncogene 2003; 22:7265-79; PMID:14576837; http://dx.doi.org/ 10.1038/sj.onc.1206933 [DOI] [PubMed] [Google Scholar]
- 75. Berndtsson M, Hägg M, Panaretakis T, Havelka AM, Shoshan MC, Linder S. Acute apoptosis by cisplatin requires induction of reactive oxygen species but is not associated with damage to nuclear DNA. Int J Cancer 2006; 120:175-80; PMID:17044026; http://dx.doi.org/20501808 10.1002/ijc.22132 [DOI] [PubMed] [Google Scholar]
- 76. Park JY, Seo YR. Enhancement of mitomycin C-induced apoptosis in Nrf2-deficient human colon cancer cells. Mol Cell Toxicol 2010; 6:51-6; http://dx.doi.org/ 10.1007/s13273-010-0007-4 [DOI] [Google Scholar]
- 77. Wang Y, Gray JP, Mishin V, Heck DE, Laskin DL, Laskin JD. Distinct Roles of Cytochrome P450 Reductase in Mitomycin c Redox Cycling and Cytotoxicity. Mol Cancer Therap 2010; 9:1852-63; PMID:20501808; http://dx.doi.org/ 10.1158/1535-7163.MCT-09-1098 [DOI] [PMC free article] [PubMed] [Google Scholar]
- 78. Komiyama T, Kikuchi T, Sugiura Y. Generation of hydroxyl radical by anticancer quinone drugs, carbazilquinone, mitomycin C, aclacinomycin A and adriamycin, in the presence of NADPH-cytochrome P-450 reductase. Biochem Pharmacol 1982; 31:3651-6; PMID:6295407; http://dx.doi.org/ 10.1016/0006-2952(82)90590-1 [DOI] [PubMed] [Google Scholar]
- 79. Li Y, Rory Goodwin C, Sang Y, Rosen EM, Laterra J, Xia S. Camptothecin and Fas receptor agonists synergistically induce medulloblastoma cell death: ROS-dependent mechanisms. Anticancer Drugs 2009; 20:770-8; PMID:19633536; http://dx.doi.org/ 10.1097/CAD.0b013e32832fe472 [DOI] [PubMed] [Google Scholar]