

Abstract
Proteins of the major histocompatibility complex class I (MHCI) negatively regulate synapse density in the developing vertebrate brain (Glynn et al., 2011; Elmer et al., 2013; Lee et al., 2014), but the underlying mechanisms remain largely unknown. Here we identify a novel MHCI signaling pathway that involves the inhibition of a known synapse-promoting factor, the insulin receptor. Dominant-negative insulin receptor constructs decrease synapse density in the developing Xenopus visual system (Chiu et al., 2008), and insulin receptor activation increases dendritic spine density in mouse hippocampal neurons in vitro (Lee et al., 2011). We find that genetically reducing cell surface MHCI levels increases synapse density selectively in regions of the hippocampus where insulin receptors are expressed, and occludes the neuronal insulin response by de-repressing insulin receptor signaling. Pharmacologically inhibiting insulin receptor signaling in MHCI-deficient animals rescues synapse density, identifying insulin receptor signaling as a critical mediator of the tonic inhibitory effects of endogenous MHCI on synapse number. Insulin receptors co-immunoprecipitate MHCI from hippocampal lysates, and MHCI unmasks a cytoplasmic epitope of the insulin receptor that mediates downstream signaling. These results identify an important role for an MHCI–insulin receptor signaling pathway in circuit patterning in the developing brain, and suggest that changes in MHCI expression could unexpectedly regulate neuronal insulin sensitivity in the aging and diseased brain.
Introduction
Major histocompatibility complex class I (MHCI) proteins are known for their immune roles (Neefjes and Momburg, 1993; Rammensee et al., 1993) and have additional functions in the healthy nervous system. MHCI is expressed by neurons in the developing and adult brain, and is present at synapses (Corriveau et al., 1998; Lidman et al., 1999; Huh et al., 2000; Goddard et al., 2007; Needleman et al., 2010; Ribic et al., 2011; Chacon and Boulanger, 2013). Several lines of evidence suggest that MHCI regulates the number and location of synaptic connections. MHCI is required for the elimination of developing retinogeniculate synapses (Huh et al., 2000; Datwani et al., 2009; Lee et al., 2014), limits cortical ocular dominance plasticity (Datwani et al., 2009), and negatively regulates synapse density in cortical neurons (Glynn et al., 2011; Elmer et al., 2013).
A critical step toward understanding how MHCI controls neuronal connectivity is to identify the molecular mediators of neuronal MHCI signaling. Several immunoreceptors for MHCI have been detected in the brain (Syken and Shatz, 2003; Bryceson et al., 2005; Syken et al., 2006; Zohar et al., 2008), and at least one, paired Ig-like receptor B (PirB), can bind to neuronal MHCI. However, mice expressing a dominant-negative form of PirB, unlike MHCI-deficient mice, have normal retinogeniculate synapse elimination (Syken et al., 2006), indicating that MHCI uses other signaling pathways to regulate connectivity in the developing nervous system.
Dozens of proteins can form macromolecular complexes with MHCI (Ojcius et al., 2002). In liver cells and other non-neuronal cell types, MHCI can regulate signaling and glucose uptake mediated by the insulin receptor (Chvatchko et al., 1983; Due et al., 1986; Edidin and Reiland, 1990; Liegler et al., 1991). In neurons, glucose uptake is thought to be largely insulin independent (Tomlinson and Gardiner, 2008). Instead, insulin signaling in neurons has been implicated in the regulation of learning and memory, synaptic plasticity, glutamate receptor trafficking, neurite growth, and synapse density (Wan et al., 1997; Zhao et al., 1999; Brüning et al., 2000; Man et al., 2000; Tomioka et al., 2006; Chiu et al., 2008; Lee et al., 2011). Insulin receptors are enriched at the postsynaptic density in acutely dissociated hippocampal neurons (Abbott et al., 1999). Current studies support a model in which insulin receptor signaling increases synapse density. Insulin treatment increases dendritic spine density in neonatal mouse hippocampal neurons in vitro (Lee et al., 2011), while dominant-negative insulin receptor constructs reduce synapse density in the developing Xenopus visual system (Chiu et al., 2008).
Here we show that MHCI limits synapse density in the hippocampus by inhibiting insulin receptor signaling. Insulin receptor signaling is tonically activated in MHCI-deficient mice, and inhibiting insulin receptor signaling rescues synapse number in these transgenic mice, suggesting that loss of MHCI relieves a tonic brake on insulin receptor signaling to increase synapse density. MHCI forms a macromolecular complex with the insulin receptor, and unmasks an epitope of the insulin receptor that mediates downstream signaling. These studies identify insulin receptor signaling as a new pathway by which MHCI regulates synapse density.
Materials and Methods
Animals.
Animal work was performed in accordance with the University of California, San Diego, and Princeton University Institutional Animal Care and Use Committees. Wild-type (WT) C57BL/6 mice, and actin-GFP, β2m−/−TAP−/−, and Kb−/−Db−/− mice, all on a C57BL/6 background and backcrossed to WT more than eight times, were used. All mice were male, age postnatal day 30 (P30) to P32, unless otherwise specified. To reduce cell surface expression of most of the >50 MHCI proteins found in the mouse, we used β2m−/−TAP−/− animals. These mice lack two key components of the MHCI expression pathway: β2-microglobulin (β2m), an invariant light chain of the MHCI complex; and the transporter associated with antigen processing 1 (TAP1), an endoplasmic reticulum-expressed transporter required to load antigenic peptides onto MHCI. Double-mutant β2m−/−TAP−/− mice lack stable cell surface expression of most MHCI proteins, and have been used extensively to study the immunological functions of MHCI (Zijlstra et al., 1989; Van Kaer et al., 1992; Ljunggren et al., 1995). Kb−/−Db−/− mice lack expression of the two classic MHCI genes in C57BL/6 mice, H2-K and H2-D (Vugmeyster et al., 1998; Schott et al., 2003). WT actin-GFP mice express the GFP transgene under the control of the β-actin promoter (Okabe et al., 1997). Neuron-specific insulin receptor knock-out (NIRKO) mice lack insulin receptor expression in nestin-expressing cells (Brüning et al., 2000), which includes most cell types in the mature brain. Transgenic mice were compared with strain-matched controls by experimenters blind to genotype.
Immunostaining.
For immunohistochemistry, mice were anesthetized to a surgical plane of consciousness with isoflurane and perfused with 1× PBS at 37°C, followed by 4% PFA at room temperature (RT). Brains were dissected out, post-fixed in PFA, and cryoprotected overnight (O/N) in 10–30% sucrose (Sigma). Brains were frozen at −20°C in OCT and cryostat sectioned (20 μm). Sections were mounted on Superfrost Plus Slides (Fisher Scientific), allowed to air dry 2 h, and then washed and blocked in 3% BSA plus 0.3% Triton X-100. Slides were incubated O/N at 4°C in the following primary antibodies: insulin receptor β (C19, 2 μg/ml, Santa Cruz Biotechnology; RTK, 611276, 5 μg/ml, BD Transduction Laboratories); MAP2 (MAB378, 1 μg/ml, Millipore Bioscience Research Reagents); TAU (MAB3420, 1 μg/ml, Millipore Bioscience Research Reagents); MHCI (OX18, MCA51R, 10 μg/ml, Serotec; no Triton X-100 used); calbindin (D-28K, C9848, 14 μg/ml, Sigma, block in 2% goat serum); or synaptophysin (SY38 1 μg/ml, Millipore Bioscience Research Reagents). Isotype-matched Ig (R&D Systems) was used in the same quantity as the primary antibody as a negative control. After washes, slides were incubated in secondary antibody (Alexa Fluor 488 or 568 IgG, 2 μg/ml, Invitrogen) for 2 h at RT in the dark. Following washes and 3 h of air drying, slides were coverslipped using Gel Mount (Sigma).
For antigen retrieval, brain sections were incubated in urea buffer (100 mm Tris, 5% w/v urea, pH 9.5) for 4 min at 95°C before blocking, washed in PBS, and then processed for immunostaining as above.
For immunocytochemistry, neurons [16–20 d in vitro (DIV)] were fixed in 4% PFA/4% sucrose for 15 min followed by quenching in 100 mm glycine-PBS to block free aldehyde groups. Cells were blocked in 0.2% BSA plus 0.05% saponin (BSA-saponin-PBS) for 45 min at 37°C, then incubated for 45 min at RT in the following primary antibodies: insulin receptor β (C19, 2 g/mL; D17, 2 g/mL, Santa Cruz; or RTK, 611276, 5 g/mL, BD Transduction Labs), insulin receptor α (N20, 2 g/mL, Santa Cruz; saponin omitted for surface staining), Calbindin (D-28K, 74 g/mL), or GFP (ab6673, 0.3 g/mL, Abcam). Coverslips were washed, incubated in secondary antibody (Alexa Fluor 488 or 568 IgG, 2 μg/ml) for 45 min at RT, washed, and mounted on slides with Gel Mount.
All staining was visualized with fluorescence microscopy using an Olympus BX51W microscope. All within-experiment comparisons were made from samples prepared from mice of the same genotype, age, and sex; perfused on the same day; processed under the same conditions; mounted on the same slide; and visualized using the same settings. For double labeling, neurons were incubated in a cocktail of both antibodies.
Dissociated hippocampal cultures.
Low-density hippocampal cultures were prepared from newborn (P0) mice as previously described (Fourgeaud et al., 2010). Briefly, hippocampi were dissected out, dissociated with trypsin, and triturated. Neurons were plated at a density of ∼12,000 cells/cm2 on poly-l-lysine-coated coverslips. Arabinofuranosylcytosine (5 μm) was added at 6 DIV to limit glial proliferation. For cocultures, ∼6000 cells/cm2 each genotype were plated per coverslip. For β2m- or insulin-treated cultures, 16 DIV hippocampal cultures were treated with 10 μm recombinant β2m (catalog #M4890, Sigma) or 1.5 μm bovine insulin (catalog #I0516, Sigma) for 1 h or 30 min, respectively, in conditioned media.
Organotypic hippocampal slice cultures treated with rapamycin.
Organotypic hippocampal slice cultures were prepared from P7 WT and β2m−/−TAP−/− mouse pups. Mice were anesthetized, decapitated, and their hippocampi rapidly microdissected in ice-cold, oxygenated, low-sodium artificial CSF (ACSF; in mm: 1 CaCl2, 5 d-glucose, 2 KCl, 5 MgCl2, 13 NaHCO3, and 117 sucrose). Dissected hippocampi were transferred to the stage of a McIlwain tissue chopper (Stoelting) and sectioned into 400 μm slices. Slices were submerged in slice culture media (DMEM supplemented with 5% horse serum, 0.5 mg of human insulin, 0.001% ascorbic acid, 1 mm l-glutamine, 1 mm CaCl2, 2 mm MgSO4, 6 mm d-glucose, 2.6 mm NaHCO3, and 15 mm HEPES), and intact slices were selected for culturing. Slices were placed on Millicell Cell Culture Inserts (30 mm; hydrophilic polytetrafluoroethylene, 0.4 μm; Millipore) in a six-well plate and cultured for 1 week in slice culture media at 37°C in a 95%O2/5%CO2 incubator. Media contained either 0.2 μm rapamycin in DMSO or an equal volume of DMSO alone (vehicle control).
Acute hippocampal slice preparations treated with insulin.
Coronal brain slices (350 μm thick) were cut in ACSF [containing the following (in mm): 117 NaCl, 4.7 KCl, 25 NaHCO3, 1.2 NaH2PO4, 11 Dextrose, 2.5 CaCl2, 1.2 MgCl2] and were allowed to recover for 30 min in oxygenated ACSF at 31°C, followed by 30 min at RT. Subsets of these preparations were routinely used for electrophysiological recordings in other studies, allowing us to assess the health of the neurons. Half the sections from one animal were treated for 30 min with 1.5 μm bovine insulin in 25 mm HEPES, and the other half with HEPES alone. Hippocampi were dissected out and processed for lysis and immunoprecipitation (see below) in the presence of phosphatase inhibitor cocktail (PhosStop, Roche, following manufacturer specifications), or slices were fixed, cryosectioned, and immunostained as above.
Western blotting.
Mice were anesthetized with isoflurane followed by rapid decapitation. Hippocampi were dissected out in cold 1× PBS and homogenized with a handheld tissue grinder in lysis buffer containing 20 mm Tris, pH 7.5, 1 mm EDTA, pH 8, 150 mm NaCl, 1% NP40, and protease (Complete Tabs), and phosphatase (PhosStop, Roche) inhibitor cocktails. After 30 min on ice, samples were centrifuged to remove insoluble material. Protein quantification was performed using a BCA Protein Assay Kit (Pierce). Samples were heat denatured in 2× SDS sample buffer/lysis buffer (125 mm Tris, pH 6.8, 4% SDS, 10% glycerol, 0.006% bromophenol blue, 1.8% β-mercaptoethanol) at 85°C for 5 min and separated using standard SDS-PAGE. Proteins were then transferred onto a PVDF membrane (Millipore). Membranes were blocked in 5% milk/1× TBS/0.1% Tween, then incubated O/N at 4°C with the following primary antibodies: insulin receptor β (RTK, 611276, 5 μg/ml, BD Transduction Laboratories; C19, 200 μg/ml, Santa Cruz Biotechnology); MHCI (OX18, MCA51R, 1 mg/ml, Serotec); GluR1 (AB1504, 100 μg/ml, Millipore Bioscience Research Reagents); GAPDH (MAB374, 10 μg/ml, Millipore Bioscience Research Reagents); synaptophysin (MAB5258, 10 μg/ml, Millipore Bioscience Research Reagents); pTyr (4G10, 0.5 μg/ml, Millipore; block 2% BSA instead of milk); insulin receptor α (N20, 200 μg/ml, Santa Cruz Biotechnology); PI3-kinase (PI3K; p85, clone 06–497, 200 μg/ml, Millipore); or phospho-mitogen-activated protein kinase (MAPK)/extracellular signal-related kinase (ERK) 1/2 (Thr 202/Tyr 204; 9101, 0.15 μg/ml, Cell Signaling Technology). After washes, membranes were incubated for 1 h at RT in secondary antibody (peroxidase-conjugated AffiniPure IgG, 0.1–0.2 μg/ml; The Jackson Laboratory). Bands were visualized using chemiluminescence (Pierce) and quantified by densitometry using ImageJ Software (National Institutes of Health).
Immunoprecipitation.
Protein lysates (1 mg) were incubated O/N at 4°C with 2 μg of antibody. Samples were combined with 50 μl of prewashed Protein G beads (Promega) in lysis buffer and rotated for 3 h at 4°C. Beads were collected by centrifugation and washed three times in cold lysis buffer. Immunoprecipitates were eluted directly in SDS sample buffer at 85°C for 10 min.
Surface biotinylation of live hippocampal slices.
Acute hippocampal slices (see above) were washed in ice-cold ACSF and incubated in ACSF containing 1 mg/ml sulfosuccinimidyl-6-(biotinamido) hexanoate (Pierce) for 1 h at 4°C. Unreacted biotinylation reagent was removed by two washes in cold ACSF and quenched with two washes in cold ACSF plus 100 mm glycine. Hippocampi were then homogenized as described above. To pull down biotinylated proteins, 250 μg of each lysate was incubated with 50 μl of streptavidin agarose beads (Endogen) O/N at 4°C. After several washes in lysis buffer and one wash in 50 mm Tris-HCl, pH 7.4, surface proteins were eluted into SDS sample buffer and processed for Western blotting as above.
Subcellular fractionation.
For each experiment, two sex-matched 4- to 5-week-old animals of each genotype were used as described previously (Fourgeaud et al., 2010). Briefly, hippocampi were homogenized in 10 volumes of HEPES sucrose buffer using a glass-Teflon homogenizer and were centrifuged. The pellet (P1), containing the nuclei and large insoluble fragments, was discarded. The supernatant (S1), corresponding to the total protein fraction, was centrifuged to isolate a washed, crude, synaptosomal pellet (P2′). P2′ was lysed by hypo-osmotic shock in water and rapidly adjusted to 4 mm HEPES. The P2′ lysate was centrifuged to generate a crude synaptosomal membrane fraction (P3) and a crude synaptic vesicle fraction (S3). Fractionation efficiency was confirmed by Western blot using an antibody against the synaptically localized protein synaptophysin (SY38 0.3 μg/ml, Millipore Bioscience Research Reagents). Synaptophysin was enriched at all steps of the fractionation process, indicating successful enrichment of synaptic proteins.
FITC-insulin labeling.
Hippocampal neurons (16 DIV) were live labeled for 15 min at 37°C in the presence of 200 nm FITC-conjugated insulin (Invitrogen) diluted in conditioned media. After washes in cold PBS, neurons were fixed and bound FITC insulin was visualized by fluorescence microscopy.
Electron microscopy.
Mice were transcardially perfused with 1× PBS at 37°C, followed by 2% PFA/2.5% glutaraldehyde in 0.1 m sodium cacodylate, pH 7.4. Brains were dissected out and post-fixed O/N at 4°C, then were thick sectioned on a vibratome (300 μm coronal sections). Seven thick sections, encompassing the entire hippocampus, were obtained from each animal, and the second most anterior section was processed for electron microscopy (EM). Following three washes in sodium cacodylate for 15 min and two washes in double-distilled H2O (ddH2O), sections were incubated in 1% OsO4/0.5% potassium ferrocyanate for 1 h, washed in ddH2O, incubated in 1% uranyl acetate 30 min, washed in ddH2O, dehydrated in an EtOH series, incubated in SciPoxy resin/EtOH without DMP30 for 48 h at 65°C, incubated in pure resin without DMP30 under vacuum for 1 h, incubated with DMP30 for 1 h, cut into thin (∼90 nm; silver) sections, and mounted on Formvar/carbon slot grids. EM images were collected at 10,000× magnification. For CA3, images were collected from stratum lucidum, at the center of the curve of CA3, 50 μm from the pyramidal cell layer. For CA1, images were collected from stratum radiatum, directly above the upper tip of the dentate and 50 μm below the CA1 pyramidal cell layer. Care was taken to image non-overlapping areas. Synapses (ultrastructurally defined as postsynaptic densities with closely apposed presynaptic boutons filled with synaptic vesicles) were independently counted by multiple observers who were blind to genotype in 15 images from CA3 and 15 from CA1 for each animal, representing a total area of 400 μm2 per animal in each region.
For EM of hippocampal slice cultures, individual slices were fixed overnight in 4% glutaraldehyde in 0.1 m sodium cacodylate buffer, pH 7.4, at 4°C. Slices were transferred to 0.2 m sodium cacodylate buffer, pH 7.4, and stored at 4°C. CA3 tissue was dissected as above. Sections were washed in sodium cacodylate buffer 2× 10 min, post-fixed in 1% OsO4 in 0.1 m cacodylate buffer for 1 h, dehydrated in graded series of ethanol (50%, 70%, 90%, and 100%, each 1× 10 min), defatted in 100% acetone 2× 10 min, incubated in 1:1 acetone/Epon resin for 1 h with rotation, incubated O/N in 1:3 acetone/Epon resin with rotation, washed in 100% Epon resin 2× 30 min each, and embedded in 100% resin at 70°C O/N. Ninety-seven nanometer sections were picked up on a 200 mesh copper grid, and sections were stained with uranyl acetate for 10 min and lead citrate for 2 min. Images were collected on a Zeiss 9132AB microscope at 4000× magnification. Fifty images, each 66.3 μm2, were collected from one slice per animal. Synapses were counted independently in every image by two observers who were blind to genotype and treatment.
Blood glucose levels.
Blood samples from tail puncture of 6-month-old male or female mice were assayed using a Precision Xtra blood glucose monitor (MediSense). Blood glucose measurements were obtained between 8:00 and 10 A.M. at the end of a 24 h fast.
Plasma and CSF insulin levels.
CSF was extracted from age- and sex-matched littermates, as described previously (Nirogi et al., 2009). Blood was extracted from the heart of the same animals, heparin (1000 U/ml) was added, and plasma was isolated by centrifugation. CSF and blood were assayed for insulin levels using a Mouse Insulin Ultrasenstive EIA Kit (80-INSMSU-E01, ALPCO). Our results are consistent with published values (Ranheim et al., 1997; Koevary et al., 2003).
Food intake and body weight studies.
To measure food intake, 4-month-old mice were provided with preweighed food. Food and mice were weighed every day for 4 d. Food intake (food consumed per day per mouse in milligrams) was normalized to mouse body weight (the average body weight of the mouse measured over a 4 d period and reported in grams).
Life span analysis.
Age- and sex-matched, nonmating mice were housed under identical conditions and fed a standard chow diet, and their date of death was recorded. Mice that died from a clear pathology (i.e., injury, tumor, infection) were omitted from the final analysis (a total of five animals were excluded: three WT and two β2m−/−TAP−/− mice).
Statistics.
For all experiments, means are reported ± SEM. Statistical comparisons of the data were performed using GraphPad InStat, version 3.06.
Results
MHCI negatively regulates synapse density in multiple regions of the vertebrate brain, but the underlying molecular mechanisms remain largely unknown. Here we explored the hypothesis that endogenous MHCI limits synapse density in the hippocampus by inhibiting the synapse-promoting effects of the insulin receptor.
Insulin receptor signaling is constitutively activated in neurons that express reduced cell surface levels of MHCI
Upon ligand binding, the insulin receptor is autophosphorylated on tyrosine residues. If endogenous MHCI normally inhibits insulin receptor signaling, then reducing MHCI levels might increase insulin receptor phosphorylation. To test this prediction, insulin receptors were immunoprecipitated from hippocampal slices from WT and MHCI-deficient mice (β2m−/−TAP−/−; see Materials and Methods), and were probed for phosphotyrosine. Total insulin receptor levels are normal in the hippocampus of MHCI-deficient animals (Figs. 1A, 2C–E). As expected, insulin receptors from untreated WT slices are not detectably phosphorylated in the presence of low basal levels of insulin, but become rapidly phosphorylated upon exposure to exogenous insulin. In contrast, insulin receptors from MHCI-deficient β2m−/−TAP−/− hippocampi show significant basal phosphorylation, which is comparable in magnitude to insulin-stimulated phosphorylation in WT slices (Fig. 1A). Thus, insulin receptors may be maximally phosphorylated in the basal state in the MHCI-deficient hippocampus. Consistent with this possibility, the application of high levels of insulin failed to further increase receptor phosphorylation in β2m−/−TAP−/− slices, indicating total occlusion of neuronal insulin sensitivity in the absence of MHCI (Fig. 1A). Elevated basal insulin receptor phosphorylation in MHCI-deficient hippocampus is not caused by an increase in levels of circulating insulin, since plasma and CSF insulin levels and fasting blood glucose levels are all normal in β2m−/−TAP−/− mice (see Fig. 6A–C). Thus, increased neuronal insulin receptor signaling in MHCI-deficient neurons is not secondary to systemic or local changes in insulin availability, but reflects a role for MHCI in inhibiting neuronal insulin receptor signaling.
Figure 1.
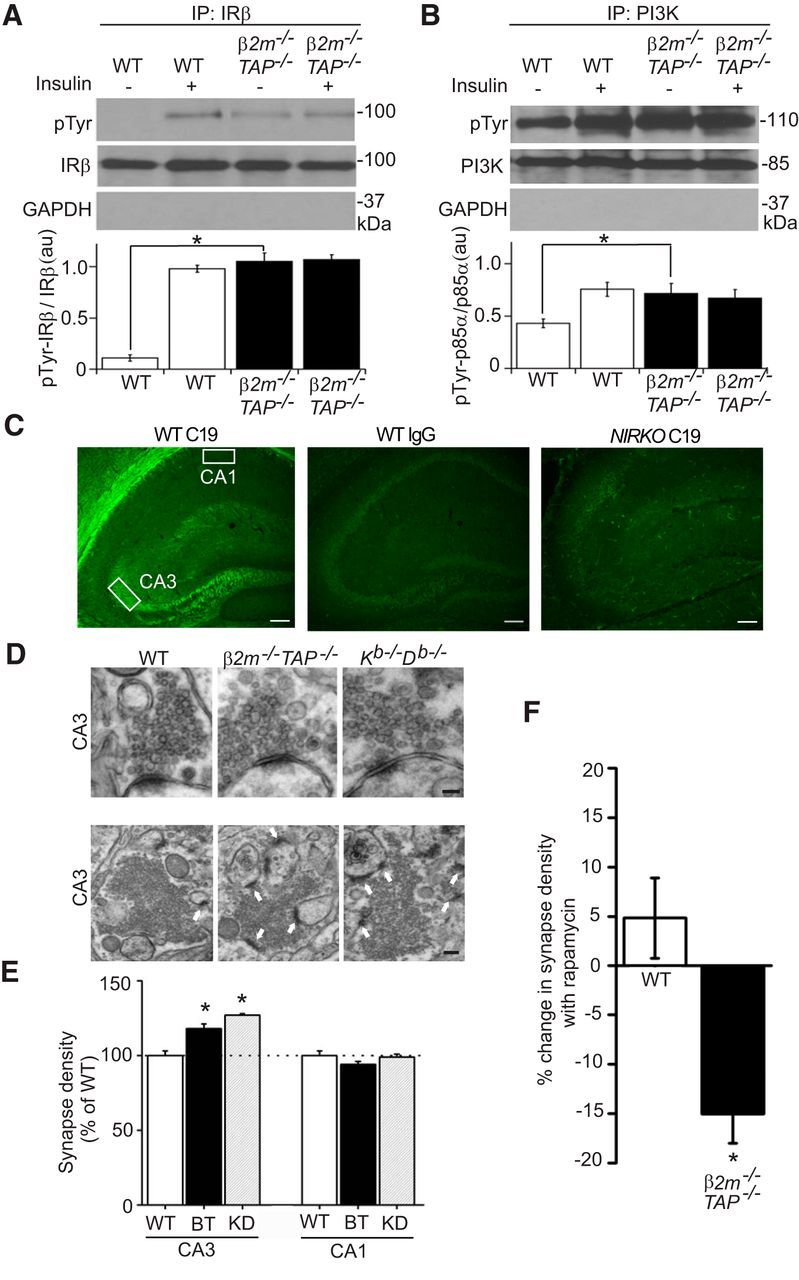
MHCI inhibits constitutive insulin receptor signaling and limits synapse density in regions where IRs are expressed. A, B, Insulin receptor β subunits (IRβ) or PI3K immunoprecipitated from WT or β2m−/−TAP−/− hippocampal lysates prepared from live brain slices incubated in the presence or absence of insulin, probed for phosphotyrosine (pTyr), insulin receptor β (IRβ; C19), PI3K, or the abundant intracellular protein GAPDH. While total levels of insulin receptor and PI3K proteins are normal, the proportion of insulin receptor and PI3K that is phosphorylated in the basal state is significantly elevated in β2m−/−TAP−/− hippocampus. Histograms show the mean pTyr labeling intensity normalized to total insulin receptor or PI3K labeling within the experiment ±SEM, reported in arbitrary units (a.u.). A, IR: WT minus insulin, 0.11 ± 0.03; WT plus insulin, 0.98 ± 0.03; β2m−/−TAP−/− minus insulin, 1.05 ± 0.08 (p < 0.01 compared with WT minus insulin, Student's t test); β2m−/−TAP−/− with insulin, 1.07 ± 0.05; n = 3 animals per genotype per condition. B, PI3K: WT minus insulin, 43.10 ± 4.17; WT plus insulin, 75.57 ± 6.59; β2m−/−TAP−/− minus insulin, 71.74 ± 9.58 (p < 0.01 compared with WT minus insulin, Student's t test); β2m−/−TAP−/− with insulin, 67.14 ± 8.21; n = 3 animals per genotype per condition. C, Coronal sections of P30 mouse hippocampus immunostained with IRβ (C19) antibodies show strong, specific labeling of the proximal neuropil in area CA3, but not area CA1, of hippocampus. Labeling is abolished when WT sections are incubated in isotype control primary antibodies (middle) or in brain sections from NIRKO mice (right). Left, Boxes represent regions where electron micrographs were collected. Scale bar, 100 μm. D, Top, Representative transmission electron micrographs of single synapses in stratum lucidum of CA3 from WT and MHCI-deficient mice (β2m−/−TAP−/− and Kb−/−Db−/− mice). Scale bar, 150 nm. Bottom, Representative lower-magnification transmission electron micrographs from stratum lucidum of CA3 from WT β2m−/−TAP−/− and Kb−/−Db−/− mice showing multiple synapses (arrows). Scale bar, 250 nm. E, Synapse counts per unit area. β2m−/−TAP−/− and Kb−/−Db−/− mice show increased synapse density compared with WT mice in area CA3, where insulin receptors are expressed, but not in CA1, where insulin receptors are not detected. Values represent the mean ± SEM. Mean number of synapses per square micrometer in CA3: WT, 0.34 ± 0.01 synapses, n = 6 animals; β2m−/−TAP−/−, 0.40 ± 0.01, n = 6, p < 0.02; Kb−/−Db−/−, 0.43 ± 0.01, n = 3, p < 0.01, Student's t test. BT, β2m−/−TAP−/−; KD, Kb−/−D b−/−. Mean synapse density in CA3 is 17.7% higher in β2m−/−TAP−/− than WT mice. F, Rapamycin reduces synapse number in area CA3 of β2m−/−TAP−/− but not WT mice. Mean synapse density in β2m−/−TAP−/− declines an average of 15.0% after treatment with rapamycin, significantly different from the effect in WT (p = 0.02); n = 3 slices per genotype. IP, Immunoprecipitation. *p < 0.05.
Figure 2.
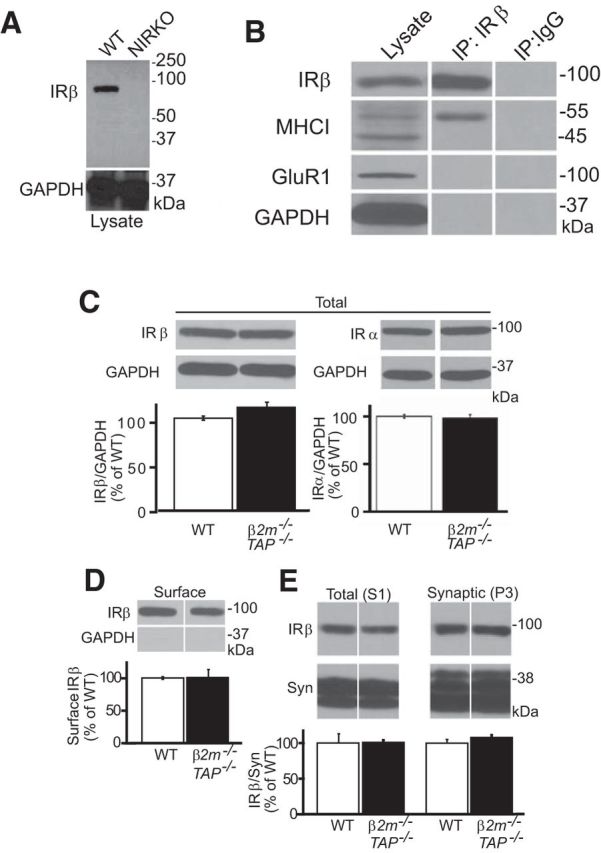
MHCI and insulin receptors coimmunoprecipitate from WT hippocampal lysates, and insulin receptor expression and trafficking is normal in MHCI-deficient mice. A, Western blots of whole-brain lysates from adult (P30) WT or NIRKO mice probed for IRβ using clone C19. The loss of insulin receptor labeling (IRβ; ∼95 kDa) in NIRKO brain samples as well as the absence of IGF-1 receptor labeling (∼115 kDa) in either genotype demonstrate the specificity of clone C19 for insulin receptors. Bottom, The same samples stripped and reprobed for the abundant intracellular protein GAPDH. B, Western blotting for MHCI and IRβ in hippocampal lysates or IRβ immunoprecipitates. IRβ antibodies selectively coprecipitate MHCI, but not other cell surface (GluR1) or intracellular (GAPDH) proteins. IP:IgG, Isotype control immunoprecipitation. C, D, Western blotting of WT and β2m−/−TAP−/− hippocampal lysates probed for IRβ (C19) or IRα (N20) subunits (C), and hippocampal cell surface fractions probed for IRβ (C19; D). Total and surface levels of insulin receptor protein are indistinguishable between genotypes. Insulin receptor values are normalized to GAPDH and represented as the percentage of WT (mean ± SEM). Total IRβ: WT, 100 ± 2.3%; β2m−/−TAP−/−, 111.6 ± 5.5%; n = 6 animals. Total IRα: WT, 102 ± 1.3%; β2m−/−TAP−/−, 99.1 ± 4.5%; n = 3. Surface: WT, 100 ± 2.0%; β2m−/−TAP−/−, 101 ± 12.4%; n = 3. E, Western blots of total (S1) and synaptic (P3) fractions from hippocampus probed for IRβ (C19) and the presynaptic protein synaptophysin (Syn). Synaptic levels of insulin receptor protein are indistinguishable between genotypes. S1: WT, 100 ± 13.0%; β2m−/−TAP−/−, 100 ± 3.0%; n = 6 animals; P3: WT, 100 ± 5.0%; β2m−/−TAP−/−, 108 ± 4.0%; n = 6.
Figure 6.
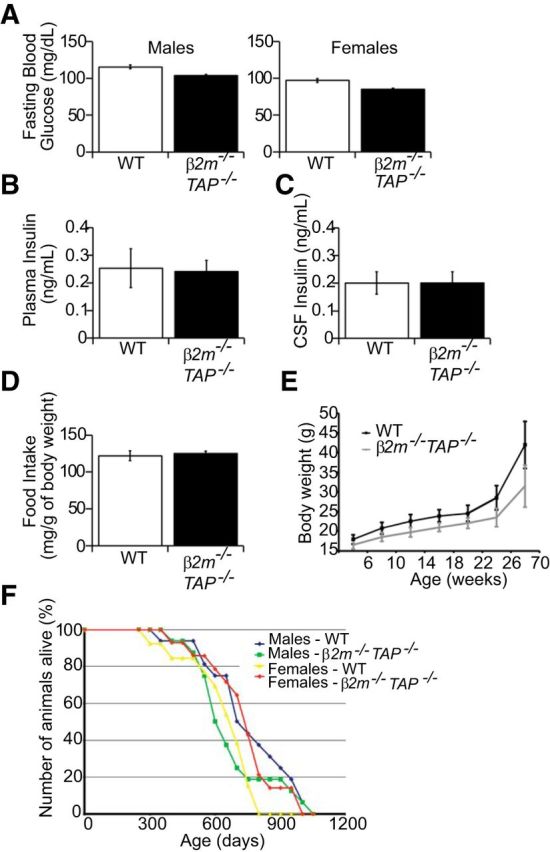
Blood glucose levels, plasma and CSF insulin levels, food intake, body weight, and life span are unchanged in β2m−/−TAP−/− mice. A, Blood glucose levels for male and female 6-month-old β2m−/−TAP−/− mice fasted for 24 h are comparable to WT animals. WT males: 115.6 ± 2.5 g/dL, n = 12 animals; β2m−/−TAP−/− males: 103.9 ± 1.3, n = 19; WT females: 96.9 ± 2.5, n = 18; β2m−/−TAP−/− females: 85 ± 1.6, n = 19. B, Plasma insulin levels are similar as measured by Ultrasensitive Enzyme Immunoassay (EIA) in P30–P35 WT and β2m−/−TAP−/− mice. WT: 0.25 ± 0.07 ng/ml, n = 14 animals; β2m−/−TAP−/−: 0.24 ± 0.04, n = 9. C, CSF insulin levels as measured by EIA are comparable between WT and β2m−/−TAP−/− P30–P35 mice. WT: 0.19 ± 0.04 ng/ml, n = 15 animals; β2m−/−TAP−/−: 0.20 ± 0.04, n = 9. D, Food intake measurements normalized to body weight in mice at 20 weeks of age show no significant difference between WT and β2m−/−TAP−/−. WT: 121.1 ± 6.6 mg/g body weight, n = 36 animals; β2m−/−TAP−/−: 125 ± 3.4, n = 32. E, Body weight measurements in WT and β2m−/−TAP−/− mice from 6 to 70 weeks of age. β2m−/−TAP−/− mice on a regular chow diet weighed slightly less than controls at all ages, but this difference was not statistically significant at any age measured (n = 13–17 mice per genotype and sex). F, Average life span is unchanged in β2m−/−TAP−/− mice relative to WT (n > 13 for each genotype and gender). For A–E, values are mean ± SEM, and Student's t test shows no significant difference between genotypes. For all measures, there were no significant differences between genotypes for males or females analyzed separately, and therefore (B–D) show pooled data for male and female β2m−/−TAP−/− mice versus age- and sex-matched controls.
To determine whether MHCI specifically inhibits aspects of insulin receptor signaling that are required for insulin-stimulated increases in synapse number, PI3-kinase (PI3K) and extracellular signal-related kinase (ERK)1/2 activation were examined in MHCI-deficient hippocampus. Following insulin receptor autophosphorylation, insulin can trigger diverse downstream second messenger cascades, including PI3K and the MAPK/ERK1/2 pathway (the Ras–Raf–MEK–ERK1/2 pathway (White and Kahn, 1994). Insulin-stimulated increases in hippocampal synapse density in vitro require activation of PI3K, but not ERK1/2 (Lee et al., 2011). Therefore, we predicted that loss of MHCI would disinhibit PI3K activation, but might not affect ERK1/2 activation. Indeed, in MHCI-deficient neurons, constitutive insulin receptor phosphorylation is associated with elevated basal phosphorylation of PI3K (Fig. 1B), but no significant change in ERK1/2 phosphorylation (89 ± 17% of WT, n = 5). Thus, endogenous MHCI prevents tonic activation of PI3K, a mediator of insulin-stimulated increases in synapse number.
Synapse number is selectively increased in insulin receptor-expressing regions of hippocampus in MHCI-deficient mice
Insulin treatment increases spine density in mouse hippocampal neurons in vitro (Lee et al., 2011). Therefore, we hypothesized that elevated insulin receptor phosphorylation in MHCI-deficient mice might cause an increase in synapse density. A key prediction of this hypothesis is that increased synapse density should be restricted to regions where insulin receptors are expressed.
Previous studies using in situ hybridization and radiolabeled insulin suggest that insulin receptor mRNA and protein are widely expressed in brain (Havrankova et al., 1978; Baron Van Evercooren et al., 1991; Kar et al., 1997). However, insulin can bind to other cell surface proteins, including the insulin-like growth factor 1 receptor (IGF1R; Sosa et al., 2006), and therefore insulin binding may overestimate the extent of insulin receptor expression. To characterize insulin receptor protein expression in the brain, immunostaining was performed on permeabilized mouse brain sections using an antibody that is specific for insulin receptors and does not cross-react with IGF1Rs (Entingh-Pearsall and Kahn, 2004; Baudler et al., 2005). This antibody (clone C19) recognizes an intracellular epitope of the β-subunit of the insulin receptor. Immunostaining with this antibody is abolished in animals that lack insulin receptor expression in brain (i.e., NIRKO mice; Brüning et al., 2000), confirming its specificity for the insulin receptor (Fig. 1C). Strong, specific insulin receptor immunostaining was detected in the hippocampus in WT animals. Dense labeling is apparent in stratum lucidum of area CA3, which includes mossy fiber axons from the dentate gyrus granule cells, which form synapses on CA3 pyramidal neurons. In contrast, no labeling is present in the proximal neuropil of area CA1, which includes Schaffer collateral axons from CA3 pyramidal cells, which make synapses onto the dendrites of CA1 pyramidal neurons (Fig. 1C; see also Fig. 4).
Figure 4.
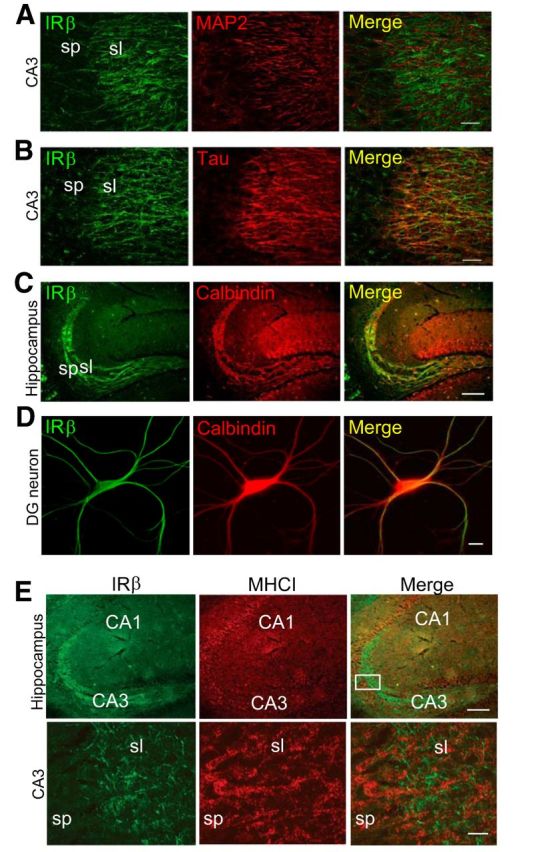
Insulin receptors are expressed by axons in hippocampus and do not localize to the same cellular compartments as MHCI, consistent with non-cell-autonomous interactions. A, B, Double-label immunohistochemistry for IRβ (green) and the dendritic marker MAP2 (red) or the axonal marker TAU (red). IRβ does not colocalize with MAP2 (yellow, merge in A), but colocalizes with TAU (yellow, merge in B) in area CA3 stratum lucidum of WT hippocampus. Scale bars, 20 μm. C, Double labeling for IRβ (green) and the dentate granule cell marker calbindin (red). IRβ and calbindin colocalize extensively in dentate granule cell axons (mossy fibers). Scale bar, 100 μm. D, Double-label cytochemistry for IRβ (green) and calbindin (red) in WT hippocampal cultures at 18 DIV. IRβ labeling colocalizes with calbindin-positive neurons (yellow, merge). Scale bar, 10 μm. E, P30 mouse hippocampus immunostained for IRβ (green) and MHCI (red). Boxed region (top right) is magnified in bottom. Punctate MHCI labeling is detected in processes in apposition to IRβ-positive axons in stratum lucidum of hippocampus (merge). sp, Stratum pyramidale; sl, stratum lucidum. Scale bars: top, 100 μm; bottom, 10 μm.
To test whether increases in synapse number in MHCI-deficient brain are specifically associated with regions where insulin receptors are expressed, synapses were counted using electron microscopy in stratum lucidum of CA3, where insulin receptors are expressed, or proximal stratum radiatum of CA1, where insulin receptors are not detected (Fig. 1C, boxed areas). Both samples included synapses made onto the proximal dendrites of pyramidal neurons that express MHCI (Huh et al., 2000). Synapses were defined ultrastructurally and were counted over an identical area (400 μm2 of the neuropil) in WT and MHCI-deficient animals.
Synaptic morphology is qualitatively indistinguishable in WT and MHCI-deficient hippocampi (Fig. 1D). However, MHCI-deficient β2m−/−TAP−/− mice show significantly higher synapse density relative to WT mice in area CA3 of hippocampus. Strikingly, this increase in synapse density is present in CA3, where insulin receptors are expressed, but not in CA1, where insulin receptors are absent. Similar results were obtained in mice that lack the classic MHCI genes H2-K and H2-D, but do not have mutations in either β2m or TAP (Kb−/−Db−/− mice; Vugmeyster et al., 1998; Fig. 1D,E). The increase in synapse number in Kb−/−Db−/− mice independently confirms the role of MHCI in limiting synapse number in areas where insulin receptors are detected, and implicates one or both of these classic MHCI genes in the control of synaptic connectivity.
Synapse number is rescued in MHCI-deficient mice by blocking insulin receptor signaling
The current results are consistent with a model in which MHCI limits synapse number by inhibiting insulin receptor activation. In this model, the loss of MHCI disinhibits insulin receptor signaling, resulting in an increase in synapse number in regions where insulin receptors are expressed. If this model is correct, then inhibiting insulin receptor signaling should rescue synapse number in MHCI-deficient brain. To specifically inhibit the arm of insulin receptor signaling that is required to promote synapse number, we incubated organotypic hippocampal slice cultures in the mammalian target of rapamycin (mTOR) inhibitor rapamycin. mTOR mediates insulin-induced increases in synapse number in hippocampal neurons, and insulin-stimulated increases in hippocampal spine density in vitro are blocked by incubation in rapamycin (Lee et al., 2011).
Rapamycin might not change synapse number in WT hippocampus, if insulin receptor signaling is already tonically inhibited by endogenous MHCI (Fig. 1A,B). Indeed, rapamycin had no effect on basal synapse density in WT hippocampal slice cultures, consistent with results in acutely dissociated hippocampal neurons (Lee et al., 2011). Although rapamycin does not significantly affect synapse density in WT animals, it fully reverses the increase in synapse density caused by MHCI knockdown (Fig. 1E,F). These data demonstrate that increased synapse density in MHCI-deficient hippocampus can be rescued by inhibiting insulin receptor signaling via the mTOR pathway, and suggest that endogenous MHCI is a tonic brake on insulin receptor-induced enhancement of synapse density.
Insulin receptors can form a complex with MHCI in brain extracts
The results thus far indicate that MHCI inhibits insulin receptor phosphorylation and downstream signaling, and that restoring the inhibition of insulin signaling in MHCI-deficient mice rescues synapse number. How does MHCI influence insulin receptor function? To determine whether MHCI can interact with insulin receptors from neurons, coimmunoprecipitation experiments were performed. The anti-insulin receptor β-subunit antibody C19 recognizes a single band of the expected molecular weight in immunoblots of WT brain lysates, which is completely abolished in lysates from insulin receptor-deficient NIRKO animals (Brüning et al., 2000; Fig. 2A), confirming the specificity of the C19 antibody for insulin receptors in Western blots of brain. Western blots of WT hippocampal lysates show two specific MHCI bands of 45 and 55 kDa, as previously reported (Huh et al., 2000), consistent with the fact that this antibody recognizes multiple MHCI species in the 45–55 kDa range (Osawa et al., 1985). Immunoprecipitation of endogenous insulin receptors from hippocampus selectively coprecipitated the 55 kDa MHCI band, but did not precipitate the 45 kDa MHCI band, the abundant intracellular protein GAPDH, or the synaptic transmembrane protein GluR1 (Fig. 2B). Thus, insulin receptors form a macromolecular complex with MHCI proteins in brain extracts.
MHCI modifies a signaling epitope of the insulin receptor
How does MHCI influence insulin receptor phosphorylation? Insulin receptor levels are qualitatively normal in MHCI-deficient brain (Fig. 1A,B). Further quantitative analysis shows that total levels of both the α- and β-subunits of the insulin receptor are normal in Western blots of hippocampal lysates from MHCI-deficient animals (Fig. 2C–E). Cell surface and synaptic levels of insulin receptors are also normal in β2m−/−TAP−/− hippocampal lysates (Fig. 2D,E), suggesting that changes in the expression or trafficking of insulin receptors do not contribute significantly to MHCI-dependent changes in insulin receptor function.
To probe how MHCI affects insulin receptor phosphorylation and downstream signaling, we labeled native neuronal insulin receptors in WT and MHCI-deficient β2m−/−TAP−/− animals using reagents that are sensitive to the conformation and accessibility of different epitopes (Fig. 3F). In the first set of experiments, brain sections were immunostained with an antibody (C19) that recognizes a C-terminal domain of the insulin receptor β-subunit. The epitope of the C19 antibody encompasses two tyrosine residues (Y1355 and Y1361) that are phosphorylated upon insulin binding and subsequently form part of the PI3K binding motif. This antibody robustly labels insulin receptors in Western blotting and immunostaining of WT brain (Figs. 1, 2). Strikingly, although insulin receptors are detected at normal levels in β2m−/−TAP−/− brain using the C19 antibody under the denaturing conditions of Western blots, detection of native insulin receptors by this antibody was completely masked in β2m−/−TAP−/− hippocampal slices (Fig. 3A,B,H). Similar results were obtained using a second antibody against a nearby epitope of the insulin receptor (RTK; Fig. 3C,F). A second line of MHCI-deficient mice (Kb−/−Db−/− mice) also showed a significant reduction in insulin receptor immunolabeling relative to WT using the C19 antibody (Fig. 3D). The inability to detect native insulin receptors with antibodies against these epitopes in two different lines of MHCI-deficient animals, despite the presence of normal levels of insulin receptor protein detectable under denaturing conditions, suggests that the accessibility of this functionally significant domain of the insulin receptor is regulated by MHCI.
Figure 3.
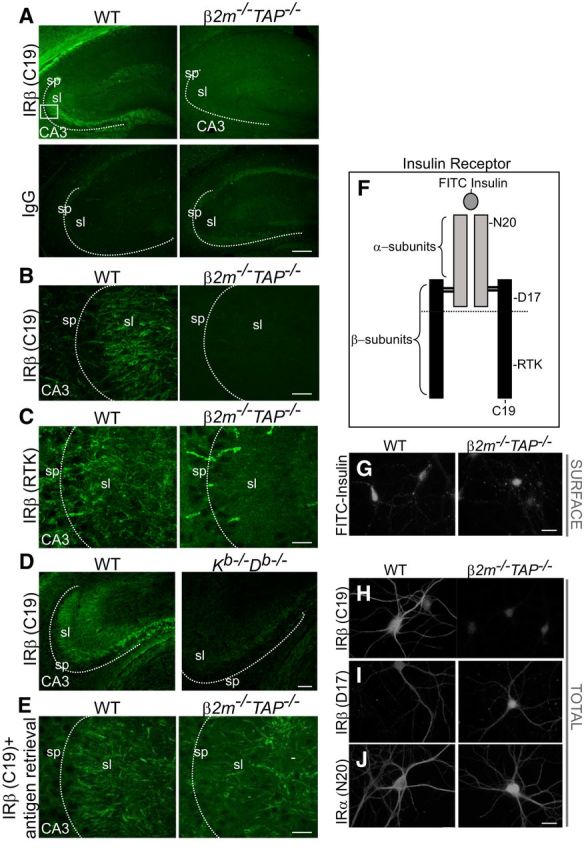
Occlusion of insulin receptor epitopes in MHCI-deficient brain. A, P30 mouse hippocampus immunostained with IRβ (C19) antibodies or IgG control. IRβ labeling is strong in WT brain but is abolished in brains of β2m−/−TAP−/− mice. sp, Stratum pyramidale; sl, stratum lucidum. Box represents the approximate area shown in B, C, and E. Scale bar, 150 μm. B, Scale bar, 20 μm. C, IRβ staining with the RTK antibody in WT brain is abolished in β2m−/−TAP−/− brain, similar to the loss of IRβ (C19) staining in A and B. Only nonspecific blood vessel labeling persists in β2m−/−TAP−/−. Scale bar, 20 μm. D, IRβ (C19) staining is also reduced in sections from mice lacking the MHCI proteins H2-K and H2-D (Kb−/−Db−/− mice). Scale bar, 100 μm. E, WT and β2m−/−TAP−/− hippocampi stained for IRβ (C19) after antigen retrieval. IRβ immunolabeling with this antibody is abolished in β2m−/−TAP−/− brains under normal immunostaining conditions (A, B), but is restored following antigen retrieval. Scale bar, 20 μm. F, Schematic representation of insulin receptors, which are composed of two extracellular α-subunits and two transmembrane β-subunits. Approximate locations of epitopes detected by individual reagents are indicated. Horizontal line represents the transmembrane region. G, Labeling of cell surface insulin-binding receptors in live WT and β2m−/−TAP−/− hippocampal neurons using FITC-insulin. FITC-insulin labeling is qualitatively similar in level and pattern in WT and β2m−/−TAP−/− neurons. Scale bar, 20 μm. H–J, Labeling of the total (surface plus intracellular) pool of insulin receptors in fixed, permeabilized hippocampal neurons using antibodies directed against the indicated epitopes. Labeling with IRβ (C19) is abolished in β2m−/−TAP−/− neurons (H), as is staining with IRβ (RTK), which binds a nearby epitope (Fig. 3C,F,H). I, J, However, insulin receptor protein is readily detectable in β2m−/−TAP−/− neurons when labeled with antibodies against distinct epitopes in the IRβ (D17; I) or IRα (N20; J) subunits. Scale bar, 10 μm.
Supporting an MHCI-dependent change in insulin receptor conformation, native insulin receptors could be detected in MHCI-deficient animals at normal levels by labeling with multiple reagents that bind distinct epitopes of the insulin receptor. First, WT and β2m−/−TAP−/− cultured hippocampal neurons were live labeled with fluorescein-conjugated insulin (FITC-insulin). Insulin binds to the extracellular α-subunits of the insulin receptor (Fig. 3F). Brief application of FITC-insulin to WT neurons yielded punctate cell surface labeling of the neurites and soma that was qualitatively indistinguishable from WT in β2m−/−TAP−/− neurons (Fig. 3G). Thus, cell surface insulin receptors are able to bind normal levels of insulin in MHCI-deficient mice, consistent with the fact that cell surface insulin receptor levels measured by surface biotinylation are normal in β2m−/−TAP−/− neurons (Fig. 2D). Similarly, immunostaining with two additional insulin receptor antibodies that detect extracellular epitopes yielded comparable staining in WT and β2m−/−TAP−/− hippocampal neurons (D17 and N20; Fig. 3F,I,J). Thus, multiple lines of evidence suggest that insulin receptor expression is normal, and an intracellular, C-terminal epitope of the insulin receptor is selectively masked, in MHCI-deficient β2m−/−TAP−/− neurons.
If this epitope of the native insulin receptor is masked in β2m−/−TAP−/− mice, it should be possible to expose it using techniques that partially denature proteins and unmask epitopes. In support of this possibility, this epitope is readily detectable in β2m−/−TAP−/− mice under denaturing conditions in Western blots (Figs. 1A,B, 2C–E). Epitopes can also be unmasked in situ in tissue sections using antigen retrieval protocols, which dissociate protein interactions and denature protein structure, reducing steric interference that can occlude antibody binding sites (Shi et al., 2001). Antigen retrieval treatment rescued C19 immunostaining in β2m−/−TAP−/− slices to levels that were indistinguishable from WT slices (Fig. 3E). The ability to detect insulin receptor in MHCI-deficient brain using multiple approaches, and the inability to detect insulin receptors using RTK or C19 in these animals except under denaturing conditions in vitro or in vivo, together suggest that this intracellular epitope of the insulin receptor is selectively masked in MHCI-deficient β2m−/−TAP−/− neurons. Since the C19 epitope includes tyrosine residues that are phosphorylated following insulin binding, one possibility is that elevated insulin receptor phosphorylation (Fig. 1A) prevents C19 from binding to the insulin receptor in β2m−/−TAP−/− neurons. However, insulin treatment (which causes phosphorylation of WT insulin receptors that mimics basal phosphorylation in β2m−/−TAP−/− neurons; Fig. 1A) is not sufficient to prevent the C19 antibody from binding to insulin receptors in WT brain slices or dissociated WT neurons (see Fig. 7A,B), suggesting that MHCI exerts additional effects on insulin receptor structure. Thus, endogenous MHCI exposes a cytoplasmic epitope of the insulin receptor in WT neurons, and changes in the conformation and/or accessibility of this epitope are associated with constitutive phosphorylation of insulin receptors and increased synapse density in MHCI-deficient neurons.
Figure 7.
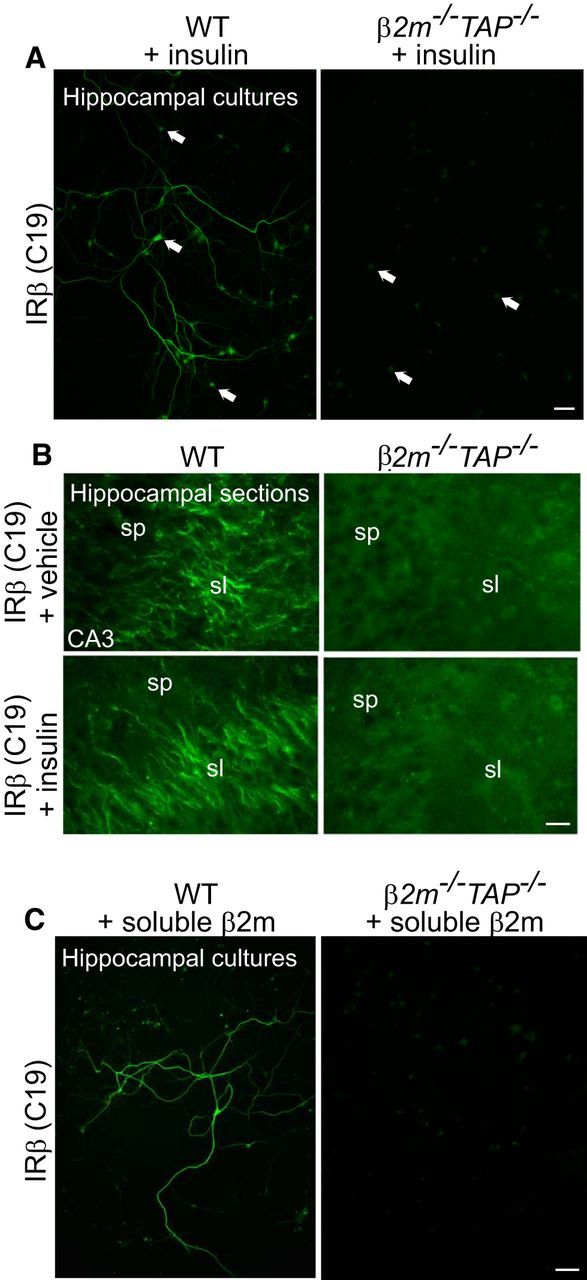
Immunostaining of insulin receptor β is not rescued in β2m−/−TAP−/− neurons by treatment with either soluble β2m or insulin. A, WT and β2m−/−TAP−/− hippocampal neurons (19 DIV) treated with insulin, then fixed and stained for IRβ. Insulin application does not rescue the loss of C19 staining in β2m−/−TAP−/− neurons. Scale bar, 50 μm. B, Live WT and β2m−/−TAP−/− mouse hippocampal slices incubated with vehicle or soluble insulin, then fixed and stained with IRβ antibodies (C19). Bath application of insulin (bottom) does not rescue the loss of C19 staining in β2m−/−TAP−/− neurons. Scale bar, 20 μm. C, WT and β2m−/−TAP−/− hippocampal neurons (19 DIV) treated with soluble β2m, then fixed and immunostained for IRβ. Bath application of β2m does not rescue the loss of C19 staining in β2m−/−TAP−/− neurons. Scale bar, 50 μm.
Insulin receptors are expressed in axons in close apposition to MHCI-positive dendrites in multiple brain regions
The data so far suggest that MHCI can form a complex with insulin receptors and regulate insulin receptor phosphorylation and downstream signaling. Dendritic spine density increases upon insulin treatment of hippocampal neurons in vitro (Lee et al., 2011), and we find that loss of cell surface MHCI is associated with increased insulin receptor signaling and synapse density in regions of the hippocampus where insulin receptors are expressed. However, it is unknown whether MHCI influences neuronal insulin receptor signaling through cell-autonomous or non-cell-autonomous mechanisms.
MHCI is found in dendrites and colocalizes with the postsynaptic marker PSD-95 in dissociated mouse hippocampal neurons (Goddard et al., 2007). To determine the subcellular localization of neuronal insulin receptors in the hippocampus, two approaches were taken. First, brain slices were coimmunostained for insulin receptors and markers of dendrites (MAP2) or axons (TAU). In area CA3 of hippocampus, insulin receptors colocalize extensively with TAU, but not MAP2 (Fig. 4A,B), suggesting that insulin receptors are expressed in axons in the CA3 region. Axons in this region include recurrent projections from CA3 pyramidal cells as well as projections from dentate granule cells and entorhinal cortex, all of which form synapses onto CA3 pyramidal cells (Jones and McHugh, 2011). Of these, insulin receptors are highly expressed in dentate granule cell axons (the mossy fibers), since insulin receptor labeling colocalizes with the dentate granule cell marker calbindin, both in hippocampal sections and in acutely dissociated hippocampal neurons in vitro (Fig. 4C,D). Thus, insulin receptors, which form a complex with MHCI in brain lysates (Fig. 2B), are expressed in the axons of neurons that form synapses onto MHCI-expressing dendrites in area CA3 of hippocampus. Together, these results suggest a model in which MHCI regulates neuronal insulin receptor signaling in a non-cell-autonomous juxtacrine or paracrine manner.
To determine whether MHCI and insulin receptors are expressed in a manner consistent with a non-cell-autonomous interaction in vivo, double labeling was performed with anti-insulin receptor β-antibody C19 and an anti-MHCI antibody, OX18, that recognizes multiple MHCI isoforms (Osawa et al., 1985). Cell surface labeling with OX18 is markedly reduced in MHCI-deficient hippocampal neurons in vitro (Goddard et al., 2007), supporting its specificity for MHCI proteins in these cells. Punctate MHCI labeling is detected in the soma and dendrites of CA3 pyramidal cells in hippocampal slices, which is consistent with previous findings in dissociated neurons in vitro (Goddard et al., 2007). In stratum lucidum of the CA3 region, as expected, MHCI-positive dendrites are intermingled with insulin receptor-positive axons (Fig. 4E). Thus, MHCI and insulin receptors do not appear to be coexpressed in the same subcellular compartments, but are expressed in closely apposed structures, suggesting that MHCI proteins might influence neuronal insulin receptors in a non-cell-autonomous manner in vivo.
Insulin receptor immunostaining with the C19 antibody is rescued by coculturing β2m−/−TAP−/− neurons with WT neurons
We reasoned that whether MHCI can affect insulin receptors non-cell-autonomously (i.e., in trans), exposing β2m−/−TAP−/− neurons to WT, MHCI-expressing neurons might unmask intracellular insulin receptor epitopes and rescue the loss of C19 immunolabeling. To directly test this, WT hippocampal neurons (identified by the expression of actin-GFP; see Materials and Methods) were cocultured with MHCI-deficient β2m−/−TAP−/− hippocampal neurons, and rescue of C19 immunostaining in β2m−/−TAP−/− (GFP-negative) neurons was assessed. In pure WT cultures, 100% of the cells expressed GFP, and at the density plated, on average 17 cells per coverslip were C19 positive (Fig. 5A,E). The C19-positive subset of cells in these hippocampal cultures are likely dentate granule neurons, because all C19-positive cells examined in WT hippocampal cultures also express calbindin, a dentate granule cell marker (Fig. 4D). As expected, none of the cells in pure β2m−/−TAP−/− cultures expressed GFP or showed labeling with C19 (Fig. 5B,F). When neurons of the two genotypes were cultured in the same dish in equal quantities, however, two distinct C19-positive populations were seen in approximately equal numbers, as follows: (1) GFP-positive neurons, which represent WT cells expressing insulin receptors that are normally detectable with the C19 antibody; and (2) GFP-negative β2m−/−TAP−/− cells in which C19 labeling has been rescued (Fig. 5C,D,G). Lower-power views (Fig. 5D, 10×) as well as analysis of confocal Z-stacks allowed unambiguous identification of GFP-negative, C19-positive neurons. The fact that insulin receptor β (C19) immunostaining is present in identical numbers of GFP-positive (WT) and GFP-negative (MHCI-deficient) neurons, when the genotypes are plated at equal density, indicates that insulin receptor staining is restored in most, if not all, MHCI-deficient dentate granule cells. Since pure β2m−/−TAP−/− hippocampal neurons never show C19 staining, these rescue experiments demonstrate that insulin receptor labeling in MHCI-deficient neurons can be rescued in trans by WT MHCI-expressing neurons.
Figure 5.
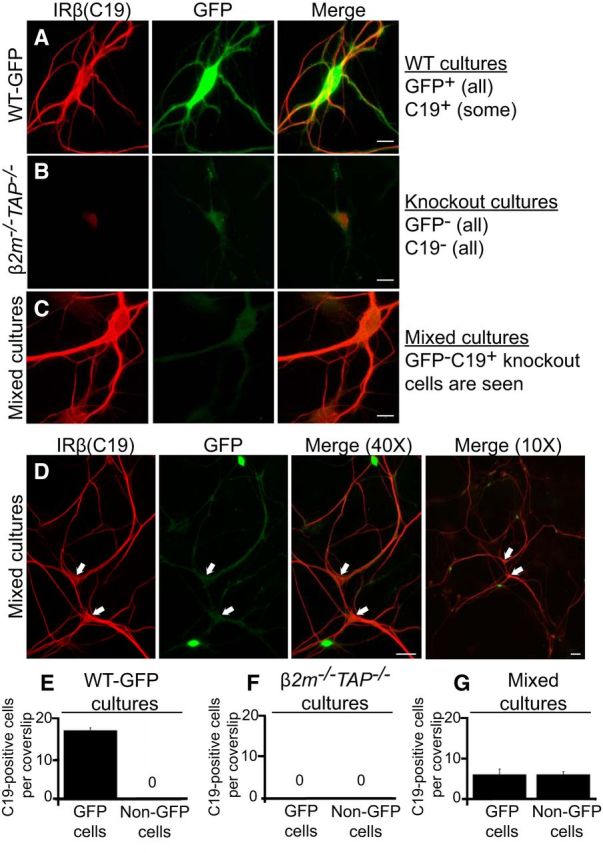
Insulin receptor β (C19) immunolabeling is rescued in MHCI-deficient neurons cocultured with WT neurons. A–D, Cultured hippocampal neurons (18 DIV) stained for IRβ (C19, red) and GFP (green). A, Example of IRβ and GFP labeling in pure WT-GFP hippocampal cultures. These cultures contain both IRβ-positive neurons (dentate granule cells) and IRβ-negative neurons, and all neurons are GFP positive. Scale bar, 10 μm. B, Example of IRβ and GFP labeling in pure β2m−/−TAP−/− cultures. These cultures do not contain any IRβ-positive or GFP-positive neurons, as expected. Scale bar, 10 μm. C, Example of IRβ and GFP labeling in mixed WT-GFP and β2m−/−TAP−/− cultures. In mixed cultures, IRβ staining is rescued in a subset of β2m−/−TAP−/− (GFP-negative) neurons. Scale bar, 10 μm. D, Low-power views of mixed cultures allow clear identification of GFP-negative, C19-positive cells (arrows). Scale bars: 40× view, 50 μm; 10× view, 20 μm. E–G, Quantification of IRβ-positive cells. E, At the density plated, WT-GFP cultures contain on average 17 ± 0.70 C19-positive cells per coverslip (of ∼300 cells/coverslip). F, β2m−/−TAP−/− cultures do not contain any C19-positive cells. G, Cultures plated with equal numbers of WT-GFP and β2m−/−TAP−/− neurons contain two populations of C19-expressing cells in equal numbers: those that are GFP positive (WT; 6 ± 1.4 cells/coverslip), and those that are GFP negative (rescued β2m−/−TAP−/−; 6 ± 0.8 cells/coverslip). All bars represent mean ± SEM; n = 3 cultures, at 12 coverslips per culture, each for E–G.
Discussion
Here we show that MHCI negatively regulates synapse number by inhibiting the synapse-promoting effects of the insulin receptor. Endogenous MHCI forms a complex with the insulin receptor, prevents constitutive insulin receptor signaling, and limits synaptic density where insulin receptors are expressed. In MHCI-deficient brain, insulin receptor signaling is elevated, and reducing insulin receptor signaling rescues synapse number. These studies identify a regulatory interaction between MHCI and insulin receptors in neurons, and suggest that increased synapse number in MHCI-deficient brain is a direct consequence of disrupting MHCI–insulin receptor interactions in vivo.
Endogenous levels of MHCI normally limit synapse number in the healthy brain, because decreasing MHCI expression significantly increases synapse density in hippocampus (Fig. 1E) and cortex (Glynn et al., 2011; Elmer et al., 2013). MHCI expression increases in aging and diseased neurons (Edström et al., 2004; Sinkus et al., 2013; Yang et al., 2013), and when MHCI levels are experimentally increased, cortical synapse density decreases (Glynn et al., 2011; Elmer et al., 2013). The transcription factor MEF2 (myocyte enhancer factor 2), a negative regulator of synapse density (Flavell et al., 2006), is required for these experimentally elevated MHCI levels to reduce cortical synapse density. However, MEF2 is not required for normal levels of MHCI to regulate synapse number, because inhibiting MEF2 does not increase synapse density in WT cortical neurons (Elmer et al., 2013). Thus, MHCI can negatively regulate synapse density via two partially distinct molecular pathways: higher-than-normal MHCI levels exaggerate the synapse-inhibiting effects of MEF2 to impair synaptic connectivity, while normal levels of MHCI limit the synapse-promoting effects of the insulin receptor, ensuring that synapses are established in appropriate quantities.
The current results suggest that synapse number may be elevated in β2m−/−TAP−/− animals in other regions of the brain that express insulin receptors, including cerebral cortex (data not shown). Indeed, synapse number is elevated in neonatal mixed cortical cultures and adult cortical slices from β2m-deficient animals (Glynn et al., 2011). Thus, MHCI-dependent control of synapse number is not hippocampus specific, but also defines connectivity in other regions of the developing and adult brain. Reduced cell surface MHCI expression in β2m−/−TAP−/− and Kb−/−D b−/− animals is associated with reduced axon pruning in the lateral geniculate nucleus (LGN; Huh et al., 2000; Datwani et al., 2009; Lee et al., 2014), suggesting that MHCI normally limits synapse number in the LGN, and perhaps elsewhere, by promoting synapse elimination.
Our coimmunoprecipitation results (Fig. 2B) suggest that insulin receptors interact with a subset of the MHCI proteins expressed in mouse brain. Spatial specificity conferred by the overlap of these particular MHCI proteins and insulin receptors may explain why synapse density is altered in MHCI-deficient mice, while several other processes that are influenced by neuronal insulin signaling, including food intake, body weight, and life span (Brüning et al., 2000), are indistinguishable from WT (Fig. 6D–F). Generally, the nonimmune functions of MHCI may be restricted to cell populations that express the appropriate MHCI-binding partner combinations.
Our immunostaining results suggest that the C19 antibody may specifically detect the population of insulin receptors that is capable of insulin-stimulated responses, as a result of their association with MHCI. How does the loss of MHCI occlude a cytoplasmic epitope of the insulin receptor? The epitope is not occluded by insulin receptor phosphorylation, since triggering insulin receptor phosphorylation does not occlude it in WT neurons (Fig. 7A,B). Instead, occlusion most likely reflects an MHCI-dependent change in the cytoplasmic structure of the insulin receptor, perhaps analogous to cytoplasmic changes that are triggered by extracellular insulin binding. Cocrystalization of the MHCI–insulin receptor complex could ultimately help identify the sites in both proteins that mediate their interaction, and provide insights into the consequences of this interaction for the structural dynamics of the insulin receptor. It will also be of interest to determine how MHCI-dependent conformational changes in the insulin receptor influence other aspects of the complex, branching signal transduction cascades that mediate different cellular readouts of insulin receptor activation in neuronal and non-neuronal cell types.
Two separate lines of evidence suggest that MHCI can influence neuronal insulin receptor function in a non-cell-autonomous manner. First, insulin receptors and MHCI do not colocalize in the hippocampus, but are expressed in closely apposed cellular domains (Fig. 4E). Second, insulin receptor β (C19) immunolabeling is rescued in MHCI-deficient neurons when cocultured with WT MHCI-expressing neurons (Fig. 5). Remarkably, WT neurons rescue the MHCI-sensitive epitope of the insulin receptor throughout MHCI-deficient neurons, not simply at sites of physical contact, suggesting that this rescue may be mediated by soluble factors released by WT neurons in a paracrine manner. One possibility is that β2m, the soluble light chain required for stable cell surface expression of many MHCI proteins, may be released by WT neurons or glia, stabilizing MHCI on the cell surface in β2m−/−TAP−/− neurons. However, soluble β2m does not restore C19 immunolabeling in pure β2m−/−TAP−/− cultures (Fig. 7C), suggesting that this is unlikely. It is also unlikely that secreted insulin is responsible, since insulin levels in CSF and serum are normal in β2m−/−TAP−/− animals (Fig. 6B,C), and applying insulin to WT neurons does not disrupt C19 binding (Fig. 7A,B). Some MHCI proteins contain extracellular α- and γ-secretase cleavage sites (Carey et al., 2007), raising the possibility that MHCI itself, released from WT neurons, could mediate the rescue of insulin receptor immunostaining in cocultured MHCI-deficient cells. Alternatively, local MHCI–insulin receptor interactions might induce cell-wide changes in intracellular second messengers that modify insulin receptor conformation. Together, the current results support a model in which neuronal MHCI can modify insulin receptor conformation and insulin sensitivity in a non-cell-autonomous manner.
This non-cell-autonomous effect of MHCI on insulin receptors is surprising in light of the fact that insulin receptors coprecipitate MHCI (Fig. 2B). There are several possible explanations for this apparent contradiction. First, our cocultures show that MHCI can influence insulin receptors in trans, but do not rule out the possibility that cis-interactions can occur in WT neurons. Second, MHCI and insulin receptors have large extracellular domains, and could potentially make direct physical contact in trans, analogous to trans-synaptic neuroligin–neurexin interactions in neurons, or MHCI–immunoreceptor interactions at the immunological synapse. Third, the MHCI–insulin receptor macromolecular complex isolated from brain lysates may include additional bridging proteins that span the gap between two neurons. These studies show that endogenous MHCI forms a macromolecular complex with insulin receptors, is expressed near insulin receptor-positive neurons, and can rescue insulin receptor conformation in trans.
The tonic insulin receptor activation observed in MHCI-deficient animals suggests that endogenous MHCI normally inhibits activation of the insulin receptor in the presence of relatively low, basal levels of insulin. Activation in the absence of ligand is a predicted feature of allosterically activated transmembrane receptors like the insulin receptor (Monod et al., 1965; Changeux and Edelstein, 2005). These receptors are thought to spontaneously interconvert between inactive and active states (Monod et al., 1965; Hubbard and Miller, 2007; De Meyts et al., 2009). In this model, ligand stabilizes an active conformation of the receptor, while another external factor is required to stabilize the unliganded receptor in an inactive conformation. Maintaining receptors in an inactive state when ligand levels are low is critical for cellular health and homeostasis. Indeed, mutations that increase the constitutive activity of receptors have been implicated in a number of neuropsychiatric disorders, and drugs that stabilize constitutively active receptors in their inactive conformation, termed inverse agonists, have been explored for their therapeutic potential (Bond and Ijzerman, 2006; Rodríguez-Puertas and Barreda-Gomez, 2006; Berg et al., 2008). Our studies indicate that endogenous MHCI limits constitutive activation of neuronal insulin receptors when insulin levels are relatively low. MHCI can form a macromolecular complex with insulin receptors in liver cell membranes (Chvatchko et al., 1983; Fehlmann et al., 1985; Phillips et al., 1986; Liegler et al., 1991), suggesting that MHCI might similarly regulate insulin receptor conformation and function outside the nervous system.
Here we show that MHCI regulates insulin signaling and synapse number in the developing, healthy brain. One open question is whether similar mechanisms contribute to pathological changes in insulin responsiveness and synapse number in the aging or diseased brain. By increasing the threshold for insulin receptor activation, MHCI ensures that dynamic insulin sensitivity is preserved, even on a background of basal circulating insulin. Neurons with reduced cell surface MHCI are profoundly insulin insensitive at the level of the receptor, due to ongoing tonic insulin receptor activation (Fig. 1A,B). Neuronal insulin insensitivity is associated with neuropathology and cognitive decline in individuals with Alzheimer's disease, normal aging, and type II diabetes (Gispen and Biessels, 2000; Biessels et al., 2002; Craft and Watson, 2004). Changes in the expression of inflammatory mediators are also prominent in these states, although their causal importance in disrupting the neuronal insulin response remains unclear (Akiyama et al., 2000; Terao et al., 2002; Monsonego and Weiner, 2003; Alexandraki et al., 2006; Weiner and Frenkel, 2006; Parachikova et al., 2007; Tilg and Moschen, 2008). The current results raise the possibility that inflammation-associated changes in neuronal MHCI levels could disrupt both neuronal insulin sensitivity and synaptic connectivity by dysregulating insulin receptor signaling.
Footnotes
This work was supported in part by the Whitehall Foundation, the Sloan Foundation, Cure Autism Now, the Princeton Neuroscience Institute Innovation Award, and the Silvio Varon Chair in Neuroregeneration (L.M.B.); Autism Speaks (L.F. and L.M.B.); the New Jersey Commission on Brain Injury Research (C.M.T. and L.M.B.), and the National Science Foundation (T.J.D.-S.). We thank R. Patel, J. Bosze, T. Burks, and T. Cheng for technical assistance; and D. Raulet, C.J. Shatz, H. Ploegh, A. Ghosh, and C. Ronald Kahn for graciously providing mice. We also thank C. Murphy, J. Gleeson, C. Davenport, and M. McDonald for helpful comments on the manuscript.
The authors declare no competing financial interests.
References
- Abbott MA, Wells DG, Fallon JR. The insulin receptor tyrosine kinase substrate p58/53 and the insulin receptor are components of CNS synapses. J Neurosci. 1999;19:7300–7308. doi: 10.1523/JNEUROSCI.19-17-07300.1999. [DOI] [PMC free article] [PubMed] [Google Scholar]
- Akiyama H, Barger S, Barnum S, Bradt B, Bauer J, Cole GM, Cooper NR, Eikelenboom P, Emmerling M, Fiebich BL, Finch CE, Frautschy S, Griffin WS, Hampel H, Hull M, Landreth G, Lue L, Mrak R, Mackenzie IR, McGeer PL, et al. Inflammation and Alzheimer's disease. Neurobiol Aging. 2000;21:383–421. doi: 10.1016/S0197-4580(00)00124-X. [DOI] [PMC free article] [PubMed] [Google Scholar]
- Alexandraki K, Piperi C, Kalofoutis C, Singh J, Alaveras A, Kalofoutis A. Inflammatory process in type 2 diabetes: the role of cytokines. Ann N Y Acad Sci. 2006;1084:89–117. doi: 10.1196/annals.1372.039. [DOI] [PubMed] [Google Scholar]
- Baron-Van Evercooren A, Olichon-Berthe C, Kowalski A, Visciano G, Van Obberghen E. Expression of IGF-I and insulin receptor genes in the rat central nervous system: a developmental, regional, and cellular analysis. J Neurosci Res. 1991;28:244–253. doi: 10.1002/jnr.490280212. [DOI] [PubMed] [Google Scholar]
- Baudler S, Baumgartl J, Hampel B, Buch T, Waisman A, Snapper CM, Krone W, Brüning JC. Insulin-like growth factor-1 controls type 2 T cell-independent B cell response. J Immunol. 2005;174:5516–5525. doi: 10.4049/jimmunol.174.9.5516. [DOI] [PubMed] [Google Scholar]
- Berg KA, Harvey JA, Spampinato U, Clarke WP. Physiological and therapeutic relevance of constitutive activity of 5-HT 2A and 5-HT 2C receptors for the treatment of depression. Prog Brain Res. 2008;172:287–305. doi: 10.1016/S0079-6123(08)00914-X. [DOI] [PubMed] [Google Scholar]
- Biessels GJ, van der Heide LP, Kamal A, Bleys RL, Gispen WH. Ageing and diabetes: implications for brain function. Eur J Pharmacol. 2002;441:1–14. doi: 10.1016/s0014-2999(02)01486-3. [DOI] [PubMed] [Google Scholar]
- Bond RA, Ijzerman AP. Recent developments in constitutive receptor activity and inverse agonism, and their potential for GPCR drug discovery. Trends Pharmacol Sci. 2006;27:92–96. doi: 10.1016/j.tips.2005.12.007. [DOI] [PubMed] [Google Scholar]
- Brüning JC, Gautam D, Burks DJ, Gillette J, Schubert M, Orban PC, Klein R, Krone W, Müller-Wieland D, Kahn CR. Role of brain insulin receptor in control of body weight and reproduction. Science. 2000;289:2122–2125. doi: 10.1126/science.289.5487.2122. [DOI] [PubMed] [Google Scholar]
- Bryceson YT, Foster JA, Kuppusamy SP, Herkenham M, Long EO. Expression of a killer cell receptor-like gene in plastic regions of the central nervous system. J Neuroimmunol. 2005;161:177–182. doi: 10.1016/j.jneuroim.2004.11.018. [DOI] [PubMed] [Google Scholar]
- Carey BW, Kim DY, Kovacs DM. Presenilin/gamma-secretase and alpha-secretase-like peptidases cleave human MHC Class I proteins. Biochem J. 2007;401:121–127. doi: 10.1042/BJ20060847. [DOI] [PMC free article] [PubMed] [Google Scholar]
- Chacon MA, Boulanger LM. MHCI protein is expressed by neurons and neural progenitors in mid-gestation mouse brain. Mol Cell Neurosci. 2013;52:117–127. doi: 10.1016/j.mcn.2012.11.004. [DOI] [PubMed] [Google Scholar]
- Changeux JP, Edelstein SJ. Allosteric mechanisms of signal transduction. Science. 2005;308:1424–1428. doi: 10.1126/science.1108595. [DOI] [PubMed] [Google Scholar]
- Chiu SL, Chen CM, Cline HT. Insulin receptor signaling regulates synapse number, dendritic plasticity, and circuit function in vivo. Neuron. 2008;58:708–719. doi: 10.1016/j.neuron.2008.04.014. [DOI] [PMC free article] [PubMed] [Google Scholar]
- Chvatchko Y, Van Obberghen E, Kiger N, Fehlmann M. Immunoprecipitation of insulin receptors by antibodies against Class 1 antigens of the murine H-2 major histocompatibility complex. FEBS Lett. 1983;163:207–211. doi: 10.1016/0014-5793(83)80820-5. [DOI] [PubMed] [Google Scholar]
- Corriveau RA, Huh GS, Shatz CJ. Regulation of class I MHC gene expression in the developing and mature CNS by neural activity. Neuron. 1998;21:505–520. doi: 10.1016/S0896-6273(00)80562-0. [DOI] [PubMed] [Google Scholar]
- Craft S, Watson GS. Insulin and neurodegenerative disease: shared and specific mechanisms. Lancet Neurol. 2004;3:169–178. doi: 10.1016/S1474-4422(04)00681-7. [DOI] [PubMed] [Google Scholar]
- Datwani A, McConnell MJ, Kanold PO, Micheva KD, Busse B, Shamloo M, Smith SJ, Shatz CJ. Classical MHCI molecules regulate retinogeniculate refinement and limit ocular dominance plasticity. Neuron. 2009;64:463–470. doi: 10.1016/j.neuron.2009.10.015. [DOI] [PMC free article] [PubMed] [Google Scholar]
- De Meyts P, Gauguin L, Svendsen AM, Sarhan M, Knudsen L, Nøhr J, Kiselyov VV. Structural basis of allosteric ligand-receptor interactions in the insulin/relaxin peptide family: implications for other receptor tyrosine kinases and G-protein-coupled receptors. Ann N Y Acad Sci. 2009;1160:45–53. doi: 10.1111/j.1749-6632.2009.03837.x. [DOI] [PubMed] [Google Scholar]
- Due C, Simonsen M, Olsson L. The major histocompatibility complex class I heavy chain as a structural subunit of the human cell membrane insulin receptor: implications for the range of biological functions of histocompatibility antigens. Proc Natl Acad Sci U S A. 1986;83:6007–6011. doi: 10.1073/pnas.83.16.6007. [DOI] [PMC free article] [PubMed] [Google Scholar]
- Edidin M, Reiland J. Dynamic measurements of the associations between class I MHC antigens and insulin receptors. Mol Immunol. 1990;27:1313–1317. doi: 10.1016/0161-5890(90)90036-Y. [DOI] [PubMed] [Google Scholar]
- Edström E, Kullberg S, Ming Y, Zheng H, Ulfhake B. MHCI, beta2 microglobulin, and the INF-gamma receptor are upregulated in aged motoneurons. J Neurosci Res. 2004;78:892–900. doi: 10.1002/jnr.20341. [DOI] [PubMed] [Google Scholar]
- Elmer BM, Estes ML, Barrow SL, McAllister AK. MHCI requires MEF2 transcription factors to negatively regulate synapse density during development and in disease. J Neurosci. 2013;33:13791–13804. doi: 10.1523/JNEUROSCI.2366-13.2013. [DOI] [PMC free article] [PubMed] [Google Scholar]
- Entingh-Pearsall A, Kahn CR. Differential roles of the insulin and insulin-like growth factor-I (IGF-I) receptors in response to insulin and IGF-I. J Biol Chem. 2004;279:38016–38024. doi: 10.1074/jbc.M313201200. [DOI] [PubMed] [Google Scholar]
- Fehlmann M, Peyron JF, Samson M, Van Obberghen E, Brandenburg D, Brossette N. Molecular association between major histocompatibility complex class I antigens and insulin receptors in mouse liver membranes. Proc Natl Acad Sci U S A. 1985;82:8634–8637. doi: 10.1073/pnas.82.24.8634. [DOI] [PMC free article] [PubMed] [Google Scholar]
- Flavell SW, Cowan CW, Kim TK, Greer PL, Lin Y, Paradis S, Griffith EC, Hu LS, Chen C, Greenberg ME. Activity-dependent regulation of MEF2 transcription factors suppresses excitatory synapse number. Science. 2006;311:1008–1012. doi: 10.1126/science.1122511. [DOI] [PubMed] [Google Scholar]
- Fourgeaud L, Davenport CM, Tyler CM, Cheng TT, Spencer MB, Boulanger LM. MHCI modulates NMDA receptor function and AMPA receptor trafficking. Proc Natl Acad Sci U S A. 2010;107:22278–22283. doi: 10.1073/pnas.0914064107. [DOI] [PMC free article] [PubMed] [Google Scholar]
- Gispen WH, Biessels GJ. Cognition and synaptic plasticity in diabetes mellitus. Trends Neurosci. 2000;23:542–549. doi: 10.1016/S0166-2236(00)01656-8. [DOI] [PubMed] [Google Scholar]
- Glynn MW, Elmer BM, Garay PA, Liu XB, Needleman LA, El-Sabeawy F, McAllister AK. MHCI negatively regulates synapse density during the establishment of cortical connections. Nat Neurosci. 2011;14:442–451. doi: 10.1038/nn.2764. [DOI] [PMC free article] [PubMed] [Google Scholar]
- Goddard CA, Butts DA, Shatz CJ. Regulation of CNS synapses by neuronal MHCI. Proc Natl Acad Sci U S A. 2007;104:6828–6833. doi: 10.1073/pnas.0702023104. [DOI] [PMC free article] [PubMed] [Google Scholar]
- Havrankova J, Roth J, Brownstein M. Insulin receptors are widely distributed in the central nervous system of the rat. Nature. 1978;272:827–829. doi: 10.1038/272827a0. [DOI] [PubMed] [Google Scholar]
- Hubbard SR, Miller WT. Receptor tyrosine kinases: mechanisms of activation and signaling. Curr Opin Cell Biol. 2007;19:117–123. doi: 10.1016/j.ceb.2007.02.010. [DOI] [PMC free article] [PubMed] [Google Scholar]
- Huh GS, Boulanger LM, Du H, Riquelme PA, Brotz TM, Shatz CJ. Functional requirement for class I MHC in CNS development and plasticity. Science. 2000;290:2155–2159. doi: 10.1126/science.290.5499.2155. [DOI] [PMC free article] [PubMed] [Google Scholar]
- Jones MW, McHugh TJ. Updating hippocampal representations: CA2 joins the circuit. Trends Neurosci. 2011;34:526–535. doi: 10.1016/j.tins.2011.07.007. [DOI] [PubMed] [Google Scholar]
- Kar S, Seto D, Doré S, Chabot JG, Quirion R. Systemic administration of kainic acid induces selective time dependent decrease in [125I]insulin-like growth factor I, [125I]insulin-like growth factor II and [125I]insulin receptor binding sites in adult rat hippocampal formation. Neuroscience. 1997;80:1041–1055. doi: 10.1016/S0306-4522(97)00185-1. [DOI] [PubMed] [Google Scholar]
- Koevary SB, Lam V, Patsiopoulos G, Lake S. Accumulation of porcine insulin in the rat brain and cerebrospinal fluid following ocular application. J Ocul Pharmacol Ther. 2003;19:377–384. doi: 10.1089/108076803322279435. [DOI] [PubMed] [Google Scholar]
- Lee CC, Huang CC, Hsu KS. Insulin promotes dendritic spine and synapse formation by the PI3K/Akt/mTOR and Rac1 signaling pathways. Neuropharmacology. 2011;61:867–879. doi: 10.1016/j.neuropharm.2011.06.003. [DOI] [PubMed] [Google Scholar]
- Lee H, Brott BK, Kirkby LA, Adelson JD, Cheng S, Feller MB, Datwani A, Shatz CJ. Synapse elimination and learning rules co-regulated by MHCI H2-D. Nature. 2014;509:195–200. doi: 10.1038/nature13154. [DOI] [PMC free article] [PubMed] [Google Scholar]
- Lidman O, Olsson T, Piehl F. Expression of nonclassical MHCI (RT1-U) in certain neuronal populations of the central nervous system. Eur J Neurosci. 1999;11:4468–4472. doi: 10.1046/j.1460-9568.1999.00904.x. [DOI] [PubMed] [Google Scholar]
- Liegler T, Szollosi J, Hyun W, Goodenow RS. Proximity measurements between H-2 antigens and the insulin receptor by fluorescence energy transfer: evidence that a close association does not influence insulin binding. Proc Natl Acad Sci U S A. 1991;88:6755–6759. doi: 10.1073/pnas.88.15.6755. [DOI] [PMC free article] [PubMed] [Google Scholar]
- Ljunggren HG, Van Kaer L, Sabatine MS, Auchincloss H, Jr, Tonegawa S, Ploegh HL. MHCI expression and CD8+ T cell development in TAP1/beta 2-microglobulin double mutant mice. Int Immunol. 1995;7:975–984. doi: 10.1093/intimm/7.6.975. [DOI] [PubMed] [Google Scholar]
- Man HY, Lin JW, Ju WH, Ahmadian G, Liu L, Becker LE, Sheng M, Wang YT. Regulation of AMPA receptor-mediated synaptic transmission by clathrin-dependent receptor internalization. Neuron. 2000;25:649–662. doi: 10.1016/S0896-6273(00)81067-3. [DOI] [PubMed] [Google Scholar]
- Monod J, Wyman J, Changeux JP. On the nature of allosteric transitions: a plausible model. J Mol Biol. 1965;12:88–118. doi: 10.1016/S0022-2836(65)80285-6. [DOI] [PubMed] [Google Scholar]
- Monsonego A, Weiner HL. Immunotherapeutic approaches to Alzheimer's disease. Science. 2003;302:834–838. doi: 10.1126/science.1088469. [DOI] [PubMed] [Google Scholar]
- Needleman LA, Liu XB, El-Sabeawy F, Jones EG, McAllister AK. MHCI molecules are present both pre- and postsynaptically in the visual cortex during postnatal development and in adulthood. Proc Natl Acad Sci U S A. 2010;107:16999–17004. doi: 10.1073/pnas.1006087107. [DOI] [PMC free article] [PubMed] [Google Scholar]
- Neefjes JJ, Momburg F. Cell biology of antigen presentation. Curr Opin Immunol. 1993;5:27–34. doi: 10.1016/0952-7915(93)90077-6. [DOI] [PubMed] [Google Scholar]
- Nirogi R, Kandikere V, Mudigonda K, Bhyrapuneni G, Muddana N, Saralaya R, Benade V. A simple and rapid method to collect the cerebrospinal fluid of rats and its application for the assessment of drug penetration into the central nervous system. J Neurosci Methods. 2009;178:116–119. doi: 10.1016/j.jneumeth.2008.12.001. [DOI] [PubMed] [Google Scholar]
- Ojcius DM, Delarbre C, Kourilsky P, Gachelin G. MHC and MHC-related proteins as pleiotropic signal molecules. FASEB J. 2002;16:202–206. doi: 10.1096/fj.01-0758com. [DOI] [PubMed] [Google Scholar]
- Okabe M, Ikawa M, Kominami K, Nakanishi T, Nishimune Y. “Green mice” as a source of ubiquitous green cells. FEBS Lett. 1997;407:313–319. doi: 10.1016/S0014-5793(97)00313-X. [DOI] [PubMed] [Google Scholar]
- Osawa H, Herrmann T, Diamantstein T. Inhibition of IL 2-dependent proliferation of rat T lymphoblasts by the monoclonal antibody ART62 which reacts with MHC class 1 antigens. J Immunol. 1985;134:3901–3906. [PubMed] [Google Scholar]
- Parachikova A, Agadjanyan MG, Cribbs DH, Blurton-Jones M, Perreau V, Rogers J, Beach TG, Cotman CW. Inflammatory changes parallel the early stages of Alzheimer disease. Neurobiol Aging. 2007;28:1821–1833. doi: 10.1016/j.neurobiolaging.2006.08.014. [DOI] [PMC free article] [PubMed] [Google Scholar]
- Phillips ML, Moule ML, Delovitch TL, Yip CC. Class I histocompatibility antigens and insulin receptors: evidence for interactions. Proc Natl Acad Sci U S A. 1986;83:3474–3478. doi: 10.1073/pnas.83.10.3474. [DOI] [PMC free article] [PubMed] [Google Scholar]
- Rammensee HG, Falk K, Rötzschke O. Peptides naturally presented by MHCI molecules. Annu Rev Immunol. 1993;11:213–244. doi: 10.1146/annurev.iy.11.040193.001241. [DOI] [PubMed] [Google Scholar]
- Ranheim T, Dumke C, Schueler KL, Cartee GD, Attie AD. Interaction between BTBR and C57BL/6J genomes produces an insulin resistance syndrome in (BTBR x C57BL/6J) F1 mice. Arterioscler Thromb Vasc Biol. 1997;17:3286–3293. doi: 10.1161/01.ATV.17.11.3286. [DOI] [PubMed] [Google Scholar]
- Ribic A, Flügge G, Schlumbohm C, Mätz-Rensing K, Walter L, Fuchs E. Activity-dependent regulation of MHCI expression in the developing primary visual cortex of the common marmoset monkey. Behav Brain Funct. 2011;7:1. doi: 10.1186/1744-9081-7-1. [DOI] [PMC free article] [PubMed] [Google Scholar]
- Rodríguez-Puertas R, Barreda-Gómez G. Development of new drugs that act through membrane receptors and involve an action of inverse agonism. Recent Pat CNS Drug Discov. 2006;1:207–217. doi: 10.2174/157488906777452730. [DOI] [PubMed] [Google Scholar]
- Schott E, Bonasio R, Ploegh HL. Elimination in vivo of developing T cells by natural killer cells. J Exp Med. 2003;198:1213–1224. doi: 10.1084/jem.20030918. [DOI] [PMC free article] [PubMed] [Google Scholar]
- Shi SR, Cote RJ, Taylor CR. Antigen retrieval techniques: current perspectives. J Histochem Cytochem. 2001;49:931–937. doi: 10.1177/002215540104900801. [DOI] [PubMed] [Google Scholar]
- Sinkus ML, Adams CE, Logel J, Freedman R, Leonard S. Expression of immune genes on chromosome 6p21.3–22.1 in schizophrenia. Brain Behav Immun. 2013;32:51–62. doi: 10.1016/j.bbi.2013.01.087. [DOI] [PMC free article] [PubMed] [Google Scholar]
- Sosa L, Dupraz S, Laurino L, Bollati F, Bisbal M, Cáceres A, Pfenninger KH, Quiroga S. IGF-1 receptor is essential for the establishment of hippocampal neuronal polarity. Nat Neurosci. 2006;9:993–995. doi: 10.1038/nn1742. [DOI] [PubMed] [Google Scholar]
- Syken J, Shatz CJ. Expression of T cell receptor beta locus in central nervous system neurons. Proc Natl Acad Sci U S A. 2003;100:13048–13053. doi: 10.1073/pnas.1735415100. [DOI] [PMC free article] [PubMed] [Google Scholar]
- Syken J, Grandpre T, Kanold PO, Shatz CJ. PirB restricts ocular-dominance plasticity in visual cortex. Science. 2006;313:1795–1800. doi: 10.1126/science.1128232. [DOI] [PubMed] [Google Scholar]
- Terao A, Apte-Deshpande A, Dousman L, Morairty S, Eynon BP, Kilduff TS, Freund YR. Immune response gene expression increases in the aging murine hippocampus. J Neuroimmunol. 2002;132:99–112. doi: 10.1016/s0165-5728(02)00317-x. [DOI] [PubMed] [Google Scholar]
- Tilg H, Moschen AR. Inflammatory mechanisms in the regulation of insulin resistance. Mol Med. 2008;14:222–231. doi: 10.2119/2007-00119.Tilg. [DOI] [PMC free article] [PubMed] [Google Scholar]
- Tomioka M, Adachi T, Suzuki H, Kunitomo H, Schafer WR, Iino Y. The insulin/PI 3-kinase pathway regulates salt chemotaxis learning in Caenorhabditis elegans. Neuron. 2006;51:613–625. doi: 10.1016/j.neuron.2006.07.024. [DOI] [PubMed] [Google Scholar]
- Tomlinson DR, Gardiner NJ. Glucose neurotoxicity. Nat Rev Neurosci. 2008;9:36–45. doi: 10.1038/nrn2294. [DOI] [PubMed] [Google Scholar]
- Van Kaer L, Ashton-Rickardt PG, Ploegh HL, Tonegawa S. TAP1 mutant mice are deficient in antigen presentation, surface class I molecules, and CD4–8+ T cells. Cell. 1992;71:1205–1214. doi: 10.1016/S0092-8674(05)80068-6. [DOI] [PubMed] [Google Scholar]
- Vugmeyster Y, Glas R, Pérarnau B, Lemonnier FA, Eisen H, Ploegh H. Major histocompatibility complex (MHC) class I KbDb −/− deficient mice possess functional CD8+ T cells and natural killer cells. Proc Natl Acad Sci U S A. 1998;95:12492–12497. doi: 10.1073/pnas.95.21.12492. [DOI] [PMC free article] [PubMed] [Google Scholar]
- Wan Q, Xiong ZG, Man HY, Ackerley CA, Braunton J, Lu WY, Becker LE, MacDonald JF, Wang YT. Recruitment of functional GABA(A) receptors to postsynaptic domains by insulin. Nature. 1997;388:686–690. doi: 10.1038/41792. [DOI] [PubMed] [Google Scholar]
- Weiner HL, Frenkel D. Immunology and immunotherapy of Alzheimer's disease. Nat Rev Immunol. 2006;6:404–416. doi: 10.1038/nri1843. [DOI] [PubMed] [Google Scholar]
- White MF, Kahn CR. The insulin signaling system. J Biol Chem. 1994;269:1–4. [PubMed] [Google Scholar]
- Yang YM, Shang DS, Zhao WD, Fang WG, Chen YH. Microglial TNF-alpha-dependent elevation of MHCI expression on brain endothelium induced by amyloid-beta promotes T cell transendothelial migration. Neurochem Res. 2013;38:2295–2304. doi: 10.1007/s11064-013-1138-5. [DOI] [PubMed] [Google Scholar]
- Zhao W, Chen H, Xu H, Moore E, Meiri N, Quon MJ, Alkon DL. Brain insulin receptors and spatial memory. Correlated changes in gene expression, tyrosine phosphorylation, and signaling molecules in the hippocampus of water maze trained rats. J Biol Chem. 1999;274:34893–34902. doi: 10.1074/jbc.274.49.34893. [DOI] [PubMed] [Google Scholar]
- Zijlstra M, Li E, Sajjadi F, Subramani S, Jaenisch R. Germ-line transmission of a disrupted beta 2-microglobulin gene produced by homologous recombination in embryonic stem cells. Nature. 1989;342:435–438. doi: 10.1038/342435a0. [DOI] [PubMed] [Google Scholar]
- Zohar O, Reiter Y, Bennink JR, Lev A, Cavallaro S, Paratore S, Pick CG, Brooker G, Yewdell JW. Cutting edge: MHCI-Ly49 interaction regulates neuronal function. J Immunol. 2008;180:6447–6451. doi: 10.4049/jimmunol.180.10.6447. [DOI] [PMC free article] [PubMed] [Google Scholar]