

Highlight
Morphological, physiological, and proteomic analysis of two cassava cultivars revealed two different strategies under drought stress: one adapted a ‘survival first’ strategy, whereas the other opted for continued growth.
Key words: Cassava, cyanogenic glycosides, drought-responsive protein, drought tolerance, proteomics, stress response.
Abstract
Cassava is one of the most drought-tolerant crops, however, the underlying mechanism for its ability to survive and produce under drought remains obscure. In this study, two cassava cultivars, SC124 and Arg7, were treated by gradually reducing the soil water content. Their responses to the drought stress were examined through their morphological and physiological traits and isobaric tags for relative and absolute quantitation (iTRAQ)-based proteomic analysis. SC124 plants adapted a ‘survival’ mode under mild drought stress as evidenced by early stomatal closure and a reduction in the levels of various photosynthetic proteins and photosynthetic capacity, resulting in early growth quiescence. In contrast, Arg7 plants underwent senescence of older leaves but continued to grow, although at a reduced rate, under mild drought. SC124 plants were more capable of surviving prolonged severe drought than Arg7. The iTRAQ analysis identified over 5000 cassava proteins. Among the drought-responsive proteins identified in the study were an aquaporin, myo-inositol 1-phosphate synthases, and a number of proteins involved in the antioxidant systems and secondary metabolism. Many proteins that might play a role in signalling or gene regulation were also identified as drought-responsive proteins, which included several protein kinases, two 14-3-3 proteins, several RNA-binding proteins and transcription factors, and two histone deacetylases. Our study also supports the notion that linamarin might play a role in nitrogen reallocation in cassava under drought.
Introduction
Cassava (Manihot esculenta Crantz), a perennial root crop, is the sixth most important crop in terms of global annual production (El-Sharkawy, 2004). Cassava is particularly important as a staple food crop in the tropical and subtropical areas in Africa, Asia, and South America where drought and poor soil fertility are the main constraints that limit crop productivity, owing to its ability to survive and produce under these adverse environments.
Plants have evolved complex mechanisms to sense water availability in environments and reprogramme their metabolism and growth in response to drought stress, leading to a variety of physiological, biochemical, and morphological changes at molecular and whole-plant levels (McDowell et al., 2008; Claeys and Inze, 2013). These include stomatal closure, deepened root systems, reduced shoot growth, leaf senescence, and dormancy. Many traits that are beneficial for survival under severe drought stress might not be advantageous for crop production under moderate drought (Lopes et al., 2011; Tardieu, 2012). For plant breeding and genetic engineering, it is important to balance traits for survival and growth under drought stress. Understanding the mechanism for regulating growth during drought stress is an essential step towards achieving the goal.
Extensive molecular and genetics studies in the last two decades have significantly contributed to our understanding of how plants survive and grow under drought stress. Various genes and pathways have been identified that contribute to enhanced tolerance to water deficiency. Well-known stress tolerance mechanisms include osmotic adjustment, abscisic acid biosynthesis and its signalling pathways leading to stomatal closure and other tolerance mechanisms mediated through various second messengers, and transcriptional and post-transcriptional regulation that leads to activation of various drought-tolerance-related functional genes (Xiong et al., 2002; Golldack et al., 2014). A number of genes encoding transcription factors and other drought stress-related proteins have been used for genetic engineering plants for enhanced drought tolerance (Umezawa et al., 2006; Tollefson, 2011). Genome-wide analysis, such as transcriptomics and proteomics technology, has enabled plant biologists to unravel molecular events in drought stress responses at a global scale (Shinozaki and Yamaguchi-Shinozaki, 2007; Mohammadi et al., 2014).
Although cassava is one of the most drought-tolerant crops, the mechanism underlying its ability to survive and produce under drought remains elusive, partly due to the difficulty in employing molecular genetic tools for cassava research. Genomic tools have become increasingly available for studying cassava biology. A draft genome of a cassava cultivar is publicly available (Prochnik et al., 2012). Very recently, the genomes of another cassava cultivar and a wild ancestor were also sequenced (Wang et al., 2014). Using a microarray technique, Utsumi et al. (2012) identified drought-responsive cassava genes by comparing transcriptomes between in vitro plantlets growing in culture tubes and plantlets exposed to a low-humidity environment (50% relative humidity) for 1h (Utsumi et al., 2012). Gel-based and gel-free proteomics methods have been used to analyse proteins associated with cassava somatic embryogenesis, tuberous root formation, and post-harvesting physiological deterioration of cassava tuberous roots (Sheffield et al., 2006; Baba et al., 2008; Li et al., 2010; Owiti et al., 2011). However, there is a lack of proteome analysis on cassava plants’ responses to drought stress.
In this study, we report our findings on the different drought-tolerant mechanisms adapted by two cassava cultivars through phenotypic, physiological, and iTRAQ-based proteomic analysis of cassava plants under drought stress. The plants were treated by gradual reduction of soil water to resemble natural drought stress. One cultivar adapted a ‘survival first’ strategy, whereas the other underwent continued, although limited, growth under mild drought. The former was more capable of surviving prolonged severe drought than the latter. The proteomics analysis identified over 5000 different cassava proteins. The high coverage of the proteomes in our iTRAQ-based analysis allowed us to identify many relatively low-abundant drought-responsive proteins that might play regulatory roles in drought tolerance in cassava. Our study also suggests that linamarin could play a role in reallocating nitrogen during drought stress, particularly for plants that rely less on leaf senescence for nitrogen recycling.
Materials and methods
Plant materials
Two cassava cultivars, Argentina 7 (Arg7) and South China 124 (SC124), were used in the study. Cassava plants were propagated clonally from cuttings of parental stems with at least two nodes and 8cm in length. Plants were grown in plastic pots (25cm height×35cm diameter) in potting mix, which was made by mixing two parts latosolic red soil with one part sand. Two plants were grown in each pot: one Arg7 plant and one SC124 plant. The pots were placed in a non-air-conditioned glass house on the campus of the Chinese Academy of Tropical Agricultural Sciences (Haikou, China). The glass house was covered with a glass roof with a wall that was half open and half sealed with glass to allow air flow. The plants were grown from June to December 2013 during which time the local temperature ranged from 19 to 33 °C and the temperature in the glass house ranged from 20 to 38 °C. No supplementary light was used other than sunlight received in the glass house. The plants were watered with 2 l of tap water per pot two to three times every week and fertilized with a compound fertilizer (N:P:K=1:1:1).
Drought treatment
When the plants were 80 d old after planting the cuttings, they were treated by withholding water. Some pots of plants were rewatered after certain days of the drought treatment as indicated in the experimental results to determine their recovery rates after the stress and for analysis of root proteomes in response to rewatering. The control plants kept receiving water as normal.
Plant tissue collection
For the proteome analysis and linamarin measurement, leaves and roots were harvested at the specified days after the initiation of drought treatment (withholding water). Roots were also harvested from rewatered plants following the drought treatment. From each plant, three leaves (leaves 4, 5, and 6 counting from the top of a plant) were collected. These three leaves were fully or nearly fully expanded. In this way, we excluded older senescing leaves (mainly in the Arg7 plants), which might have very different proteomes and other compositions from other leaves. For the root samples, all roots from a plant were collected and the roots were washed quickly in tap water to remove attached soil. Three biological replicates were generated for each treatment. Each replicate included leaf or root materials from at least five plants to reduce variations from different pots. The leaves and roots were frozen immediately in liquid nitrogen and stored in a –70 °C freezer for further analysis.
Protein extraction
Plant tissues were ground into powder in liquid nitrogen and the powder was mixed with extraction buffer (7M urea, 2M thiourea, 4% CHAPS, 40mM Tris/HCl, pH 8.5) containing 1mM PMSF and 2mM EDTA. After 5min, 10mM dithiothreitol (DTT; final concentration) was added to the samples. The suspension was sonicated at 200W for 15min and then centrifuged at 4 °C at 30 000g for 15min. The supernatant was removed and mixed well with 5 vols of chilled acetone containing 10% (v/v) trichloroacetic acid and incubated at –20 °C overnight. After centrifugation at 4 °C and 30 000g, the supernatant was discarded and the precipitate was washed with chilled acetone three times. The pellet was air dried and dissolved in the protein suspension buffer (7M urea, 2M thiourea, 4% NP-40, 20mM Tris/HCl, pH 8.0–8.5). The suspension was sonicated at 200W for 15min and centrifuged at 4 °C and 30 000g for 15min. The supernatant was transferred to another tube. To reduce disulfide bonds in the proteins, 10mM DTT (final concentration) was added to the protein solution and incubated at 56 °C for 1h. Subsequently, 55mM iodoacetamide (final concentration) was added to the solution, which was incubated for 1h to block reduced thiols in cysteines. The supernatant was mixed well with 5 vols of chilled acetone for 2h at –20 °C to precipitate proteins. After centrifugation at 4 °C and 30 000g, the supernatant was discarded and the pellet was air dried for 5min, dissolved in 500 μl of 0.5M TEAB (Applied Biosystems, Milan, Italy), and sonicated at 200W for 15min. Finally, samples were centrifuged at 4 °C and 30 000g for 15min. The supernatant was transferred to a new tube, quantified by the Bradford assay using BSA as a standard, and kept at –70 °C for further analysis.
iTRAQ labelling of the protein samples
Protein (100 μg) was taken out of each sample and digested with Trypsin Gold (Promega, Madison, WI, USA) at a ratio of protein:trypsin=30:1 at 37 °C for 16h. After trypsin digestion, the peptides were dried by vacuum centrifugation. The peptides were reconstituted in 25 μl of 0.5M TEAB and 60 μl of organic solvent and processed according to the manufacturer’s protocol for 8-plex iTRAQ reagent (Applied Biosystems). Briefly, one unit of iTRAQ reagent was thawed and reconstituted in 24 μl of isopropanol. The samples were labelled with different 8-plex iTRAQ isobaric tags and incubated at room temperature for 2h. The labelled peptide mixtures were then pooled and dried by vacuum centrifugation. The samples were labelled with the iTRAQ tags as follows (sample/isobaric tag): for the leaf samples, Arg7 control/113, SC124 control/116, Arg7 drought-treated/118, SC124 drought-treated/121; for the root samples, Arg7 control/113, SC124 control/114, Arg7 drought-treated/116, SC124 drought-treated/118, Arg7 rewatered/119, SC124 rewatered/121.
The four leaf samples labelled with the four different isobaric tags were pooled together; similarly the six root samples tagged with the six isobaric tags were combined. SCX chromatography was performed with an LC-20AB HPLC pump system (Shimadzu, Kyoto, Japan). The iTRAQ-labelled peptide mixtures were reconstituted with 4ml of buffer A (25mM NaH2PO4 in 25% acetonitrile, pH 2.7) and 4ml of the solution was loaded onto a 4.6×250mm Ultremex SCX column containing 5 μm particles (Phenomenex). The peptides were eluted at a flow rate of 1ml min–1 with a gradient of buffer A for 10min, 5–60% buffer B (25mM NaH2PO4, 1M KCl in 25% acetonitrile, pH 2.7) for 27min, and 60–100% buffer B for 1min. The system was then maintained at 100% buffer B for 1min before equilibrating with buffer A for 10min prior to the next injection. Elution was monitored by measuring the absorbance at 214nm, and fractions were collected every 1min. The eluted peptides were pooled into 20 fractions, each of which contained up to 20 μg (for the leaf samples) or 30 μg (for the root samples), and desalted with a Strata X C18 column (Phenomenex) and vacuum dried.
Liquid chromatography electrospray ionization tandem mass spectrometry (LC-ESI-MS/MS) analysis based on Q Exactive
Each fraction was resuspended in buffer A (2% acetonitrile, 0.1% formic acid) and centrifuged at 20 000g for 10min. The final concentration of peptide was approximately 0.5 μg μl–1. Ten microliters of supernatant was loaded onto an LC-20AD nanoHPLC (Shimadzu) by the autosampler onto a 2cm C18 trap column. The peptides were then eluted onto a 10cm analytical C18 column (inner diameter 75 μm) packed in house. The samples were loaded at 8 μl min–1 for 4min, and the 44min gradient was run at 300 nl min–1 starting from 2 to 35% B (98% acetonitrile, 0.1% formic acid), followed by a 2min linear gradient to 80%, maintained at 80% B for 4min, and finally returned to 5% in 1min. The peptides were subjected to nano-ESI followed by MS/MS in an Q Exactive (Thermo Fisher Scientific, San Jose, CA, USA) coupled online to high-performance LC (HPLC). Intact peptides were detected in the Orbitrap at a resolution of 70 000 full width at half maximum (FWHM). Peptides were selected for MS/MS using the high-energy collision dissociation operating mode with a normalized collision energy setting of 27.0, and ion fragments were detected in the Orbitrap at a resolution of 17 500 FWHM. A data-dependent procedure that alternated between one MS scan followed by 15 MS/MS scans was applied for the 15 most abundant precursor ions above a threshold ion count of 20 000 in the MS survey scan with a dynamic exclusion duration of 15 s. The electrospray voltage applied was 1.6kV. Automatic gain control was used to optimize the spectra generated by the Orbitrap. The automatic gain control target for full MS was 3e6 and 1e5 for MS2. For MS scans, the scan range was 350–2000 m/z. For MS2 scans, the scan range was 100–1800 m/z.
Mass spectrometer data analysis
Raw data files acquired from the Orbitrap were converted into MGF files using Proteome Discoverer 1.2 (Thermo Scientific) (5600ms converter) and the MGF files were searched. Protein identification was performed using the Mascot search engine (Matrix Science, London, UK; version 2.3.02) against the cassava genome database containing 33 113 annotated cassava proteins (http://www.phytozome.net/cassava.php).
For protein identification, a mass tolerance of 20 ppm was permitted for intact peptide masses and 0.05Da for fragmented ions, with allowance for one missed cleavage in the trypsin digests. Gln→pyro-Glu (N-term Q), Oxidation (M), and Deamidated (NQ) were set as the potential variable modifications, and Carbamidomethyl (C), iTRAQ 8plex (N-term), and iTRAQ 8plex (K) were set as fixed modifications. The charge states of peptides were set to +2 and +3. An automatic decoy database search was performed in Mascot (with a peptide false-discovery rate of <2%) by choosing the decoy checkbox in which a random sequence from the database was generated and tested for raw spectra as well as the real database. To reduce the probability of false peptide identification, only peptides with significance scores (≥20) at the 99% confidence interval by a Mascot probability analysis greater than ‘identity’ were counted as identified. For protein quantitation, it was required that a protein contained at least two identified unique peptides. The quantitative protein ratios were weighted and normalized by the median ratio from Mascot. For a comparison of differences in protein abundance, Student’s t-test was performed using log2-transformed ratios, followed by Benjamini–Hochberg correction.
Functional annotation of proteins
Functional annotation of proteins was conducted using the Blast2GO program against the non-redundant (nr) NCBI protein database. The KEGG database (http://www.genome.jp/kegg/) and the COG database (http://www.ncbi.nlm.nih.gov/COG/) were used to classify and group these identified proteins.
Linamarin measurement
Leaf numbers 4–6 of each plant (counting from the top) and whole roots were harvested at the indicated days after drought treatment. A half gram of tissue was ground in liquid nitrogen. The power was mixed with pre-warmed 80% methanol and transferred to a 50ml tube and boiled in a water bath for 30min. The mixture was centrifuged at 10 000g for 15min at 4 °C. The supernatant was transferred to a clean tube. One millilitre of the supernatant was dried in a 37 °C oven to remove the methanol and resuspended in 1ml of water. Analytical HPLC was carried out using a Waters e2695 (Waters Corp., Milford, USA) coupled to a 3300 Evaporative Light Scattering Detector (ELSD) (W. R. Grace and Company, Columbia, MD, USA) fitted with an Atlantis C18 column. The measurement was carried out according to previous reports (Siritunga and Sayre, 2003; Jorgensen et al., 2005).
Measurement of Fv/Fm
Ten pots of Arg7 and SC124 plants (one Arg7 and one SC124 plant per pot) were used to measure Fv/Fm, which measures chlorophyll fluorescence. Three leaves of each plant (nos 4–6 counting from the top of the plants) were measured at around 9:00 p.m. after 2h of dark treatment using a MINI-PAM Photosynthesis Yield Analyzer (Heinz Walz GmbH, Effeltrich, Germany) according to the manufacturer’s instruction and a previous report (Calatayud et al., 2000).
Measurement of stomatal aperture
Stomata of the fifth leaf of each plant (counting from the top) were collected at around 9:00 a.m. for measuring stomatal aperture. The sample processing and measurement were carried out using an FV-1000 Confocal Laser Scanning Microscope (Olympus) according to a previously reported method (Calatayud et al., 2000).
Results
Morphological and physiological responses of two cassava cultivars to drought stress
Two cassava cultivars, Arg7 and SC124, were used for comparison in this study. One Arg7 plant and one SC124 plant were planted in the same pot so that their responses to drought stress could be compared under essentially the same soil water level. Arg7 grew slightly bigger and taller than SC124 under normally irrigated conditions (Fig. 1A).
Fig. 1.
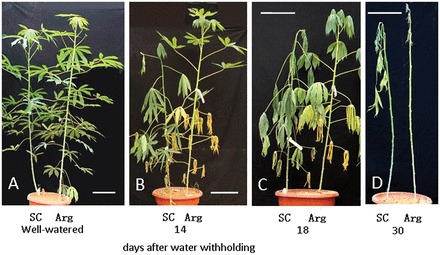
Morphological changes in cassava plants in response to drought. (A) Ninety-day-old Arg7 (Arg) and SC124 (SC) plants under the normal watering scheme. (B–D) Pictures of the plants were taken at 14, 18 and 30 d, respectively, after water withholding. Bars, 25cm. (This figure is available in colour at JXB online.)
When the plants were 80 d old (counting from the date of planting the stem cuttings), watering was stopped to initiate drought stress treatment. Onset of drought stress became apparent within 10 d after withholding water, but the symptoms were different between the two cultivars. The Arg7 plants started to show yellowing of older leaves but their young leaves remained turgid and green. In contrast, leaves of the SC124 plants displayed a wilting symptom but remained green. Figure 1B and C shows the plants at 14 and 18 d after withholding water, respectively. At d 14, many older leaves of Arg7 were yellowish but shoot growth continued, although at a reduced rate; however, the SC124 plants remained droopy and green and their growth had completely stopped (Fig. 1B and Supplementary Fig. S1 at JXB online). At d 18, several older leaves of Arg7 had dropped off and the plants also started to show wilting, whereas the SC124 plants remained green but droopy (Fig. 1C). Their growth quickly resumed following rewatering after 15 d of withholding water (Supplementary Fig. S1). When the plants were rewatered after 18 d of withholding water, all plants of both cultivars could still be recovered. After the plants were kept in non-watering conditions for an extended period, SC124 plants also dropped some leaves (Fig. 1D). After the plants had been unwatered for 35 d, no Arg7 plants were able to recover, whereas 67% of SC124 plants were able to revive after irrigation was resumed.
The stomatal apertures of the plants were measured during drought treatment. Six days after withholding water, the average stomatal aperture in the stressed SC124 leaves had dropped to approximately 1.3 µm compared with approximately 4.7 µm in normally irrigated plants, whereas the aperture of the stressed Arg7 leaves was around 3.5 µm (Supplementary Fig. S2 at JXB online). At 12 d after withholding water, the stomata of SC124 leaves were almost completely closed, whereas the stomatal aperture of the Arg7 plants dropped to below 3 µm. Stomatal closure is expected to hinder photosynthesis due to lack of CO2. From the ratio of Fv/Fm, which measures chlorophyll fluorescence to determine effects of the stress on photosystem II, it appeared that 5 d after withholding water, the SC124 plants started to show a more significant drop in the Fv/Fm ratio than Arg7 plants (Fig. 2). The reduction of Fv/Fm was progressive during the 18 d of measurement following water withholding. After that, the plants were rewatered and their Fv/Fm ratios started to return to a relatively normal level in a couple days.
Fig. 2.
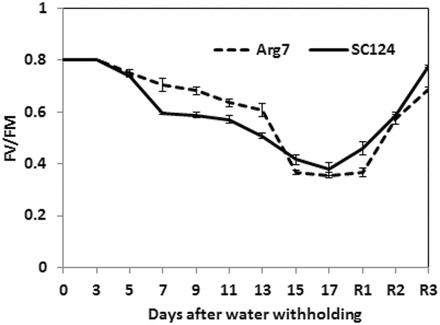
Fv/Fm ratios of cassava leaves measured after withholding water. The Fv/Fm ratios were determined in leaves of the plants at 0–18 d following withholding water. R1, R2, and R3 refer to 24, 48, and 72h after rewatering, following 18 d of withholding water. The data presented are means (n=10) ± standard error.
Proteome analysis of leaves and roots of the two cultivars in response to drought stress
To gain a global view of molecular responses to drought stress, we obtained the proteomes of leaves and roots from stressed and normally irrigated (control) plants of these two cultivars. As in the morphological and physiological analysis described above, one Arg7 plant and one SC124 plant were grown in each pot. The drought treatment was also the same as above. Leaves and roots were collected separately at d 14 after the beginning of withholding water, when the plants showed moderate drought stress judging from the morphological and physiological traits. Other pots of plants were rewatered and the roots were collected from the rewatered plants 24h later. For controls, leaves and roots were collected from plants that were the same age but were under the regular watering scheme. All tissue samples were collected around the same time (between 11:00 a.m. and noon). Each sample contained leaves or roots pooled from at least five plants per pot, and three biological replicates were generated for each treatment. Only three leaves (nos 4, 5, and 6 counting from the top of a plant) were collected from each plant to exclude older senescing leaves, which might have very different proteomes from other leaves. Following protein extraction and trypsin digestion, peptides from different tissue samples were tagged with different iTRAQ isobaric tags and identified and quantified using a Q Exactive™ Hybrid Quadrupole-Orbitrap Mass Spectrometer.
The peptides were searched against proteins derived from the cassava genome database (Prochnik et al., 2012). In total, 5445 unique proteins were identified and quantified, among which 3765 proteins were from the leaf samples and 4382 from the root samples. Supplementary Tables S1 and S2 (at JXB online) contain lists of all proteins identified from the iTRAQ analysis (including those identified from one replicate), their abundance differences and the P values in various comparisons between the samples, functional annotations, and the sequences of the identified peptides. Supplementary Table S1 lists those from the leaf samples and Supplementary Table S2 from the root samples. The ID numbers of these proteins are based on the cassava genome database (Prochnik et al., 2012). The differences in protein abundance (fold change) are based on comparisons between drought-stressed and normally watered plants of the same cultivar and between the two different cultivars. Among the proteins that showed a significant change (P<0.05) in abundance, we selected those whose levels differed by at least 1.67-fold as differentially expressed proteins for further analysis and discussion in this report. Supplementary Tables S3 and S4 (at JXB online) contain the lists of all leaf and root proteins, respectively, that were found differentially expressed in at least one of the comparisons. In these tables, a ratio of >1.67 and <0.6 indicates an increase and decrease by over 1.67-fold, respectively, in a comparison between a treatment sample and the control sample. It should be pointed out that, although we applied a 1.67-fold difference as the threshold for differentially expressed proteins for further analysis in this report, those proteins whose abundance change was less than 1.67 fold with a P value of <0.05 could also be truly differentially expressed.
Comparisons of leaf proteomes
Among the leaf proteins showing a >1.67-fold difference, 337 were found to be upregulated and 224 downregulated in the drought-stressed leaves compared with the control leaves for at least one of the two cultivars (Fig. 3A and Supplementary Table S3). In total, 102 proteins showed higher levels (Fig. 3A, red arrows) and 68 proteins showed lower levels (Fig. 3, green arrows) under drought conditions in both cultivars. The number of drought-responsive proteins was higher in SC124 (439) than in Arg7 (292), indicating that the difference between the stressed leaves and normal leaves was more pronounced in SC124 than in Arg7, which is consistent with the more pronounced differences in the morphological and physiological traits in the former under drought stress.
Fig. 3.
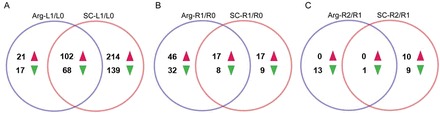
Venn diagrams showing the numbers of differentially expressed proteins. Up- and downregulated proteins in stressed leaves (A) and roots (B) and rewatered roots (C) of the two cultivars. The red arrowheads indicate upregulated proteins and the green arrowheads downregulated proteins. Arg-L1/L0 and SC-L1/L0, comparisons between control leaves and drought-stressed leaves of Arg7 and SC124, respectively; Arg-R1/R0 and SC-R1/R0, comparisons between control roots and drought-stressed roots of Arg7 and SC124, respectively; Arg-R2/R1 and SC-R2/R1, comparisons between drought-stressed roots and rewatered roots (24h after rewatering) of Arg7 and SC124, respectively. (This figure is available in colour at JXB online.)
Among the proteins showing a reduced level in the stressed leaves, the most common functional group was the proteins involved in primary metabolism. The drought-responsive proteins involved in photosynthesis were all found to be downregulated (except PsbP-1; see below) in the drought-stressed leaves compared with the control plants (Table 1 and Supplementary Table S3). These included the proteins/enzymes involved in the photosynthetic light reaction and electron transfer (such as chlorophyll A/B-binding protein and a few photosystem I and II subunits), carbon fixation (Rubisco activase), and the Calvin cycle (fructose-1,6-bisphosphatase and fructose-bisphosphate aldolase). These proteins were reduced by around 2-fold in the stressed SC124 leaves. They were also reduced in the stressed Arg7 leaves compared with their control plants but to a lesser extent (Table 1), further indicating that photosynthesis was affected more in SC124 than in Arg7 by the drought stress. However, PsbP-1, a component of photosystem II that is required for assembly/stability of the oxygen-evolving complex, was upregulated in the stressed leaves of both cultivars. The levels of many other primary metabolic enzymes such as a phosphoglycerate mutase involved in glycolysis and an aspartate aminotransferase and asparagine synthetase 1 involved in amino acid biosynthesis were also reduced in the drought-stressed leaves of both cultivars.
Table 1.
Changes in abundance of the leaf proteins involved in photosynthesis under droughtThese proteins were identified in all three replicates.
| Protein ID | Functional annotation | Arg-L1/L0a | SC-L1/L0a |
|---|---|---|---|
| 026789m | Fructose 1,6-bisphosphatase | 0.48±0.11 | 0.38±0.02 |
| 014243m | Fructose 1,6-bisphosphatase | 0.45±0.15 | 0.39±0.06 |
| 006796m | Rubisco activase | 0.55±0.07 | 0.40±0.04 |
| 013872m | Photosystem II PsbP family protein | 0.63±0.14 | 0.45±0.07 |
| 018830m | Photosystem II subunit R | 0.48±0.06 | 0.46±0.04 |
| 004991m | Chlorophyll a oxygenase | 0.59±0.08 | 0.46±0.02 |
| 032962m | Fructose-bisphosphate aldolase | 0.63±0.09 | 0.47±0.04 |
| 013547m | Carbonic anhydrase | 0.64±0.22 | 0.50±0.03 |
| 014906m | Chlorophyll A/B-binding protein | 0.84±0.16 | 0.51±0.08 |
| 018584m | Photosystem I subunit H-1 | 0.71±0.24 | 0.52±0.01 |
| 028060m | ATP synthase CF1α subunit | 0.68±0.16 | 0.55±0.01 |
| 024794m | Photosynthetic electron transfer B | 0.82±0.13 | 0.57±0.06 |
| 013714m | Chlorophyll A/B-binding protein | 0.88±0.27 | 0.59±0.05 |
| 014010m | Photosystem II PsbP-1 | 4.07±0.22 | 5.72±0.66 |
a Fold difference in protein abundance [±standard deviation (SD)] from the comparisons between
stressed (L1) and control (L0) leaves of Arg7 and SC124.
Table 2 lists the top 10 most strongly up- or downregulated proteins in the stressed leaves in the two cultivars. The proteins that were strongly up- or downregulated proteins in one cultivar were often strongly up- or downregulated, respectively, in the other cultivar, but with some exceptions (Table 2 and Supplementary Table S3). For instance, a linamarase, the cyanogenic glycoside breakdown enzyme, was the most strongly (20-fold) reduced protein in the stressed SC124 leaves but was not significantly changed in the Arg7 leaves in response to the stress.
Table 2.
Top 10 most strongly up- or downregulated proteins in stressed leaves of Arg7 and/or SC124Two proteins (027275m and 006649m) were identified in two of the three replicates, and the others in all three replicates.
| Protein ID | Functional annotation | Arg L1/L0a | SC L1/L0a | SC/Argb |
|---|---|---|---|---|
| 010809m | Anthocyanidin synthase | 17.04±7.04 | 5.53±3.79 | 0.32±0.34 |
| 027275m | Cytochrome b5 | 9.77±1.07 | 1.74±0.06 | 0.18±0.01 |
| 005857m | Myo-inositol 1-phosphate synthase | 8.26±2.61 | 4.59±1.7 | 0.56±0.19 |
| 004545m | Shikimate dehydrogenase | 5.76±3.11 | 2.88±0.93 | 0.50±0.19 |
| 005838m | Myo-inositol-1 phosphate synthase | 5.43±1.33 | 4.04±0.46 | 0.74±0.24 |
| 005332m$ | Shikimate dehydrogenase | 5.20±1.35 | 2.78±0.42 | 0.54±0.2 |
| 010212m | Flavanone 3-hydroxylase | 4.84±2.19 | 2.34±1.11 | 0.48±0.6 |
| 010750m | Cysteine protease | 4.37±1.59 | 6.00±1.11 | 1.37±0.35 |
| 014010m | Photosystem II PsbP-1 | 4.07±0.22 | 5.72±0.66 | 1.41±0.22 |
| 018205m | MLP-like protein | 4.07±1.9 | 7.51±1.31 | 1.85±0.86 |
| 009199m | Glutamine amidotransferase | 1.75±1.99 | 9.86±7.63 | 5.62±5.14 |
| 004971m | Microtubule-associated protein | 2.79±1.7 | 8.66±5.4 | 3.10±0.92 |
| 001871m | Sucrose synthase | 2.02±1.7 | 8.12±3.83 | 4.02±2.06 |
| 006591m | Chloroplast nucleoid DNA-binding protein-like | 3.17±1.92 | 7.82±0.99 | 2.47±1.64 |
| 019824m | Stress responsive A/B barrel domain family protein | 1.61±0.76 | 6.37±2.51 | 3.97±0.52 |
| 031400m | Nitrate reductase | 4.20±2.5 | 6.37±1.06 | 1.52±0.63 |
| 006649m | UDP-glucuronosyltransferase | 3.87±0.99 | 5.84±1.92 | 1.51±0.11 |
| 007911m | anthranilate N-benzoyltransferase protein | 3.83±0.49 | 5.76±0.33 | 1.50±0.15 |
| 005920m | Low-temperature-induced 65kDa protein-like | 0.18±0.03 | 0.10±0.01 | 0.56±0.04 |
| 018200mc | Heat-shock protein | 0.2±0.06 | 0.32±0.05 | 1.6±0.59 |
| 013991mc | GRAM domain family protein | 0.2±0.08 | 0.17±0.05 | 0.83±0.21 |
| 004206m | Asparagine synthetase 1 | 0.21±0.06 | 0.18±0.02 | 0.86±0.14 |
| 017902mc | Predicted protein | 0.22±0.02 | 0.26±0.05 | 1.19±0.27 |
| 001503mc | β-Galactosidase | 0.23±0.06 | 0.23±0.03 | 1.00±0.28 |
| 018340mc | Predicted protein | 0.24±0.06 | 0.31±0.06 | 1.29±0.27 |
| 018274m | Predicted protein | 0.26±0.04 | 0.35±0.05 | 1.35±0.45 |
| 003000m | FTSH protease | 0.26±0.06 | 0.27±0.04 | 1.03±0.22 |
| 018158mc | 17.6kDa class II heat-shock protein | 0.29±0.02 | 0.51±0.07 | 1.73±0.27 |
| 012507m | Linamarase | 0.71±0.11 | 0.05±0.01 | 0.07±0.01 |
| 033687m | P66 protein | 0.86±0.21 | 0.17±0.07 | 0.19±0.12 |
| 002555m | Subtilase family protein | 0.30±0.02 | 0.18±0.02 | 0.59±0.12 |
| 000739mc | Lysine-ketoglutarate reductase/saccharopine dehydrogenase | 0.40±0.02 | 0.18±0.03 | 0.44±0.08 |
| 025314m | Peroxidase | 0.37±0.03 | 0.18±0.04 | 0.50±0.13 |
| 032951m | NAD(P)-binding Rossmann-fold superfamily protein | 0.41±0.22 | 0.19±0.1 | 0.46±0.08 |
a Fold differences in protein abundance (±SD) from the comparisons between stressed (L1) and control (L0) leaves of Arg7 and SC124.
b Ratios of SC124-L1/L0:Arg-L1/L0 to indicate the difference in response to drought stress.
c Proteins that were also differentially expressed in the roots.
The most common types of proteins that showed higher levels in the stressed leaves than in the controls included those involved in secondary metabolism (such as in the flavonoid and phytoalexin biosynthetic pathways), the antioxidant system (such as superoxide dismutase, thioredoxin, and glutathione S-transferase), several proteases, and in modifications of cell-wall components (Supplementary Table S3). Many of these proteins are known to be associated with abiotic and biotic stress responses, and activation of the antioxidant system is also considered a key factor for drought tolerance in cassava (Turyagyenda et al., 2013). The levels of cyanohydrin UDP-glucosyltransferase (UGT85K4) were significantly increased in the stressed leaves of SC124 but were not significantly changed in Arg7 (Supplementary Table S3). UGT85K4 and methylbutanal oxime monooxygenase (cytochrome P450 protein CYP71E) are the key enzymes in biosynthesis of linamarin.
Although some antioxidant enzymes were found to be upregulated, others were downregulated in the stressed leaves, suggesting a dynamic feature of the cellular redox status. Similarly, some heat-shock proteins were upregulated but others were downregulated under the drought stress. Other proteins upregulated by the drought stress include two myo-inositol 1-phosphate synthases that are involved in inositol phosphate metabolism, 1-aminocyclopropane-1-carboxylate oxidase involved in ethylene formation, and a few proteins involved in vesicle trafficking (such as ENTH/VHS family protein, two dynamin proteins, and a clathrin adaptor complex protein). In addition, a number of putative regulatory proteins were identified as upregulated proteins in the stressed leaves, which included several protein kinases, two 14-3-3 proteins, two leucine-rich repeat-containing proteins, three RNA-binding proteins, a winged-helix DNA-binding transcription factor, and a general transcription factor. Two histone deacetylases were upregulated in the stressed SC124 leaves but showed no significant change in the Arg7 leaves.
Unexpectedly, a nitrate reductase and a sucrose synthase were among the most strongly upregulated proteins in the stressed leaves, although the plants were expected to have reduced levels of nitrate uptake and glucose formation from photosynthesis. In addition, their levels were increased even more in the SC124 leaves than in the Arg7 leaves under drought stress (Table 2). A nitrate reductase and a sucrose synthase were also upregulated in the stressed roots of SC124 (see below).
Comparisons of the root proteomes
The total number of proteins identified and quantified from the root samples (4382) was slightly higher than that from the leaf samples (3765). However, only 129 root proteins were found to show at least a 1.67-fold change (with a P value of <0.05) between the drought-stressed roots and normal roots (Fig. 3B and Supplementary Table S4), which is much lower than the number of the differentially expressed proteins in the leaves (561) with the same threshold level of change. Among the drought-responsive proteins in the roots, 80 were upregulated and 49 were downregulated. Although many more proteins showed drought-responsiveness in the SC124 leaves than in the Arg7 leaves, the number of drought-responsive proteins in the SC124 roots (51) was lower than in the Arg7 roots (103). Seventeen proteins were upregulated and eight downregulated in both cultivars. Table 3 contains a list of the 10 most strongly up- or downregulated proteins in the roots under drought conditions in at least one of the cultivars.
Table 3.
Top 10 most strongly up- or downregulated proteins in stressed roots of Arg7 and/or SC124Three proteins (006627m, 027183m, and 019959m) were identified in two of the three replicates, and the others in all three replicates.
| Protein ID | Functional annotation | Arg R1/R0a | SC R1/R0a | SC/Argb |
|---|---|---|---|---|
| 005817m | Methylbutanal oxime monooxygenase P450 71E7 | 4.20±0.87 | 4.08±0.7 | 0.97±0.32 |
| 003884mc | Granule-bound starch synthase I | 3.45±0.87 | 1.87±0.46 | 0.54±0.09 |
| 007640m | Tubulin β-chain | 3.39±0.64 | 2.04±0.44 | 0.60±0.18 |
| 022649m | Gibberellin 20 oxidase | 3.28±1.06 | 4.42±0.31 | 1.35±0.48 |
| 013438m | Plasma membrane aquaporin 2 | 3.19±0.35 | 1.85±0.27 | 0.58±0.08 |
| 011585mc | Xyloglucan endotransglucosylase/hydrolase | 2.98±0.64 | 2.25±0.57 | 0.76±0.12 |
| 005220m | Inorganic phosphate transporter | 2.88±0.6 | 2.79±0.99 | 0.97±0.2 |
| 005409m | Glucose-1-phosphate adenylyltransferase, putative | 2.84±0.65 | 1.71±0.23 | 0.60±0.18 |
| 027134m | 2-Oxoglutarate-dependent dioxygenase | 2.77±0.57 | 3.10±0.7 | 1.12±0.15 |
| 005939m | Cytochrome P450 | 2.70±0.67 | 4.39±0.45 | 1.63±0.29 |
| 003705m | Endo-1,4-β-glucanase | 2.49±0.46 | 2.54±0.55 | 1.02±0.04 |
| 024498m | S-Adenosyl-l-methionine-dependent methyltransferases | 2.19±0.52 | 2.38±0.42 | 1.09±0.1 |
| 034199m | NB-ARC domain-containing disease resistance protein | 2.17±0.37 | 2.29±0.24 | 1.06±0.14 |
| 004233mc | Nitrite reductase | 1.52±0.16 | 2.17±0.17 | 1.42±0.08 |
| 006627m | UDP-glucosyltransferase, | 1.72±0.18 | 2.15±0.26 | 1.25±0.18 |
| 005517mc | Endo-1,4-β-glucanase | 2.82±0.85 | 2.09±0.06 | 0.74±0.21 |
| 012136mc | Basic chitinase | 0.19±0.09 | 0.49±0.23 | 2.59±0.02 |
| 014315m | Stem-specific protein TSJT1 | 0.25±0.09 | 0.46±0.16 | 1.88±0.33 |
| 014428mc | Stem-specific protein TSJT1 | 0.26±0.06 | 0.49±0.02 | 1.89±0.53 |
| 005623mc | Dimethylaniline monooxygenase | 0.31±0.08 | 0.90±0.22 | 2.87±0.76 |
| 018027m | Major allergen Pru ar | 0.31±0.08 | 0.44±0.31 | 1.41±0.67 |
| 001503mc | β-Galactosidase | 0.35±0.07 | 0.69±0.1 | 2.00±0.63 |
| 013991mc | GRAM domain family protein | 0.35±0.03 | 0.37±0.08 | 1.07±0.14 |
| 022744m | Miraculin precursor | 0.35±0.1 | 0.38±0.35 | 1.08±0.65 |
| 012423m | RmlC-like cupin family protein | 0.36±0.08 | 0.41±0.1 | 1.12±0.04 |
| 018340mc | Predicted protein | 0.38±0.06 | 0.45±0.09 | 1.16±0.42 |
| 027183m | Predicted protein | 0.45±0.11 | 0.31±0.13 | 0.68±0.15 |
| 017871m | HSP20-like chaperone | 0.51±0.1 | 0.35±0.02 | 0.68±0.12 |
| 019959m | Predicted protein | 0.52±0.26 | 0.40±0.01 | 0.77±0.44 |
| 011258mc | α-Galactosidase/α-N-acetylgalactosaminidase | 0.39±0.05 | 0.51±0.07 | 1.29±0.01 |
| 010983m | β-1,3-Glucanase | 0.36±0.16 | 0.54±0.05 | 1.49±0.49 |
| 013205m | Furin | 0.89±0.32 | 0.55±0.02 | 0.62±0.21 |
a Fold difference in protein abundance (±SD) from the comparisons between stressed
(R1) and control (R0) roots of Arg7 and SC124.
b Ratios of SC124-R1/R0:Arg-R1/R0 to indicate the difference in response to
drought stress.
c Proteins that were also differentially expressed in the leaves.
Most common functional categories of the drought-responsive proteins in the roots included those involved in secondary metabolism, pathogenesis-related (PR) proteins (such as a few PR2 family glucanases), proteases, and cytoskeleton (such as a few tubulins). Among the most strongly upregulated proteins by drought in the stressed roots of both cultivars were those involved in biosynthesis of linamarin including P450 71E7 (CYP71E7) (Table 3) and UGT85K4 (Supplementary Table S4). The latter was also increased in the stressed leaves.
Other proteins that were upregulated in the stressed roots included an inorganic phosphate transporter, a RNA-binding protein, aquaporin, two SAM-dependent methyltransferases, several proteases, thioredoxin, heat-shock proteins, a starch synthase, and a CLAVATA1-like receptor kinase (Supplementary Table S4 and Table 3). The aquaporin was induced more in Arg7 (>3-fold) than in SC124 (1.85-fold) under drought. The downregulated proteins under the stress conditions included a serine-threonine protein kinase, several cell-wall modification enzymes, and two germin-like proteins. A linamarase was reduced in the stressed Arg7 roots but unchanged in the SC124 roots. The comparison of the proteomes between the drought-stressed roots and the roots from the plants 24h after rewatering showed a much smaller number of proteins that responded to rewatering (Fig. 3C and Supplementary Table S4). In Arg7, 14 proteins were found to be downregulated, but no protein was found to be significantly upregulated. In SC124, 10 proteins were upregulated and 10 downregulated. A linamarase was induced by 2.2-fold by rewatering in the SC124 roots but was unchanged in the Arg7 roots. A transducin/WD40 repeat protein, a RNA-binding (RRM/RBD/RNP motifs) protein, and a transcription factor were reduced by rewatering in the SC124 roots.
Measurement of linamarin levels
The proteome analysis showed that the enzymes involved in linamarin biosynthesis were present at higher levels in the stressed SC124 leaves and in the stressed roots of both cultivars. In the stressed SC124 leaves, a linamarase was sharply reduced but was little changed in Arg7. These results suggested that drought enhanced linamarin accumulation, particularly in the SC124 leaves.
We determined the levels of linamarin in normally irrigated and drought-stressed leaves and roots of both cultivars (Fig. 4). It was found that the linamarin levels in the control leaves were similar between the two cultivars. In the stressed leaves of Arg7, the linamarin level was slightly lower than in the control leaves, but in the stressed SC124 leaves, the linamarin level was higher than in the control leaves. In roots, SC124 had a higher level of linamarin than Arg7 under normally irrigated conditions. The drought stress led to a higher level of linamarin in the Arg7 roots, whereas in the stressed SC124 roots, the level was lower than that in the control roots.
Fig. 4.
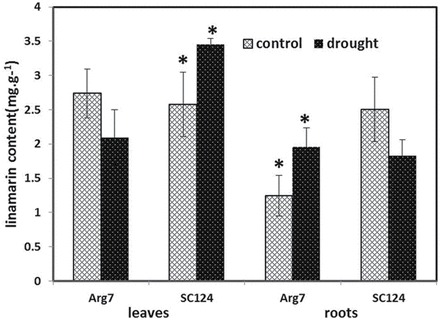
Linamarin levels in leaves and roots of stressed and control plants. The data presented are means (n=3) ±standard error. An asterisk indicates a significant difference between the drought-stressed and control plants (P<0.05).
Discussion
Plants have evolved complex mechanisms to cope with water scarcity. Plants can avoid or reduce water stress by developing a deep root system, decreasing shoot growth, undergoing leaf senescence and shedding, and by early stomatal closure to reduce water loss. The potential success of these individual adaptations in wild and cropping systems depends on many factors including drought severity and duration and competition with neighbouring plants. Many traits associated with drought tolerance might be advantageous under severe drought but have an opposite effect under moderate drought and vice versa (Tardieu, 2012; Claeys and Inze, 2013). For instance, some avoidance traits might help plants to survive but result in poor performance under drought. Understanding the trade-off between risk avoidance and performance maintenance will help to improve crop productivity under drought.
In this report, we found that, under moderate drought, SC124 plants adapted a ‘survival mode’ as shown by early stomatal closure, wilting symptoms, and reduced photosynthesis, resulting in growth arrest. In contrast, Arg7 plants responded to moderate drought stress by senescing and shedding of old leaves, but their young leaves remained green and turgid and had a higher photosynthesis capacity than those of the SC124 plants. As a result, Arg7 plants continued to grow, although at a reduced rate, under moderate drought. The continued growth might threaten survival under prolonged severe drought. Indeed, SC124 plants were more capable of surviving the extended more severe drought than Arg7 plants. Which strategies will be advantageous for crop production will depend on soil and weather conditions in crop production areas. Our approach allowed us to compare the two different genotypes under essentially the same soil water level. However, such an experimental design has a disadvantage in determining differences in water-use efficiency between the different genotypes and in assessing impacts of rooting behaviours of the different genotypes on their performance under drought.
Leaf senescence and shedding is known to be a strategy of reducing water loss in response to drought (Munné-Bosch and Alegre, 2004). Leaf senescence also allows nutrient remobilization to younger tissues (Hortensteiner and Feller, 2002), which helps plants to maintain growth under drought. Nutrients from senescing leaves could also be relocated to stems and storage roots, which can be used for quick regrowth upon resumed rainfall (Duque and Setter, 2013). For Arg7 plants, continued water uptake under moderate drought stress, as indicated by keeping leaves turgid, and senescing leaves probably contributed to their ability to continue growth. SC124 plants, on the other hand, closed their stomata early, which would minimize CO2 uptake and probably contributed to the growth arrest under the moderate drought stress. However, an early stomatal closure can avoid dehydration. It has been suggested that genotypes displaying early stomatal closure would be advantageous under prolonged and severe drought (Lopes et al., 2011; Tardieu, 2012). In cassava, it was recently reported that reduced water loss through partial stomatal closure made a major contribution to drought tolerance of a drought-tolerant cultivar (Turyagyenda et al., 2013). Others have reported that early stomatal closure is a trait associated with some drought-sensitive genotypes in maize and soybean (Benesova et al., 2012; Fenta et al., 2012). The discrepancy between these reports could be due to differences in the drought treatments used in the different experiments.
Transcriptomes and proteomes provide global pictures of cellular activities. We identified over 5000 proteins including a number of probably low-abundance proteins from our iTRAQ analysis, such as protein kinases and putative transcriptional factors, indicating a high coverage of cellular proteomes compared with similar plant proteome studies. However, we could not rule out the possibility that some of the peptides from ‘distinct’ proteins could be from the same protein, because the cassava genome has not been fully sequenced (Prochnik et al., 2012). In total, 561 proteins in the leaves and 150 proteins in the roots were found to have a change in abundance by at least 1.67-fold under drought conditions in at least one cultivar. As a genome-scale analysis, some of the differentially expressed proteins identified in this study could be false positives. On the other hand, those proteins that showed a significant difference in abundance (P<0.05) but where the difference was less than 1.67-fold could also be truly differentially expressed.
There are few reports on genome-scale analyses to understand cassava’s drought tolerance. An oligomicroarray representing 22 000 cassava genes was used to compare the transcriptomes between cassava plantlets growing in culture tubes and plantlets exposed to low-humidity air (50%) for 1h (Utsumi et al., 2012). Approximately 5% of the genes were found to be up- or downregulated by over 2-fold in response to the low-humidity treatment. Among the downregulated genes by the treatment were those involved in photosynthesis. Although the drought stress treatment used in the above-mentioned study was quite different from drought stress encountered by cassava plants in nature and from the drought treatment in this study, our proteome data revealed that a number of proteins involved in photosynthesis were present at reduced levels in the drought-stressed cassava leaves. These proteins were downregulated more in SC124 than in Arg7, indicating that SC124 had a more reduced photosynthesis capacity under the moderate stress, which is consistent with the more pronounced reduction in stomatal aperture and shoot growth associated with SC124 under drought. The morphological and physiological traits and the proteomic data suggest that Arg7 would have a better field performance than SC124 under moderate drought; however, SC124 is more likely to survive under prolonged, more severe drought conditions unless Arg7 can develop a deeper root system in the field.
Photosynthetic genes and related proteins are known to be downregulated under drought stress in many other plants (Chaves et al., 2009; Skirycz et al., 2010; Benesova et al., 2012; reviewed by Mohammadi et al., 2014). However, in sunflower, reduction of photosynthetic proteins was significant in a drought-sensitive cultivar but not in the drought-tolerant cultivar (Castillejo et al., 2008). Again, the inconsistency among these studies could be due to different plant species or to differences in the experimental designs and result interpretation. For instance, SC124 could be considered ‘drought sensitive’ compared with Arg7 under moderate drought stress, since SC124 showed an early growth arrest while Arg7 plants continued to grow under the stress conditions.
Proteins in the categories of signalling and trafficking are often under-represented in proteome identification studies, largely due to their low abundance (Barkla et al., 2013). Our proteome analysis identified a number of putative regulatory proteins as drought responsive. These include a few putative transcription factors, protein kinases, leucine-rich repeat-domain proteins, several RNA-binding proteins, two histone deacetylases, and 14-3-3 proteins. The histone deacetylases were found to be significantly induced in the stressed leaves of SC124 but not significantly changed in the Arg7 leaves. Their identification as the drought-responsive proteins suggests involvement of chromatin remodelling in the response of SC124 to the drought stress. Chromatin remodelling is an important mechanism in transcriptional reprogramming in responses to various stresses (Kim et al., 2010; Claeys and Inze, 2013). The exact pathways regulated by these regulatory proteins are yet to be unravelled by further study.
Aquaporins are membrane proteins involved in water transport through the membrane (Maurel and Chrispeels, 2001). An aquaporin was found to be among the most strongly upregulated proteins in the stressed Arg7 roots, suggesting that it might facilitate water mobilization under the stress conditions. The aquaporin was also induced in the drought-stressed SC124 roots but to a lesser extent. Judging from the morphological and physiological phenotypes of these two cassava cultivars under drought, it can be expected that more water was mobilized in Arg7 than in SC124. However, the way in which the aquaporin is involved in water transport under drought conditions could not be revealed based on its change in abundance.
Stressed plants are expected to have reduced metabolic activities because of a reduced level of photosynthetic activity and reduced uptake of nitrogen from the soil. However, a sucrose synthase was significantly elevated in the stressed leaves of both cultivars, with a much stronger induction in SC124 than in Arg7, suggesting an increase in the sucrose level, although the assumption is yet to be verified by sucrose measurement. It is unlikely that the increase in the sucrose synthase was due to an increase in substrate availability for sucrose synthesis from photosynthesis. Increased sucrose synthesis could be due to reduced demand for carbohydrates because of reduced shoot growth under drought. It was reported that sucrose synthase genes were strongly induced in response to drought in the resurrection plant Craterostigma plantagineum (Ingram and Bartels, 1996; Rodriguez et al., 2010). Sucrose can function as a compatible osmolyte or can have a protective role such as in protein stabilization (Lee and Timasheff, 1981). It is therefore possible that the increased sucrose synthase level could help to protect damage from the stress by synthesizing sucrose. The highly increased nitrate reductase level in the stressed cassava plants is also puzzling. Its level was increased more in the stressed SC124 than in Arg7, although it appeared that SC124 would have a lower intake of nitrate or other forms of nitrogen from soil compared with Arg7. One possibility is that this nitrate reductase could be involved in synthesis of nitric oxide as nitric reductase is known to be a major enzyme in nitric oxide synthesis in plants (Gupta et al., 2011). Nitric oxide is known to regulate stomatal closure and has other signalling roles in the drought response (Garcia-Mata and Lamattina, 2001).
Some plant species accumulate high levels of cyanogenic glycosides (CGs). For instance, CGs can account for up to 20% of leaf nitrogen in Eucalyptus cladocalyx (Gleadow and Woodrow, 2000). CGs are synthesized mainly in leaves and stored in vacuoles. Tissue disruption brings CGs together with breakdown enzymes in the cytosol to release hydrogen cyanide, which is toxic to animals. Therefore, CGs act as a defence weapon against herbivores (Gleadow and Moller, 2014). CGs might play a role in nitrogen assimilation by serving as a storage form of nitrogen and can be reallocated to sites with high nitrogen demand (Gleadow and Woodrow, 2000; Kannangara et al., 2011). Linamarin is the major CG in cassava (Lykkesfeldt and Moller, 1994) and is produced mainly in the leaves and transported to the roots (Bediako et al., 1981). Linamarin is synthesized from valine by three cytochrome P450s (CYP79D1, CYP79D2, and CYP71E7) (Andersen et al., 2000; Jorgensen et al., 2011) and two UDP-glucosyltransferases (UGT85K4 and UGT85K5) (Kannangara et al., 2011). Linamarin can be hydrolysed by linamarinase to release hydrogen cyanide, which can also be assembled into amino acids. Drought stress is known to increase the production of CGs (Gleadow and Woodrow, 2000).
The proteomic data showed that the levels of the linamarin synthetic enzymes were increased in the drought-stressed leaves of SC124 and the stressed roots of both cultivars. In addition, the level of a linamarase was strikingly reduced in the stressed SC124 leaves. The linamarin levels in the well-watered leaves were found to be similar between the two cultivars. In SC124, the drought stress led to a significant increase in the linamarin level in the leaves compared with the well-watered leaves, a result that would be expected from the increased levels of the linamarin synthetic enzymes and the strong reduction of the linamarin breakdown enzyme. In the stressed leaves of Arg7, its level was slightly lower (but not statistically significant) than in the well-watered leaves. In order to reallocate linamarin from leaves to other organs, the sharp reduction in linamarase in the stressed SC124 leaves would be a useful mechanism, as it decreases the chance for linamarin to be broken down in the leaves. In roots, the drought stress led to a higher level of linamarin in Arg7 but a lower level in SC124. The reduced linamarin level in the stressed SC124 roots could be due to its breakdown to form cyanide, which is then converted into amino acids. Such a nitrogen reallocation mechanism would be more important for SC124, as its nitrogen uptake from soil under drought stress is expected to be minimal. In addition, the level of a linamarase was induced by rewatering in the SC124 roots, which could also contribute to nitrogen availability for quick regrowth following rewatering. Our study supports the previous findings that linamarin might play an important role in nitrogen reallocation in cassava (Siritunga and Sayre, 2004).
Our study revealed that, in addition to the overlapping mechanisms in response to drought stress, the two cassava cultivars studied adapted different strategies. SC124 responded by growth quiescence and was more capable of surviving prolonged severe drought, whereas Arg7 maintained a certain level of growth under moderate drought stress. Fully understanding how continued growth and ensuing survival under drought stress are regulated is obviously of great agricultural importance.
Supplementary data
Supplementary data are available at JXB online.
Supplementary Tables S1 and S2. Information on all proteins identified and quantified by iTRAQ mass spectrometry from the leaf (S1) and root (S2) samples.
Supplementary Table S3. A list of all drought-responsive proteins in leaves.
Supplementary Table S4. A list of all drought-responsive or rewatering-responsive proteins in roots.
Supplementary Fig. S1. The height of the cassava plants during the drought stress treatment.
Supplementary Fig. S2. Aperture of stomata in leaves during the drought stress treatment.
Acknowledgements
This work was supported by the ‘973’ program of the Ministry of Science and Technology of China (grant no. 2010CB126600 to MP), the ‘863’ program of the Ministry of Science and Technology of China (grant no. 2012AA101204-2 to MP), the Research Grants Council of Hong Kong (grant no. HKBU1/CRF/10 to YX), the HKBU Strategic Development Fund (to YX), the Major Technology Project of Hainan Province (grant no. ZDZX2013023-1 to MP), and the International Science & Technology Cooperation Program of China (grant no. 2013DFA32020 to MP).
Glossary
Abbreviations:
- CG
cyanogenic glycoside
- ESI
, electrospray ionization; FWHM, full width at half maximum;
- HPLC
high-performance liquid chromatography
- iTRAQ
isobaric tags for relative and absolute quantitation
- LC
liquid chromatography
- MS
mass spectrometry
- SD
standard deviation.
References
- Andersen MD, Busk PK, Svendsen I, Moller BL. 2000. Cytochromes P-450 from cassava (Manihot esculenta Crantz) catalyzing the first steps in the biosynthesis of the cyanogenic glucosides linamarin and lotaustralin. Cloning, functional expression in Pichia pastoris, and substrate specificity of the isolated recombinant enzymes. Journal of Biological Chemistry 275, 1966–1975. [DOI] [PubMed] [Google Scholar]
- Baba AI, Nogueira FC, Pinheiro CB, Brasil JN, Jereissati ES, Juca TL, Soares AA, Santos M, Domont GB, Campos FA. 2008. Proteome analysis of secondary somatic embryogenesis in cassava (Manihot esculenta). Plant Science 175, 717–723. [Google Scholar]
- Barkla BJ, Vera-Estrella R, Pantoja O. 2013. Progress and challenges for abiotic stress proteomics of crop plants. Proteomics 13, 1801–1815. [DOI] [PubMed] [Google Scholar]
- Bediako M, Tapper B, Pritchard G. 1981. Metabolism synthetic site and translocation of cyanogenic glucoside in cassava. In: Terry E, ed. Proceedings of the First Triennial Root Crops Symposium of International Society for Tropical Root Crops. Canada: IDRC, 143–148. [Google Scholar]
- Benesova M, Hola D, Fischer L, et al. 2012. The physiology and proteomics of drought tolerance in maize: early stomatal closure as a cause of lower tolerance to short-term dehydration? PLoS One 7, e38017. [DOI] [PMC free article] [PubMed] [Google Scholar]
- Calatayud PA, Llovera E, Bois JF, Lamaze T. 2000. Photosynthesis in drought-adapted cassava. Photosynthetica 38, 97–104. [Google Scholar]
- Castillejo MA, Maldonado AM, Ogueta S, Jorrin JV. 2008. Proteomic analysis of responses to drought stress in sunflower (Hiliathus annuus) leaves by 2-DE gel electrophoresis and mass spectrometry Open Proteomics Journal 1, 59–71. [Google Scholar]
- Chaves MM, Flexas J, Pinheiro C. 2009. Photosynthesis under drought and salt stress: regulation mechanisms from whole plant to cell. Annals of Botany 103, 551–560. [DOI] [PMC free article] [PubMed] [Google Scholar]
- Claeys H, Inze D. 2013. The agony of choice: how plants balance growth and survival under water-limiting conditions. Plant Physiology 162, 1768–1779. [DOI] [PMC free article] [PubMed] [Google Scholar]
- Duque LO, Setter TL. 2013. Cassava Response to water deficit in deep pots: root and shoot growth, ABA, and carbohydrate reserves in stems, leaves and storage roots. Tropical Plant Biology 6, 199–209. [Google Scholar]
- El-Sharkawy MA. 2004. Cassava biology and physiology. Plant Molecular Biology 56, 481–501. [DOI] [PubMed] [Google Scholar]
- Fenta BA, Driscoll SP, Kunert KJ, Foyer CH. 2012. Characterization of drought-tolerance nodulated soya beans: the importance of maintaining photosynthesis and shoot biomass under drought-induced limitations on nitrogen metabolism. Journal of Agronony and Scrop Science 198, 92–103. [Google Scholar]
- Garcia-Mata C, Lamattina L. 2001. Nitric oxide induces stomatal closure and enhances the adaptive plant responses against drought stress. Plant Physiology 126, 1196–1204. [DOI] [PMC free article] [PubMed] [Google Scholar]
- Gleadow RM, Moller BL. 2014. Cyanogenic glycosides: synthesis, physiology, and phenotypic plasticity. Annual Review of Plant Biology 65, 155–185. [DOI] [PubMed] [Google Scholar]
- Gleadow RM, Woodrow IE. 2000. Temporal and spatial variation in cyanogenic glycosides in Eucalyptus cladocalyx . Tree Physiology 20, 591–598. [DOI] [PubMed] [Google Scholar]
- Golldack D, Li C, Mohan H, Probst N. 2014. Tolerance to drought and salt stress in plants: unraveling the signaling networks. Frontiers in Plant Science 5, 151. [DOI] [PMC free article] [PubMed] [Google Scholar]
- Gupta KJ, Fernie AR, Kaiser WM, van Dongen JT. 2011. On the origins of nitric oxide. Trends in Plant Science 16, 160–168. [DOI] [PubMed] [Google Scholar]
- Hortensteiner S, Feller U. 2002. Nitrogen metabolism and remobilization during senescence. Journal of Experimental Botany 53, 927–937. [DOI] [PubMed] [Google Scholar]
- Ingram J, Bartels D. 1996. The molecular basis of dehydration tolerance in plants. Annual Review of Plant Physiology and Plant Molecular Biology 47, 377–403. [DOI] [PubMed] [Google Scholar]
- Jorgensen K, Bak S, Busk PK, Sorensen C, Olsen CE, Puonti-Kaerlas J, Moller BL. 2005. Cassava plants with a depleted cyanogenic glucoside content in leaves and tubers. Distribution of cyanogenic glucosides, their site of synthesis and transport, and blockage of the biosynthesis by RNA interference technology. Plant Physiology 139, 363–374. [DOI] [PMC free article] [PubMed] [Google Scholar]
- Jorgensen K, Morant AV, Morant M, Jensen NB, Olsen CE, Kannangara R, Motawia MS, Moller BL, Bak S. 2011. Biosynthesis of the cyanogenic glucosides linamarin and lotaustralin in cassava: isolation, biochemical characterization, and expression pattern of CYP71E7, the oxime-metabolizing cytochrome P450 enzyme. Plant Physiology 155, 282–292. [DOI] [PMC free article] [PubMed] [Google Scholar]
- Kannangara R, Motawia MS, Hansen NK, Paquette SM, Olsen CE, Moller BL, Jorgensen K. 2011. Characterization and expression profile of two UDP-glucosyltransferases, UGT85K4 and UGT85K5, catalyzing the last step in cyanogenic glucoside biosynthesis in cassava. The Plant Journal 68, 287–301. [DOI] [PubMed] [Google Scholar]
- Kim JM, To TK, Nishioka T, Seki M. 2010. Chromatin regulation functions in plant abiotic stress responses. Plant, Cell & Environment 33, 604–611. [DOI] [PubMed] [Google Scholar]
- Lee JC, Timasheff SN. 1981. The stabilization of proteins by sucrose. Journal of Biological Chemistry 256, 7193–7201. [PubMed] [Google Scholar]
- Li K, Zhu W, Zeng K, Zhang Z, Ye J, Ou W, Rehman S, Heuer B, Chen S. 2010. Proteome characterization of cassava (Manihot esculenta Crantz) somatic embryos, plantlets and tuberous roots. Proteome Sci 8, 10. [DOI] [PMC free article] [PubMed] [Google Scholar]
- Lopes MS, Araus JL, van Heerden PD, Foyer CH. 2011. Enhancing drought tolerance in C4 crops. Journal of Experimental Botany 62, 3135–3153. [DOI] [PubMed] [Google Scholar]
- Lykkesfeldt J, Moller BL. 1994. Cyanogenic glycosides in cassava, Manihot esculenta Crantz. Acta Chemica Scandinavica A 48, 178–180. [Google Scholar]
- Maurel C, Chrispeels MJ. 2001. Aquaporins. A molecular entry into plant water relations. Plant Physiology 125, 135–138. [DOI] [PMC free article] [PubMed] [Google Scholar]
- McDowell N, Pockman WT, Allen CD, et al. 2008. Mechanisms of plant survival and mortality during drought: why do some plants survive while others succumb to drought? New Phytologist 178, 719–739. [DOI] [PubMed] [Google Scholar]
- Mohammadi PP, Mouri M-Z, Komatsu S. 2014. Proteome analysis of drought-stressed plants. Current Proteomics 11, 232–244. [Google Scholar]
- Munné-Bosch S, Alegre L. 2004. Die and let live: leaf senescence contributes to plant survival under drought stress. Functional Plant Biology 3 203–216. [DOI] [PubMed] [Google Scholar]
- Owiti J, Grossmann J, Gehrig P, Dessimoz C, Laloi C, Hansen MB, Gruissem W, Vanderschuren H. 2011. iTRAQ-based analysis of changes in the cassava root proteome reveals pathways associated with post-harvest physiological deterioration. The Plant Journal 67, 145–156. [DOI] [PubMed] [Google Scholar]
- Prochnik S, Marri PR, Desany B, et al. 2012. The cassava genome: current progress, future directions. Tropical Plant Biology 5, 88–94. [DOI] [PMC free article] [PubMed] [Google Scholar]
- Rodriguez MC, Edsgard D, Hussain SS, Alquezar D, Rasmussen M, Gilbert T, Nielsen BH, Bartels D, Mundy J. 2010. Transcriptomes of the desiccation-tolerant resurrection plant Craterostigma plantagineum . The Plant Journal 63, 212–228. [DOI] [PubMed] [Google Scholar]
- Sheffield J, Taylor N, Fauquet C, Chen S. 2006. The cassava (Manihot esculenta Crantz) root proteome: protein identification and differential expression. Proteomics 6, 1588–1598. [DOI] [PubMed] [Google Scholar]
- Shinozaki K, Yamaguchi-Shinozaki K. 2007. Gene networks involved in drought stress response and tolerance. Journal of Experimental Botany 58, 221–227. [DOI] [PubMed] [Google Scholar]
- Siritunga D, Sayre R. 2004. Engineering cyanogen synthesis and turnover in cassava (Manihot esculenta). Plant Molecular Biology 56, 661–669. [DOI] [PubMed] [Google Scholar]
- Siritunga D, Sayre RT. 2003. Generation of cyanogen-free transgenic cassava. Planta 217, 367–373. [DOI] [PubMed] [Google Scholar]
- Skirycz A, Memmi S, De Bodt S, Maleux K, Obata T, Fernie AR, Devreese B, Inzeé D. 2010. A reciprocal 15N-labeling proteomic analysis of expanding Arabidopsis leaves subjected to osmotic stress indicates importance of mitochondria in preserving plastid functions. Journal of Proteome Research 10, 1018–1029. [DOI] [PubMed] [Google Scholar]
- Tardieu F. 2012. Any trait or trait-related allele can confer drought tolerance: just design the right drought scenario. Journal of Experimental Botany 63, 25–31. [DOI] [PubMed] [Google Scholar]
- Tollefson J. 2011. Drought-tolerant maize gets US debut. Nature 469, 144. [DOI] [PubMed] [Google Scholar]
- Turyagyenda LF, Kizito EB, Ferguson M, Baguma Y, Agaba M, Harvey JJ, Osiru DS. 2013. Physiological and molecular characterization of drought responses and identification of candidate tolerance genes in cassava. AoB Plants 5, plt007. [DOI] [PMC free article] [PubMed] [Google Scholar]
- Umezawa T, Fujita M, Fujita Y, Yamaguchi-Shinozaki K, Shinozaki K. 2006. Engineering drought tolerance in plants: discovering and tailoring genes to unlock the future. Current Opinion in Biotechnologynol 17, 113–122. [DOI] [PubMed] [Google Scholar]
- Utsumi Y, Tanaka M, Morosawa T, et al. 2012. Transcriptome analysis using a high-density oligomicroarray under drought stress in various genotypes of cassava: an important tropical crop. DNA Research 19, 335–345. [DOI] [PMC free article] [PubMed] [Google Scholar]
- Wang W, Feng B, Xiao J, et al. 2014. Cassava genome from a wild ancestor to cultivated varieties. Nature Communications 5, 5110. [DOI] [PMC free article] [PubMed] [Google Scholar]
- Xiong L, Schumaker KS, Zhu JK. 2002. Cell signaling during cold, drought, and salt stress. Plant Cell 14 (Suppl), S165–S183. [DOI] [PMC free article] [PubMed] [Google Scholar]
Associated Data
This section collects any data citations, data availability statements, or supplementary materials included in this article.