

Background: NaDC3 transports important metabolic intermediates, including succinate and citrate, into cells.
Results: We describe the NaDC3 structure and mode of substrate interaction using molecular modeling followed by experimental testing.
Conclusion: The model identifies high-affinity substrate and sodium binding sites in NaDC3.
Significance: The results improve our understanding of substrate binding and substrate preferences in the SLC13/DASS transporters.
Keywords: Homology Modeling, Membrane, Molecular Docking, Sodium Transport, Tricarboxylic Acid Cycle (TCA Cycle) (Krebs Cycle), SLC13 Family, Citrate, Succinate
Abstract
Metabolic intermediates, such as succinate and citrate, regulate important processes ranging from energy metabolism to fatty acid synthesis. Cytosolic concentrations of these metabolites are controlled, in part, by members of the SLC13 gene family. The molecular mechanism underlying Na+-coupled di- and tricarboxylate transport by this family is understood poorly. The human Na+/dicarboxylate cotransporter NaDC3 (SLC13A3) is found in various tissues, including the kidney, liver, and brain. In addition to citric acid cycle intermediates such as α-ketoglutarate and succinate, NaDC3 transports other compounds into cells, including N-acetyl aspartate, mercaptosuccinate, and glutathione, in keeping with its dual roles in cell nutrition and detoxification. In this study, we construct a homology structural model of NaDC3 on the basis of the structure of the Vibrio cholerae homolog vcINDY. Our computations are followed by experimental testing of the predicted NaDC3 structure and mode of interaction with various substrates. The results of this study show that the substrate and cation binding domains of NaDC3 are composed of residues in the opposing hairpin loops and unwound portions of adjacent helices. Furthermore, these results provide a possible explanation for the differential substrate specificity among dicarboxylate transporters that underpin their diverse biological roles in metabolism and detoxification. The structural model of NaDC3 provides a framework for understanding substrate selectivity and the Na+-coupled anion transport mechanism by the human SLC13 family and other key solute carrier transporters.
Introduction
Metabolic intermediates such as succinate and citrate regulate numerous physiological processes ranging from renal function and fatty acid synthesis to energy metabolism (1–3). In humans, the transporters of the SLC13 family mediate the transport of citric acid cycle intermediates into cells and play important metabolic roles. Humans have three SLC13 transporters for di- and tricarboxylates: NaDC1 (SLC13A2), the low-affinity transporter of the kidney and small intestine; NaCT (SLC13A5), the citrate transporter found in the liver and brain; and NaDC3 (SLC13A3) (4). Although not well understood, there is evidence for the metabolic role of these transporters. For example, mutations in the Drosophila homolog INDY produce a profound increase in life span by a mechanism related to caloric restriction, and deletion of the mouse NaCT results in pronounced changes in energy metabolism (5, 6). Despite the important metabolic roles played by members of this family, little is known about their transport mechanism at a molecular level.
The high-affinity transporter NaDC3 has a Km for succinate of ∼20 μm (7, 8) and is broadly distributed among tissues such as the renal proximal tubule, liver, placenta, brain, and eye (4). NaDC3 couples three Na+ ions to the transport of each divalent anion substrate (7). Of the three SLC13 dicarboxylate transporters, NaDC3 transports the broadest range of substrates, including dicarboxylates containing from four to six carbon atoms (e.g. succinate and adipate) as well as tricarboxylates (e.g. citrate). The physiological functions of NaDC3 include nutrient absorption and detoxification. In addition to providing citric acid cycle metabolites for energy metabolism, NaDC3 also participates in the secretion of drugs and xenobiotics by providing glutarate and α-ketoglutarate to the organic anion exchangers OAT1 and OAT3, which are important for drug pharmacokinetics (9). The range of NaDC3 substrates also includes the clinically used heavy metal poisoning antidotes, such as succimer (10), and the antioxidant glutathione (11). NaDC3 is also important for the transport of N-acetyl aspartate in neurons and astrocytes, thought to contribute to osmoregulation in the brain (12).
Currently there are no known atomic resolution structures of eukaryotic SLC13 transporters, including NaDC3. However, the x-ray structure of a bacterial homolog, the Na+-dependent dicarboxylate transporter from Vibrio cholerae (vcINDY) has been determined recently at 3.2-Å atomic resolution (13). The mammalian SLC13 transporters and vcINDY belong to the large divalent anion sodium symporter (DASS)3 family that also includes dicarboxylate transporters from bacteria and plants (14). The vcINDY structure consists of two pseudosymmetrical halves, which suggests that it transports solutes via a similar “rocking bundle” mechanism found in other, structurally unrelated solute carrier families such as those belonging to the LeuT-like fold (15). In the published crystal structure, vcINDY is bound to citrate and one sodium ion (Na1), adopting an inward-facing conformation (13). This conformation may represent an intermediate state in which a second sodium ion (i.e. Na2) has already been released inside the cell and Na1 and the substrate citrate are still bound to the protein (13). vcINDY shares an overall sequence identity of ∼33% with the human SLC13 family members as well as with the majority of the residues constituting the substrate- and Na+-binding site (13), thereby providing a reliable template for modeling the structure.
In this study, we characterize the human NaDC3 by constructing a homology structural model on the basis of the structure of vcINDY and by docking of various substrates against the NaDC3 binding site. The NaDC3 model was tested using site-directed mutagenesis with a focus on predicted binding sites in the opposing hairpin loops and unwound portions of adjacent helices. Finally, we discuss the application of the model to understand substrate binding and translocation in the SLC13 family and other solute carrier (SLC) transporters.
EXPERIMENTAL PROCEDURES
Template Selection
The Na+-dependent dicarboxylate transporter from V. cholerae (vcINDY) is currently the only experimentally determined structure of an SLC13 homolog (13). To confirm the template structure, we used the fold recognition and modeling servers HHpred (16) and I-Tasser (17). In addition, we analyzed the NaDC3 entry in the Transporter Classification Database (18) and the previous analysis of the human solute carriers (19, 20). NaDC3 and vcINDY both belong to the DASS family of TCDB (2.A.47), increasing our confidence in the fold assignment.
NaDC3-INDY Alignment
Initial alignment between NaDC3 and vcINDY (sequence identity of 33%) was obtained using the Promals3D server (21) using the default parameters. The alignment included, as input, the sequences of the human SLC13 members, including NaDC3, and the structure of vcINDY. The initial alignment was refined on the basis of the previously published comprehensive alignment of the SLC13 family with vcINDY (13). Finally, 428 residues of NaDC3 were modeled, covering 75% of the protein sequence. The following four segments distant from the estimated binding site were excluded from modeling: the N terminus, the loop between HPin and transmembrane helix 5a (TM5a), the loop between TM6 and TM7, and the loop between TM8 and TM 9 (Fig. 1).
FIGURE 1.

hNaDC3-vcINDY alignment. The alignment between the sequences of hNaDC3 (Genpept AAF73251, top sequence) and vcINDY (Genpept AAF95939, bottom sequence) was visualized with Jalview (40) using the “ClustalX” color scheme. Helical segments in the vcINDY structure are indicated with red rectangles. The helical secondary structure elements (SS) were defined on the basis of the Protein Data Bank (PDB) secondary structure assignment (i.e. using the Dictionary of Secondary Structure of Proteins (DSSP) program (41)), the literature (13), and visual inspection of the structure. The helix nomenclature is on the basis of that defined by Mancusso et al. (13). Residues that are important for ligand and Na+ binding on the basis of the homology model are highlighted with gray stars and purple circles, respectively. Positions of amino acids that have been mutated in this study are marked with gray horizontal bars. The NaDC3 regions that were excluded from modeling (e.g. residues 302–340) and the vcINDY disordered region (i.e. residues 243–252) are marked with slashes (/).
Model Construction
We used the “automodel” routine of MODELLER-9 v. 11 to generate the initial 100 NaDC3 models (22). NaDC3 was modeled with the non-protein atoms of succinate on the basis of the coordinates of these atoms in the template structure, (i.e. using the env.io.hetatm = TRUE and the env.io.water = FALSE flags). The models were assessed using Z-DOPE, a normalized atomic distance-dependent statistical potential on the basis of known protein structures (23). The Z-DOPE score of the top model was −0.17, suggesting that ∼55% of the Cα atoms of the model are within 3.5 Å of their correct positions (24).
Side Chain Refinement
We used SCWRL4 to repack side chains on a fixed backbone of key residues of the initial model from MODELLER (25). The coordinates of the sodium ion from the initial model were used as steric constraints for the side chains. SCWRL4 was run on different combinations of residues, including Ser-143 alone, four binding site residues (i.e. Thr-253, Pro-255, Thr-145, Ser-143, and Ser-526), residues located within 6 Å from the coordinates of succinate in the initial model, and all residues. We evaluated the refined models on the basis of visual analysis of the protein-ligand complexes in the context of the experimental functional data.
Molecular Dynamics Simulations
Molecular dynamics simulations were used as a control to verify that our final model (with refined side chains) does not undergo significant side chain rearrangements upon minimization. In particular, we used GROMACS4 molecular dynamics code as described previously (26). The model was subjected to 10,000 steps of conjugate gradient minimization under the Amber99SB-ILDN force field (27, 28). We used two different protocols. First, the sodium ion was removed from the model, and an implicit model for the solvent on the basis of a generalized Born formalism was used to account for the membrane hydrophobic environment. A dielectric constant equal to 2 was used to model the membrane interior. Second, the sodium ion was present in the model, and the system was simulated “in vacuum” where coulomb interactions were screened by using a dielectric constant equal to 2. All bond lengths were constrained to their equilibrium values using the linear constraint solver (LINCS) algorithm (29). A time step of 2 fs was adopted. A cutoff of 1.0 nm was used for the Lennard-Jones and the electrostatic interactions. Finally, to confirm that removing the loops did not have a significant effect on the simulations, we built the missing loops of the model and ran a minimization in an implicit membrane. No significant movement was observed (root mean square deviation of 0.5 Å), increasing our confidence in the model.
Molecular Docking
Docking of NaDC3 substrates was performed with DOCK 3.5.54 (30, 26), which calculates scores of docking poses with van der Waals, Poisson-Boltzmann electrostatic, and substrate desolvation penalty terms. The transporter model with refined side chains was prepared by removing all non-protein atoms except for the sodium ion. Binding site residues were identified as residues with at least one atom within 10 Å of any heavy atoms of the ligand citrate from the initial model using the program FILT (from the DOCK 3.5 distribution) (30).
Expression of NaDC3 Mutants in COS-7 Cells
Eighteen single amino acids from NaDC3 in the pcDNA3.1 vector were mutated individually using the QuikChange site-directed mutagenesis kit (Stratagene) as described previously (31). COS-7 cells (ATCC, catalog no. CRL-1651) were cultured in Dulbecco's modified Eagle's medium containing Glutamax and 25 mm HEPES (Invitrogen) supplemented with 10% heat-inactivated fetal calf serum, 100 units/ml penicillin, and 100 μg/ml streptomycin at 37 °C in 5% CO2. Cells were plated on collagen-coated 24-well plates at 0.6 × 10⁵ cells/well and transfected with NaDC3 plasmids using FuGENE6 (Roche) at a 9:3 ratio (1.8 μl FuGENE6 and 0.6 μg of plasmid DNA) (31).
Transport Assays
Transport assays were carried out 48 h after transfections, as described previously (31, 32). The sodium buffer contained 140 mm NaCl, 2 mm KCl, 1 mm MgCl2, 1 mm CaCl2, 10 mm HEPES, pH adjusted to 7.4 with 1 m Tris. Choline and lithium buffers contained equimolar choline chloride or LiCl, respectively, in place of NaCl. For the assays, each well was washed twice with choline buffer and then incubated with 0.25 ml of sodium buffer containing [14C]succinate (∼50 mCi/mmol, ∼10 μm, Moravek) for 30 min at room temperature. The uptake assays were stopped, and surface radioactivity was removed with four 1-ml washes of choline buffer. Cells were dissolved in 1% SDS, transferred to scintillation vials, and counted. For all experiments, uptake rates in vector-transfected cells were subtracted from those measured in NaDC3 plasmid-transfected cells to correct for background counts.
In sodium activation experiments, the rate of [14C]succinate transport was measured in transport buffer containing Na+ concentrations between 0–140 mm, with NaCl replaced iso-osmotically by choline chloride. Kinetic constants were calculated by nonlinear regression to the Hill equation, v = Vmax × [Na+]nH / (KNanH + [Na+]nH), where v is the initial rate of succinate uptake, Vmax is the maximum rate at saturating sodium concentration, [Na+] is the sodium concentration, KNa is the sodium concentration that produces ½ Vmax, and nH is the Hill coefficient.
Dual-label Competitive Transport Experiments
The succinate:glutarate transport specificity ratio (TSR) was determined using dual-label transport assays in which sodium transport buffer containing both 10 μm [3H]succinate and 20 μm [14C]glutarate was added to the cells in 24-well plates as described previously (33). The transport specificity ratio was calculated using the following: TSR = (νsuccinate / νglutarate) × ([glutarate] / [succinate]), where νsuccinate and νglutarate are the rates of transport of [3H]succinate and [14C]glutarate and [glutarate] and [succinate] are the concentrations of glutarate and succinate (34).
Statistics
Duplicate or quadruple measurements were made for each data point. The experiments were repeated with at least three different batches of transfected cells from different passage numbers. Significant differences between groups were identified by Student's t test or analysis of variance with p < 0.05.
RESULTS
NaDC3 Homology Model
The NaDC3 structure was modeled using MODELLER-9 v. 11 (22, 20) on the basis of the x-ray structure of vcINDY, which represents an inward-facing citrate- and Na+-bound conformation (Figs. 2 and 3). vcINDY and NaDC3 are members of the DASS family (14), share a sequence identity of ∼35% in their aligned regions, and also have a highly conserved binding site, which increases confidence in template selection and alignment (13) (Fig. 1). The initial model was assessed with Z-DOPE, a normalized, atomic distance-dependent statistical potential on the basis of known protein structures (23). The Z-DOPE score of the top model was −0.17, suggesting that ∼55% of the Cα atoms of the model are within 3.5 Å of their correct positions (23). The final refined NaDC3 model contains the entire transmembrane domain of the protein (i.e. the 11 transmembrane helices), including the residues that make up the substrate- and Na+-binding site (Figs. 2 and 3). Particularly, two helical hairpin loops, HPin and HPout, are inserted into the membrane from its opposing sides, similar to the corresponding loops in the vcINDY structure (4, 13). Each of those loops contains a conserved motif, the SNT motif (residues 143–145 and 483–485), that is highly conserved among SLC13/DASS transporters and contains functionally important residues (Figs. 1, 3, and 4) (4).
FIGURE 2.
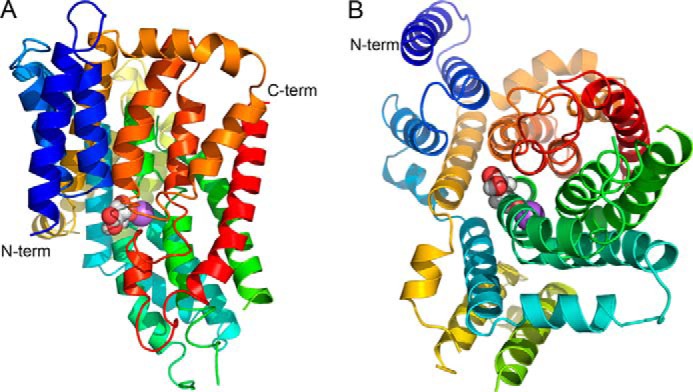
Predicted NaDC3 structure. Shown are a side view (A) and cytoplasmic view (B) of the NaDC3 monomer model. Transmembrane helices are displayed in a color spectrum, indicating succession from the N (N-term, blue) to the C (C-term, red) terminus. Atoms of the substrate succinate are shown as spheres where oxygen atoms are displayed in red and carbon and hydrogen atoms in gray. Na+ is depicted as a purple sphere.
FIGURE 3.
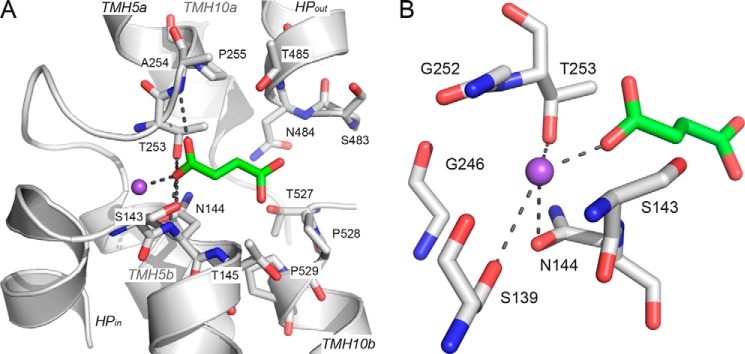
Predicted NaDC3 substrate and Na+ binding mode. The NaDC3 model is visualized as gray ribbons with key residues shown as sticks. Succinate is shown as green sticks. Oxygen, nitrogen, and hydrogen atoms are depicted in red, blue, and white, respectively, and the Na+ ion is visualized as a purple sphere. A, key hydrogen bonds between succinate and NaDC3 involving residues Ser-143, Asn-144, Thr-253, and Ala-254, with the Na+ ion, are shown as dotted gray lines. B, hydrogen bonds between the Na+ ion and NaDC3 involving residues Ser-139, Asn-144, and Thr-253 and the substrate succinate.
FIGURE 4.
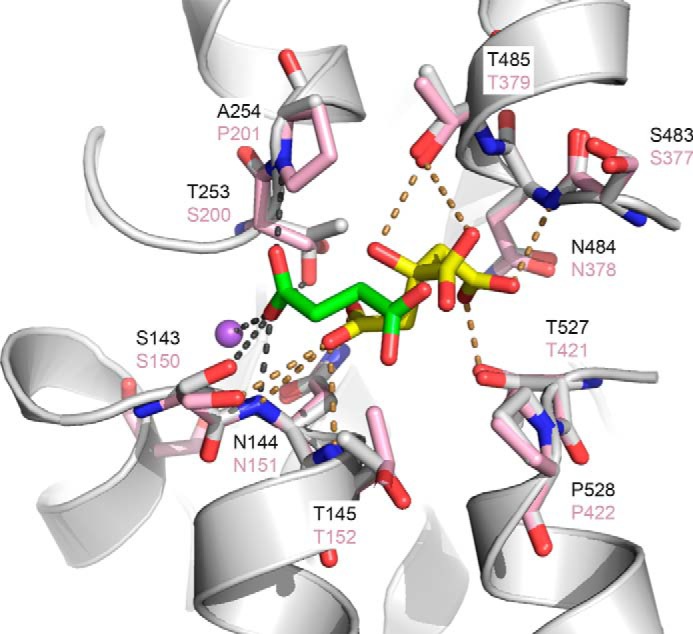
Binding sites of NaDC3 and vcINDY. The final model of NaDC3 (gray ribbons) is superimposed on the x-ray structure of vcINDY (pink). Key residues are displayed as sticks, where oxygen and nitrogen atoms are colored in red and blue, respectively. The sodium ion Na1 is visualized as a purple sphere. The citrate coordinates from the vcINDY structure are depicted by yellow sticks, and succinate coordinates from the NaDC3 model are shown as green sticks. Hydrogen bonds between citrate and vcINDY are shown as dotted yellow lines and between succinate and the NaDC3 model as dotted gray lines.
Na+ Binding Site
The majority of the interactions between the Na1 sodium ion and NaDC3 are conserved with the vcINDY structure (Figs. 3B and 4). In particular, the oxygen atoms of the Ser-139 and Asn-144 side chains are predicted to make hydrogen bonds with Na+, similar to Ser-146 and Asn-151 in vcINDY (Figs. 3 and 4). Asn-144 is part of the N-terminal SNT motif (residues 143–145). Furthermore, the backbone atoms of Gly-252 and Ser-139 are in close proximity (within 4 Å) to Na1, adopting almost identical conformations as the backbone atoms of the corresponding residues in vcINDY (i.e. Gly-199 and Ser-146, respectively). The side chain hydroxyl group of Thr-253 in NaDC3 also coordinates the Na+ ion, different from that of the corresponding residue in vcINDY (i.e. Ser-200). However, it is plausible that Thr-253 in NaDC3 and Ser-200 of vcINDY have similar side chain configurations (Fig. 4). The residues that make up the cation binding site are highly conserved among the SLC13 family members, even in other DASS members such as the Drosophila INDY, that do not transport Na+ (35).
Interaction with Substrates
Succinate, a four-carbon dicarboxylate, is a natural substrate of both NaDC3 and vcINDY. We docked succinate against the NaDC3 model binding site using DOCK (30) (Fig. 3). The oxygen atom from one of the carboxyl groups of succinate is predicted to be coordinated by the backbone oxygen atom of Ser-143 and the backbone nitrogen atom of Asn-144 of the N-terminal SNT motif as well as by the backbone nitrogen atom of Ala-254 and the side chain hydroxyl group of Thr-253 (Fig. 3). Furthermore, the Cβ and Cγ2 atoms of Asn-144 and Thr-145, respectively, face the binding site (e.g. they are both 4.3 Å from the closest succinate carbon), likely contributing to the increased substrate binding affinity of the hydrophobic moieties of the substrates via van der Waals interactions and the hydrophobic effect. Additional binding site residues with hydrophobic groups with the propensity to interact with substrates via similar interactions include Pro-528, Thr-253, and Ala-254 (Figs. 3A and 4).
Two key amino acid substitutions between NaDC3 and vcINDY likely lead to differences in the binding modes of their substrates. Ser-200 and Pro-201 in vcINDY are replaced by Thr-253 and Ala-254 in NaDC3, respectively, resulting in small changes in the size and shape of the region in the binding site close to Na1 (Figs. 3 and 4). For example, the binding site region occupied by the imino ring of Pro-201 in vcINDY becomes accessible to the substrate in NaDC3 upon substitution of this residue with Ala-254. This interaction is very different from the template vcINDY structure, in which citrate does not make similar interactions (Fig. 4).
We docked additional NaDC3 substrates, including α-ketoglutarate, citrate, glutarate, and malate, against the model binding site (Fig. 5). These molecules are larger than succinate and include dicarboxylates with more than two carbon atoms connecting the carboxyl groups (e.g. glutarate) and tricarboxylates (e.g. citrate). The predicted NaDC3-substrate complexes indicate that these larger molecules can fit into the binding site by interacting with Na+, similar to succinate, as well as by interacting with additional residues that overlap with the corresponding citrate binding site in the vcINDY structure (Figs. 3, 4, and 5). For example, citrate is predicted to form polar interactions with the side chain hydroxyl group of Thr-485 of the C-terminal SNT motif in NaDC3 (residues 483–485), which is similar to the interaction between citrate and Thr-379 in the vcINDY structure (Figs. 4 and 5D). Thr-485, which is not absolutely conserved among all members of the family, is not predicted to make a similar interaction with all docked substrates (e.g. succinate (Fig. 5C)). Therefore, as visualized by surface representation of the binding site (Fig. 5), both SNT motifs (NaDC3 residues 143–145 and 483–485) are located in the binding site and, likely, have key roles in determining substrate specificity.
FIGURE 5.

Predicted binding modes of representative NaDC3 substrates. Shown are the predicted binding modes of known substrates derived from homology modeling (A) and molecular docking (B–F). The NaDC3 binding site is visualized as surface representation (gray), and known substrates are displayed as sticks. Oxygen, nitrogen, and hydrogen atoms are depicted in red, blue, and white, respectively. Hydrogen bonds between the substrates and NaDC3 (including Na+) are displayed as dotted yellow lines. The coordinates of the substrate citrate from the initial NaDC3 homology model are shown as cyan sticks (A) and thin lines (B–F). The predicted docking poses of selected known substrates, including succinate (B), α-ketoglutarate (C), citrate (D), glutarate (E), and malate (F), are displayed as green sticks.
Model Testing Using Site-directed Mutagenesis
We selected residues for mutagenesis that were predicted by our model to interact directly with substrate or Na+ in the NaDC3 binding site. The residues were Ser-143, Asn-144, and Thr-145 from the N-terminal SNT motif at the tip of HPin; Thr-253 and Pro-255 from transmembrane helix 5a; Ser-483, Asn-484, and Thr-485 from the C-terminal SNT motif at the tip of HPout; and Thr-527 in TM10b (Fig. 1). We also mutated residues Gly-164 and Cys-517, which have been shown to be functionally important in previous studies, even though they are not predicted to interact directly with substrates in the model. Gly-164 is located in the intracellular loop between HPin and transmembrane helix 5a and appears to be important for distinguishing between glutarate and succinate in the mouse (mNaDC1) and rabbit (rbNaDC1) NaDC1 homologs (33). Finally, we mutated Cys-517 in TM10a of NaDC3 because the corresponding residues in NaDC1 (Ser-512 (rbNaDC1) and A504 (mNaDC1)) determine substrate affinity (36).
Mutants were screened for succinate transport activity after transient transfections of COS-7 cells. Mutations of residues predicted in the model to interact with substrate or cations produced decreased succinate transport activity (Fig. 6). Mutants N144A, N484A, and T485P were inactive, as was the double mutant P255T/T485P, made in an effort to rescue T485P. The sulfate transporter NaS1 (SLC13A1) has the corresponding threonine and proline positions reversed compared with NaDC3, but the P255T/T485P double mutant had no transport activity (Fig. 6). Although the T145A and T527N mutants had low activity compared with the wild type, the signals (26- and 8-fold above background, respectively) were significantly different from the background. Of the remaining mutants, S143A, T253S, P255T, S483A, T485A, T485M, and T485V had between 20–60% of the wild type activity, as expected from their predicted location in the binding site (Fig. 3). Mutations at positions Gly-164 and Cys-517 did not affect succinate transport activity (Fig. 6), consistent with their locations further away from the binding site (Fig. 3).
FIGURE 6.

Succinate transport activity in NaDC3 mutants. Transport of [14C]succinate (10 μm) was measured in Na+-containing buffer for 30 min. The transport activity for each mutant is expressed as a percentage of the activity of WT NaDC3 from the same transfection experiment. Error bars represent mean ± S.E. (n = 4–10 separate experiments, n = 20 for the WT). Mutants with no activity were tested twice at room temperature and once at 37 °C. *, p < 0.05 compared with WT NaDC3. The mutants with low activity were compared with the background. #, p < 0.05.
Substrate Specificity
The substrate specificity of the mutants was tested using two assays: a cis-inhibition assay and the TSR. The cis-inhibition assay measured the transport of [14C]succinate (10 μm) in the presence or absence of non-radiolabeled test substrates. NaDC3 transport activity was less than 30% of the control in the presence of 1 mm succinate, methylsuccinate, glutarate, α-ketoglutarate, and adipate (Fig. 7), indicating more than a 70% inhibition by these substrates, similar to the results of previous studies (7, 37). The inhibition by citrate was about 20%, verifying a low affinity of NaDC3 for citrate (7). Residues predicted to be in the substrate binding site showed expected changes in substrate specificity upon mutation. For example, T145A, T253S, and T527N had less inhibition by all of the substrates except citrate (succinate, methylsuccinate, glutarate, α-ketoglutarate, and adipate), suggesting a lower affinity for these dicarboxylates (Fig. 7). The P255T mutant only had changes in inhibition by α-ketoglutarate and adipate. Consistent with the different interactions between Thr-485 and substrates in the model (Figs. 3 and 5), mutation of Thr-485 to alanine (found in the rabbit homolog rbNaDC1) or methionine (found in NaCT) resulted in transporters with specific changes in affinity for citrate (Fig. 7). The remaining mutants had similar inhibitory profiles as the WT NaDC3 (data not shown).
FIGURE 7.

NaDC3 binding site mutants have altered substrate specificity. The WT and mutant NaDC3 transporters were expressed in COS-7 cells. [14C]succinate (10 μm) uptake was measured in the presence and absence of 1 mm test substrate. The uptake rates for the wild-type and mutant transporters are shown as a percentage of the [14C]succinate transport activity measured in the absence of non-radioactive test substrate. Error bars represent mean ± S.E. (n = 3 separate experiments; WT, n = 9). MeS, methylsuccinate; AKG, α-ketoglutarate. *, p < 0.05 compared with WT NaDC3.
As a further test of substrate specificity, we measured the TSR, which provides information on substrate binding during the transition state, an intermediate conformational state during the transport process (34). The TSR is measured using a competitive inhibition assay with two labeled substrates, and it is useful for transporters with low protein expression because it is independent of protein concentration (34). Some of the mutants with changes in substrate specificity in the initial state also exhibited changes in the succinate:glutarate TSR (T145A, T253S, P255T, T485A, and T485M) (Fig. 8B), suggesting alterations in substrate recognition during the transition state. The TSR value for the T527N mutant was difficult to determine accurately because of low activity in the competitive assay, even when measured at 37 °C, although the values appeared to be greater than those of the wild type (Fig. 8). The other mutants had no significant changes in TSR (Fig. 8).
FIGURE 8.

A dual-label competitive transport assay shows alterations in succinate and glutarate handling in NaDC3 binding site mutants. A, competitive uptake of [3H]succinate (10 μm) and [14C]glutarate (20 μm) by WT and mutant NaDC3 expressed in COS-7 cells. The transport was assayed for 20 min. Error bars represent mean ± S.E. (n = 3 separate transfection experiments except for S143A and S483A, where n = 1). B, TSRs (succinate:glutarate) of NaDC3 mutants calculated from competitive uptake data shown in A. Error bars represent mean ± S.E. (n = 3 experiments (S143A and S483A, n = 1)). *, p < 0.05, significantly different from the WT. Because of low succinate transport activity in the T527N mutant, particularly in the presence of the competitive inhibitor glutarate, the assays were done at 37 °C rather than room temperature. WT-37 and T527N-37 refer to the wild-type and T527N mutants assayed at 37 °C.
Cation Specificity
As an initial screen of Na+ affinity, we examined the transport of succinate at 25 mm and 140 mm Na+ to approximate the K0.5 and saturating concentrations of Na+, respectively. Wild-type NaDC3 had ∼50% activity in 25 mm Na+ relative to 140 mm Na+ (Fig. 9A), consistent with the reported K0.5 for Na+ of 20–45 mm (18, 19). The T145A, T253S, P255T, T485A, T485M, T485V, and T527N mutants all had significantly lower succinate transport activity in 25 mm Na+ compared with the WT, suggesting a lower cation affinity. This finding was verified for some of the mutants by measuring the Na+ activation of succinate transport (Fig. 9B). The T253S and T485V mutants had Na+ activation curves that were shifted to the right, indicating higher K0.5 values for Na+ (Fig. 9B). The S483A mutant had a similar K0.5 as the WT (17 mm versus 26 mm, respectively) (Fig. 9B). The deleterious effect of the T253S mutation is in agreement with the role of this residue and the N-terminal SNT motif in sodium ion coordination (Fig. 3B). Furthermore, Ser-483 and Thr-485 of the C-terminal SNT motif are located in close proximity to the putative second sodium ion binding site (i.e. Na2), which was suggested by Mancusso et al. (13) for the vcINDY structure (Fig. 10). Thus, the T485V mutation of a polar to a hydrophobic residue likely disrupts key polar contacts. This hypothesis is supported by the MUpro server (PMID 16372356), which predicted the T485V mutation to increase local stability, probably by increasing the hydrophobic effect in this region.
FIGURE 9.

Altered Na+ handling by NaDC3 binding site mutants. A, sodium affinity screen of [14C]succinate transport (10 μm) in buffer containing 25 mm Na+, expressed as a percentage of the uptake rate measured in 140 mm Na+. Data represent mean ± S.E. (n = 3 experiments). *, p < 0.05, significantly different from WT NaDC3. B, Na+-activation kinetics of succinate transport in WT and mutant NaDC3. Transport of 10 μm [14C]succinate was measured in Na+ concentrations up to 140 mm (NaCl was replaced by choline chloride). Time points were 10 min. Each data point shows the mean of duplicate measurements from a single experiment, and the error bars indicate the range. The KNa values were as follows: WT, 26 mm; S483A, 17 mm; T253S, 95 mm. The data for T485V could not be fitted accurately because the curve did not show saturation.
FIGURE 10.
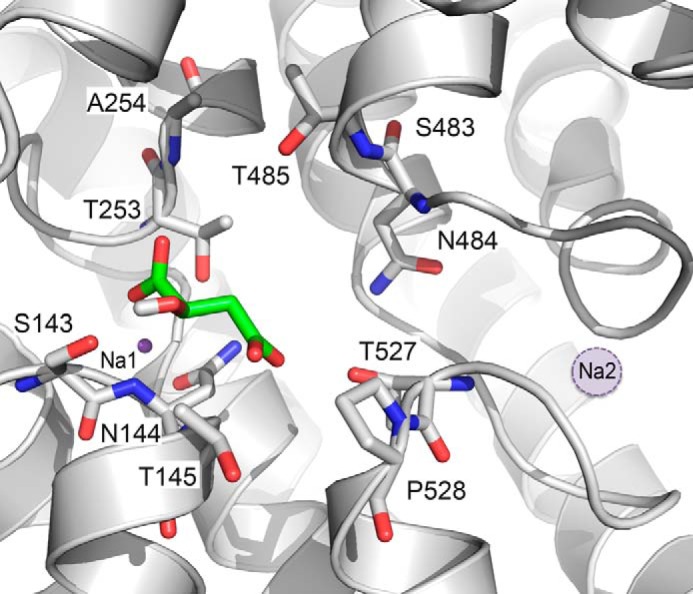
Estimated location of the second Na+ ion, Na2. The NaDC3 model is visualized as gray ribbons with key residues shown as sticks. The substrate malate, which is predicted to be in close proximity to the C-terminal SNT motif, is displayed as green sticks. Oxygen, nitrogen, and hydrogen atoms are depicted in red, blue, and white, respectively. The Na+ ion Na1 is shown as a purple sphere, and the estimated location of the second Na+ binding site, Na2, is shown as a filled circle with a dotted line (purple).
We next examined whether the mutations produced altered cation specificity by measuring transport in the presence of lithium. One of the features of the SLC13/DASS family transporters is the ability to bind lithium at one or more of the three to four cation binding sites (7, 38). In NaDC3, Li+ can partly substitute for Na+ (Fig. 11 and Ref. 7), producing about 8% of the succinate transport activity in Li+ relative to Na+. Moreover, the combination of 10 mm Li+ and 130 mm Na+ resulted in a decrease of succinate transport activity to ∼50% (Fig. 11). Several of the binding site mutants had significantly lower succinate transport activity in the presence of Li+ compared with the wild type (S143A, T145A, T485M or V, and T527N). Furthermore, the S143A, T145A, T253S, and T485A,V mutants had less activity than WT NaDC3 in the presence of Li+ and Na+ together. This result suggests that the binding of lithium does not allow the correct conformational changes to take place to allow optimal succinate binding. Interestingly, the T527N mutant had an increase in activity when the transport buffer contained both Li+ and Na+, suggesting an alteration in one of the cation binding sites by this mutation (Fig. 11). This result is in agreement with the estimated location of Na2 in close proximity to Thr-527 (Fig. 10).
FIGURE 11.

Lithium interactions in NaDC3 mutants. The transport of 10 μm [14C]succinate was measured in transport buffer containing 140 mm LiCl, 10 mm LiCl + 130 mm NaCl, or 10 mm LiCl + 130 mm choline chloride. All data were corrected for background transport in vector-transfected cells. The transport activity in the presence of lithium was expressed as a percentage of the transport activity in the presence of 140 mm NaCl (control). Note the break in scale for T527N, which was stimulated by the combination of 10 mm LiCl + 130 mm NaCl. Error bars represent mean ± S.E. (n = 3–5 separate experiments). *, p < 0.05 compared with WT NaDC3.
DISCUSSION
In humans, key metabolic intermediates of the citric acid cycle, such as succinate and citrate, are transported into cells by the SLC13 family of Na+-coupled di- and tricarboxylate transporters, which belongs to the larger DASS superfamily that also includes lower organisms (14). The cytosolic concentration of these citric acid cycle intermediates regulates important processes ranging from fatty acid synthesis to energy metabolism. Understanding the molecular features that regulate the flux of these molecules into key cells is crucial to the understanding of metabolic regulation in multiple human tissues. A key step toward describing the transport mechanism and substrate specificity of the DASS/SLC13 transporters includes the characterization of transporter structures in complex with their substrates. The goal of this study was to characterize the human NaDC3 by constructing a homology structural model, including its substrate and Na+ binding sites, and to compare this model with the V. cholerae homolog, vcINDY, structure to provide the structural basis for differential substrate specificity among these transporters (13). A model of NaDC3 in an inward-facing, substrate- and Na+-bound conformation was constructed and validated using site-directed mutagenesis and functional transport measurements.
Three key findings emerge from this study. First, the homology model of the human NaDC3 confirms significant features important for transport and identifies previously unknown residues involved in substrate and Na+ binding (Figs. 2 and 3). This finding highlights the importance of integrating homology modeling with experimental testing, which complements experimental determination of structures of homologs from lower organisms to describe structure-function relationships in the human SLC13 family and other transporter families. The final NaDC3 model, followed by experimental validation, revealed that the key residues for function are found at the tips of the two opposing hairpin loops and adjacent unwound helix portions (Figs. 2 and 3). In particular, residues important for substrate binding (Ser-143, Asn-144, Thr-253, and Ala-254) and Na+ coordination at the Na1 cation binding site (Ser-139, Asn-144, Gly-252, Thr-253, Ala-254, and Pro-528) were identified for the first time (Fig. 3). Mutations of the two conserved asparagine residues, Asn-144 and Asn-484, to alanines produced inactive transporters, verifying their critical role in substrate binding. The two conserved serine residues Ser-143 and Ser-483 are important for succinate transport activity but not for substrate or Na+ selectivity (Fig. 3). However, S143A showed altered Li+ sensitivity, suggesting an interaction of this residue with one of the three cation binding sites in NaDC3 that binds both Li+ and Na+ (7). Thr-145 in the N-terminal SNT motif is highly conserved and appears to have a functional role in both substrate recognition and cation affinity (Fig. 3). Notably, the structural role of the majority of these residues is analogous to that of the corresponding residues in the vcINDY structure (Fig. 4) (13).
The second key finding of this study is that several well known functional differences between NaDC3 and other SLC13/DASS family members may be accounted for in this structural model by differences between their binding sites (Fig. 4) and their mode of interactions with their substrates (Fig. 5). This result identifies distinct modes of substrate binding in the DASS/SLC13 transporter family and provides a possible explanation for the broader substrate binding and transport specificity in NaDC3 relative to closely related family members. Specifically, hydrophobic effect and polar interaction, including the proximity to Na+, explain how NaDC3 can bind substrates that are larger and with increased size compared with vcINDY (Figs. 3, 4, and 5). NaDC3 has increased surface accessibility for larger substrates to directly interact with Na1 and a different charge distribution from the positive charge of Na1 that has increased accessibility for substrates.
Differences between NaDC3 and other SLC13 transporters in key positions are likely to determine differences in substrate selectivity. vcINDY and NaDC3 exhibit a sequence identity of ∼33% and highly conserved transmembrane domain and substrate binding sites, but they transport substrates with varying selectivity. In particular, vcINDY transports smaller four-carbon dicarboxylates, such as succinate, malate, and fumarate, whereas NaDC3 handles similar smaller dicarboxylates as well as larger dicarboxylates containing five or six carbon atoms (e.g. glutarate and adipate), bulkier side chains (α-ketoglutarate), and tricarboxylates (e.g. citrate). A comparison of the NaDC3 model and vcINDY structure highlights residues in three positions that determine substrate specificities for these two transporters and are likely to be relevant for the DASS/SLC13 transporters, including Thr-253, Ala-254, and Thr-485. Residues Thr-253 and Ala-254 in NaDC3 replace Ser-200 and Pro-201 in vcINDY, leading to small differences in the substrate binding site of NaDC3 that, when combined, potentially contribute to determining NaDC3 transport of larger and bulkier substrates (Fig. 4).
Thr-485 in the C-terminal SNT motif of NaDC3 may also determine differences in substrate selectivity. This residue is not conserved among all members of the family and is predicted to interact directly with only some of the NaDC3 substrates (Fig. 5). For example, the Thr-485 side chain hydroxyl group makes hydrogen bonds with citrate but not with succinate (Fig. 5, B and D). Mutation of Thr-485 to alanine or methionine, the corresponding residues in NaDC1 and NaCT, respectively, resulted in transporters with specific changes in affinity only for citrate. Furthermore, both mutations affected substrate transport activity. Our model indicates that Thr-485 is located at the interface between the binding site and a hydrophobic region constituted by TM9b, TM5b, and HPout. We hypothesize that the mutation from a polar to a hydrophobic residue increases hydrophobic contacts and stabilizes a specific conformation of the protein. Thus, conformational changes that are required to complete the transport cycle do not take place. This hypothesis is confirmed by the predicted increased stability for the mutated protein, thereby preventing it from undergoing conformational changes needed to complete the transport cycle.
Finally, mutants at position Thr-485 had a lower Na+ affinity than controls, suggesting an interaction of this residue with the other Na+ binding sites or in helping to position the substrate in its interaction with Na1. Consistent with this, Thr-485 is located in the region predicted to contain the Na2 binding site in vcINDY (13) (Fig. 10). Interestingly, mutation of the corresponding Thr-379 of vcINDY to proline (found in the sulfate transporter NaS1) produced a transporter sensitive to inhibition by sulfate (13), but the corresponding T485P mutant of NaDC3 was inactive. Furthermore, a naturally occurring variant of human NaDC1 in the corresponding location, V477M, has decreased affinity for both succinate and Na+ and exhibits a stimulation of transport by Li+ (31). Future studies of modeling additional conformations of NaDC3 and other SLC13 members, such as NaS1, are expected to identify additional specificity determinants for this family.
The third key finding of this study reveals close interactions between substrate and cation binding in NaDC3. The NaDC3 model indicates that one of the carboxyl groups from the substrate interacts directly with Na1 (Fig. 3B). Experimentally, all of the NaDC3 mutants with changes in substrate selectivity also had changes in cation affinity (Figs. 7, 8, and 9). The bound substrate in the vcINDY structure, citrate, does not directly interact with the sodium ion, which provides one explanation for the low affinity for citrate in vcINDY (13). The NaDC3 model has also identified previously unknown residues, such as Thr-253 and Ala-254, that form important interactions with the substrate and ion in addition to the polar interactions between Na1 and the substrate (Fig. 3). We speculate that this network of hydrogen bonds is needed to hold the substrate in position precisely so that it can interact with the cotransported ion. Furthermore, our computational and experimental results support the proposed location of Na2, similar to its putative location in vcINDY (13) (Fig. 10). Therefore, although speculative, it is plausible that a network of hydrogen bonds involving the substrate and both sodium ions determine cation and substrate selectivity, as shown for the T527N mutant (Figs. 10 and 11). The predicted NaDC3 structure and mode of interaction with ligands and sodium share common features with other solute carrier family transporters, even those with unrelated structures and folds, such as the neurotransmitter transporter family related to LeuT (39).
In conclusion, this study demonstrates the residues in NaDC3 that interact with substrates and cations. Key residues are found at the tips of the two opposing hairpin loops and adjacent unwound helix portions. The sodium ion binding site Na1 and substrate binding pocket are conserved in the other SLC13 family members, indicating that the general principles that determine substrate and cation binding in NaDC3 can be generalized to the other SLC13 family members. The structural model of NaDC3 provides a framework for understanding substrate selectivity and the Na+-coupled anion transport mechanism by the human SLC13 family and other key SLC transporters.
Acknowledgments
We thank Chari Smith for critical reading of the manuscript. We also thank Peter Man-Un Ung, Eugene Fluder, and Hyung Min Cho for technical assistance and maintenance of the computational resources required for this study.
This project supported, in whole or in part, by National Institutes of Health Grant R01 GM108911 (to A. S. and C. C.).
- DASS
- divalent anion sodium symporter
- HP
- helical hairpin
- INDY
- I'm not dead yet
- SLC
- solute carrier
- TM
- transmembrane
- TSR
- transport specificity ratio.
REFERENCES
- 1. Gullans S. R., Kone B. C., Avison M. J., Giebisch G. (1988) Succinate alters respiration, membrane potential, and intracellular K+ in proximal tubule. Am. J. Physiol. 255, F1170-F1177 [DOI] [PubMed] [Google Scholar]
- 2. Ruderman N. B., Saha A. K., Vavvas D., Witters L. A. (1999) Malonyl-CoA, fuel sensing, and insulin resistance. Am. J. Physiol. 276, E1–E18 [DOI] [PubMed] [Google Scholar]
- 3. Stoppa G. R., Cesquini M., Roman E. A., Prada P. O., Torsoni A. S., Romanatto T., Saad M. J., Velloso L. A., Torsoni M. A. (2008) Intracerebroventricular injection of citrate inhibits hypothalamic AMPK and modulates feeding behavior and peripheral insulin signaling. J. Endocrinol. 198, 157–168 [DOI] [PubMed] [Google Scholar]
- 4. Pajor A. M. (2014) Sodium-coupled dicarboxylate and citrate transporters from the SLC13 family. Pflugers Arch. 466, 119–130 [DOI] [PubMed] [Google Scholar]
- 5. Rogina B., Reenan R. A., Nilsen S. P., Helfand S. L. (2000) Extended life-span conferred by cotransporter gene mutations in Drosophila. Science 290, 2137–2140 [DOI] [PubMed] [Google Scholar]
- 6. Birkenfeld A. L., Lee H. Y., Guebre-Egziabher F., Alves T. C., Jurczak M. J., Jornayvaz F. R., Zhang D., Hsiao J. J., Martin-Montalvo A., Fischer-Rosinsky A., Spranger J., Pfeiffer A. F., Jordan J., Fromm M. F., König J., Lieske S., Carmean C. M., Frederick D. W., Weismann D., Knauf F., Irusta P. M., De Cabo R., Helfand S. L., Samuel V. T., Shulman G. I. (2011) Deletion of the mammalian INDY homolog mimics aspects of dietary restriction and protects against adiposity and insulin resistance in mice. Cell Metab. 14, 184–195 [DOI] [PMC free article] [PubMed] [Google Scholar]
- 7. Wang H., Fei Y. J., Kekuda R., Yang-Feng T. L., Devoe L. D., Leibach F. H., Prasad P. D., Ganapathy V. (2000) Structure, function and genomic organization of human Na+-dependent high-affinity dicarboxylate transporter. Am. J. Physiol. Cell Physiol. 278, C1019–C1030 [DOI] [PubMed] [Google Scholar]
- 8. Kaufhold M., Schulz K., Breljak D., Gupta S., Henjakovic M., Krick W., Hagos Y., Sabolic I., Burckhardt B. C., Burckhardt G. (2011) Differential interaction of dicarboxylates with human sodium-dicarboxylate cotransporter 3 and organic anion transporters 1 and 3. Am. J. Physiol. Renal Physiol. 301, F1026–F1034 [DOI] [PubMed] [Google Scholar]
- 9. Shuprisha A., Lynch R. M., Wright S. H., Dantzler W. H. (1999) Real-time assessment of α-ketoglutarate effect on organic anion secretion in perfused rabbit proximal tubules. Am. J. Physiol. 277, F513-F523 [DOI] [PubMed] [Google Scholar]
- 10. Burckhardt B. C., Drinkuth B., Menzel C., König A., Steffgen J., Wright S. H., Burckhardt G. (2002) The renal Na+-dependent dicarboxylate transporter, NaDC-3, translocates dimethyl- and disulfhydryl-compounds and contributes to renal heavy metal detoxification. J. Am. Soc. Nephrol. 13, 2628–2638 [DOI] [PubMed] [Google Scholar]
- 11. Schorbach L., Krick W., Burckhardt G., Burckhardt B. C. (2013) Glutathione is a low-affinity substrate of the human sodium-dependent dicarboxylate transporter. Nephron Physiol. 124, 1–5 [DOI] [PubMed] [Google Scholar]
- 12. Huang W., Wang H., Kekuda R., Fei Y. J., Friedrich A., Wang J., Conway S. J., Cameron R. S., Leibach F. H., Ganapathy V. (2000) Transport of N-acetylaspartate by the Na+-dependent high-affinity dicarboxylate transporter NaDC3 and its relevance to the expression of the transporter in the brain. J. Pharmacol. Exp. Ther. 295, 392–403 [PubMed] [Google Scholar]
- 13. Mancusso R., Gregorio G. G., Liu Q., Wang D. N. (2012) Structure and mechanism of a bacterial sodium-dependent dicarboxylate transporter. Nature 491, 622–626 [DOI] [PMC free article] [PubMed] [Google Scholar]
- 14. Prakash S., Cooper G., Singhi S., Saier M. H., Jr. (2003) The ion transporter superfamily. Biochim. Biophys. Acta 1618, 79–92 [DOI] [PubMed] [Google Scholar]
- 15. Forrest L. R., Rudnick G. (2009) The rocking bundle: a mechanism for ion-coupled solute flux by symmetrical transporters. Physiology 24, 377–386 [DOI] [PMC free article] [PubMed] [Google Scholar]
- 16. Söding J., Biegert A., Lupas A. N. (2005) The HHpred interactive server for protein homology detection and structure prediction. Nucleic Acids Res. 33, W244-W248 [DOI] [PMC free article] [PubMed] [Google Scholar]
- 17. Zhang Y. (2008) I-TASSER server for protein 3D structure prediction. BMC Bioinformatics 9, 40. [DOI] [PMC free article] [PubMed] [Google Scholar]
- 18. Saier M. H., Jr., Yen M. R., Noto K., Tamang D. G., Elkan C. (2009) The Transporter Classification Database: recent advances. Nucleic Acids Res. 37, D274-D278 [DOI] [PMC free article] [PubMed] [Google Scholar]
- 19. Schlessinger A., Yee S. W., Sali A., Giacomini K. M. (2013) SLC classification: an update. Clin. Pharmacol. Ther. 94, 19–23 [DOI] [PMC free article] [PubMed] [Google Scholar]
- 20. Schlessinger A., Khuri N., Giacomini K. M., Sali A. (2013) Molecular modeling and ligand docking for solute carrier (SLC) transporters. Curr. Top. Med. Chem. 13, 843–856 [DOI] [PMC free article] [PubMed] [Google Scholar]
- 21. Pei J., Grishin N. V. (2014) PROMALS3D: multiple protein sequence alignment enhanced with evolutionary and three-dimensional structural information. Methods Mol. Biol. 1079, 263–271 [DOI] [PMC free article] [PubMed] [Google Scholar]
- 22. Sali A., Blundell T. L. (1993) Comparative protein modelling by satisfaction of spatial restraints. J. Mol. Biol. 234, 779–815 [DOI] [PubMed] [Google Scholar]
- 23. Shen M. Y., Sali A. (2006) Statistical potential for assessment and prediction of protein structures. Protein Sci. 15, 2507–2524 [DOI] [PMC free article] [PubMed] [Google Scholar]
- 24. Eramian D., Eswar N., Shen M. Y., Sali A. (2008) How well can the accuracy of comparative protein structure models be predicted? Protein Sci. 17, 1881–1893 [DOI] [PMC free article] [PubMed] [Google Scholar]
- 25. Krivov G. G., Shapovalov M. V., Dunbrack R. L., Jr. (2009) Improved prediction of protein side-chain conformations with SCWRL4. Proteins 77, 778–795 [DOI] [PMC free article] [PubMed] [Google Scholar]
- 26. Schlessinger A., Wittwer M. B., Dahlin A., Khuri N., Bonomi M., Fan H., Giacomini K. M., Sali A. (2012) High selectivity of the γ-aminobutyric acid (GABA) transporter 2 (GAT-2, SLC6A13) revealed by structure-based approach. J. Biol. Chem. 287, 37745–37756 [DOI] [PMC free article] [PubMed] [Google Scholar]
- 27. Shaw D. E., Maragakis P., Lindorff-Larsen K., Piana S., Dror R. O., Eastwood M. P., Bank J. A., Jumper J. M., Salmon J. K., Shan Y., Wriggers W. (2010) Atomic-level characterization of the structural dynamics of proteins. Science 330, 341–346 [DOI] [PubMed] [Google Scholar]
- 28. Lindorff-Larsen K., Piana S., Palmo K., Maragakis P., Klepeis J. L., Dror R. O., Shaw D. E. (2010) Improved side-chain torsion potentials for the Amber ff99SB protein force field. Proteins 78, 1950–1958 [DOI] [PMC free article] [PubMed] [Google Scholar]
- 29. Pronk S., Páll S., Schulz R., Larsson P., Bjelkmar P., Apostolov R., Shirts M. R., Smith J. C., Kasson P. M., van der Spoel D., Hess B., Lindahl E. (2013) GROMACS 4.5: a high-throughput and highly parallel open source molecular simulation toolkit. Bioinformatics. 29, 845–854 [DOI] [PMC free article] [PubMed] [Google Scholar]
- 30. Coleman R. G., Carchia M., Sterling T., Irwin J. J., Shoichet B. K. (2013) Ligand pose and orientational sampling in molecular docking. PLoS ONE 8, e75992. [DOI] [PMC free article] [PubMed] [Google Scholar]
- 31. Pajor A. M., Sun N. N. (2010) Single nucleotide polymorphisms in the human Na+-dicarboxylate cotransporter affect transport activity and protein expression. Am. J. Physiol. Renal Physiol. 299, F704-F711 [DOI] [PMC free article] [PubMed] [Google Scholar]
- 32. Pajor A. M., Randolph K. M. (2005) Conformationally sensitive residues in extracellular loop 5 of the Na+/dicarboxylate co-transporter. J. Biol. Chem. 280, 18728–18735 [DOI] [PMC free article] [PubMed] [Google Scholar]
- 33. Oshiro N., King S. C., Pajor A. M. (2006) Transmembrane helices 3 and 4 are involved in substrate recognition by the Na+/dicarboxylate cotransporter, NaDC1. Biochemistry 45, 2302–2310 [DOI] [PubMed] [Google Scholar]
- 34. King S. C. (2004) The “transport specificity ratio”: a structure-function tool to search the protein fold for loci that control transition state stability in membrane transport catalysis. BMC Biochem. 5, 16. [DOI] [PMC free article] [PubMed] [Google Scholar]
- 35. Knauf F., Rogina B., Jiang Z., Aronson P. S., Helfand S. L. (2002) Functional characterization and immunolocalization of the transporter encoded by the life-extending gene Indy. Proc. Natl. Acad. Sci. U.S.A. 99, 14315–14319 [DOI] [PMC free article] [PubMed] [Google Scholar]
- 36. Oshiro N., Pajor A. M. (2006) Ala-504 is a determinant of substrate binding affinity in the mouse Na+/dicarboxylate cotransporter. Biochim. Biophys. Acta 1758, 781–788 [DOI] [PMC free article] [PubMed] [Google Scholar]
- 37. Burckhardt B. C., Lorenz J., Kobbe C., Burckhardt G. (2005) Substrate specificity of the human renal sodium dicarboxylate cotransporter, hNaDC-3, under voltage-clamp conditions. Am. J. Physiol. Renal Physiol. 288, F792-F799 [DOI] [PubMed] [Google Scholar]
- 38. Pajor A. M., Hirayama B. A., Loo D. D. (1998) Sodium and lithium interactions with the Na+/dicarboxylate cotransporter. J. Biol. Chem. 273, 18923–18929 [DOI] [PubMed] [Google Scholar]
- 39. Yamashita A., Singh S. K., Kawate T., Jin Y., Gouaux E. (2005) Crystal structure of a bacterial homologue of Na+/Cl−-dependent neurotransmitter transporters. Nature 437, 215–223 [DOI] [PubMed] [Google Scholar]
- 40. Clamp M., Cuff J., Searle S. M., Barton G. J. (2004) The Jalview Java alignment editor. Bioinformatics 20, 426–427 [DOI] [PubMed] [Google Scholar]
- 41. Kabsch W., Sander C. (1983) Dictionary of protein secondary structure: pattern recognition of hydrogen-bonded and geometrical features. Biopolymers 22, 2577–2637 [DOI] [PubMed] [Google Scholar]