

Abstract
The proliferation index in mantle cell lymphoma (MCL) has not been validated in the context of aggressive therapy regimens in the rituximab era. We assessed Ki67 and PIM1 (a cell cycle-related gene upregulated in blastoid MCL) expression by immunohistochemistry in a phase II study Cancer and Leukemia Group B 59909 of aggressive chemotherapy and rituximab followed by autologous stem cell transplantation plus rituximab in untreated MCL patients < 70 years of age. As a continuous variable or using a cutoff of 35%, higher image analysis (IA Ki67, n = 52) was associated with shorter progression free survival (PFS) (P ≤ 0.030) and event free survival (EFS) (P ≤ 0.017). PIM1 expression (n = 50) was associated with PFS (P = 0.033) and EFS (P = 0.043). Bivariate Cox models showed IA Ki67 and PIM1 were independent of clinical factors. High Ki67 (> 35%) is an important independent prognostic marker in aggressively treated MCL in the rituximab era. PIM1 expression predicts poor outcome and, given its potential role as a therapeutic target, deserves further study.
Keywords: Mantle cell lymphoma, prognosis, Ki67, PIM1, clinical trial, transplant
Introduction
Mantle cell lymphoma (MCL) is considered incurable with a median overall survival of 3–4 years using conventional chemotherapy [1-4]. MCL is characterised clinically by a pattern of continuous relapse following conventional chemotherapy. New therapies are needed and recent studies using high dose chemotherapy regimens with or without stem cell transplant as first line treatment have suggested benefit in terms of response and remission duration; however, whether overall survival is improved upon compared with conventional therapies remains to be proven [3,5-9].
Pathologically, MCL is composed of small, mature appearing lymphocytes with slight nuclear irregularities. The nodal infiltration is usually diffuse, although nodular and, rarely, mantle zone variants may be seen. The relatively aggressive nature is characterised by the frequent presence of mitotic figures, a feature unusual in other B-cell lymphomas of small lymphocytes. At the molecular genetic level, the vast majority of cases harbour an IGH-CCND1 fusion as a consequence of the t(11;14)(q13;q32) resulting in overexpression of cyclin D1 protein, a diagnostic hallmark of this lymphoma. Only rare cases lack this abnormality and likely have abnormalities in other cyclins, such as cyclin D2 [10].
To elucidate molecular features of MCL, gene expression profiling has been performed in MCL and a recent seminal study has shown that a quantitative proliferation gene signature is a powerful predictor of outcome in MCL [11]. Several groups have investigated the significance of proliferation in MCL as measured by single markers such as Ki67 and have shown that high proliferative fraction was associated with poor outcome in the studied populations [12,13]. Indeed, other indicators of increased proliferation such as mitotic counts and blastoid morphology have been associated with poor prognosis in MCL [1,14]. These studies have been retrospective in nature and were performed on heterogeneously treated patients. Furthermore, prognostic significance of the proliferation index has not been examined in the context of combined high-dose therapy and rituximab.
Blastoid MCL is a variant of MCL with an extremely poor prognosis in which PIM1 has been found to be over-expressed [13,15,16]. PIM1, a serine/threonine kinase and protooncogene, has been implicated in lymphomagenesis with proliferative and anti-apoptotic effects [17-21]. It is a member of a family of proteins containing homologues PIM2 and PIM3, and is transcriptionally regulated by cytokines, mitogens and numerous growth factors [22-24]. The enzymatic substrates reported for PIM kinases are diverse (p100, Bad, NFATc1, p21/Cip1, Cdc25a, SOCS), suggesting that PIM kinases play a central regulatory role in numerous processes [25-30]. Elevated expression of PIM kinases has been described predominantly in murine and human leukemias and lymphomas [24,31-33]. Studies using either PIM transgenic or PIM knockout mice suggest that overlapping functions exist for PIM1 and PIM2, and that the full transforming potential of PIM kinases cannot be realised in vivo without cooperation from other oncogenes, including MYC and MYCN [33,34]. PIM1 has been implicated in the development of leukemias, lymphomas, in late progression events and also in prostate cancer [35]. Therefore, PIM1 is a target of drug development programs. With the promise of improved outcome in MCL patients treated with high dose therapy and rituximab, we have examined the prognostic importance of the proliferation marker Ki67 and PIM1 in predicting outcome in patients enrolled in Cancer and Leukemia Group B (CALGB) 59909 [36].
Methods
Patients
CALGB 59909 is a phase 2 trial for newly diagnosed MCL with planned intensive cytoreduction with rituximab plus methotrexate and augmented-dose CHOP, consolidation with high-doses of cytarabine and etopside with rituximab added to in vivo purge mobilised autologous peripheral blood stem cells, and then autologous stem cell transplantation following high-doses of carmustine, etoposide and cyclophosphamide. Rituximab was also given post-transplant. The preliminary clinical results have been reported in abstract form [36]. Each participant signed an IRB-approved, protocol-specific informed consent in accordance with federal and institutional guidelines. Hematoxylin and eosin stained slides were scanned with the Aperio ScanScope system (Aperio, Vista, CA) at a 400 × microscope resolution at the CALGB Pathology Coordinating Office (PCO, Columbus, OH) and reviewed via the internet using ImageScope software (Aperio, ImageScope version 8.2.5.1263) with anonymised pathology reports. Two panel pathologists reviewed each case and a case was eligible for study if agreement in diagnosis was reached independently. In the case of disagreement, a third hematopathologist reviewed the case as arbitrator. Cyclin D1 immunohistochemistry (IHC) (clone SP1) was performed at the PCO using automated immunostainers (Ventana Benchmark, Tucson, AZ) and cyclin D1 expression was required for eligibility.
Fifty-two patients had available stained slides for image analysis (IA) Ki67, 49 were available for manual counting and 50 patients had PIM1 data available. Given that there were more patients available with IA Ki67 than manual Ki67, IA Ki67 forms the basis for this analysis.
Immunohistochemistry
Ki67 staining (rabbit monoclonal clone 30-9, Ventana Medical Systems, Tucson, AZ) was performed at the Cleveland Clinic using an automated immunostainer (Ventana Benchmark, Ventana). Antigen retrieval was performed using CC1 (Ventana) and primary incubation time was 16 min. Ki67 staining was evaluated by two methods: 1) manual counting # positive cells per high power field (hpf, mean of five fields) (Olympus BX40, Olympus, Center Valley, PA; 100 × immersion oil objective, 10 mm × 22 mm ocular) and 2) computerised IA. For IA, the entire histologic sections stained for Ki67 were scanned using an Aperio XT whole slide scanner (Aperio, Vista, CA) using a 20 × objective (performed at University of Los Angeles). Areas of the section selected as suitable for Ki67 quantitation were captured using the Aperio ImageScope viewer. Once images were acquired, Metamorph software (Molecular Devices, Downington, PA) was used to threshold the images using a Hue Saturation Intensity algorithm. The parameters (area, intensity) were quantified using the Metamorph integrated morphometry analysis module. The measurements were exported to an Excel file. An average of 15,000 cells (average fields selected based on areas with technically adequate staining) were counted per case (range from 2000 to 47,000 cells depending on the size of the sections). Figures 1(A) and 1(B) show two examples of Ki67 staining.
Figure 1.
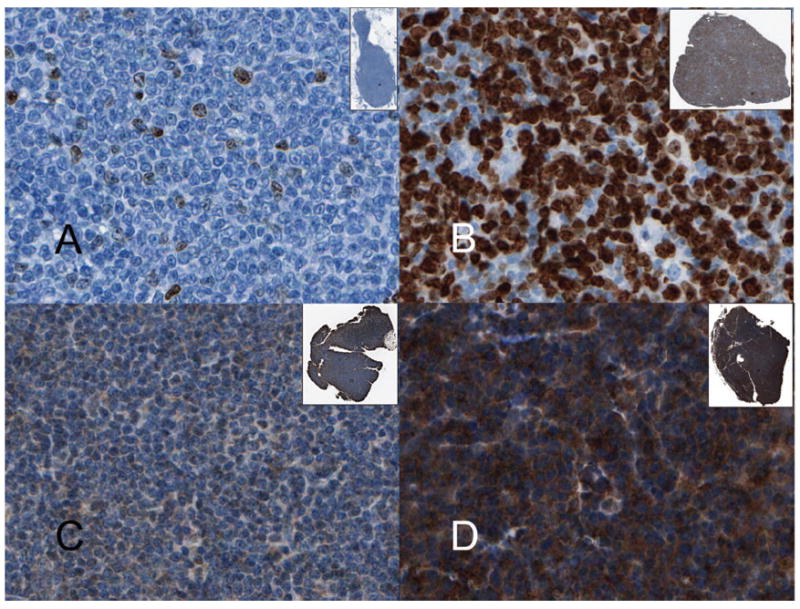
MCL immunohistochemistry. (A) MCL with low Ki67 index of 3% (400 × original magnification); (B) MCL with Ki67 index of 80% (400 × original magnification); (C) Weakly positive PIM1 staining scored as 1+ (400 × original magnification); (D) Strongly positive PIM1 staining scored as 3+ (400 × original magnification). Insets show the scanned image of the biopsy at 1 ×.
PIM1 staining was performed at Cross Cancer Centre using standard techniques: whole tissue and microarray sections were deparaffinised and rehydrated with graded alcohol. Heat-induced epitope retrieval was performed using Tris buffer (pH 9.9; Dako, Mississauga, Ontario, Canada) and a rapid microwave histoprocessor (RHS, Milestone, Bergamo, Italy). Endogenous peroxidase activity was blocked by incubating samples in 3% H2O2 for 10 min, followed by a wash with water and then phosphate-buffered saline (PBS; pH 7.2). Tissue sections were then incubated with 1:25 dilution of polyclonal PIM-1 antibody (Biolynx INC San Diego, USA) overnight in a humidified chamber at 4°C. After two washes with PBS, tissue sections were incubated with anti-rabbit IgG and peroxidase (EnVision, Dako) for 30 min at room temperature. After two washes with PBS, tissue sections were incubated with 3,3′-diaminobenzidine/H2O2 (Dako) for colour development and hematoxylin was used as a counter stain. PIM1 expression was evaluated by two hematopathologists. For each case, a score of 0–3+ was given based on the intensity of staining that was present in the majority of the cells (0 = absent, 1+ = weak 2+ = moderate, 3+ = strong). Figures 1(C) and 1(D) show cases scored as 1+ and 3+, respectively.
Statistical analysis
Cox regression was used to determine associations between IHC markers and outcome. For a robust inference, the Cox regression model uses the rank of a marker value, instead of the raw value, as a covariate [37]. Progression free survival (PFS, time until progression, censoring deaths due to treatment or other causes) and event free survival (EFS, time until progression or death from any cause) were used as clinical endpoints. Kaplan–Meier and log rank testing was used for graphical representation of survival analysis. Wilcoxon rank-sum and Fisher’s Exact testing was used for comparison of continuous and categorical data, respectively.
Results
Clinical characteristics and histology
Fifty two cases were eligible for inclusion based on histology review and expression of cyclin D1 and IA Ki67 data. Four cases (8%) had blastoid morphology. All patients received the planned autologous stem cell transplantation (ASCT) and rituximab. Median follow-up was 3.7 years with a range of 2.4–5.4 years among living patients. The 3 year PFS and EFS for this cohort were 0.57 (95% confidence interval (CI) 0.42–0.70) and 0.52 (95% CI 0.37–0.64), respectively. The baseline clinical features are summarised in Table I. Increased LDH was associated with higher Ki67 index (P = 0.01). Table I also shows the association of these characteristics with outcome. None of the clinical factors were significantly associated with outcome with the exception of elevated LDH (associated with PFS, P = 0.046), likely due to the relative small number of patients in this study. Stage III/IV disease was also associated with shorter PFS; however, over 90% of patients had high stage disease. The IPI was also not associated with outcome. Although there were only four cases, blastoid morphology was associated with shorter PFS and EFS.
Table I.
Baseline characteristics and association With PFS and EFS.
| KI 67 ≤ 35% (n = 35) | KI 67 > 35% (n = 17) | All patients (n = 52) | P-value* | PFS HR (95% CI) | P-value* | EFS HR (95% CI) | P-value* | |
|---|---|---|---|---|---|---|---|---|
| Age (median, range) | 56 (37–68) | 57 (39–68) | 56 (37–68) | 0.95 | ||||
| Age > 60 | 9 (25.7%) | 5 (29.4%) | 14 (26.9%) | 1.00 | 0.96 (0.38, 2.42) | 0.924 | 1.27 (0.57, 2.80) | 0.557 |
| Male | 28 (80.0%) | 13 (76.5%) | 41 (78.8%) | 1.00 | 0.71 (0.28, 1.80) | 0.470 | 0.62 (0.27, 1.40) | 0.240 |
| Performance status > 1 | 3 (8.6%) | 2 (11.8%) | 5 (9.6%) | 1.00 | 1.96 (0.58, 6.60) | 0.267 | 2.28 (0.79, 6.60) | 0.118 |
| Elevated LDH | 8 (22.9%) | 10 (58.8%) | 18 (34.6%) | 0.015 | 2.28 (0.99, 5.24) | 0.046 | 1.96 (0.90, 4.25) | 0.083 |
| > 1 Extra-nodal site | 18 (52.9%) | 9 (52.9%) | 27 (52.9%) | 1.00 | 1.47 (0.64, 3.41) | 0.362 | 1.11 (0.53, 2.33) | 0.790 |
| missing data | 1 | 0 | 1 | |||||
| Stage III/IV | 34 (97.1%) | 16 (94.1%) | 50 (96.2%) | 1.00 | 0.25 (0.06, 1.06) | 0.042 | 0.30 (0.07, 1.27) | 0.082 |
| B symptoms | 7 (20.0%) | 8 (47.1%) | 15 (28.8%) | 0.06 | 0.81 (0.30, 2.18) | 0.681 | 1.18 (0.52, 2.66) | 0.699 |
| Marrow involvement | 25 (73.5%) | 13 (76.5%) | 38 (74.5%) | 1.00 | 0.72 (0.30, 1.72) | 0.454 | 0.56 (0.26, 1.22) | 0.139 |
| Missing data | 1 | 0 | 1 | |||||
| IPI | 0.30 | 1.58 (0.69, 3.58) | 0.273 | 1.52 (0.72, 3.21) | 0.270 | |||
| Low | 7 (20.6%) | 2 (11.8%) | 9 (17.6%) | |||||
| Low/Int | 14 (41.2%) | 6 (35.3%) | 20 (39.2%) | |||||
| Int/High | 9 (26.5%) | 4 (23.5%) | 13 (25.5%) | |||||
| High | 4 (11.8%) | 5 (29.4%) | 9 (17.6%) | |||||
| Missing data | 1 | 0 | 1 | |||||
| Blastoid morphology | 2 (5.7%) | 2 (11.8%) | 4 (7.7%) | 0.59 | 5.23 (1.51, 18.15) | 0.004 | 5.84 (1.95, 15.50) | 0.0004 |
IPI, international prognostic index, EFS, event free survival; PFS, progression free survival; HR, hazards ratio; CI, confidence interval; LDH, lactate dehydrogenase.
Wilcoxon rank sum for continuous or ordered categorical variables, Fisher’s exact for dichotomous variables.
Ki67 expression and outcome
Ki67 staining showed the appropriate nuclear pattern in all cases (Figure 1). Expressed as a percentage of positive cells, we found substantial variability in IA Ki67 (range 0.01–84%, median 27.8%). Manual Ki67 data was available in 49 cases. Despite the different methods of evaluation, there was a high degree of correlation (Spearman correlation coefficient of 0.79, P < 0.0001) between IA and manual methods. When considered as a continuous variable, IA Ki67 was statistically associated with shorter PFS and EFS (P = 0.013 and P = 0.007, respectively, Cox proportional hazards) [37]. The importance of Ki67 as a marker of poor outcome was confirmed in analysis of the manual Ki67 data, in which increased Ki67 staining was also associated with poor outcome (P = 0.02 for PFS and P = 0.005 for EFS, Cox proportional hazards) [37]. For purposes of showing this relationship, a cutoff of 35% maximises the differences (Table II). Figures 2(A) and 2(B) show patients with a high IA Ki67 had a shorter PFS and EFS compared with those with low IA Ki67.
Table II.
Immunohistochemical markers and correlation with outcome.
| PFS HR (95% CI) | P-value* | EFS HR (95% CI) | P-value* | |
|---|---|---|---|---|
| IA Ki67 > 35% | 2.45 (1.06, 5.63) | 0.030 | 2.46 (1.14, 5.31) | 0.017 |
| PIM1 > 1+ | 2.35 (1.05, 5.27) | 0.033 | 2.10 (1.01, 4.37) | 0.043 |
EFS, event free survival; PFS, progression free survival; HR, hazards ratio; CI, confidence interval.
Cox-regression analysis.
Figure 2.
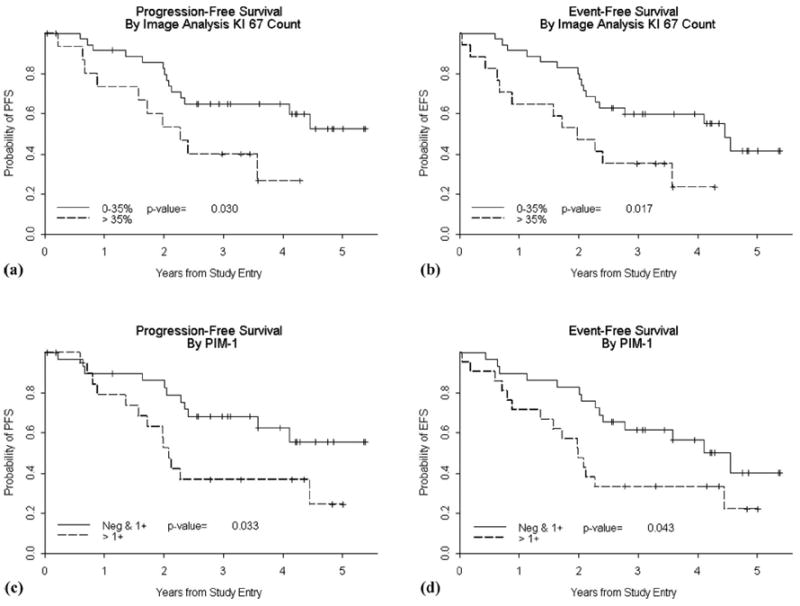
Kaplan–Meier curves for PFS (A) and EFS (B) showing a statistically significant shorter survival for patients with high Ki67 index (dotted line) compared to those with a low Ki67 index (< 35%, solid line). Kaplan–Meier curves for PFS (C) and EFS (D) showing a statistically significant shorter survival for patients with PIM1 scores of 2+ or 3+ (dotted line), compared to cases with low expression (solid line). P values reflect the log-rank test.
PIM1 expression and outcome
PIM1 IHC was available on 50 patients. Fourteen patients were negative for PIM1, 36 patients were scored as 1+, 19 patients were scored as 2+ and five patients as 3+ (Figure 1). There were no statistically significant relationships between clinical features noted in Table I and PIM1 score. There was no correlation between PIM1 expression and blastoid morphology. When considering PIM1 as a semiquantitative variable there was no correlation between PIM and IA Ki67 staining (Spearman correlation coefficient of 0.03, P = 0.86). There was a statistically significantly shorter PFS (P = 0.033) and EFS (P = 0.043) for patients with biopsies showing high expression (2+ or higher) compared to those with low PIM1 expression (Table II). Figures 2(C) and 2(D) show Kaplan–Meier curves illustrating this association.
Multivariable analysis
Although there were relatively few cases and events, we explored factors potentially confounding the associations seen with Ki67 and PIM1. Multivariate Cox models were fit including each of the baseline characteristics listed in Table I. None of the factors changed the relationship of Ki67 with outcome, i.e., IA Ki67 is an independent predictor of PFS and EFS, controlling for gender, marrow involvement and IPI risk factors, including LDH. Likewise, PIM1 > 1+ was also independent of factors in Table I.
Discussion
The clinical outcome for MCL is poor; however, substantial variability exists with some patients succumbing in less than a year while others may survive 10 years or longer [1,4,38,39]. Since its recognition as a distinct entity, numerous studies have been published identifying prognostic factors that have ranged from standard morphologic features such as blastoid morphology or mitotic counts [14,40] to increased Ki67 index [12,13,41], P53 overexpression and other cell cycle protein expression abnormalities [42-44]. More sophisticated comparative genomic hybridisation abnormalities or gene expression profiles have also been shown to have prognostic value [11,45,46]. The importance of cell cycle and proliferation in determining the clinical behaviour of MCL has been confirmed by expression profiling and a quantitative proliferation signature has been proposed based on 20 genes that belonged to a larger set of proliferation signature genes that were highly variably expressed in MCL and associated with survival [11]. Although these latter developments are exciting and potentially useful, they are still impractical for routine use.
Most of the studies to date using conventional techniques such as IHC, have confirmed the prognostic value of Ki67 staining and, in fact, its use has been advocated in the new MCL international prognostic index [47]. Most studies evaluating this proliferation marker have been performed outside the context of a single clinical trial [12,13,41,48,49]. Investigators have also found Ki67 level to remain predictive of outcome in multivariate analysis [12,13,41,48]. However, patient populations were clinically heterogeneous and manual methods were used for evaluation of Ki67 (Table III).
Table III.
Ki-67 staining and prognosis in mantle cell lymphoma.
| Study | N | Ki67 antigen antibody | Cutoff | Counting method | Treatment | Significant in univariate analysis (OS) | Significant in multivariable analysis (OS) |
|---|---|---|---|---|---|---|---|
| Raty et al. 2002 | 127 | Polyclonal | 26% | Manual | Variable SCT (5.5%) | Y | Y |
| Schrader et al. 2004 | 95 | KiS5 | 10% | Manual | Variable SCT (0%) | Y | N |
| Katzenberger et al. 2006 | 134 | MIB1 | Tiered* | Manual | Variable SCT% not specified | Y | Y |
| Tiemann et al. 2005 | 304 | MIB1 or KiS5 | Quartiles† | Manual | Variable SCT% not specified | Y | Y |
| Hui et al. 2005 | 48 | Not specified | 50% | Manual | Variable SCT% not specified | Y | Y |
| Determann et al. 2008 | 249 | MIB1 or KiS5 | 10%, 30% | Manual | Variable, cohorts with CHOP ± rituximab | Y | Y (CHOP) N (CHOP + rituximab) |
| Current study | 52 | 30-9 | 35% | Image analysis | SCT (100%) with rituximab | Y# | Y# |
OS, overall survival; SCT, stem cell transplant.
< 20%, 21–40%, 41–60%, > 60%;
Also tested 10% and 40%.
PFS and EFS.
A prognostic marker must be evaluated in the context of the treatment regimen of the study group, as novel treatment approaches may alter the utility of prognostic markers. Rituximab is now commonly used in MCL treatment. A single study has evaluated Ki67 in patients treated with rituximab-CHOP chemotherapy and reported that high Ki67 (≥ 30%) predicted poor outcome [50]. We have now demonstrated that high Ki67 remains a poor prognostic indicator in the setting of high dose chemotherapy/stem cell transplantation regimens containing rituximab. Of note, our cutoff of 35% is similar to the high level suggested by Determann [50]. To our knowledge, the current study is also the first to use IA to more objectively quantify Ki67 in MCL. Indeed, computerised methods of Ki67 quantitation have been shown to be reproducible within and between operators, with correlation coefficients over 0.9 [51,52], a prerequisite for widespread use outside the setting of controlled clinical trials. Indeed, a recent study showed problems with reproducible scoring of Ki67 when a semiquantitative visual estimate was used [53]. Thus use of IA is suggested in future practice. It is interesting that the proliferation signature defined by gene expression analysis did not include Ki67 [11]. This may be due to differences in protein and RNA expression or complex interactions of multiple genes serving to outweigh Ki67 as part of the model. Nevertheless, Ki67 as a single biomarker, correlated with proliferation signature in the small number of cases in which both were available [11]. It appears to be a robust MCL prognostic marker, both in conventionally treated patients and in patients receiving high dose therapy with rituximab.
Blastoid MCL is an aggressive variant of MCL and PIM1 has been found to be overexpressed in this variant, leading some to propose therapeutic targeting of this molecule [15,16,54]. We, therefore, also examined expression of PIM1 in these cases. PIM1 has been implicated in anti-apoptosis through the phosphorylation of p21cip1/waf1 [55], which is thought to mediate survival by binding to and preventing the activation of pro-caspase-3 [56]. Most recently, the PIM1 kinase has been found to promote inactivation of the pro-apoptotic Bad protein by phosphorylating it on the Ser112 gatekeeper site [57]. PIM1 is a target of the gp130-mediated STAT3 signalling pathway [58]. It is stabilised by HSP-90 [59] and it phosphorylates the tyrosine phosphatase Cdc25 [60], which plays a critical role in G1/S cell cycle transition. In addition, PIM1 and PIM2 regulate rapamycin-resistant T cell growth and survival [61]. Thus, PIM kinases have defined biological roles in cell survival, proliferation and differentiation [24]. Consistent with these roles, PIM1 expression appears to be a marker of aggressive disease in MCL, even in the absence of blastoid morphology. Indeed, PIM1 was scored as > 1+ in 48% of cases and there was no association with blastoid morphology or Ki67.
Since blastoid histology is known to be associated with poor outcome, it may be that PIM1 expression also identifies cases with blastoid-like biologic features while not demonstrating overt “blastoid” cytologic features. Because of the small number of cases available for this study, additional study of PIM1 and other PIM kinases is warranted. The kinase activity of PIM1 is directly linked to the expression level of PIM1. But mutations in PIM1 have been reported in diffuse large B-cell lymphomas that result in altered function [62]. Perhaps measuring the kinase activity of PIM1 or phosphorylated substrates of PIM1 by IHC (as a surrogate of PIM1 activity) may be even more informative than the protein expression level.
New therapies are needed for MCL. The poor outcome and lack of standardised therapy has spurred numerous clinical trials. Aggressive treatment protocols with or without autologous stem cell transplantation have been attempted with promising results, including a relatively high rate of durable remissions [5,6,63,64]. CALGB 59909 follows in a similar vein [36]. As in prior studies with conventional therapies, Ki67 staining pattern inversely correlated with EFS and thus appears to remain an important biologic marker of outcome. Taken together, the evidence is now overwhelming in support of the Ki67 proliferative index as a prognostic marker in MCL. As shown in this study, this includes those patients treated with high dose therapies, stem cell transplantation and rituximab. Issues of technical standardisation remain to be completely resolved; however, Ki67 is a robust marker with control tissues commonly available such as hyperplastic lymph nodes or tonsil that can easily be evaluated for quality of stain and IA should make reporting more reproducible. In combination with IA, we believe it is time to develop prognostic models that incorporate this widely available biologic marker. In particular, we agree with the proposal to include the Ki67 index in prognostic scoring systems [47] with the goal of increasing our ability to stratify patients at diagnosis and select appropriate therapy.
Acknowledgments
The authors acknowledge the CALGB Pathology Coordinating Office for their technical support. E. D. H. was supported by CA04919, S.-H. J. was supported by CA33601, R. L. was supported by CA016254, J. L. J. was supported by CA33601, J. R. C. was supported CA04919, D. J. was supported by CA105409, S. D. was supported by CA58348, B. D. C. was supported by CA77597, L. E. D. was supported by CA60138, J. S. was supported by CA58348. The research for CALGB 59909 was supported, in part, by grants from the National Cancer Institute (CA31946) to the Cancer and Leukemia Group B (Richard L. Schilsky, MD, Chairman) and to the CALGB Statistical Center (Stephen George, PhD, CA33601). The content of this manuscript is solely the responsibility of the authors and does not necessarily represent the official views of the National Cancer Institute. Dana-Farber Cancer Institute, Boston, MA–Eric P. Winer, M.D., supported by CA32291. Dartmouth Medical School – Norris Cotton Cancer Center, Lebanon, NH–Marc S. Ernstoff, M.D., supported by CA04326. Georgetown University Medical Center, Washington, DC–Minetta C. Liu, M.D., supported by CA77597. Illinois Oncology Research Association, Peoria, IL–John W. Kugler, M.D., supported by CA35113. Mount Sinai School of Medicine, New York, NY–Lewis R. Silverman, M.D., supported by CA04457. North Shore – Long Island Jewish Medical Center, Manhasset, NY–Daniel R Budman, M.D., supported by CA35279. State University of New York Upstate Medical University, Syracuse, NY–Stephen L. Graziano, M.D., supported by CA21060. The Ohio State University Medical Center, Columbus, OH–Clara D Bloomfield, M.D., supported by CA77658. University of California at San Diego, San Diego, CA–Joanne Mortimer, M.D., supported by CA11789. University of California at San Francisco, San Francisco, CA–Alan P. Venook, M.D., supported by CA60138. University of Chicago, Chicago, IL –Gini Fleming, M.D., supported by CA41287. University of North Carolina at Chapel Hill, Chapel Hill, NC–Thomas C. Shea, M.D., supported by CA47559. Vermont Cancer Center, Burlington, VT–Hyman B. Muss, M.D., supported by CA77406. Wake Forest University School of Medicine, Winston-Salem, NC–David D Hurd, M.D., supported by CA03927. Washington University School of Medicine, St. Louis, MO–Nancy Bartlett, M.D., supported by CA77440. Weill Medical College of Cornell University, New York, NY–Scott Wadler, M.D., supported by CA07968. Western Pennsylvania Cancer Institute, Pittsburgh, PA–Richard K. Shadduck, M.D.
References
- 1.Bosch F, Lopez-Guillermo A, Campo E, Ribera JM, Conde E, Piris MA, et al. Mantle cell lymphoma: presenting features, response to therapy, and prognostic factors. Cancer. 1998;82:567–575. doi: 10.1002/(sici)1097-0142(19980201)82:3<567::aid-cncr20>3.0.co;2-z. [DOI] [PubMed] [Google Scholar]
- 2.Campo E, Raffeld M, Jaffe ES. Mantle-cell lymphoma. Semin Hematol. 1999;36:115–127. [PubMed] [Google Scholar]
- 3.Evans LS, Hancock BW. Non-Hodgkin lymphoma. Lancet. 2003;362:139–146. doi: 10.1016/S0140-6736(03)13868-8. [DOI] [PubMed] [Google Scholar]
- 4.Fisher RI, Dahlberg S, Nathwani BN, Banks PM, Miller TP, Grogan TM. A clinical analysis of two indolent lymphoma entities: mantle cell lymphoma and marginal zone lymphoma (including the mucosa-associated lymphoid tissue and mono-cytoid B-cell subcategories): a Southwest Oncology Group study. Blood. 1995;85:1075–1082. [PubMed] [Google Scholar]
- 5.Ritchie DS, Seymour JF, Grigg AP, Roberts AW, Hoyt R, Thompson S, et al. The hyper-CVAD-rituximab chemotherapy programme followed by high-dose busulfan, melphalan and autologous stem cell transplantation produces excellent event-free survival in patients with previously untreated mantle cell lymphoma. Ann Hematol. 2007;86:101–105. doi: 10.1007/s00277-006-0193-2. [DOI] [PubMed] [Google Scholar]
- 6.Romaguera JE, Fayad L, Rodriguez MA, Broglio KR, Hagemeister FB, Pro B, et al. High rate of durable remissions after treatment of newly diagnosed aggressive mantle-cell lymphoma with rituximab plus hyper-CVAD alternating with rituximab plus high-dose methotrexate and cytarabine. J Clin Oncol. 2005;23:7013–7023. doi: 10.1200/JCO.2005.01.1825. [DOI] [PubMed] [Google Scholar]
- 7.Thieblemont C, Antal D, Lacotte-Thierry L, Delwail V, Espinouse D, Michallet AS, et al. Chemotherapy with rituximab followed by high-dose therapy and autologous stem cell transplantation in patients with mantle cell lymphoma. Cancer. 2005;104:1434–1441. doi: 10.1002/cncr.21313. [DOI] [PubMed] [Google Scholar]
- 8.Vigouroux S, Gaillard F, Moreau P, Harousseau JL, Milpied N. High-dose therapy with autologous stem cell transplantation in first response in mantle cell lymphoma. Haematologica. 2005;90:1580–1582. [PubMed] [Google Scholar]
- 9.Zelenetz AD. Mantle cell lymphoma: an update on management. Ann Oncol. 2006;17(Suppl 4):iv12–iv14. doi: 10.1093/annonc/mdj992. [DOI] [PubMed] [Google Scholar]
- 10.Fu K, Weisenburger DD, Greiner TC, Dave S, Wright G, Rosenwald A, et al. Cyclin D1-negative mantle cell lymphoma: a clinicopathological study based on gene expression profiling. Blood. 2005;106:4315–4321. doi: 10.1182/blood-2005-04-1753. [DOI] [PMC free article] [PubMed] [Google Scholar]
- 11.Rosenwald A, Wright G, Wiestner A, Chan WC, Connors JM, Campo E, et al. The proliferation gene expression signature is a quantitative integrator of oncogenic events that predicts survival in mantle cell lymphoma. Cancer Cell. 2003;3:185–197. doi: 10.1016/s1535-6108(03)00028-x. [DOI] [PubMed] [Google Scholar]
- 12.Katzenberger T, Petzoldt C, Holler S, Mader U, Kalla J, Adam P, et al. The Ki67 proliferation index is a quantitative indicator of clinical risk in mantle cell lymphoma. Blood. 2006;107:3407. doi: 10.1182/blood-2005-10-4079. [DOI] [PubMed] [Google Scholar]
- 13.Tiemann M, Schrader C, Klapper W, Dreyling MH, Campo E, Norton A, et al. Histopathology, cell proliferation indices and clinical outcome in 304 patients with mantle cell lymphoma (MCL): a clinicopathological study from the European MCL Network. Br J Haematol. 2005;131:29–38. doi: 10.1111/j.1365-2141.2005.05716.x. [DOI] [PubMed] [Google Scholar]
- 14.Argatoff LH, Connors JM, Klasa RJ, Horsman DE, Gascoyne RD. Mantle cell lymphoma: a clinicopathologic study of 80 cases. Blood. 1997;89:2067–2078. [PubMed] [Google Scholar]
- 15.de Vos S, Krug U, Hofmann WK, Pinkus GS, Swerdlow SH, Wachsman W, et al. Cell cycle alterations in the blastoid variant of mantle cell lymphoma (MCL-BV) as detected by gene expression profiling of mantle cell lymphoma (MCL) and MCL-BV. Diagn Mol Pathol. 2003;12:35–43. doi: 10.1097/00019606-200303000-00005. [DOI] [PubMed] [Google Scholar]
- 16.Zhu Y, Hollmen J, Raty R, Aalto Y, Nagy B, Elonen E, et al. Investigatory and analytical approaches to differential gene expression profiling in mantle cell lymphoma. Br J Haematol. 2002;119:905–915. doi: 10.1046/j.1365-2141.2002.03931.x. [DOI] [PubMed] [Google Scholar]
- 17.Bachmann M, Hennemann H, Xing PX, Hoffmann I, Moroy T. The oncogenic serine/threonine kinase Pim-1 phosphorylates and inhibits the activity of Cdc25C-associated kinase 1 (C-TAK1): a novel role for Pim-1 at the G2/M cell cycle checkpoint. J Biol Chem. 2004;279:48319–48328. doi: 10.1074/jbc.M404440200. [DOI] [PubMed] [Google Scholar]
- 18.Bachmann M, Moroy T. The serine/threonine kinase Pim-1. Int J Biochem Cell Biol. 2005;37:726–730. doi: 10.1016/j.biocel.2004.11.005. [DOI] [PubMed] [Google Scholar]
- 19.Hu YL, Passegue E, Fong S, Largman C, Lawrence HJ. Evidence that the Pim1 kinase gene is a direct target of HOXA9. Blood. 2007;109:4732–4738. doi: 10.1182/blood-2006-08-043356. [DOI] [PMC free article] [PubMed] [Google Scholar]
- 20.Mikkers H, Nawijn M, Allen J, Brouwers C, Verhoeven E, Jonkers J, et al. Mice deficient for all PIM kinases display reduced body size and impaired responses to hematopoietic growth factors. Mol Cell Biol. 2004;24:6104–6115. doi: 10.1128/MCB.24.13.6104-6115.2004. [DOI] [PMC free article] [PubMed] [Google Scholar]
- 21.Zippo A, De Robertis A, Serafini R, Oliviero S. PIM1-dependent phosphorylation of histone H3 at serine 10 is required for MYC-dependent transcriptional activation and oncogenic transformation. Nat Cell Biol. 2007;9:932–944. doi: 10.1038/ncb1618. [DOI] [PubMed] [Google Scholar]
- 22.Feldman JD, Vician L, Crispino M, Tocco G, Marcheselli VL, Bazan NG, et al. KID-1, a protein kinase induced by depolarization in brain. J Biol Chem. 1998;273:16535–16543. doi: 10.1074/jbc.273.26.16535. [DOI] [PubMed] [Google Scholar]
- 23.van der Lugt NM, Domen J, Verhoeven E, Linders K, van der Gulden H, Allen J, et al. Proviral tagging in E mu-myc transgenic mice lacking the Pim-1 proto-oncogene leads to compensatory activation of Pim-2. EMBO J. 1995;14:2536–2544. doi: 10.1002/j.1460-2075.1995.tb07251.x. [DOI] [PMC free article] [PubMed] [Google Scholar]
- 24.Wang Z, Bhattacharya N, Weaver M, Petersen K, Meyer M, Gapter L, et al. Pim-1: a serine/threonine kinase with a role in cell survival, proliferation, differentiation and tumorigenesis. J Vet Sci. 2001;2:167–179. [PubMed] [Google Scholar]
- 25.Chen XP, Losman JA, Cowan S, Donahue E, Fay S, Vuong BQ, et al. Pim serine/threonine kinases regulate the stability of Socs-1 protein. Proc Natl Acad Sci USA. 2002;99:2175–2180. doi: 10.1073/pnas.042035699. [DOI] [PMC free article] [PubMed] [Google Scholar]
- 26.Kim KT, Levis M, Small D. Constitutively activated FLT3 phosphorylates BAD partially through pim-1. Br J Haematol. 2006;134:500–509. doi: 10.1111/j.1365-2141.2006.06225.x. [DOI] [PubMed] [Google Scholar]
- 27.Leverson JD, Koskinen PJ, Orrico FC, Rainio EM, Jalkanen KJ, Dash AB, et al. Pim-1 kinase and p100 cooperate to enhance c-Myb activity. Mol Cell. 1998;2:417–425. doi: 10.1016/s1097-2765(00)80141-0. [DOI] [PubMed] [Google Scholar]
- 28.Lilly M, Sandholm J, Cooper JJ, Koskinen PJ, Kraft A. The PIM-1 serine kinase prolongs survival and inhibits apoptosis-related mitochondrial dysfunction in part through a bcl-2-dependent pathway. Oncogene. 1999;18:4022–4031. doi: 10.1038/sj.onc.1202741. [DOI] [PubMed] [Google Scholar]
- 29.Peltola KJ, Paukku K, Aho TL, Ruuska M, Silvennoinen O, Koskinen PJ. Pim-1 kinase inhibits STAT5-dependent transcription via its interactions with SOCS1 and SOCS3. Blood. 2004;103:3744–3750. doi: 10.1182/blood-2003-09-3126. [DOI] [PubMed] [Google Scholar]
- 30.Rainio EM, Sandholm J, Koskinen PJ. Cutting edge: transcriptional activity of NFATc1 is enhanced by the Pim-1 kinase. J Immunol. 2002;168:1524–1527. doi: 10.4049/jimmunol.168.4.1524. [DOI] [PubMed] [Google Scholar]
- 31.Amson R, Sigaux F, Przedborski S, Flandrin G, Givol D, Telerman A. The human protooncogene product p33pim is expressed during fetal hematopoiesis and in diverse leukemias. Proc Natl Acad Sci USA. 1989;86:8857–8861. doi: 10.1073/pnas.86.22.8857. [DOI] [PMC free article] [PubMed] [Google Scholar]
- 32.Dhanasekaran SM, Barrette TR, Ghosh D, Shah R, Varambally S, Kurachi K, et al. Delineation of prognostic biomarkers in prostate cancer. Nature. 2001;412:822–826. doi: 10.1038/35090585. [DOI] [PubMed] [Google Scholar]
- 33.Domen J, van der Lugt NM, Laird PW, Saris CJ, Berns A. Analysis of Pim-1 function in mutant mice. Leukemia. 1993;7(Suppl 2):S108–S112. [PubMed] [Google Scholar]
- 34.van Lohuizen M, Verbeek S, Krimpenfort P, Domen J, Saris C, Radaszkiewicz T, et al. Predisposition to lymphomagenesis in pim-1 transgenic mice: cooperation with c-myc and N-myc in murine leukemia virus-induced tumors. Cell. 1989;56:673–682. doi: 10.1016/0092-8674(89)90589-8. [DOI] [PubMed] [Google Scholar]
- 35.Ellwood-Yen K, Graeber TG, Wongvipat J, Iruela-Arispe ML, Zhang J, Matusik R, et al. MYC-driven murine prostate cancer shares molecular features with human prostate tumors. Cancer Cell. 2003;4:223–238. doi: 10.1016/s1535-6108(03)00197-1. [DOI] [PubMed] [Google Scholar]
- 36.Damon LE, Johnson J, Niedzwiecki D, Cheson BD, Hurd DD, Bartlett NL, et al. Immuno-chemotherapy and autologous stem cell transplant for untreated patients with mantle cell lymphoma: CALGB 59909. Blood. 2006;108:774a. doi: 10.1200/JCO.2009.22.2554. [DOI] [PMC free article] [PubMed] [Google Scholar]
- 37.Jung SH, Owzar K, George SL. A multiple testing procedure to associate gene expression levels with survival. Stat Med. 2005;24:3077–3088. doi: 10.1002/sim.2179. [DOI] [PubMed] [Google Scholar]
- 38.Nodit L, Bahler DW, Jacobs SA, Locker J, Swerdlow SH. Indolent mantle cell lymphoma with nodal involvement and mutated immunoglobulin heavy chain genes. Hum Pathol. 2003;34:1030–1034. doi: 10.1053/s0046-8177(03)00410-6. [DOI] [PubMed] [Google Scholar]
- 39.Vandenberghe E, Wolf-Peeters C, Vaughan Hudson G, Vaughan Hudson B, Pittaluga S, Anderson L, et al. The clinical outcome of 65 cases of mantle cell lymphoma initially treated with non-intensive therapy by the British National Lymphoma Investigation Group. Br J Haematol. 1997;99:842–847. doi: 10.1046/j.1365-2141.1997.4693273.x. [DOI] [PubMed] [Google Scholar]
- 40.Lardelli P, Bookman MA, Sundeen J, Longo DL, Jaffe ES. Lymphocytic lymphoma of intermediate differentiation. Morphologic and immunophenotypic spectrum and clinical correlations. Am J Surg Pathol. 1990;14:752–763. doi: 10.1097/00000478-199008000-00007. [DOI] [PubMed] [Google Scholar]
- 41.Hui D, Reiman T, Hanson J, Linford R, Wong W, Belch A, et al. Immunohistochemical detection of cdc2 is useful in predicting survival in patients with mantle cell lymphoma. Mod Pathol. 2005;18:1223–1231. doi: 10.1038/modpathol.3800409. [DOI] [PubMed] [Google Scholar]
- 42.Chiarle R, Budel LM, Skolnik J, Frizzera G, Chilosi M, Corato A, et al. Increased proteasome degradation of cyclin-dependent kinase inhibitor p27 is associated with a decreased overall survival in mantle cell lymphoma. Blood. 2000;95:619–626. [PubMed] [Google Scholar]
- 43.Greiner TC, Moynihan MJ, Chan WC, Lytle DM, Pedersen A, Anderson JR, et al. p53 mutations in mantle cell lymphoma are associated with variant cytology and predict a poor prognosis. Blood. 1996;87:4302–4310. [PubMed] [Google Scholar]
- 44.Hernandez L, Fest T, Cazorla M, Teruya-Feldstein J, Bosch F, Peinado MA, et al. p53 gene mutations and protein overexpression are associated with aggressive variants of mantle cell lymphomas. Blood. 1996;87:3351–3359. [PubMed] [Google Scholar]
- 45.Kienle D, Katzenberger T, Ott G, Saupe D, Benner A, Kohlhammer H, et al. Quantitative gene expression deregulation in mantle-cell lymphoma: correlation with clinical and biologic factors. J Clin Oncol. 2007;25:2770–2777. doi: 10.1200/JCO.2006.08.7999. [DOI] [PubMed] [Google Scholar]
- 46.Salaverria I, Zettl A, Bea S, Moreno V, Valls J, Hartmann E, et al. Specific secondary genetic alterations in mantle cell lymphoma provide prognostic information independent of the gene expression-based proliferation signature. J Clin Oncol. 2007;25:1216–1222. doi: 10.1200/JCO.2006.08.4251. [DOI] [PMC free article] [PubMed] [Google Scholar]
- 47.Hoster E, Dreyling M, Klapper W, Gisselbrecht C, Van Hoof A, Kluin-Nelemans HC, et al. A new prognostic index (MIPI) for patients with advanced stage mantle cell lymphoma. Blood. 2007;111:558–565. doi: 10.1182/blood-2007-06-095331. [DOI] [PubMed] [Google Scholar]
- 48.Raty R, Franssila K, Joensuu H, Teerenhovi L, Elonen E. Ki-67 expression level, histological subtype, and the International Prognostic Index as outcome predictors in mantle cell lymphoma. Eur J Haematol. 2002;69:11–20. doi: 10.1034/j.1600-0609.2002.01677.x. [DOI] [PubMed] [Google Scholar]
- 49.Schrader C, Meusers P, Brittinger G, Teymoortash A, Siebmann JU, Janssen D, et al. Topoisomerase IIalpha expression in mantle cell lymphoma: a marker of cell proliferation and a prognostic factor for clinical outcome. Leukemia. 2004;18:1200–1206. doi: 10.1038/sj.leu.2403387. [DOI] [PubMed] [Google Scholar]
- 50.Determann O, Hoster E, Ott G, Wolfram Bernd H, Loddenkemper C, Leo Hansmann M, et al. Ki-67 predicts outcome in advanced-stage mantle cell lymphoma patients treated with anti-CD20 immunochemotherapy: results from randomized trials of the European MCL Network and the German Low Grade Lymphoma Study Group. Blood. 2008;111:2385–2387. doi: 10.1182/blood-2007-10-117010. [DOI] [PubMed] [Google Scholar]
- 51.Hilbe W, Gachter A, Duba HC, Dirnhofer S, Eisterer W, Schmid T, et al. Comparison of automated cellular imaging system and manual microscopy for immuno-histochemically stained cryostat sections of lung cancer specimens applying p53, ki-67 and p120. Oncol Rep. 2003;10:15–20. [PubMed] [Google Scholar]
- 52.van Sandick JW, Baak JP, van Lanschot JJ, Polkowski W, ten Kate FJ, Obertop H, et al. Computerized quantitative pathology for the grading of dysplasia in surveillance biopsies of Barrett’s oesophagus. J Pathol. 2000;190:177–183. doi: 10.1002/(SICI)1096-9896(200002)190:2<177::AID-PATH508>3.0.CO;2-X. [DOI] [PubMed] [Google Scholar]
- 53.de Jong D, Rosenwald A, Chhanabhai M, Gaulard P, Klapper W, Lee A, et al. Immunohistochemical prognostic markers in diffuse large B-cell lymphoma: validation of tissue microarray as a prerequisite for broad clinical applications – a study from the Lunenburg lymphoma biomarker consortium. J Clin Oncol. 2007;25:805–812. doi: 10.1200/JCO.2006.09.4490. [DOI] [PubMed] [Google Scholar]
- 54.Holder S, Zemskova M, Zhang C, Tabrizizad M, Bremer R, Neidigh JW, et al. Characterization of a potent and selective small-molecule inhibitor of the PIM1 kinase. Mol Cancer Ther. 2007;6:163–172. doi: 10.1158/1535-7163.MCT-06-0397. [DOI] [PubMed] [Google Scholar]
- 55.Wang Z, Bhattacharya N, Mixter PF, Wei W, Sedivy J, Magnuson NS. Phosphorylation of the cell cycle inhibitor p21Cip1/WAF1 by Pim-1 kinase. Biochim Biophys Acta. 2002;1593:45–55. doi: 10.1016/s0167-4889(02)00347-6. [DOI] [PubMed] [Google Scholar]
- 56.Suzuki A, Tsutomi Y, Akahane K, Araki T, Miura M. Resistance to Fas-mediated apoptosis: activation of caspase 3 is regulated by cell cycle regulator p21WAF1 and IAP gene family ILP. Oncogene. 1998;17:931–939. doi: 10.1038/sj.onc.1202021. [DOI] [PubMed] [Google Scholar]
- 57.Aho TL, Sandholm J, Peltola KJ, Mankonen HP, Lilly M, Koskinen PJ. Pim-1 kinase promotes inactivation of the pro-apoptotic Bad protein by phosphorylating it on the Ser112 gatekeeper site. FEBS Lett. 2004;571:43–49. doi: 10.1016/j.febslet.2004.06.050. [DOI] [PubMed] [Google Scholar]
- 58.Shirogane T, Fukada T, Muller JM, Shima DT, Hibi M, Hirano T. Synergistic roles for Pim-1 and c-Myc in STAT3-mediated cell cycle progression and antiapoptosis. Immunity. 1999;11:709–719. doi: 10.1016/s1074-7613(00)80145-4. [DOI] [PubMed] [Google Scholar]
- 59.Shay KP, Wang Z, Xing PX, McKenzie IF, Magnuson NS. Pim-1 kinase stability is regulated by heat shock proteins and the ubiquitin-proteasomepathway. Mol Cancer Res. 2005;3:170–181. doi: 10.1158/1541-7786.MCR-04-0192. [DOI] [PubMed] [Google Scholar]
- 60.Mochizuki T, Kitanaka C, Noguchi K, Muramatsu T, Asai A, Kuchino Y. Physical and functional interactions between Pim-1 kinase and Cdc25A phosphatase. Implications for the Pim-1-mediated activation of the c-Myc signaling pathway. J Biol Chem. 1999;274:18659–18666. doi: 10.1074/jbc.274.26.18659. [DOI] [PubMed] [Google Scholar]
- 61.Fox CJ, Hammerman PS, Thompson CB. The Pim kinases control rapamycin-resistant T cell survival and activation. J Exp Med. 2005;201:259–266. doi: 10.1084/jem.20042020. [DOI] [PMC free article] [PubMed] [Google Scholar]
- 62.Pasqualucci L, Neumeister P, Goossens T, Nanjangud G, Chaganti RS, Kuppers R, et al. Hypermutation of multiple proto-oncogenes in B-cell diffuse large-cell lymphomas. Nature. 2001;412:341–346. doi: 10.1038/35085588. [DOI] [PubMed] [Google Scholar]
- 63.Goy A. Mantle cell lymphoma: evolving novel options. Curr Oncol Rep. 2007;9:391–398. doi: 10.1007/s11912-007-0053-9. [DOI] [PubMed] [Google Scholar]
- 64.Khouri IF, Romaguera J, Kantarjian H, Palmer JL, Pugh WC, Korbling M, et al. Hyper-CVAD and high-dose methotrexate/cytarabine followed by stem-cell transplantation: an active regimen for aggressive mantle-cell lymphoma. J Clin Oncol. 1998;16:3803–3809. doi: 10.1200/JCO.1998.16.12.3803. [DOI] [PubMed] [Google Scholar]