Abstract
By virtue of their accumulated genetic alterations, tumor cells may acquire vulnerabilities that create opportunities for therapeutic intervention. We have devised a massively parallel strategy for screening short hairpin RNA (shRNA) collections for stable loss-of-function phenotypes. We assayed from 6000 to 20,000 shRNAs simultaneously to identify genes important for the proliferation and survival of five cell lines derived from human mammary tissue. Lethal shRNAs common to these cell lines targeted many known cell-cycle regulatory networks. Cell line–specific sensitivities to suppression of protein complexes and biological pathways also emerged, and these could be validated by RNA interference (RNAi) and pharmacologically. These studies establish a practical platform for genome-scale screening of complex phenotypes in mammalian cells and demonstrate that RNAi can be used to expose genotype-specific sensitivities.
The observation of genetic interactions is key to the definition of cellular networks. RNAi has enabled genetic approaches in both cultured mammalian cells (1–5) and intact animals (6–9). Large-scale screens of small interfering RNA (siRNA) (10–12) and shRNA collections (5, 13–16) have generally adopted a one-by-one approach, interrogating phenotypes in a well-based format. This requires both considerable infrastructure and a substantial investment for each cell line to be screened. Alternatively, shRNA collections can be screened by assaying enrichment from pools, but this limits the range of phenotypes that can be addressed. Our focus was identifying essential genes or synthetically lethal genetic interactions through shRNAs that were selectively depleted from populations. This type of screen holds promise for the discovery of novel targets for cancer therapy and genetically validated combination therapies. Previously, one such screen was reported; however, this tested only ~500 shRNAs in a single pool (17). We therefore sought methods that allow multiplex analysis of phenotypic outputs on a genomic scale.
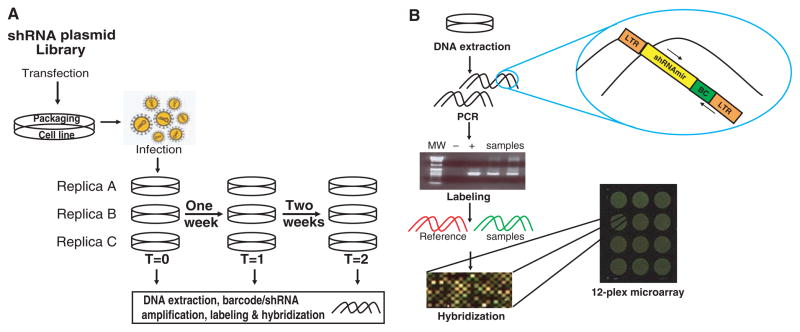
Pooled libraries drew from our previous collections wherein shRNAs are carried in a backbone derived from miR-30 (18). Combining RNA polymerase II promoters with miR-30–based shRNAs permits efficient suppression even with a single-copy integrant (19, 20). Therefore, pooled shRNAs were transferred from pSM2 (18) to pLMP (19), wherein shRNA expression is driven from the murine stem cell virus long-terminal repeat promoter. Three different pools, containing ~6000, ~10,000, and ~20,000 shRNAs, were constructed to test screening at varying scales and levels of population complexity. Target cell populations were infected such that each cell contained, on average, a single integrated virus, and each individual shRNA occupied ~1000 cells. Three parallel infections generated biological replicate samples. Because our goal was to identify essential genes, genomic DNA was prepared from each replicate at three time points during a simple outgrowth assay (Fig. 1A).
Fig. 1.
Experimental approach. (A) shRNA plasmids were packaged into retroviruses in triplicate and introduced into replicate target cell populations at a multiplicity of ~0.3 to achieve ~1 integrant per cell. Over a 2- week culture period, time points were collected on day 2 or day 4 after infection and then once each week for 2 weeks. (B) The shRNA guide strand and the barcode region were amplified from genomic DNA from screening pools. Polymerase chain reaction (PCR) products were gel-purified, labeled, and hybridized to multiplex arrays in competition with a common reference.
Each shRNA cassette contains two unique identifiers: the shRNA itself and a random 60-nucleotide barcode. Barcode sequences were determined for the human shRNA library, and custom, multiplex format microarrays were prepared that contained both barcode and half-hairpin (HH) probes (21) (Fig. 1B). Proviral DNA fragments encompassing both shRNAs and barcodes were amplified from genomic DNA pools and hybridized to arrays in competition with a common reference.
We established a rigorous data analysis pipeline (22) for analyzing pooled shRNA screens. Correlations between biological replicates were high but diminished at later time points, whereas correlations between the reference channels remained unchanged (table S1). Overall, a gene was scored as a candidate if either its barcode or shRNA probe showed greater than 2-fold change with a false discovery rate (FDR) <10%.
We began with a pooled analysis of 6000 (6K) shRNAs in MCF-10A and MDA-MB-435. Although enriched gene sets varied considerably, similar numbers and largely overlapping gene sets showed depletion in both cell lines (tables S2 and S3). Among negatively selected shRNAs were many targeting regulators of the cell division cycle (23, 24) (table S3). These included cyclins, cell division cycle (CDC) proteins, E2F family members, minichromosome maintenance deficient genes, proliferating cell nuclear antigen, and RNA polymerase II–associated genes. Additionally, the proteasome (15 of 25 subunits; P = 5.61 × 10⁻⁵) and anaphase-promoting complex/cyclosome (APC/C) (6 of 11 subunits; P = 0.0139) scored as being essential in both cell lines (table S3).
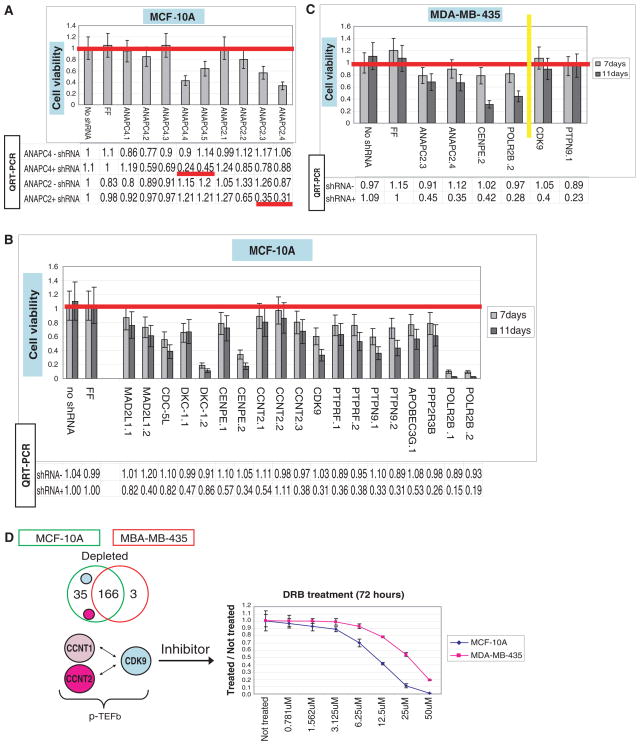
To validate candidates, we constructed a regulated shRNA vector, which linked shRNA and green fluorescent protein expression (fig. S1A). Inducible shRNAs against two APC/C subunits, ANAPC2 and 4, inhibited the growth of MCF-10A in a manner that correlated with mRNA knockdown (fig. S1A and Fig. 2A). Similarly, MDAMB- 435 was sensitive to ANAPC2 depletion (Fig. 2C). Nineteen additional MCF-10A lines were constructed with inducible shRNAs targeting 11 different candidates (Fig. 2B). Of these, 16 lines exhibited shRNA-dependent growth inhibition (30% to 95%), which correlated with mRNA knockdown in 14 cases. The exceptions were CDC-5L and DKC-1, where growth suppression could be due to off-target effects (Fig. 2B).
Fig. 2.
Validation of genes essential to multiple cell lines. Cell viability assays (bars) were performed on cell lines (MCF-10A or MDA-MB- 435) expressing individual candidate shRNAs. Tables below the graphs show the level of target suppression, determined by quantitative real-time fluorescence PCR, with or without shRNA induction (indicated). An shRNA targeting luciferase (FF) and no shRNA serve as negative controls. (A) APC subunits ANAPC2 and ANAPC4 were suppressed by multiple hairpins in MCF-10A (1 to 5 for ANAPC4 and 1 to 4 for ANAPC2). Cell viability assays were carried out for 7 days after shRNA induction. (B) Nineteen additional inducible MCF- 10A cell lines were generated to validate shRNAs that were depleted in the screen. Viability assays were carried out for 11 days. (C) Validation of shRNAs that were depleted (left of the yellow line) or not depleted (right of the yellow line) in MDA-MB-435 cells. Viability assays were carried out for 11 days. (D) The Venn diagram illustrates the 166 depleted genes that were common to both screens and the 35 and 3 genes specifically depleted from MCF-10A and MDA-MB-435, respectively. shRNAs targeting P-TEFb components CDK9 and cyclin T2 were both depleted specifically in MCF-10A. The graph shows a dose-response curve for growth inhibition of MCF-10A and MDA-MB-435 cells by DRB over a 72-hour period.
Among additional candidates were MAD2 and BUBR1, mitotic checkpoint proteins required for regulation of sister chromatid separation (24–26), and Kinesin-7/CENP-E, a component of the kinetochore (27). MAD2/MAD2L1 and Kinesin- 7/CENP-E were validated as being essential in MCF-10A (table S3 and Fig. 2B). CENP-E depletion also inhibited growth in MDA-MB-435 (table S3 and Fig. 2C). Considered together, these studies showed that multiplex RNAi screens successfully identified essential components of cell growth and survival networks.
We also screened higher complexity populations containing 10,000 (10K) or 20,000 (20K) shRNAs. The 10K pool was introduced into MDA-MB-231, T-47D and ZR-75-1. The most complex pool (20K) was introduced into MCF-10A to allow direct comparison with the 6K screen. In all cases, cell numbers were scaled to maintain a representation of 1000 cells per shRNA. The quality of each screen was similar, with high correlations between biological replicates (table S4). We assessed the consistency of the MCF-10A screens by comparing depleted gene sets for the 6K and 20K pools. FDR thresholds were the same for both data sets (q < 0.1), but the fold-change criterion was relaxed from 2-fold to 1.5-fold for the 20K screen so that similar numbers of candidates were compared. A set of 172 genes (P = 1.123 × 10⁻⁹) overlapped in both data sets, despite some differences in the protocols used to carry out each screen, and most of the validated targets from the 6K screen were found in the overlapping list of essential genes (tables S5 and S6). This suggests that a pool of ~20K shRNAs can be effectively screened.
We next sought to uncover cell line–specific genetic sensitivities that might reflect differences in the genetic constitutions of MCF-10A, MDA-MB-231, MDA-MB-435, and ZR-75.1. Initial comparisons focused on the 6K screens done with MCF-10A and MDA-MB-435. Filtering for shRNAs that had a low FDR (q < 0.1) and at least 2-fold depletion in MCF-10A but no more than 1.2-fold depletion in MDA-MB-435 yielded 35 genes (table S7). This compares to 166 genes that were important for growth in both cell lines and 3 genes that were differentially required in MDA-MB-435 (Fig. 2D and table S7). Among the candidates required in MCF-10A were two components of P-TEFb, CDK9 and cyclin T2 (28). We verified this differential sensitivity using both conditional shRNA expression (Fig. 2, B and C) and pharmacological inhibition (Fig. 2D). CDK9 is a DRB-sensitive kinase (28). Although DRB may also target other proteins, MCF-10A showed greater sensitivity to its effects than MDA-MB-435 cells (Fig. 2D).
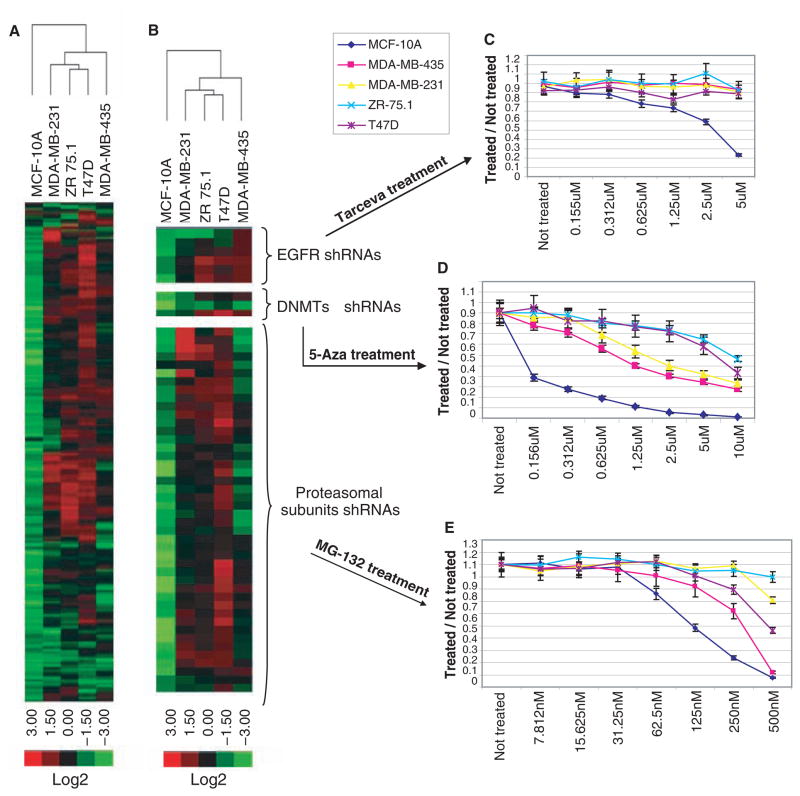
We repeated the 6K screens of MCF-10A and MDA-MB-435 cells on the same array platform as the 10K screens of MDA-MB-231, T-47D, and ZR-75.1 cells and integrated the results (table S8). This was possible because more than 90% of the 6K shRNA set was contained within the 10K pool. Clustering of the resulting sensitivities (i.e., by fold-change, considering only shRNAs with q < 0.1) yielded a dendrogram wherein the more normal MCF-10A segregated from the other, more transformed lines (Fig. 3A). MDA-MB-435 also segregated, perhaps reflecting the observation that it is more related, by expression profiling, to melanoma than breast epithelia. Finally, the remaining lines separated into a group containing T-47D and ZR-75.1, both luminal tumor cell lines, and MDA-MB-231, a basal tumor cell line (29) (Fig. 3A).
Fig. 3.
Cross-comparison of straight lethal screens in five different cell lines. (A) A heat map and dendrogram were generated by clustering based on shRNAs that showed depletion in at least one cell line. (B) shRNAs targeting selected complexes or pathways were chosen from (A) to highlight responses to EGFR, methyltransferase, and proteasome lesions. Pharmacological inhibition of these pathways by treatment with Tarceva (C), 5-aza-deoxycytidine (D), or MG-132 (E) was used to validate the predictions of the shRNA screen.
Viewing this portrait of shRNA sensitivity in more detail revealed a number of pathways and complexes that were differentially required in MCF-10A. These included epidermal growth factor receptor (EGFR), an effect that could be reproduced pharmacologically using the EGFR inhibitor Tarceva (30) (Fig. 3B). DNA methyltransferases also scored either above or close to the threshold (table S8 and Fig. 3B). In accord with these results, MCF-10A cells showed a more than 50-fold greater sensitivity to 5-aza-deoxycytidine, a methyltransferase suicide substrate (31), than the other cell lines. As a final example, numerous proteasome subunits were preferentially depleted from MCF-10A (table S8 and Fig. 3B). These cells showed the greatest sensitivity to a proteasome inhibitor, MG-132 (32). Interestingly, MDA-MB-435 showed an intermediate level of sensitivity to the drug, and this was reflected precisely in their intermediate level of depletion of proteasomal shRNAs during the screen (table S8 and Fig. 3B).
We have validated a highly scalable approach for screening shRNA libraries. Although we used a phenotypic filter reflecting growth and survival, virtually any characteristic that allows separation of phenotypically distinct cells can be applied. We also validated the ability of functional shRNA screening to separate cell lines based on their genetic vulnerabilities in a manner that reflects their already defined characteristics (e.g., immortal versus tumor, basal versus luminal). Although one could attribute selective dependency to culture conditions in some cases, the overwhelming concordance of the shRNAs that affect proliferation and survival across these lines, many of which are cultured identically, strongly argues against this being a pervasive explanation. In all, this approach enables genomewide screens for tumor-specific vulnerabilities to be carried out on large numbers of tumor lines. Moreover, it permits rational searches for lesions that synergize with existing therapeutics to produce a path toward genetically informed combination therapies.
Supplementary Material
Acknowledgments
We thank members of the Hannon and Lowe laboratories for helpful discussion and T. Moore of Open Biosystems for help and support. This work was supported by grants from NIH and the Department of Defense to G.J.H. and J.M.S. and by a kind gift from Kathryn W. Davis. G.J.H. and S.J.E. have a paid consulting relationship with Open Biosystems.
Footnotes
References and Notes
- 1.Paddison PJ, Caudy AA, Hannon GJ. Proc Natl Acad Sci USA. 2002;99:1443. doi: 10.1073/pnas.032652399. [DOI] [PMC free article] [PubMed] [Google Scholar]
- 2.Elbashir SM, et al. Nature. 2001;411:494. doi: 10.1038/35078107. [DOI] [PubMed] [Google Scholar]
- 3.Scherer L, Rossi JJ. Curr Pharm Biotechnol. 2004;5:355. doi: 10.2174/1389201043376724. [DOI] [PubMed] [Google Scholar]
- 4.Friedman A, Perrimon N. Curr Opin Genet Dev. 2004;14:470. doi: 10.1016/j.gde.2004.07.010. [DOI] [PubMed] [Google Scholar]
- 5.Bernards R, Brummelkamp TR, Beijersbergen RL. Nat Methods. 2006;3:701. doi: 10.1038/nmeth921. [DOI] [PubMed] [Google Scholar]
- 6.Hemann MT, et al. Nat Genet. 2003;33:396. doi: 10.1038/ng1091. [DOI] [PubMed] [Google Scholar]
- 7.Snove O, Jr, Rossi JJ. Nat Methods. 2006;3:689. doi: 10.1038/nmeth927. [DOI] [PubMed] [Google Scholar]
- 8.Farah MH. Curr Drug Deliv. 2007;4:161. doi: 10.2174/156720107780362276. [DOI] [PubMed] [Google Scholar]
- 9.de Fougerolles A, Vornlocher HP, Maraganore J, Lieberman J. Nat Rev Drug Discov. 2007;6:443. doi: 10.1038/nrd2310. [DOI] [PMC free article] [PubMed] [Google Scholar]
- 10.Aza-Blanc P, et al. Mol Cell. 2003;12:627. doi: 10.1016/s1097-2765(03)00348-4. [DOI] [PubMed] [Google Scholar]
- 11.Whitehurst AW, et al. Nature. 2007;446:815. doi: 10.1038/nature05697. [DOI] [PubMed] [Google Scholar]
- 12.Natt F. Curr Opin Mol Ther. 2007;9:242. [PubMed] [Google Scholar]
- 13.Paddison PJ, et al. Nature. 2004;428:427. doi: 10.1038/nature02370. [DOI] [PubMed] [Google Scholar]
- 14.Westbrook TF, et al. Cell. 2005;121:837. doi: 10.1016/j.cell.2005.03.033. [DOI] [PubMed] [Google Scholar]
- 15.Root DE, et al. Nat Methods. 2006;3:715. doi: 10.1038/nmeth924. [DOI] [PubMed] [Google Scholar]
- 16.Gazin C, et al. Nature. 2007;449:1073. doi: 10.1038/nature06251. [DOI] [PMC free article] [PubMed] [Google Scholar]
- 17.Ngo VN, et al. Nature. 2006;441:106. doi: 10.1038/nature04687. [DOI] [PubMed] [Google Scholar]
- 18.Silva JM, et al. Nat Genet. 2005;37:1281. doi: 10.1038/ng1650. [DOI] [PubMed] [Google Scholar]
- 19.Dickins RA, et al. Nat Genet. 2005;37:1289. doi: 10.1038/ng1651. [DOI] [PubMed] [Google Scholar]
- 20.Stegmeier F, Hu G, Rickles RJ, Hannon GJ, Elledge SJ. Proc Natl Acad Sci USA. 2005;102:13212. doi: 10.1073/pnas.0506306102. [DOI] [PMC free article] [PubMed] [Google Scholar]
- 21.Schlabach MR, et al. Science. 2008;319:620. doi: 10.1126/science.1149200. [DOI] [PMC free article] [PubMed] [Google Scholar]
- 22.Materials and methods are available as supporting material on Science Online.
- 23.Nakayama KI, Nakayama K. Nat Rev Cancer. 2006;6:369. doi: 10.1038/nrc1881. [DOI] [PubMed] [Google Scholar]
- 24.Peters JM. Nat Rev Mol Cell Biol. 2006;7:644. doi: 10.1038/nrm1988. [DOI] [PubMed] [Google Scholar]
- 25.Fang G. Mol Biol Cell. 2002;13:755. doi: 10.1091/mbc.01-09-0437. [DOI] [PMC free article] [PubMed] [Google Scholar]
- 26.Kops GJ, Foltz DR, Cleveland DW. Proc Natl Acad Sci USA. 2004;101:8699. doi: 10.1073/pnas.0401142101. [DOI] [PMC free article] [PubMed] [Google Scholar]
- 27.Yen TJ, et al. Nature. 1992;359:536. doi: 10.1038/359536a0. [DOI] [PubMed] [Google Scholar]
- 28.Peng J, Zhu Y, Milton JT, Price DH. Genes Dev. 1998;12:755. doi: 10.1101/gad.12.5.755. [DOI] [PMC free article] [PubMed] [Google Scholar]
- 29.Neve RM, et al. Cancer Cell. 2006;10:515. doi: 10.1016/j.ccr.2006.10.008. [DOI] [PMC free article] [PubMed] [Google Scholar]
- 30.Moyer JD, et al. Cancer Res. 1997;57:4838. [PubMed] [Google Scholar]
- 31.Jackson-Grusby L, et al. Proc Natl Acad Sci USA. 1997;94:4681. doi: 10.1073/pnas.94.9.4681. [DOI] [PMC free article] [PubMed] [Google Scholar]
- 32.Palombella VJ, et al. Cell. 1994;78:773. doi: 10.1016/s0092-8674(94)90482-0. [DOI] [PubMed] [Google Scholar]
Associated Data
This section collects any data citations, data availability statements, or supplementary materials included in this article.


