Abstract
Biological complexes typically exhibit intermolecular interfaces of high shape complementarity. Many computational docking approaches use this surface complementarity as a guide in the search for predicting the structures of protein-protein complexes. Proteins often undergo conformational changes in order to create a highly complementary interface when associating. These conformational changes are a major cause of failure for automated docking procedures when predicting binding modes between proteins using their unbound conformations. Low resolution surfaces in which high frequency geometric details are omitted have been used to address this problem. These smoothed, or blurred, surfaces are expected to minimize the differences between free and bound structures, especially those that are due to side chain conformations or small backbone deviations.
In spite of the fact that this approach has been used in many docking protocols, there has yet to be a systematic study of the effects of such surface smoothing on the shape complementarity of the resulting interfaces. Here we investigate this question by computing shape complementarity of a set of 66 protein-protein complexes represented by multi-resolution blurred surfaces. Complexed and unbound structures are available for these protein-protein complexes. They are a subset of complexes from a non-redundant docking benchmark selected for rigidity (i.e. the proteins undergo limited conformational changes between their bound and unbound states). In this work we construct the surfaces by isocontouring a density map obtained by accumulating the densities of Gaussian functions placed at all atom centers of the molecule. The smoothness or resolution is specified by a Gaussian fall-off coefficient, termed “blobbyness”. Shape complementarity is quantified using a histogram of the shortest distances between two proteins' surface mesh vertices for both the crystallographic complexes and the complexes built using the protein structures in their unbound conformation.
The histograms calculated for the bound complex structures demonstrate that medium resolution smoothing (blobbyness=−0.9) can reproduce about 88% of the shape complementarity of atomic resolution surfaces. Complexes formed from the free component structures show a partial loss of shape complementarity (more overlaps and gaps) with the atomic resolution surfaces. For surfaces smoothed to low resolution (blobbyness=−0.3), we find more consistency of shape complementarity between the complexed and free cases. To further reduce bad contacts without significantly impacting the good contacts we introduce another blurred surface, in which the Gaussian densities of flexible atoms are reduced. From these results we discuss the use of shape complementarity in protein-protein docking.
Keywords: Protein interactions, protein-protein docking, Gaussian surface, protein side-chain flexibility, protein interfaces, unbound-unbound docking, protein complexes, Blur surface, FlexBlur surface, enzyme-inhibitor complexes
Introduction
Shape complementarity is an important feature of the interfaces of biological assemblies, such as protein-protein complexes. Although it does not represent a physical interaction, it is highly correlated with certain interaction energies, such as van der Waals and non-polar desolvation. Thus, it has been widely used in protein-protein docking for searching and evaluating possible binding modes between two proteins1-14. This usually happens in early stages of a protein-protein docking, where the goal is to discard obviously wrong solutions and reduce the number of potential binding modes. During these stages, proteins are often treated as rigid bodies for faster evaluations. Many protein-protein docking studies represent proteins as high resolution rigid bodies (e.g. atoms or molecular surfaces)1-11 and a few as low resolution rigid bodies (smoothed or blurred surfaces)12-14. While the shape complementarity is usually very tight with high-resolution representations of molecular complexes, it is also highly sensitive to conformational changes such as the ones observed between the bound and free states of proteins. This sensitivity is problematic when trying to dock two proteins using their free, unbound structures. Smoothed surfaces have been used to alleviate this problem as they are thought to be able to accommodate some local re-arrangements such as side chains assuming different conformations or small backbone motions. Using volumetric grid-based docking, the Vakser group also has found low-resolution recognition in a large percentage of complexes, especially those with larger interface areas15-17. However, despite the fact that smoothed surfaces have been used in protein-protein docking12-17 and a recent study investigated the effect of surface smoothing on docking results based on their docking protocol18, there has been no systematic study of the fundamental question: what is the impact of surface smoothing on the computed shape complementarity of protein-protein interfaces.
This work aims to investigate this impact by studying the shape complementarity of 66 protein-protein complexes containing both bound and free-state components with the protein surfaces computed at a wide range of resolutions. The shape complementarity of a protein-protein complex is quantified by a histogram of the shortest distances between the mesh vertices of the two protein surfaces. The protein-protein complexes selected from the Protein-Protein Docking Benchmark 2.019 are the ones that are relatively rigid, and they compose the majority of the benchmark. The (solvent-excluded) molecular surface20 is used to evaluate the shape complementarity at the highest resolution and provides a baseline for this property. The spherical harmonic surface21-25 and the Gaussian surface26-29 are the most commonly used smoothed surface models. While the spherical harmonic surface provides an analytical multi-resolution model of smoothed surfaces, these surfaces also present some serious limitations including the limitation to Genus 0 surfaces (i.e. no tunnels), and the lack of local control of resolution. For these reasons we use a Gaussian blur approach30,31 yielding a surface which we call “Blur surface” in this work. The Blur surface of a molecule is computed as an isocontour of the density map obtained by accumulating the densities of Gaussian functions placed on all atom centers of the molecule. This density map is then isocontoured at a level such that the Blur surface has the same volume as the molecule's solvent-excluded molecular surface20. The resolution of the Blur surface is controlled by a Gaussian fall-off coefficient, termed “blobbyness”.
We first study how the shape complementarity of the bound complexes changes as a function of the surface resolution to reveal the impact of surface smoothing on the shape complementarity of the tight interfaces. Then, the shape complementarity study is performed on the complexes built with free-state protein structures by superimposing their interface residues onto their counterparts in the bound complexes. Finally, in an attempt to reduce overlaps at the interfaces of the unbound-unbound complexes, we develop another blurred surface, named “FlexBlur surface”, in which the Gaussian densities of flexible atoms are down-weighted.
Below we describe the data set used in this study, how the blurred surfaces are computed, and present the comparison of the shape complementarity between the bound and unbound complexes. We analyze this comparison to reveal: (1) how much shape complementarity is lost when proteins undergo conformational change from the bound to free state; (2) whether shape complementarity is more consistent during the conformational changes with the proteins represented by Blur surfaces than by high-resolution molecular surfaces; and (3) whether FlexBlur surfaces can improve the shape complementarity of complexes with free components over those of Blur surfaces. We conclude by discussing how this analysis of shape complementarity may be used to reduce false negatives in protein-protein docking.
Methods
1. Protein-Protein Complexes
The protein-protein complexes are selected from the Protein-Protein Docking Benchmark 2.019, which contains 84 complexes, 72 of which have unbound conformations for both ligand and receptor proteins. From those 72 complexes, we chose 66 complexes which have an I_RMS less than 2.5 Å (I_RMS is the RMSD of Ca atoms of interface residues between its bound and unbound states; the interface residues are those having at least one atom within 10 Å of an atom on the other molecule; the backbone atoms of these residues are then superimposed on their corresponding atoms in the bound-bound complexes; see Ref. 32, in which I_RMS is defined to be computed on backbone atoms not just Ca of interface residues). Choosing complexes with small I_RMS enables the use of rigid surface models. With this I_RMS limitation, our selections still covers most of the complexes in the this benchmark set. and the results from this work can have a wide range of potential applications. We separated the 66 complexes into two groups: (1) a Rigid Group with I_RMS < 1.0 Å (37 systems) and (2) a Slightly Flexible Group with 1.0 Å <= I_RMS < 2.5 Å (29 systems). Choosing 1.0 Å as the cutoff is arbitrary, but the purpose is to further identify the valid range of rigid surface models in terms of backbone flexibility. The selected systems are shown in Table I.
Table I. Protein-Protein Complexes Used in This Work.
| Rigid Group I_RMSa < 1.0 Å (37 complexes) |
Slightly Flexible Group 1.0 Å <= I_RMS < 2.5 Å (29 complexes) |
||||
|---|---|---|---|---|---|
| Complexb | Categoryc | I_RMS | Complex | Category | I_RMS |
| 1WEJ | A | 0.31 | 1VFB | A | 1.02 |
| 1GHQ | O | 0.34 | 1DFJ | E | 1.02 |
| 2SNI | E | 0.35 | 1ML0 | O | 1.02 |
| 2SIC | E | 0.36 | 1E6J | A | 1.05 |
| 1SBB | O | 0.37 | 1A2K | O | 1.11 |
| 2PCC | E | 0.39 | 1KXP | O | 1.12 |
| 1KTZ | O | 0.39 | 1D6R | E | 1.14 |
| 2MTA | E | 0.41 | 1AKJ | O | 1.14 |
| 1KLU | O | 0.43 | 1WQ1 | O | 1.16 |
| 1PPE | E | 0.44 | 1K5D | O | 1.19 |
| 1AVX | E | 0.47 | 1EZU | E | 1.21 |
| 1JPS | A | 0.51 | 1GRN | O | 1.22 |
| 1AY7 | E | 0.54 | 1BVK | E | 1.24 |
| 1EAW | E | 0.54 | 1E6E | E | 1.33 |
| 1MLC | A | 0.6 | 1AK4 | O | 1.33 |
| 1MAH | E | 0.61 | 1HIA | E | 1.4 |
| 1RLB | O | 0.66 | 1I4D | O | 1.41 |
| 1IJK | O | 0.68 | 1BGX | A | 1.48 |
| 1AHW | A | 0.69 | 1GP2 | O | 1.65 |
| 7CEI | E | 0.7 | 1FC2 | O | 1.69 |
| 1E96 | O | 0.71 | 1B6C | O | 1.96 |
| 1QA9 | O | 0.73 | 1CGI | E | 2.02 |
| 1F51 | O | 0.74 | 1IB1 | O | 2.09 |
| 1DQJ | A | 0.75 | 1M10 | O | 2.1 |
| 1BUH | O | 0.75 | 1I2M | O | 2.12 |
| 2BTF | O | 0.75 | 1N2C | O | 2.13 |
| 2VIS | A | 0.8 | 1KKL | E | 2.2 |
| 1EWY | E | 0.8 | 1ACB | E | 2.26 |
| 1TMQ | E | 0.86 | 1EER | O | 2.44 |
| 1BVN | E | 0.87 | |||
| 1UDI | E | 0.9 | |||
| 1FQJ | O | 0.91 | |||
| 1GCQ | O | 0.92 | |||
| 1HE8 | O | 0.92 | |||
| 1F34 | E | 0.93 | |||
| 1HE1 | O | 0.93 | |||
| 1KAC | O | 0.95 | |||
RMSD of Ca atoms of interface residues between bound and unbound complexes29.
PDB ID of the bound protein-protein complex, of which unbound partners exist.
Complex category: A, antibody-antigen; E, enzyme-inhibitor or enzyme-substrate; O, others.
2. Molecular Surface
The molecular surface, also called the solvent-excluded surface, is computed for each protein using the MSMS program20 with a probe radius of 1.4 Å. As hydrogens are not present in the PDB files of the benchmark molecules, the united atom radii in Connolly's molecular surface program33 are assigned to protein heavy atoms for computing molecular surfaces.
3. Blur Surface
To build a Blur surface for a molecule, each atom of the molecule is represented by a Gaussian density function. At each point in a grid that encloses the molecule, the density contributions from all atoms are summed. The grid is then isocontoured to yield a Blur surface.
● Blurring
Blurring is performed using the UTblur program developed by Bajaj's group at The University of Texas at Austin30,31. For a molecule, an atom's contribution to a grid point is represented by a Gaussian density function:
| (1) |
where rij is the distance between the atom i and a grid point j; Ri is the radius of the atom i (from the same radii set used in the molecular surface calculation); b is the rate of decay parameter (a negative value). The larger the b value (closer to but less than 0), the wider the Gaussian distribution, thus the more blobby the Gaussian surface. We thus call b blobbyness.
This Gaussian function has a different formula from others. Duncan & Olson28 uses
| (2) |
where σ is a scale parameter and atom radii are not included. Gabdoulline & Wade13 uses a special formula:
| (3) |
where distance rij is not squared, and d is an adjustable parameter. Yu and coworkers34 uses
| (4) |
where a is a parameter defining the smoothness of the surface. But most works29,35-38 have used
| (5) |
where κ is a Gaussian distribution parameter. Aside from the special formulas in Equation 2 and Equation 3, the other three formulae actually differ only in their magnitudes at a given blobbyness: Blobbyness b in Equation 1 is actually −a in Equation 4 and −κ in Equation 5; Equation 1 is equal to Equation 4 times exp(−b), and Equation 5 is equal to Equation 4 times 4/3*sqrt(−b3/π). This means that, at any blobbyness, these three formulas will give the same Blur surfaces if they are isocontoured proportional to their magnitude differences. Thus, the Blur surface properties, such as surface curvatures, derived using the formula in this work (Equation 1) is not restricted to this formula in future applications.
The Gaussian densities from all atoms in the molecule are then summed at each point in a 3D grid that encloses the molecule. The maximal number of vertices on a Blur surface is a function of the grid resolution. A grid resolution of 0.5 Å will give a surface vertex density of about 6.0/Å2, and 0.2 Å will give a little over 40.0/Å2.
● Isocontouring
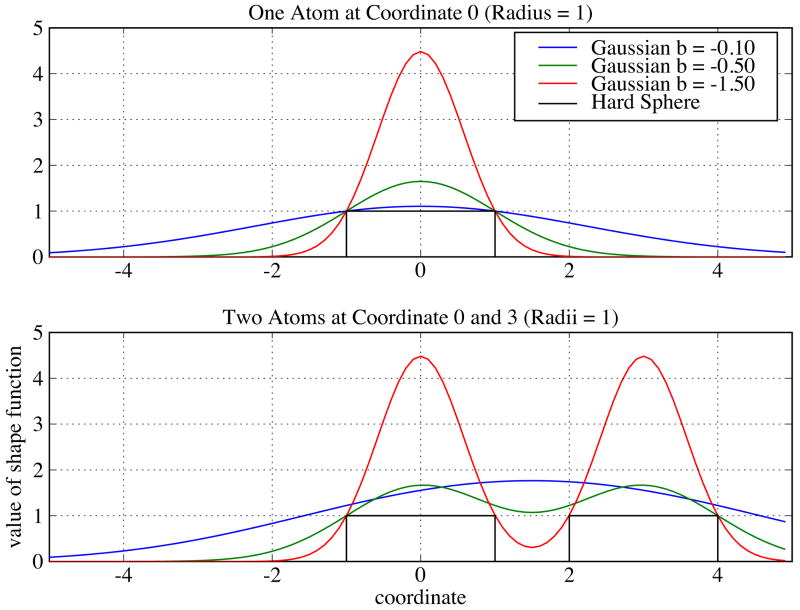
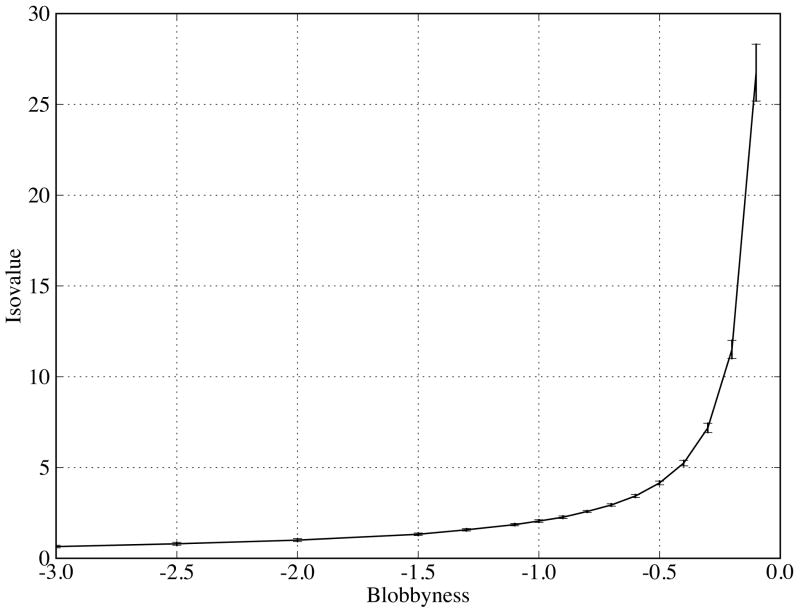
Grid isocontouring determines the size of a Blur surface and thus the isocontour value is not arbitrary at a given blobbyness. At low blobbyness, which generates Blur surfaces close to molecular surfaces, the isocontour value is the value of any single atom's Gaussian function at r = R (Ref. 38 uses b = −2.3442; Ref. 34 uses b = −2.5). However, at high blobbyness, the Gaussian distributions are wider and flatter (Figure 1(top)), resulting from density contributions of neighboring atoms (Figure 1(bottom)). Thus, the isocontour value of Gaussian density, which will be larger than the value of any single atom's Gaussian function at r = R (Figure 1), cannot be derived from the blobbyness directly (through the Gaussian function). We therefore developed a numerical method to optimize the isocontour value for any given blobbyness so that the generated Blur surface encloses the same volume as the molecular surface (to preserve the molecule size). This method can be applied to any blobbyness with a volume reproduction error of less than 1%. The volume is computed based on surface triangles and their normals39. There are several conditions to make the volume reproduction accurate: (1) the surface vertex density has to be at least 20.0/Å2 for the molecular surface computed by MSMS because its volume converges after this density (see Appendix S1 in the Supplementary Material); (2) analytical normals have to be used for stable volume calculation of the Blur surface; (3) the surface vertex density for the Blur surface has to be at least 5.0/Å2 because its volume converges after this density (see Appendix S1 in the Supplementary Material; this also requires the grid resolution to be at least 0.5 Å or better); and (4) fully internal surfaces resulting from isocontouring are removed immediately after isocontouring. Grid isocontouring is done using the UTisocontour program40,41. The relationship between the isocontour value and the blobbyness for the protein-protein complexes used in this work is plotted in Figure 2. The derived isocontour value increases as the blobbyness because of increased overlaps of Gaussian functions. This increase accelerates as the blobbyness approaches −0.1, indicating a larger change of surface resolution at high blobbyness. Larger standard deviations at higher blobbyness are expected because the isocontour values are larger.
Figure 1.
Comparison of shape functions: Gaussian density functions with blobbyness = −0.10, −0.50, −1.50, and hard sphere density function. The values of the shape functions are plotted on a one-dimension coordinate between −5.0 and 5.0 Å for simplicity. Top: Shape functions of a single atom that has a radius of 1.0 Å and is located at coordinate 0.0. Bottom: Shape functions of two close atoms that have the same radius of 1.0 Å and are located at coordinate 0.0 and 3.0, respectively.
Figure 2.
Isocontouring value (mean and standard deviation) as a function of blobbyness based on all the molecules in the protein-protein complexes used in this work. An isocontouring value is optimized to reproduce the molecular surface volume of a protein.
We also tried approaches matching surface area and interface volume for isocontour value optimization, but neither proved satisfactory. The surface area method generates Blur surfaces enclosing larger volumes than the corresponding molecular surfaces because the high-frequency molecular surface has larger surface area than its corresponding low-frequency (smoothed) Blur surface; this isocontouring method results in severe overlaps between bound-bound proteins of crystal-structure conformations. The interface volume method reproduces interfaces well, but it depends on the availability of bound-bound crystal structures.
As low blobbyness generates high-resolution surfaces and high blobbyness generates smoothed coarse-grained surfaces, the Blur surfaces can be used to study molecular shape complementarity at multiple resolutions.
● Decimation
Decimating the surface vertices to a desired vertex density is achieved by using the QSlimLib, a python extension package based on the SlimKit software42.
● Computing analytical curvatures
Analytical curvatures including normal are computed using UTmolderivatives30.
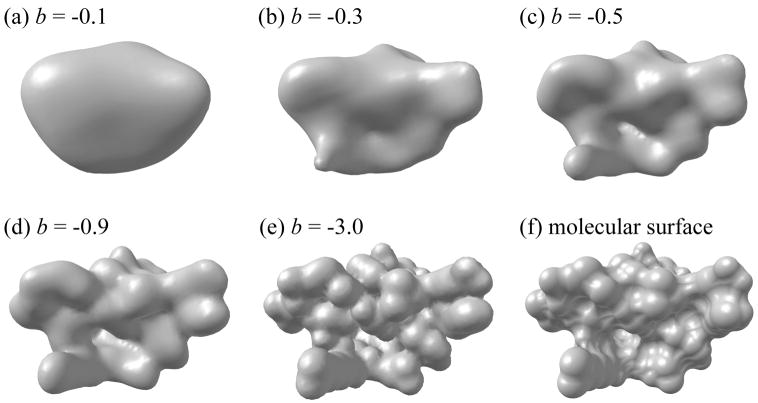
To give an impression of resolutions of Blur surface, Figure 3 illustrates a molecule's Blur surface at different blobbyness along with the molecular surface.
Figure 3.
A protein molecule represented as Blur surfaces at blobbyness −0.1 (a), −0.3 (b), −0.5 (c), −0.9 (d), and −3.0 (e) as well as a molecular surface (f).
4. FlexBlur Surface
To account for side-chain flexibility in the Blur surface, we developed the FlexBlur surface. It differs from the Blur surface in that the Gaussian functions of flexible atoms are down-weighted during blurring. The atom flexibility is derived from the program CONCOORD43 (version 2.0). For a given structure, this program computes the distance limits for all atom pairs in the molecule, regardless of whether they are bonded or not. A distance limit is two atoms' distance plus or minus Dik, which is small for strong interaction and large for weak interaction43. We define a new parameter – constraint Cik – that is equal to 1.0/Dik. For each atom i, we sum up all of its constraints except the intra-residue ones (1-2, 1-3, and rings) as Ci; the reason to consider only inter-residue constraints is that these constraints define side-chain flexibility. The summed constraints Ci on the Cβ atoms of exterior residues are around 40.0, thus we define a weight cutoff Wcut as 40.0. For any atom i with a summed constraint Ci less than Wcut, its weight Wi is computed as Ci/Wcut, otherwise as 1.0. Then its Gaussian function contribution to a grid point j will be
| (6) |
Down-weighting flexible atoms means that the surface associated with these atoms will shrink compared to the corresponding non-weighted Blur surface. In order to conserve the surface parts that are associated with rigid atoms, we use the same isocontour value as in its regular Blur surface for the FlexBlur surface, instead of reducing the isocontouring value to conserve its volume. The FlexBlur surface construction procedure is illustrated in Figure 4.
Figure 4.
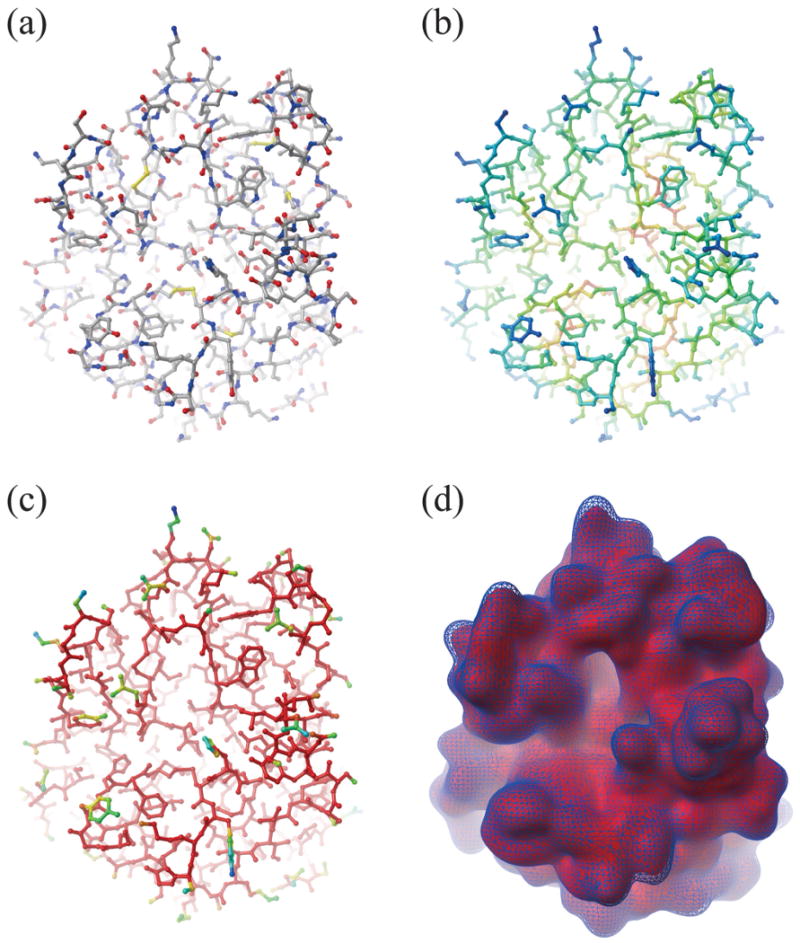
Illustration of FlexBlur surface building. A molecule's crystal structure is shown in ball-and-stick render and colored by (a) atom types, (b) constraints with red for strong constraints and blue for weak constraints, and (c) weights with red for weight 1.0 and blue for weight<1.0. (d) Comparison between a FlexBlur surface in red and a Blur surface as blue mesh (both at blobbyness −0.9).
5. Histograms of Interface Distances
We measure shape complementarity by computing a histogram of interface distances (< 3 Å) between ligand and receptor surfaces. We chose 3 Å as the distance cutoff since a water molecule can fit into an interface gap larger than 3 Å, and we do not consider such a gap as part of the interface. An interface distance is computed as the distance between two closest surface vertices of the ligand and receptor; for each ligand surface vertex we find its closest receptor surface vertex, and vice visa. An interface distance is negative if ligand and receptor surface vertices are interior to each other's surface, and this interface pair is counted as an overlap. To increase the odds of that the closest vertex found is the closest point on the other surface (the vector connecting the two vertices should be perpendicular to the partner surface), we compute a high surface vertex density, 20/Å2, for both ligand and receptor.
As blurring reduces the surface area of a molecule and thus the number of surface vertices at a given density, the interface distance histograms based on Blur surfaces and FlexBlur surfaces have to be normalized in order to be compared with those based on molecular surfaces. For Blur surface-based histograms, the normalization factor at a given blobbyness is the ratio of the total number of vertices on a group of Blur surfaces at this blobbyness to the total number of vertices on the same group of molecular surfaces. A FlexBlur surface-based histogram at a given blobbyness uses the same normalization factor as the Blur surface-based histogram at the same blobbyness, because down-weighting of flexible atoms in FlexBlur surfaces is expected to lead to smaller surface areas.
Results
1. Shape complementarity of bound-bound complexes
The histograms of the bound-bound complexes represented with the molecular MSMS surfaces are presented in Appendix S2 of Supplementary Material (Part I for Rigid Group and Part II for Slightly Flexible Group). For the Rigid Group, its 37 bound-bound complexes are placed into four categories (Rich, Poor 1, Poor 2, and Poor 3) according to the histogram bar heights and histogram shape. There are 22 complexes in the Rich category (average histogram bar height in any of the interface distance intervals [0, 1], [1, 2], [2, 3] is larger than 0.6E+4), and most of them have a convex histogram shape with its peak in the interface distance interval [0, 1]. All the Poor categories contain complexes that do not satisfy the above histogram bar height requirement. There are 10 complexes in the Poor 1 category (convex distribution), 4 in Poor 2 (near-flat distribution in the positive interface distance interval [0, 3]), and 1 in Poor 3 (V-shape distribution in the positive interface distance interval). We also see that 12 of the 22 Rich category complexes are enzyme-inhibitor complexes, indicating they have better shape complementarity than other types of complexes. For the 3 Poor categories, 9 of 15 complexes are “Other complexes” (neither enzyme-inhibitor nor antibody-antigen).
For the Slightly Flexible Group, the story is somewhat different. Its 29 bound-bound complexes have only two categories: Rich (23 complexes) and Poor 1 (6 complexes), and about two thirds of the Rich category complexes are “Other complexes”. It means that not only enzyme-inhibitor complexes but other types of complexes can have good shape complementarity. The fewer number of enzyme-inhibitor complexes in the Slightly Flexible Group compared to the Rigid Group also indicates that enzyme-inhibitor complexes have relatively small conformational change upon binding.
Combination of both groups shows that 19 of the 23 enzyme-inhibitors, 22 of the 33 “Other complexes”, and only 4 of the 10 antibody-antigen complexes are in the Rich category, demonstrating that enzyme-inhibitor complexes have the best shape complementarity followed by Other systems while antibody-antigen complexes have the poorest shape complementarity.
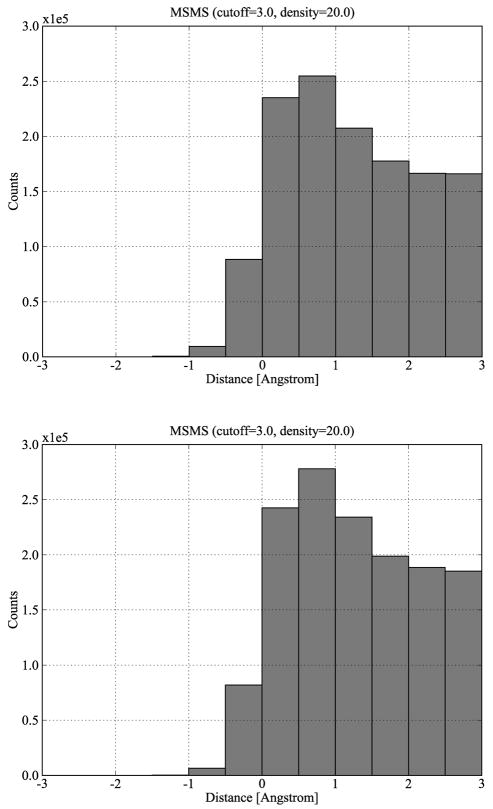
To derive systematic properties of shape complementarity, we plot for each group a histogram with the interface distances from all its complexes, as shown in Figure 5. The two histograms have the nearly identical shape, indicating that a systematic property of shape complementarity exists for the bound-bound complexes. We also notice that the Slightly Flexible Group has a larger distribution than the Rigid Group in the positive interface distance interval [0, 3] although the former has 8 fewer complexes than the latter, demonstrating that the Slightly Flexible Group complexes have larger interface areas than those of the Rigid Group. This may indicate that protein-protein complexes undergo larger conformational changes to achieve larger interfaces. Since the Slightly Flexible Group has histograms quite similar to those of the Rigid Group, for brevity the following discussion focuses on bound-bound complexes from the Rigid Group. Appendix S3 shows very similar results for the Slightly Flexible Group.
Figure 5.
Histograms of interface distances based on the molecular surfaces of all bound-bound complexes of Rigid Group (top) and Slightly Flexible Group (bottom).
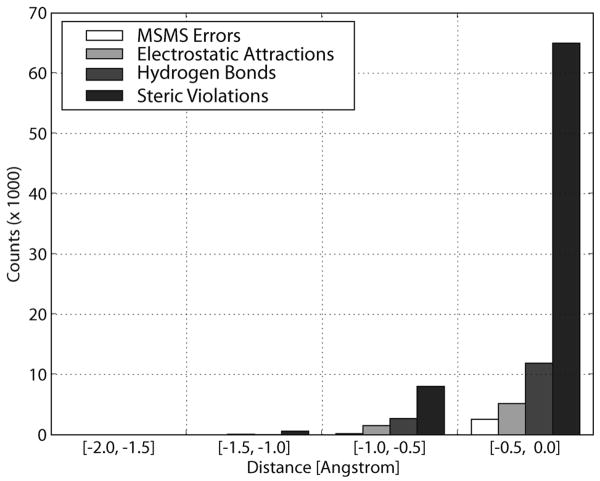
The above histograms show overlaps at the interfaces of bound-bound complexes. We have analyzed those overlaps as shown in Figure 6. For each overlap, we trace its two corresponding atoms. If the two atom centers have a distance larger than the sum of their radii, we regard this overlap as a molecular surface calculation error by the MSMS program. If not, we first ask if they form an electrostatic interaction, and then ask if they form a hydrogen bond. If the overlap is not any of the above, there must be a steric violation in the crystal structure. Figure 6 indicates that MSMS error contributes the smallest portion (∼3%) of the overlaps, and the rest of overlaps are real atom overlaps, in which ∼7% are from electrostatic interactions, ∼15% from hydrogen bonds, and ∼77% from steric violations. One should note though that most overlaps are not severe (> −0.5 Å).
Figure 6.
Sources of interface overlaps based on the molecular surfaces of all bound-bound complexes of Rigid Group.
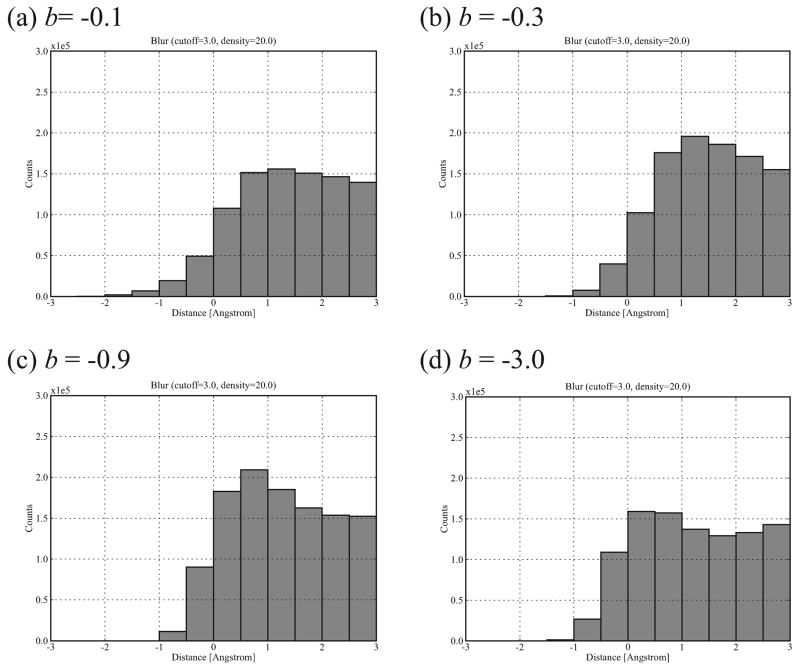
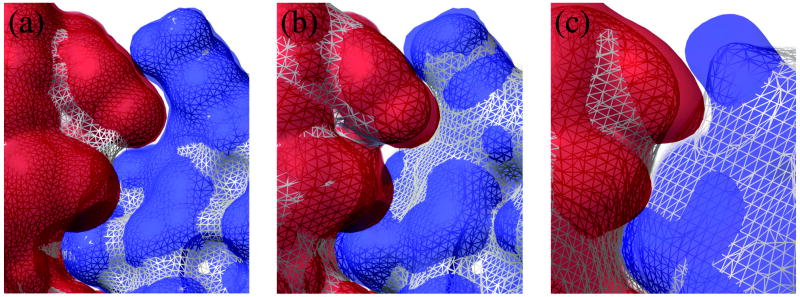
To derive the bound-bound complexes' shape complementarity at multiple resolutions, we generated the histograms of interface distances based on the Blur surfaces at different blobbyness. Figure 7 illustrates the histograms at blobbyness b = −0.1, −0.3, −0.9, and −3.0 (from very coarse to very detailed; see Figure 3) of the Rigid Group's complexes. Comparison with the histogram based on the molecular surface (Figure 5(top)), these histograms are flattened (especially at the high and low blobbyness) and the histogram peak moves from interface distance interval [0, 1] Å to [1, 2] Å at high blobbyness (indicating looser interfaces). To find the reasons for this flattening, we compare a molecular surface with Blur surfaces at different blobbyness in Figure 8. At a low blobbyness −3.0 (high resolution), the Blur surface is more like a CPK model compared to the molecular surface (Figure 8(a)). The molecular surface fills in the narrow grooves and interstices of a CPK model with a 1.4-Å-radius probe, thus increasing the interface pairs between ligand and receptor. As blobbyness increases (surface resolution decreases), the Gaussian functions of the molecule's atoms extend and start to overlap each other (Figure 1), thus filling in these spaces as well (Figure 8(b)), leading to improved interface shape complementarity. Although convex parts of a Blur surface start to shrink at medium blobbyness, this shrinkage is small and partially compensated by the filling of the interfacing concave parts on the other Blur surface (Figure 8(b)). As blobbyness further increases, we observe that the outside edge of the interface quickly looses shape complementarity (Figure 8(c)). This is expected since as the surfaces becomes smoother they becomes more convex, taking on the shape of an irregular elipsoid (as in Figure 3(a)) and eliminating much of the concavity at the interface.
Figure 7.
Histograms of interface distances based on the Blur surfaces of Rigid Group bound-bound complexes at blobbyness −0.1 (a), −0.3 (b), −0.9 (c), and −3.0 (d).
Figure 8.
Partial interface between an enzyme (red) and its inhibitor (blue) represented using different surfaces. (a) Molecular surfaces (white mesh) vs. Blur surface at blobbyness −3.0 (red and blue transparent surfaces). (b) Blur surfaces at blobbyness −3.0 (red and blue transparent surfaces) vs. −0.9 (white mesh). (c) Blur surfaces at −0.9 (red and blue transparent surfaces) vs. −0.3 (white mesh).
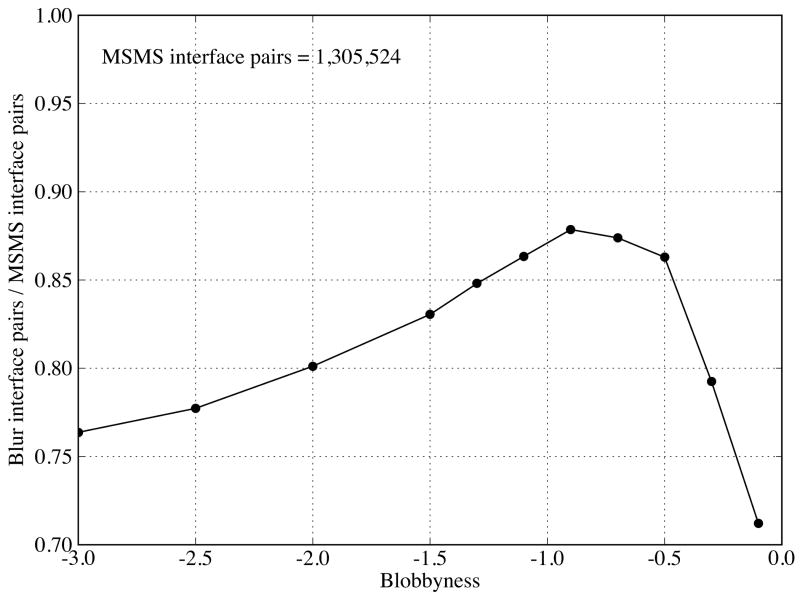
To quantify the flattening, we plot the ratio of the histogram integral (total interface vertex pairs) between the Blur surfaces and molecular surface as a function of blobbyness in Figure 9 (note that the histograms of the Blur surfaces have been normalized, see METHODS). As blobbyness b increases from −3.0 to −0.1 (detailed to smooth), the ratio increases from 0.77, reach a maximum 0.88 at b = −0.9, and then drops quickly to 0.72. However, all ratios are beyond 70%, making the Blur surface reasonable for multiple-resolution surface representation and docking. The fastest change of ratio is between blobbyness −0.5 and −0.1, indicating that blobbyness changes in this range have the largest effect on the surface resolution.
Figure 9.
Ratio of total interface vertex pairs between the Blur surface and the molecular surface as a function of blobbyness. The interface pairs are from all the bound-bound complexes in Rigid Group.
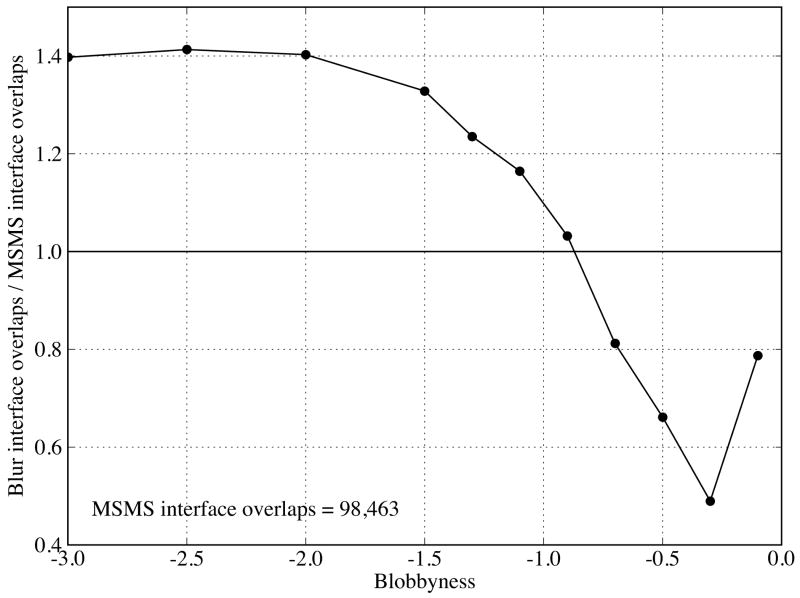
From Figure 7, we also notice that the number of overlaps (distance < 0) varies with the blobbyness. We thus quantify this change by plotting the ratio of interface overlaps between the Blur surface and molecular surface as a function of blobbyness in Figure 10. This ratio decreases as blobbyness increases from −3.0 to −0.3 and increases after −0.3. The latter indicates that highly smoothed surfaces not only reduce shape complementarity but also increase the overlaps. The ratio is about 1.0 at blobbyness −0.9, which is consistent with the above observation that blobbyness −0.9 reproduces the molecular surface interface the best.
Figure 10.
Ratio of total interface overlaps between the Blur surface and the molecular surface as a function of blobbyness. The interface overlaps are from all the bound-bound complexes in Rigid Group.
2. Shape complementarity of unbound-unbound complexes
Shape complementarity of bound-bound complexes is strong and can be applied to protein-protein rigid re-docking, but the actual challenge in protein-protein docking is to dock two free-state (unbound) proteins. To assess whether strong shape complementarity can still be achievable in unbound-unbound docking, we studied shape complementarity of unbound-unbound complexes using the molecular surface, Blur surface, and FlexBlur surface. The coordinates of these complexes are computed by superimposing the free components on the interface residues of their corresponding bound components. To help clarify the comparison between bound and free states we increased the bin width in all histograms from 0.5 Å to 1.0 Å.
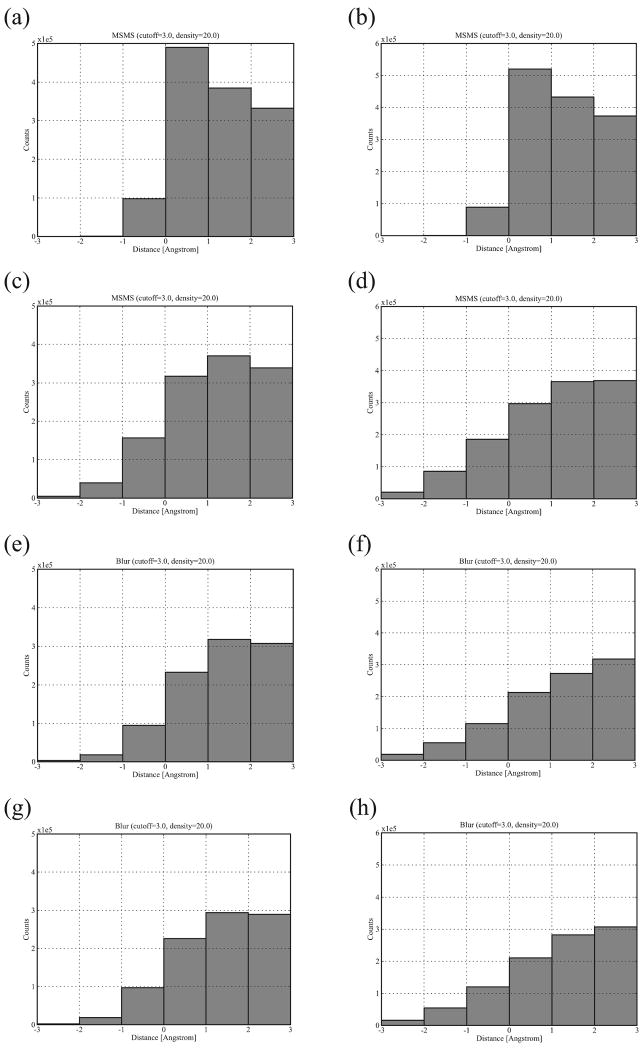
The histograms of interface distances based on the molecular surfaces of the unbound-unbound complexes of both groups are shown in Figure 11(c-d) along with the histograms of the bound-bound complexes (Figure 11(a-b)). In comparison with the bound state, the unbound state shows a flattened histogram with more overlaps and fewer good contacts. For the Rigid Group, the number of vertex overlaps increase by 103K (105%) while good contacts decrease by 181K (15%). For the Slightly Flexible Group, overlaps increase by 203K (228%) while good contacts decrease by 295K (22%). The peak of the histogram moves from the interface distance interval [0, 1] Å to [1, 2] Å for Rigid Group and to [2, 3] Å for Slightly Flexible Group. The shapes of the histograms indicate loss of good contacts (0Å <= distance < 3Å) and increase of interface overlaps (distance < 0Å). Thus, shape complementarity is partially lost in the unbound-unbound complexes, and applying it to free docking thus becomes difficult. As we learned from the above section, the Blur surface not only reduces overall shape complementarity (Figure 9) but also reduces overlaps at high blobbyness (Figure 10). Thus we sought a way of utilizing the latter property of the Blur surface to make free docking “smoother” (fewer clashes at the interface).
Figure 11.
Interface distance histograms of Rigid Group and Slightly Flexible Group. The histograms are based on the molecular surfaces of the bound-bound complexes (a-b; the former for Rigid Group and the latter for Slightly Flexible Group), the molecular surfaces of the unbound-unbound complexes (c-d), the Blur surfaces at blobbyness −0.3 of the unbound-unbound complexes (e-f), and the FlexBlur surfaces at blobbyness −0.9 of the unbound-unbound complexes (g-h).
Figure 10 shows that a blobbyness of −0.3 reduces overlaps the most. We thus plot interface distance histograms based on the Blur surface at blobbyness −0.3, as shown in Figure 11(e-f). As expected, the Blur surface reduces both overlaps and good contacts. The amount and percentage of reduction are shown in Table II. The number of reduced good contacts is about double the number of reduced overlaps at blobbyness −0.3 for both groups, but the percentage of the reduction is much higher for overlaps than for good contacts. For comparison, also listed in Table II are these values for the Blur surface at blobbyness −0.9; the number of reduced good contacts is more than double the amounts reduced overlaps; the percentages are similar. This confirms that the Blur surface at blobbyness −0.3 (low resolution) is better at reducing overlaps.
Table II. Amount of Interface Pairs of Unbound-Unbound Complexes in Different Distance Intervals and on Different Surfaces.
| Rigid Group | ||||||
|---|---|---|---|---|---|---|
| Distance | [−3, −2] | [−2, −1] | [−1, 0] | [0, 1] | [1, 2] | [2, 3] |
| MSMS | 5a | 40 | 157 | 317 | 370 | 339 |
| Blur (b = −0.9) | 6/+1b (+20%)c | 34/−6 (−15%) | 137/−20 (−13%) | 271/−46 (−15%) | 326/−44 (−12%) | 312/−27 (−8%) |
| Blur (b = −0.3) | 3/−2 (−40%) | 18/−22 (−55%) | 95/−62 (−39%) | 232/−85 (−27%) | 318/−52 (−14%) | 307/−32 (−9%) |
| FlexBlur (b = −0.9) | 2/−3 (−60%) | 19/−21 (−53%) | 97/−60 (−38%) | 226/−91 (−29%) | 294/−76 (−21%) | 289/−50 (−15%) |
| FlexBlur (b = −0.3) | 2/−3 (−60%) | 12/−28 (−70%) | 78/−79 (−50%) | 214/−103 (−32%) | 303/−67 (−18%) | 298/−41 (−12%) |
| Slightly Flexible Group | ||||||
| Distance | [−3, −2] | [−2, −1] | [−1, 0] | [0, 1] | [1, 2] | [2, 3] |
| MSMS | 21 | 85 | 186 | 297 | 366 | 369 |
| Blur (b = −0.9) | 24/+3 (+14%) | 76/−9 (−11%) | 154/−32 (−17%) | 257/−40 (−13%) | 318/−48 (−13%) | 338/−31 (−8%) |
| Blur (b = −0.3) | 19/−2 (−10%) | 55/−30 (−35%) | 115/−71 (−38%) | 213/−84 (−28%) | 273/−93 (−25%) | 318/−51 (−14%) |
| FlexBlur (b = −0.9) | 16/−5 (−24%) | 55/−30 (−35%) | 120/−66 (−35%) | 210/−87 (−29%) | 282/−84 (−23%) | 307/−62 (−17%) |
| FlexBlur (b = −0.3) | 9/−12 (−57%) | 33/−52 (−61%) | 82/−104 (−56%) | 165/−132 (−44%) | 243/−123 (−34%) | 287/−82 (−22%) |
Amount of interface pairs based on this surface [×1000].
Amount change from MSMS to this surface.
Percentage of amount change.
However, the larger percentage of reduced overlaps at blobbyness −0.3 is at the expense of losing a larger number of good contacts. In order to retain the good contacts while reducing the overlaps, we apply the FlexBlur surface that down-weights the contribution of flexible side-chain atoms. As blobbyness −0.9 best reproduces shape complementarity (mostly good contacts), the interface distance histograms based on the FlexBlur surface are generated at this blobbyness, with the goal of retaining good contacts while reducing overlaps. The histograms for both groups are presented in Figure 11(g-h). The FlexBlur surface significantly reduces the number of overlaps but also reduces a large number of good contacts. A quantitative measure of these changes is listed in Table II. We see that for both the Rigid and Slightly Flexible groups the FlexBlur surface at blobbyness −0.9 only reduces a similar number of overlaps as the Blur surface at blobbyness −0.3, while it reduces even more good contacts than the Blur surface at blobbyness −0.3 for the Rigid Group. This demonstrates that down-weighting flexible side-chain atoms reduces not only the clashes due to conformational changes but also the good contacts that are generated by these atoms. For comparison, the FlexBlur surface at blobbyness −0.3 reduces more overlaps than at blobbyness −0.9, but at a larger loss of good contacts especially for Slightly Flexible Group.
Therefore, in comparison to the molecular surfaces for unbound-unbound complexes, no blur surface can reduce the number of overlaps more than it reduces the number of good contacts. But the Blur surface at low resolution and the FlexBlur surface improve the percentage of good contacts to overlaps (see Table II), especially the FlexBlur surface at blobbbyness −0.3 that reduces more than 50% of overlaps while retaining more than 50% of good contacts compared to the molecular surface. Compared to other surfaces, this FlexBlur surface can be used to enable a docking scoring function with stronger penalties for overlaps, which can filter out more false decoys while keeping the near-native ones.
The fact that down-weighting flexible side-chain atoms cannot completely remove interface overlaps implies that there are probably large dislocations of particular interface backbone atoms upon binding. Table III examines the interface backbone atom shifts of the Rigid Group complexes. The first column shows the PDB IDs of the complexes, the second column I_RMS values, the third column number of backbone atoms that have more than a 1 Å shift, and the fourth column the largest translations of backbone atoms. Most complexes have tens of interface backbone atoms that move more than 1 Å from the bound to unbound state; in three of the complexes there are over one hundred. The largest shifts are in the range of 1.37 to 7.72 Å. This Table clearly demonstrates that there is no way of removing interface overlaps completely if only side-chain flexibility is considered in protein-protein docking.
Table III. Conformational Changes of Interface Backbone Atoms in Rigid Group.
| Compa | I_RMSb | N_LMc | MaxMd |
|---|---|---|---|
| 1WEJ | 0.49 | 10 | 4.64 |
| 1GHQ | 0.36 | 4 | 1.52 |
| 2SNI | 0.36 | 9 | 1.42 |
| 2SIC | 0.53 | 16 | 5.22 |
| 1SBB | 0.44 | 7 | 1.37 |
| 2PCC | 0.47 | 8 | 2.75 |
| 1KTZ | 0.51 | 16 | 2.76 |
| 2MTA | 0.52 | 6 | 6.28 |
| 1KLU | 0.47 | 11 | 2.30 |
| 1PPE | 0.46 | 13 | 2.31 |
| 1AVX | 0.52 | 23 | 2.55 |
| 1JPS | 0.54 | 25 | 2.76 |
| 1AY7 | 0.59 | 25 | 2.69 |
| 1EAW | 0.71 | 72 | 2.93 |
| 1MLC | 0.63 | 22 | 3.27 |
| 1MAH | 0.65 | 36 | 2.68 |
| 1RLB | 0.77 | 44 | 4.14 |
| 1IJK | 0.70 | 44 | 2.95 |
| 1AHW | 0.73 | 54 | 2.72 |
| 7CEI | 0.75 | 28 | 6.14 |
| 1E96 | 0.78 | 44 | 4.18 |
| 1QA9 | 0.92 | 57 | 4.62 |
| 1F51 | 0.75 | 91 | 3.63 |
| 1DQJ | 0.77 | 55 | 4.38 |
| 1BUH | 0.75 | 41 | 2.96 |
| 2BTF | 0.84 | 86 | 6.49 |
| 2VIS | 0.81 | 40 | 4.72 |
| 1EWY | 0.89 | 78 | 4.50 |
| 1TMQ | 0.83 | 47 | 7.37 |
| 1BVN | 0.85 | 91 | 4.60 |
| 1UDI | 0.89 | 60 | 7.72 |
| 1FQJ | 0.72 | 69 | 2.14 |
| 1GCQ | 0.97 | 43 | 6.54 |
| 1HE8 | 0.97 | 107 | 3.65 |
| 1F34 | 0.96 | 245 | 4.79 |
| 1HE1 | 0.94 | 139 | 3.43 |
| 1KAC | 0.95 | 53 | 5.55 |
Complex's PDB ID.
Interface backbone RMSD from bound to unbound [Å], slightly different from Table I as the latter computes RMSD only on Ca atoms.
Number of large movement (> 1Å) of backbone atoms.
Maximal movement [Å].
Discussion
Shape complementarity of individual bound-bound complexes based on the molecular surface demonstrates that enzyme-inhibitor complexes have the highest shape complementarity while antibody-antigen complexes have the lowest; the latter agrees with the shape complementarity study of bound protein-protein interfaces based on the molecular surface by Lawrence and Colman44. This indicates that shape complementarity alone may not be sufficient in docking to identify the native binding modes of the complexes with poor shape complementarity. For example, the 1HE8 complex (Rigid Group, Poor 3 category; Appendix S2 in the Supplementary Material) has poor shape complementarity but strong electrostatic interactions in its interface. More comprehensive searching schemes and scoring functions considering other interactions, such as electrostatics, are definitely needed. As shape complementarity itself is not an actual physical force, a better way to utilize it in docking may be to treat it as a filter to eliminate decoys with severe overlaps or too few good contacts at protein-protein interfaces, before an energy-based scoring function is used to evaluate the remaining decoys.
The interface distance histogram of the Rigid Group (bound-bound complexes) is very similar to that of the Slightly Flexible Group. Both have a convex distribution with a peak in the interface distance interval [0, 1] Å. These histograms indicate how shape can be utilized quantitatively, ranking near-native decoys highest. For example, one can proportionally reward the good contacts (especially those in the interface distance interval [0, 1] Å) and strongly penalize severe overlaps (interface distance < −1.0 Å) in decoy scoring. This part of the work serves as a benchmark for multi-resolution studies of shape complementarity. Note that we have chosen the molecular surface to generate the complementarity benchmark because of its wide use as a high-resolution surface for biomolecules. Recent work by Wei and coworkers45 presents the minimal molecular surface (MMS, created via the mean curvature minimization of molecular hypersurface functions) and shows that MMS yields smaller mean distance and standard deviation than the molecular surface at the interface of an antennapedia-DNA complex. However, without systematic studies, it is premature to say which surface better represents biomolecular interfaces at high resolution.
At all resolutions, the Blur surfaces reproduce more than 70% of the shape complementarity observed between the molecular surfaces of the Rigid Group bound-bound complexes. The reproduction is optimal (88%) at blobbyness −0.9, a medium resolution. Both low and high resolutions reduce the shape complementarity but low resolution reduces interface overlaps as well. Thus, for rigid re-docking, molecular surface will be the best choice during scoring. However, low-resolution Blur surfaces are a better choice during surface-based searching as they are smoother than the molecular surface. A smoother surface gives the shape-based scoring term a smoother potential map, facilitating finding the global minimum instead of being trapped in local minima. Another advantage of using the low-resolution Blur surface instead of the molecular surface is that the former is more tolerant of small conformational changes, as demonstrated in the protein-ligand docking study using the Gaussian function37.
For unbound-unbound complexes, conformational changes of ligand and receptor result in flattened interface distance histograms when using the molecular surface, especially for the Slightly Flexible Group complexes that have larger interface backbone conformational changes between the bound and unbound states. Although the Blur surface cannot increase shape complementarity (especially good contacts), it does reduce a larger percentage of interface overlaps than good contacts at high blobbyness, such as −0.3. The FlexBlur surface can further reduce overlaps in terms of percentage. This enables use of a scoring function that gives stronger penalties for overlaps to filter out more false decoys. Reducing overlaps has been attempted at the atomic level before, such as surface overlap tolerance1-4,8,11, and down-weighting of Lys, Arg, and Glu side-chains6. Our FlexBlur surface method offers one step forward by down-weighting only flexible side-chain atoms, thus the relatively rigid atoms are still fully represented on surfaces and the good interface contacts can be more conserved than by the previous methods. This could enable the development of a stricter scoring function to filter out more false decoys during docking.
The partial loss of shape complementarity from bound to unbound state raises the question of how shape complementarity should be applied to protein-protein docking. If we compare Figure 11(c-d) with Figure 11(a-b), we see the peaks of the histograms have moved from the interface distance interval [0, 1] Å to [1, 2] Å (Rigid Group) and [2, 3] Å (Slightly Flexible Group). Thus a shape-complementarity scoring term developed from the molecular surface-based histograms at the resolution of 1 Å (Figure 11(a-b)) will be unfavorable for the near-native decoys in unbound-unbound docking (they may be ranked low as the shape scoring term is sharp). However, if we change the resolution of the scoring term (the interval width of histograms) to 3 Å, it will still be favorable as the number of good contacts are larger than those of interface overlaps in both the bound and unbound histograms based on the molecular surface. This requires the scoring term based on the shape complementarity of molecular surfaces to be reduced to 3-Å resolution. However, if we compare Figure 11(e) with Figure 7(b), we see that the overall shape of Rigid Group's histogram based on the Blur surface at blobbyness −0.3 does not change much from the bound to unbound state (with both peaks in the interface distance interval [1, 2] Å), indicating that a scoring term at a resolution of 1 Å based on this Blur surface will still be favorable to the near-native decoys in unbound-unbound docking. This finding demonstrates that a low-resolution Blur surface has more tolerance than the molecular surface for nearly rigid systems (I_RMS < 1.0 Å) and thus is more suitable for unbound-unbound docking. For greater protein flexibility, the scoring term based on the highly smoothed Blur surface has also to be binned at lower resolution (at least to more than a 1-Å bin width); see the histogram of Slightly Flexible Group (1.0 Å < I_RMS < 2.5 Å) based on this Blur surface in Figure 11(f), in which the peak has moved from the interface distance interval [1, 2] Å to [2, 3] Å. Therefore, applying shape complementarity to unbound-unbound docking requires low resolution surfaces as well as a low resolution shape complementarity scoring term. This low-resolution scoring term together with other scoring terms can be used in early docking stages to reduce number of false negatives before high-resolution and flexibility-incorporated models take over.
In addition to the difficulties due to protein flexibility and poor shape complementarity in certain complexes, applying shape complementarity to protein-protein docking faces another problem – interface water molecules46,47. The protein-protein complexes used in this work have had their crystallographic water molecules removed, and thus waters are not included in the shape complementarity calculations. This may cause some complexes to partially lose shape complementarity. Monecke and coworkers computed the amount of interfacial water molecules for 26 antigen-antibody complexes based on free energy simulations and found that the predicted amounts are more than those in the crystal structures48. However, even if a method can accurately add missing water molecules back to the crystal structures of protein-protein complexes, a model of the unbound-unbound complex cannot be hydrated unambiguously, and thus comparing the shape complementarity between water-added bound-bound and unbound-unbound complexes is highly problematic. Therefore we did not include water molecules in our study. As we discuss above, low-resolution surfaces capture more global shape complementarity and have advantages over high-resolution surfaces in the early stages of protein-protein docking, where excluding detailed water structure is tolerable.
Conclusion
In this work we have developed a numerical isocontouring method for generating Blur surfaces and studied shape complementarity of two groups of protein-protein complexes at multiple resolutions. Our study reveals varying degrees of shape complementarity in the complexes, changes of shape complementarity over different surface resolutions, and differences of the shape complementarity between complexes of the proteins formed from bound and unbound states. Crystallographic complexes have different degrees of shape complementarity and some even have quite poor complementarity, thus shape complementarity alone should not be regarded as universally dominant in protein-protein docking; a comprehensive decoy search strategy and scoring function is needed. The shape complementarity of the complexes studied is nearly identical between the Rigid Group and Slightly Flexible Group bound-bound complexes, implying a common feature that can be utilized in decoy scoring in rigid re-docking. Multiple-resolution Blur surfaces reproduce more than 70% of the shape complementarity and reach an optimal (88%) at blobbyness −0.9, indicating that using the Blur surface is reasonable for shape complementarity studies. For complexes with ligand and receptor in an unbound state, shape complementarity is partially lost, causing an increase in interface overlaps and a decrease of good contacts. However, the Blur surface at low resolution conserves shape complementarity better than the molecular surface when evaluating complexes formed from the unbound states. It can also reduce the percentage of overlaps more than that of good contacts. The FlexBlur surface can further reduce interface overlaps in terms of percentage This work helps to clarify our understanding of the nature of shape complementarity at different resolutions in complexes of both bound and unbound states. Thus, it can serve as a guide for applying shape complementarity in protein-protein docking.
Supplementary Material
Acknowledgments
We thank Chandrajit Bajaj of The University of Texas at Austin for providing the codes used in Blur surface computation and Anna Omelchenko for wrapping these codes for use in Python. We also appreciate the coordinates of the unbound-unbound complexes provided by Brian Pierce of Boston University, many insightful discussions with Yunfeng Hu, and discussions of using CONCOORD and computing hydrogen bonds with Yong Zhao and Ruth Huey, respectively. Thanks are also extended to the developers of the PMV and Vision programs (mgltools.scripps.edu) used for surface visualization and analysis. The work is supported by NIH grants #P01HL16411-32 to AJ Olson and #R01 GM073087 to M Sanner. This is a manuscript #19486 from The Scripps Research Institute.
References
- 1.Chen R, Weng Z. Docking unbound proteins using shape complementarity, desolvation, and electrostatics. Proteins. 2002;47(3):281–294. doi: 10.1002/prot.10092. [DOI] [PubMed] [Google Scholar]
- 2.Chen R, Weng Z. A novel shape complementarity scoring function for protein-protein docking. Proteins. 2003;51(3):397–408. doi: 10.1002/prot.10334. [DOI] [PubMed] [Google Scholar]
- 3.Fischer D, Lin SL, Wolfson HL, Nussinov R. A geometry-based suite of molecular docking processes. J Mol Biol. 1995;248(2):459–477. doi: 10.1016/s0022-2836(95)80063-8. [DOI] [PubMed] [Google Scholar]
- 4.Gabb HA, Jackson RM, Sternberg MJ. Modelling protein docking using shape complementarity, electrostatics and biochemical information. J Mol Biol. 1997;272(1):106–120. doi: 10.1006/jmbi.1997.1203. [DOI] [PubMed] [Google Scholar]
- 5.Gardiner EJ, Willett P, Artymiuk PJ. Protein docking using a genetic algorithm. Proteins. 2001;44(1):44–56. doi: 10.1002/prot.1070. [DOI] [PubMed] [Google Scholar]
- 6.Heifetz A, Eisenstein M. Effect of local shape modifications of molecular surfaces on rigid-body protein-protein docking. Protein Eng. 2003;16(3):179–185. doi: 10.1093/proeng/gzg021. [DOI] [PubMed] [Google Scholar]
- 7.Helmer-Citterich M, Tramontano A. PUZZLE: a new method for automated protein docking based on surface shape complementarity. J Mol Biol. 1994;235(3):1021–1031. doi: 10.1006/jmbi.1994.1054. [DOI] [PubMed] [Google Scholar]
- 8.Jiang F, Kim SH. “Soft docking”: matching of molecular surface cubes. J Mol Biol. 1991;219(1):79–102. doi: 10.1016/0022-2836(91)90859-5. [DOI] [PubMed] [Google Scholar]
- 9.Meyer M, Wilson P, Schomburg D. Hydrogen bonding and molecular surface shape complementarity as a basis for protein docking. J Mol Biol. 1996;264(1):199–210. doi: 10.1006/jmbi.1996.0634. [DOI] [PubMed] [Google Scholar]
- 10.Norel R, Lin SL, Wolfson HJ, Nussinov R. Shape complementarity at protein-protein interfaces. Biopolymers. 1994;34(7):933–940. doi: 10.1002/bip.360340711. [DOI] [PubMed] [Google Scholar]
- 11.Norel R, Petrey D, Wolfson HJ, Nussinov R. Examination of shape complementarity in docking of unbound proteins. Proteins. 1999;36(3):307–317. [PubMed] [Google Scholar]
- 12.Ritchie DW, Kemp GJ. Protein docking using spherical polar Fourier correlations. Proteins. 2000;39(2):178–194. [PubMed] [Google Scholar]
- 13.Gabdoulline RR, Wade RC. Analytically defined surfaces to analyze molecular interaction properties. J Mol Graph. 1996;14(6):341–353. 374–345. doi: 10.1016/s0263-7855(97)00008-8. [DOI] [PubMed] [Google Scholar]
- 14.Norledge BV, Petrovan RJ, Ruf W, Olson AJ. The tissue factor/factor VIIa/factor Xa complex: a model built by docking and site-directed mutagenesis. Proteins. 2003;53(3):640–648. doi: 10.1002/prot.10445. [DOI] [PubMed] [Google Scholar]
- 15.Vakser IA, Matar OG, Lam CF. A systematic study of low-resolution recognition in protein--protein complexes. Proc Natl Acad Sci U S A. 1999;96(15):8477–8482. doi: 10.1073/pnas.96.15.8477. [DOI] [PMC free article] [PubMed] [Google Scholar]
- 16.Vakser IA. Low-resolution docking: prediction of complexes for underdetermined structures. Biopolymers. 1996;39(3):455–464. doi: 10.1002/(SICI)1097-0282(199609)39:3%3C455::AID-BIP16%3E3.0.CO;2-A. [DOI] [PubMed] [Google Scholar]
- 17.Vakser IA. Protein docking for low-resolution structures. Protein Eng. 1995;8(4):371–377. doi: 10.1093/protein/8.4.371. [DOI] [PubMed] [Google Scholar]
- 18.Segal D, Eisenstein M. The effect of resolution-dependent global shape modifications on rigid-body protein-protein docking. Proteins. 2005;59(3):580–591. doi: 10.1002/prot.20432. [DOI] [PubMed] [Google Scholar]
- 19.Mintseris J, Wiehe K, Pierce B, Anderson R, Chen R, Janin J, Weng Z. Protein-Protein Docking Benchmark 2.0: an update. Proteins. 2005;60(2):214–216. doi: 10.1002/prot.20560. [DOI] [PubMed] [Google Scholar]
- 20.Sanner MF, Olson AJ, Spehner JC. Fast and robust computation of molecular surfaces. Vancouver BC, Canada: 1995. pp. C6–C7. [Google Scholar]
- 21.Max NL, Getzoff ED. Spherical Harmonic Molecular-Surfaces. Ieee Computer Graphics and Applications. 1988;8(4):42–50. [Google Scholar]
- 22.Leicester SE, Finney JL, Bywater RP. Description of Molecular-Surface Shape Using Fourier Descriptors. Journal of Molecular Graphics. 1988;6(2):104–108. [Google Scholar]
- 23.Leicester S, Finney J, Bywater R. A Quantitative Representation of Molecular-Surface Shape. 1. Theory and Development of the Method. Journal of Mathematical Chemistry. 1994;16(3-4):315–341. [Google Scholar]
- 24.Duncan BS, Olson AJ. Shape analysis of molecular surfaces. Biopolymers. 1993;33(2):231–238. doi: 10.1002/bip.360330205. [DOI] [PubMed] [Google Scholar]
- 25.Ritchie DW, Kemp GJL. Fast computation, rotation, and comparison of low resolution spherical harmonic molecular surfaces. Journal of Computational Chemistry. 1999;20(4):383–395. [Google Scholar]
- 26.Blinn JF. A Generalization of Algebraic Surface Drawing. ACM Transactions on Graphics. 1982;1(3):235–256. [Google Scholar]
- 27.Koenderink JJ. Solid Shape. Cambridge, MA: MIT Press; 1990. [Google Scholar]
- 28.Duncan BS, Olson AJ. Approximation and characterization of molecular surfaces. Biopolymers. 1993;33(2):219–229. doi: 10.1002/bip.360330204. [DOI] [PubMed] [Google Scholar]
- 29.Grant JA, Pickup BT. A Gaussian Description of Molecular Shape. Journal of Physical Chemistry. 1995;99(11):3503–3510. [Google Scholar]
- 30.Bajaj C, Siddavanahalli V. Fast feature adaptive surfaces and derivatives computation for volumetric particle data. The University of Texas at Austin; 2005. [Google Scholar]
- 31.Bajaj C, Castrillon-Candas J, Siddavanahalli V, Xu Z. Compressed representations of macromolecular structures and properties. Structure. 2005;13(3):463–471. doi: 10.1016/j.str.2005.02.004. [DOI] [PubMed] [Google Scholar]
- 32.Mendez R, Leplae R, De Maria L, Wodak SJ. Assessment of blind predictions of protein-protein interactions: current status of docking methods. Proteins. 2003;52(1):51–67. doi: 10.1002/prot.10393. [DOI] [PubMed] [Google Scholar]
- 33.Connolly ML. Analytical Molecular-Surface Calculation. Journal of Applied Crystallography. 1983;16(Oct):548–558. [Google Scholar]
- 34.Yu Z, Jacobson MP, Friesner RA. What role do surfaces play in GB models? A new-generation of surface-generalized born model based on a novel gaussian surface for biomolecules. J Comput Chem. 2006;27(1):72–89. doi: 10.1002/jcc.20307. [DOI] [PMC free article] [PubMed] [Google Scholar]
- 35.Grant JA, Gallardo MA, Pickup BT. A fast method of molecular shape comparison: A simple application of a Gaussian description of molecular shape. Journal of Computational Chemistry. 1996;17(14):1653–1666. [Google Scholar]
- 36.Weiser J, Shenkin PS, Still WC. Optimization of Gaussian surface calculations and extension to solvent-accessible surface areas. Journal of Computational Chemistry. 1999;20(7):688–703. doi: 10.1002/(SICI)1096-987X(199905)20:7<688::AID-JCC4>3.0.CO;2-F. [DOI] [PubMed] [Google Scholar]
- 37.McGann MR, Almond HR, Nicholls A, Grant JA, Brown FK. Gaussian docking functions. Biopolymers. 2003;68(1):76–90. doi: 10.1002/bip.10207. [DOI] [PubMed] [Google Scholar]
- 38.Ritchie DW. Evaluation of protein docking predictions using Hex 3.1 in CAPRI rounds 1 and 2. Proteins. 2003;52(1):98–106. doi: 10.1002/prot.10379. [DOI] [PubMed] [Google Scholar]
- 39.Eberly D, Lancaster J, Alyassin A. On Gray Scale Image Measurements. 2. Surface-Area and Volume. Cvgip-Graphical Models and Image Processing. 1991;53(6):550–562. [Google Scholar]
- 40.Bajaj C, Pascucci V, Schikore D. Fast isocontouring for improved interactivity. San Francisco, CA: ACM Press; 1996. pp. 39–46. [Google Scholar]
- 41.Bajaj C, Pascucci V, Schikore D. Accelerated isocontouring of scalar fields. In: Bajaj C, editor. Data Visualization Techniques. John Wiley and Sons; 1998. [Google Scholar]
- 42.Garland M. SlimKit -- surface modeling tools for simplification and related tasks. 1998 [Google Scholar]
- 43.de Groot BL, van Aalten DM, Scheek RM, Amadei A, Vriend G, Berendsen HJ. Prediction of protein conformational freedom from distance constraints. Proteins. 1997;29(2):240–251. doi: 10.1002/(sici)1097-0134(199710)29:2<240::aid-prot11>3.0.co;2-o. [DOI] [PubMed] [Google Scholar]
- 44.Lawrence MC, Colman PM. Shape Complementarity at Protein-Protein Interfaces. Journal of Molecular Biology. 1993;234(4):946–950. doi: 10.1006/jmbi.1993.1648. [DOI] [PubMed] [Google Scholar]
- 45.Bates PW, Wei GW, Zhao S. Minimal molecular surfaces and their applications. 2006 doi: 10.1002/jcc.20796. [DOI] [PubMed] [Google Scholar]
- 46.Cazals F, Proust F. Revisiting the description of protein-protein interfaces Part II: Experimental study. Sophia Antipolis, France: INRIA Sophia Antipolis; 2005. Report nr N 5501. [Google Scholar]
- 47.Papoian GA, Ulander J, Wolynes PG. Role of water mediated interactions in protein-protein recognition landscapes. J Am Chem Soc. 2003;125(30):9170–9178. doi: 10.1021/ja034729u. [DOI] [PubMed] [Google Scholar]
- 48.Monecke P, Borosch T, Brickmann J, Kast SM. Determination of the interfacial water content in protein-protein complexes from free energy simulations. Biophys J. 2006;90(3):841–850. doi: 10.1529/biophysj.105.065524. [DOI] [PMC free article] [PubMed] [Google Scholar]
Associated Data
This section collects any data citations, data availability statements, or supplementary materials included in this article.


