

Abstract
Over the last decade, magnetic resonance imaging has become an essential tool in the evaluation of both in vivo human brain development and perinatal brain injury. Recent technology including MR compatible neonatal incubators, neonatal head coils, advanced MR pulse sequences and 3T field strength magnets allow high quality MR imaging studies to be performed on sick neonates. This article will review basic principles and concepts underlying recent advances in MR spectroscopy, diffusion, perfusion and volumetric MR imaging. These techniques provide quantitative assessment and novel insight of both brain development and brain injury in the immature brain. Knowledge of normal developmental changes in quantitative MR values is also essential to interpret pathologic cases.
INTRODUCTION
Despite improvement in neonatal medicine, perinatal brain injury is a major complication that can cause long-term disability.1 In the last decade, magnetic resonance (MR) imaging techniques have become the imaging modality of choice in the evaluation of the neonatal brain. Conventional MR techniques have been shown to not only provide valuable information about the pattern of brain injury in the neonatal period, but also provide information about prognosis and neurodevelopment outcome. There have been recent advances in MR imaging of the neonatal brain with respect to the development of MR compatible incubators which can provide an environment specifically adapted to meet the needs of critically ill preterm and term neonates when undergoing MR imaging studies. In addition, imaging resolution and signal to noise ratio have been dramatically improved with the use of specifically designed neonatal coils. Refinement of conventional imaging techniques includes the use of PROPELLER (periodically overlapping parallel lines with enhanced reconstruction) techniques for motion correction. MR diffusion imaging (both diffusion weighted imaging and diffusion tensor imaging) and MR spectroscopy (MRS) are recently developed techniques that are now routinely used clinically to evaluate physiology and metabolism in the developing and injured neonatal brain. MR neonatal perfusion imaging and functional MR (fMR) are new emerging fields showing promise by non-invasively evaluating cerebral blood flow (CBF) and the development of brain function, respectively.
The goal of this article is to (1) provide information about the technological MR advances in the evaluation of in vivo brain development; (2) review basic concepts and parameters of “normal” brain development for quantitative MR spectroscopy, diffusion imaging, perfusion imaging and volumetric MR imaging and (3) review the use of these advanced MR techniques in evaluating the most prevalent patterns of neonatal brain injury including perinatal white matter injury and term hypoxic-ischemic brain injury. This review will demonstrate how advanced MR imaging modalities can contribute to the differential evaluation of neonatal brain injury with respect to (1) earlier detection of injury, (2) providing important metabolic and physiologic information, and (3) providing a quantitative assessment of brain injury which may be compared to appropriate age-matched controls. Of note, with respect to spectroscopy, this review will cover the concepts related to quantitative proton single-voxel MRS. There are other dedicated chapters in this journal to both multi-voxel MRS technique, perfusion imaging and functional MR in the newborn brain. Concepts related to 3T imaging are integrated into each section of this review.
TECHNICAL ADVANCES IN MR IMAGING OF THE NEONATAL BRAIN
MR-Compatible Neonatal Incubator and Neonatal Head Coil
MR imaging studies of critically ill preterm and term neonates are difficult because of the need to provide consistent, reliable and effective monitoring and support for respiratory and cardiovascular functions, as well as fluid-electrolyte and thermoregulatory homeostasis throughout the examination. Thus, one needs to bring either the MR suite to the Neonatal Intensive Care Unit (NICU) or the NICU to the MR suite. Our approach has been to bring the NICU to the MR suite, i.e. to develop the ability to provide uninterrupted intensive care including monitoring and full clinical support for critically ill preterm and term neonates while undergoing MR imaging studies. We have accomplished this by the use of a FDA-approved MR-compatible incubator (Lammers Medical Technology, Lübeck, Germany) and monitoring system (Figure 1). By utilizing the MR-compatible incubator with air flow, humidity and temperature regulation, monitoring and respiratory devices and specialized integrated radiofrequency head and body coils (Advanced Imaging Research, Inc., Cleveland Ohio, USA), we have recently demonstrated that this MR-compatible incubator provides a safe and controlled environment for critically ill preterm and term newborns. In addition, we showed that the use of the integrated radiofrequency head and body coils optimized for newborns improves the quality of MR imaging.2,3 There are several centers that are utilizing neonatal incubators.4
Figure 1.

The MR-compatible incubator used for clinical and research MRI studies in preterm and term neonates. The baby inside receives optimal humidity and temperature that is controlled from the backside of the system. The front part hosts the neonatal head coil specifically designed for preterm and term neonates and infants. Handling ports on the side allow support to the bed and the neonate; the rear handling port allows placement and removal of the head coil. Also shown is the MR-compatible ventilator and monitoring equipment. (From Panigrahy A, Bluml S, “Advances in magnetic resonance neuroimaging techniques in the evaluation of neonatal encephalopathy” in Topics in Magnetic Resonance Imaging, Vol. 18(1) page 4. Reprinted by permission of publisher, Wolters Kluwer Health/Lippincott, Williams & Wilkins)
In addition, manufacturers of MR imaging systems usually provide only general “one fits all” coils, i.e., a head coil designed for use in adults. However, this approach results in inferior image quality in children and especially, newborns. Coils appropriately tailored to the body size of the neonate indeed offer superior signal-to-noise ratio (SNR) and image contrast for the neonatal patient population. Improvements in SNR, in turn, can be used to reduce scan time, improve image resolution or do both.
Neonatal Imaging Protocol
The protocol consistent of a coronal three-dimensional (3D) spoiled gradient echo (SPGR) using a repetition time (TR) of 35 ms and a minimum echo time (TE), 20–22 cm file of view (FOV) matrix, and an axial T2 fast spin echo sequence. The coronal SPGR is reformatted in both the axial and sagittal planes, thus saving scanning time and allowing for volumetric analysis. With 3T imaging, and parallel imaging acquisition, both gradient echo T1 and turbo spin echo T2 imaging can be acquired in an isotropic volumetric manner, allowing evaluation of all three planes in a short time period. Both diffusion weighted imaging with apparent diffusion coefficient (ADC) mapping and diffusion tensor imaging (described below) are performed. Also, single voxel short echo MR spectroscopy is performed in the parietal white matter and grey matter with optional voxel placement in the frontal white matter, basal ganglia, brainstem and cerebellum (described below). We have also employed PROPELLER, which is a unique mode of data acquisition that allows for intrinsic compensation for translational or rotational head motion (Figure 2). This technique allows for correction of spatial inconsistencies in rotation/position between strips and results in an averaging effect for low spatial frequencies, which decreases motion artifact.5 The safety and feasibility of studying newborns with 3T imaging has been demonstrated in both sedated and non-sedated newborns using both conventional and advanced MR techniques.6–8
Figure 2.

PROPELLER (motion correction) T2 sequence in a term equivalent preterm infant. The image on the left show significant motion artifact with the conventional turbo spin echo T2 imaging which is corrected when the PROPELLER T2 imaging is performed (image on the right). The preterm infant has diffuse white matter hypoplasia.
DIFFUSION WEIGHTED AND DIFFUSION TENSOR IMAGING OF THE DEVELOPING BRAIN
Diffusion Weighted Imaging
Diffusion weighted MR imaging is based on the microscopic movement of water molecules in brain tissue.9 Diffusion weighted MR imaging is performed using a single shot spin echo echo-planar pulse sequences using pulsed diffusion gradients. The strength of the diffusion gradient is expressed as a “b” value in units of seconds per square millimeters. In neonatal imaging, we tend to use a b value range of 700 to 1000 s/mm2. There are two basic imaging sequences that are being used to obtain quantitative information about water diffusion. The first method uses two images for each slice. The first image (b-zero image) is acquired without diffusion weighting whereas the second image (diffusion image) is acquired with identical parameters, but in addition, employing so called diffusion gradients prior to reading out the water signal. The diffusion gradients do not emphasize any spatial direction. On these second images, areas with high water diffusion show low signal intensity whereas areas with low water diffusion have higher intensity. The two images can be combined to calculate the “Apparent Diffusion Coefficient” (ADC) map.
Quantitative Diffusion Tensor Imaging
The second method is termed Diffusion Tensor Imaging (DTI).5–16 Again a b-zero image is acquired. However, additional images (at least six per slice) are acquired where each image emphasizes a different spatial direction for water diffusion. From the b-zero image and the set of diffusion weighted images a more complete picture of the water diffusion can be obtained. Specifically, for each region, a diffusion matrix or tensor that contains information about the diffusion of water along the six independent directions (xx, yy, zz, xy, xz, yz) can be computed. From this tensor, the fraction of isotropic or anisotropic can be derived. Diagonalization of the matrix provides the eigenvectors and eigenvalues of diffusion. The mean diffusivity is the average of the three eigenvalues, which are the measurements of the magnitude of the diffusion along the three principal orthogonal directions. The variance of the three eigenvalues is known as diffusion anisotropy (Figure 3). This diffusion anisotropy can be expressed with the use of different metrics including fractional anisotropy, relative anisotropy and volume ratio. There are dramatic changes in fractional anisotropy, mean diffusivity and the three eigenvalues that occur in both grey and white matter structures in the neonatal period during normal development (Figure 4, 5).17–26 These quantitative parameters correlate with sequences of myelination in the developing brain.27–32 Knowledge of these changes is critical in order to properly use diffusion tensor imaging in the evaluation of a neonate with brain injury. Calculation of diffusion tensor metrics, diffusivity, etc. may also provide pathologic insight. The primary eigenvector corresponds to maximum diffusivity and is oriented parallel to white matter fibers, its corresponding eigenvalue is also known as “axial diffusivity” which is felt to reflect axonal integrity as determined by animal models. The secondary and tertiary eigenvectors are assumed to be in the transverse plane oriented perpendicular to fiber direction. The average of their eigenvalues is referred as radial diffusivity, which is felt to reflect either oligodendroglial integrity or myelination. Recent work in premature infants with abnormal white matter signal intensity has demonstrated that radial diffusivity abnormalities tend to predominate over axial diffusivity abnormalities. This may have implications for pathological mechanisms in differentiating both oligodendroglial injury and axonal injury in PVL.33
Figure 3.

Schematic showing the theoretical basis of the two major diffusion tensor metrics: mean diffusivity or ADC (left) and fractional anisotropy (right).
Figure 4.

A comparison of the quantitative developmental changes in mean diffusivity or ADC, fractional anisotropy and relative anisotropy in the developing human frontal periventricular white matter in neonatal and pediatric patients with normal MR scans: there is a decrease in mean diffusivity in the frontal periventricular white matter with a concominent increase in fractional anisotropy in the same region. (Mean diffusivity is in mm2/s units on bottom graph). The bottom right graph shows a comparison of the quantitative developmental changes in the three eigenvalues in the developing human frontal periventricular white matter in neonatal and pediatric patients with normal MR scans: there is decrease in the three eigenvalues in the frontal periventricular white matter with first eigenvalue (maximum) higher in magnitude compared to the second (intermediate) and third (minimum) eigenvalue which are both closer in magnitude.
Figure 5.

Diffusion tensor imaging of a preterm neonate (25 weeks gestation, 1 week old) with color direction specific [blue-cranial caudal, green-transverse, and red-anterior posterior] fractional anisotropy map (top left) and mean diffusivity map (bottom left) compared to a term neonate (right). There is direction specific increased anisotropy in the corpus callosum, anterior limb of the internal capsule and the posterior limb of the internal capsule (which are unmyelinated at this age). There is also evidence of increased anisotropy of the cerebral cortex which disappears by term age.
Diffusion Tensor Tractography
Diffusion tensor can also be used to map white matter tracts because water movement across fibers can be hindered by white matter elements.23–25 Diffusion tensor imaging can be used to generate tractography data to evaluate selected tracts (i.e., optic radiations) in the neonate. Of note, anisotropy can be detected before myelination has occurred suggesting that diffusion tensor imaging may be able to detect pre-myelinating elements. The course of white matter tracts can be delineated in the brain by using pixel-by-pixel information based on anisotropic values from DTI data sets. The two major categories of DTI fiber tracking algorithms are deterministic and probabilistic methods. Fiber assignment by continuous tracking (FACT) is a deterministic method that initiates fiber pathways from manual placement of voxels (Figure 6). This algorithm uses the direction of anisotropy (principal eigenvector of the diffusion tensor) and starts from an initially determined point and moves in the direction of the principal eigenvector from pixel to pixel, updating itself after each new pixel. When a pixel is reached which has a low FA threshold (predetermined), the tract will stop forming. In addition, the turning angle limitation is also set which can also stop the tract from forming. The FA threshold is age and region dependent with a value of 0.05 being used in the premature brain, 0.1 in the infant brain and 0.3 in the adult brain. Typical values for the turning angle range from 40–70 degrees. Higher values may be need for structures that have a hair pin turn like the uncinate fasiculus, but increasing the turning angle may result in the development of spurious tracts.34,35
Figure 6.

Diffusion tensor tractography of the newborn optic radiation comparing a continuous (FACT) technique (left) to a probabilistic technique (right) in the same patient.
These deterministic tractography methods, however, are limited by noise, patient movement and distortion from image artifacts which can create uncertainty in the orientation of the diffusion ellipsoid and eigenvector. Probabilistic fiber tracking methods can use this uncertainty to recreate a novel connectivity metric for each voxel (Figure 6). Some probability fiber tracking methods include bootstrap statistics. In order to improve conspicuity of optic radiations in the newborn, we have generated directional maps based on novel multi-modality probabilistic (Monte Carlo) tractography. The method combines co-registered DTI and anatomical (T2-weighted) MRI image volumes such that fiber generation into GM and CSF is suppressed, and is designed to be robust with respect to noise in the DTI data. Tractography was performed from multiple starting points distributed uniformly throughout the brain volume, and results were visualized using 2D color-coded maps with the color and brightness of each voxel based on the orientation and density, respectively, of the fibers passing through the voxel. Tractography-based directional maps were found to be highly effective in suppressing spurious directional anatomy inside CSF. In addition, these Monte Carlo probability tractography-based maps appeared more uniform (less “speckled”) in the newborn sub-cortex, which correctly reflects the increased uncertainty in the DTI measurements in these low-FA regions. These probabilistic DTI fiber tractography techniques tend to delineate the white matter tracts to a greater degree than the deterministic methods. Most commercially available DTI software however tend to be FACT deterministic methods.
SINGLE VOXEL QUANTITATIVE PROTON MR SPECTROSCOPY OF THE DEVELOPING BRAIN
Developmental Changes in NAA
The signal used by MRI to create anatomical maps is generated primarily by the hydrogen nuclei, also known as protons (1H), of water molecules (H2O). In contrast, 1H MRS analyzes signal of protons attached to other molecules. Whereas for MRI only a single peak (water) is being mapped, the output of MRS is a collection of peaks at different radiofrequencies (RF) representing proton nuclei in different chemical environments, proportional to the number of contributing protons. The most prominent peak of the 1H spectrum is N-acetyl-aspartate (NAA), which is the resonance at 2.0 ppm from three equivalent protons of the acetyl group of the N-acetyl-aspartate molecule. The role of NAA, and its regulation in vivo, is not well understood. In the normal brain, NAA is synthesized in neurons, diffuses along axons, and is broken down in oligodendrocytes. NAA is not only found in neurons, but can also be found localized to oligodenodrocyte type-2 astrocyte progenitor cells and immature oligodendrocytes. Proton spectra of any disease that is associated with neuronal or axonal loss will exhibit a reduction of NAA. NAA is low in the normal, developing, newborn brain, despite the presence of neurons. There is a dramatic increase in the concentration of NAA which occurs around term (Figure 7–9). The maximum net increase in NAA is at 42 weeks, while the time of fastest increase is between 37 and 47 weeks post-conceptional age when NAA increases from 31% to 67% of adult levels. The second tallest peak in occipital grey matter spectra is creatine (Cr) at 3.0 ppm. For normal brain tissue, the creatine peak comprises contributions from free creatine (fCr) and phosphocreatine (PCr) in approximately equal proportions. PCr is in rapid chemical exchange with fCr and is used to replenish ATP levels if required. Like NAA, Cr is also low in the newborn.
Figure 7.

Sample spectra and MR images of the developing grey and white matter from midgestation to term using short echo proton MR spectroscopy. There is an increase in NAA with a decrease in myo-inositol noted during the same time period.
Figure 9.

Age dependent changes of N-acetylaspartate (NAA) and Myo-Inositol in parietal white matter: The maximum net increase of NAA is at 42 weeks. The most dramatic changes occur between 37 and 47 weeks when NAA increases from 31% to 67% of adult level. NAA reaches 90% of normal adult levels at 5 years. In contrast, the maximum net decrease of mI is at 41 weeks post-conceptional age. Time of fasted net decrease is between 33 and 56 weeks when mI decreases from 180% to 110% of adult levels. Myo-inositol reaches a minimum at 2 years and thereafter increases slightly.
Developmental Changes in Myo-Inositol
Total Choline (tCho), Cr, and NAA can be detected readily and quantified in long echo time (TE) MR spectroscopy. Short TE acquisition methods are necessary for reliable quantitation of myo-inositol (mI). Myo-inositol is a little-known sugar-like molecule that resonates at 3.6 ppm in the proton spectrum. It has been identified as a marker for astrocytes and is an osmolyte.36,37 Myo-inositol is also involved in metabolism of phosphatidyl inositol, a membrane phospholipid. Similar to choline, mI is expected to be altered in response to alteration of membrane metabolism or damaged membrane. Both tCho and mI are high in the newborn brain but decrease rapidly to normal levels within the first 12–24 months after birth. Of note, the most dramatic decrease in myo-inositol occurs during and immediately after term followed by the decrease in choline as described above. The maximum net decrease of myo-inositol is approximately 41 weeks (Figure -7–9).
Developmental Changes in other Metabolites
The next prominent peak at 3.2 ppm is commonly referred to as choline (Cho) or trimethylamines (TMA). Choline is a complex peak comprising several choline-containing metabolites and therefore the term total choline (tCho) is also frequently used. Choline containing compounds are involved in the synthesis and breakdown of phosphatidylcholine (PtdCho = lecithin). PtdCho is the major phospholipid component of eukaryotic cells accounting for approximately 60% of total phospholipids. The large choline peak that is seen early in development, compared to the adult brain, likely represents the high level of substrates that are needed for both the formation of myelin and cell membranes. Myelination is an orderly process that follows both a chronological and topographical sequences, as described by histological autopsy studies and conventional MRI. The most dramatic changes in myelination occur between midgestation and the end of the second postnatal year of life. The stages of myelination formation include oligodendrocyte differentiation and proliferation followed by lipid deposition and myelin sheath formation. A decrease in choline has been noted in development, most prominent in the first two years of life, correlating with the relative completion of myelination. This may be corresponding to the incorporation of phosphatidylcholine into the mature myelin sheath. Of note, the mature myelin sheath consists of cholesterol (28%), galactocerebroside (22%), phosphatidylehtanolamine (12%), phosphatidylcholine (11%), sphigomyelin (8%), phosphatidlserine (5%), sulfatide (4%) and phosphotidylinositol (1%), fatty acids and protein.
Glutamate and glutamine are important components of the 1H spectrum. Of all metabolites, glutamate has the highest concentration in normal human brain tissue. Due to their similar chemical structures, glutamate and glutamine form complex and partially overlapping resonances in 1H spectra. Both glutamate and glutamine have two groups of resonances: The first group (α-glu and α-gln) has three peaks between 3.6 ppm and 3.9 ppm whereas the second group (β,γ-glu and β,γ-gln) comprises a more complex series of resonances between 2.0 and 2.6 ppm. Accordingly, the quantitation of these chemicals is challenging. MR spectra of excellent quality and sophisticated software, such as LCModel38 that fits all metabolite resonances simultaneously, are essential for reliable independent quantitation of these amino acids. Glutamate and glutamine form an important neurotransmitter cycle in the normal brain where glutamate is mainly stored in neurons whereas the glutamine concentration is higher in astrocytes. However, the role of glutamate and glutamine is almost certainly much more complicated. For example, glutamate can be used as a fuel and oxidized to substitute for glucose metabolism in hypoglycemic states.39,40 Excessive synaptic glutamate may cause nerve cell damage due to excessive excitation. Glutamine increases under hypoxic stress and under hyperammonemic conditions.41 Glutamate and glutamine may be more readily resolved at 3T imaging compared to 1.5 T imaging (Figure 10).
Figure 10.

Comparison of 3T with 1.5T MR spectroscopy for the differentiation of lactate, lipids, and propylene glycol. Two 3T spectra are depicted on the left and two 1.5T spectra are depicted on the right taken from the same brain region. Lactate demonstrates a characteristic doublet of two narrow lines 0.1 ppm apart centered at 1.33 ppm. Lipids form two broad peaks from the methyl and methylene groups at 0.9 and 1.3ppm. Propylene glycol has a similar pattern like lactate, however, the doublet is centered at approximately 1.1 ppm. These peaks resolve better using 3T imaging compare to 1.5T.
Lactate is an important metabolite since it indicates anaerobic metabolism. Although lactate can be detected at pathologically elevated concentrations, in healthy tissue, the lactate concentration is too low for routine detection with currently available methods. Important exceptions are newborns (particularly premature newborns) where lactate is detectable in apparently normal brain tissue.27 The concentration is enough that pyruvate dehydrogenase the enzyme that enables entry of pyruvate into the TCA cycle has a low activity in early brain development. Lactate is the product of anaerobic glycolysis and increases when subsequent oxidation of lactate in the TCA cycle is impaired (for example by lack of oxygen or mitochondrial disorders). Lactate can also increase in necrotic tissue and cysts (Figure 10). The protons of the methyl groups (-CH3) of lipid molecules resonate at 0.9 ppm whereas protons of the methylene groups (-CH2-) resonate at 1.3 ppm in the 1H spectrum. Both resonances are broad, and may also comprise contributions from other macromolecules. In normal tissue, the concentration of free lipids is small and there should be very little signal in this part of the spectrum. Lipid signals increase when there is a breakdown of cell membrane and release of fatty acids. Lipids are therefore important markers for severe brain injury.
Differentiation of Lipids, Lactate and Propolene glycol: 3T vs 1.5T
Additional “abnormal” peaks can be observed for example after the ingestion of alcohol, in unusual diets (ketone bodies such as acetone after ketogenic diet42) or following the administration of large amounts of medication such as mannitol or propylene glycol solvent for drugs. At 3T imaging of the neonatal brain, propolene glycol, lactate and lipids can be resolved easier compared to 1.5 imaging (Figure 10).
Processing of Quantitative Proton MRS Data
At Childrens Hospital Los Angeles, all SV-MRS processing is fully automated and does not require user interaction. A background process copies automatically all spectroscopy files from the scanner workstation to an offline MRS processing workstation (= MRS workstation). MR images in DICOM format are also copied to this computer (Figure 11). A background process on the MRS workstation checks every 5 minutes for newly arrived spectroscopy files. Once a new spectroscopy study is identified, a PERL script that coordinates (i) the processing of the spectrum with LCModel, (ii) the determination of the necrotic/cystic fraction with a MatLab function and (iii) the selection of reference images to document the region of interest, is started. Approximately 10–20 min after the completion of an MRS acquisition a printout is automatically generated and available for review and documentation. The patient is then registered in the MRS database and the quantitative output from LCModel processing and the fractions of tissue and cystic/necrotic areas are loaded into the database. LCModel also generates information about the quality of the spectra, in particular by measuring the linewidth of the unsuppressed water peak. Spectra which do not meet the quality criteria are automatically flagged.
Figure 11.

Processing Pipeline for Quantitative Short Echo Proton MRS.
PERFUSION MR OF THE DEVELOPING BRAIN
There are three major classes of MR techniques that can measure perfusion in the brain. The first class is based upon the use of intravascular contrast agents, which can change the magnetic susceptibility of blood causing a change in MR signal. The second class of techniques is arterial spin labeling (ASL), in which arterial blood is tagged magnetically before it enters the brain tissue being measured and then the amount delivered to the tissue is measured.43–51 The third class is based on the blood oxygenation level dependent (BOLD) effect, in which changes in blood oxygenation results in change in the MR signal. Each technique is sensitive to specific perfusion states of tissue with the contrast method proving the best measurement of cerebral blood volume, the ASL technique provides the best measurement of CBF and the BOLD technique the most sensitive to the change in local oxygenation fraction.
Dynamic Contrast Perfusion MR
In dynamic contrast MR perfusion techniques, gadolinium, a paramagnetic substance which does not cross the normally intact blood brain barrier, is injected intravenously with a power injector or by hand. Gradient echo or spin-echo echo-planar technique methods are used to obtain T2* or susceptibility weighted MR images. As the contrast passes through the brain tissue, a magnetic field difference is created between the blood vessel filled with contrast and the surrounding brain tissue. A decrease in signal intensity is observed proportionally, in first order, to the blood volume, as gadolinium passes through the region of perfusion. The signal change during the first transit of the contrast through the tissue is measured relative to a set of pre-contrast baseline scans. The perfusion imaging dataset includes multiple sequentially acquired measurement of signal intensity over time. This signal intensity/time activity curve is then used to calculate relative cerebral blood volume, relative cerebral blood flow and mean transit time (Figure 12).
Figure 12.

Dynamic contrast susceptibility perfusion MR imaging in the neonatal brain showing a focal left ACA (anterior communicating artery) infarct in the acute phase. There is increased cerebral blood flow within the lesion.
Arterial Spin Labeling
Arterial spin labeling allows for quantitative cerebral perfusion imaging without the use of exogenous contrast agents. The two major types of arterial spin labeling are pulsed ASL (PASL) and continuous ASL (CASL).46–50 The PASL sequence is obtained by transmitting a 180-degree radiofrequency pulse during a very short period of time to a large tagging slab proximal to the area of interest. This pulse results in “labeling” of the water protons of the arterial blood by inverting their magnetization. As the blood flows into the arterioles and the capillaries, the magnetization of the water molecules results in change of total magnetization within the tissue. A fast echo planar technique is then used to image the region being perfused by the blood after a certain time delay. The same sequence is then repeated without labeling the arterial water protons and the two images are subtracted to generate a quantitative flow map. A quantitative perfusion map is calculated by mathematical formulas which take into account the difference in magnetization/signal intensity between the labeling image and the unlabelling images and relate it to regional cerebral blood flow. A continuous arterial spin labeling CASL sequence uses the same type of sequences except that the blood is contiguously tagged for a longer period of time on a thinner slab of tissue which is farther away from the imaging sliced compared to the PASL technique. Recently, ASL has been performed with a 3T magnet in neonates for evaluation of regional cerebral perfusion.52 This study found that perfusion in the basal ganglia (30–39 mL/100g/min) was higher than in cortical grey matter (16–19 mL/100g/min) and white matter (10–15 mL/100g/min) in healthy neonates. Another recent application is the use of multi-phase ASL imaging which allows for different time to inversion to be acquired at multiple time points, and allows for visualization of dynamic physiologic information (Figure 13). The quantification of CBF by means of ASL is based on a complex formula which includes the mean difference in the signal intensity between labeled and control images, the equilibrium magnetization of blood, the tagging efficiency of the blood, the longitudinal relaxation time of blood and brain tissue.53 Because these values can be variable in the newborn brain, ASL in the neonate can be technically challenging.
Figure 13.

Multiphase pulsed ASL in neonatal stroke. The mean diffusivity map (ADC map) on the left shows an acute right MCA infarct. The PASL study done at the same time shows a perfusion deficit in the areas of infarct during the very early phase. During the later phases, there is relatively increased perfusion in the areas of infarct which may be related to leptomeningeal collaterals and/or delayed re-perfusion.
BOLD Imaging and NIRS
BOLD imaging is based on the effect that deoxyhemoglobin (rHb) has on the local magnetic homogeneity. Deoxygemglobin is paramagnetic and therefore has a significant influence on the magnetic field, which reduces the local homogeneity. When oxyhemoglobin (oHb) and rHb are present in the voxel, their ratio determines the effective measureable signal.54 The BOLD fMR technique acquires two image sequences: a rest image and an activation image. These images are then compared, and where the oHb/rHb ratio changes between the rest and activation images the activation has had an effect on the homogeneity. This change in homogeneity is measurable with T2* sequences; these are commonly gradient echo planar imaging sequences. It is important to note the limitations of BOLD: neuron activation is associated with an increase in local blood flow and the increased blood flow can result in a different spatial or temporal location than the neuronal activation. This makes precise BOLD localization and timing between regions of the brain difficult.
Investigators have used near infrared spectroscopy (NIRS) to complement the BOLD technique. NIRS uses 750–1000 nm wavelength light, which is able to penetrate several mm into the body, and is attenuated by rHb and oHb such that measurements of rHb and oHb are possible.55,56 NIRS measurements can provide picosecond temporal resolution and direct measurement of oHb.57 NIRS is limited by low spatial resolution with poorly defined crescent-shaped sample region, penetration depth, and sparse spatial sampling.56,57 Despite this NIRS may provide unique and useful information when used in specific situations, including the simultaneous acquisition of NIRS and BOLD fMR (Figure 14).
Figure 14.

Signals indicate responses as measured by NIRS and BOLD fMR when an adult subject was exposed to decreased fiO2. This experiment had two exposures, starting at time one minute and time three minutes. Optodes from a NIRO 200 were placed on the head at approximately the level shown at right, the ROI indicated was used to generate the curve for BOLD signal shown below at left. Note that the temporal calibration and the durations of exposure are approximate.
When using either method in assessing neonates, it is important to note that BOLD is dependent on neurovascular coupling and cerebral vascular dynamics. These both vary with normal development and pathology58, and hence so will the BOLD signal. Similarly, NIRS signal is affected by the same neurovascular coupling and cerebral vascular dynamics effects. In addition, NIRS is affected by the scattering of light when transmitting through the body. This scattering increases with developmental age, and likely varies with pathology.59 A major contributor to scattering is the presence of myelin59, which is also developmentally regulated.
VOLUMETRIC AND SEGMENTATION TECHNQUES IN EVALUATION OF BRAIN DEVELOPMENT
MR imaging of the neonatal brain delineates grey matter from white matter and myelinated tissue from unmyelinated tissue. Initially, volumetric assessments of brain development were obtained by manual outlining of structures. Recently, segmentation techniques have emerged as a more efficient way of determining whole brain volumes into different tissue types. Segmentation is defined as sub-parcellating different areas of the brain based on different signal intensities using multiple sequences. Huppi et al. evaluated normal brain development between 29 and 41 weeks of gestation using three-dimensional volumetric segmentation techniques in 78 healthy premature and term infants. This study showed dramatic increase in cortical grey matter volumes between 30 and 40 weeks, likely related to neuronal differentiation.60 There was also an increase in myelinated white matter after 36 weeks gestation which is consistent with the histological sequence of myelination.61
Surface based approaches have also been recently applied to the study of normal brain development with particular attention to cortical folding patterns. Dubois et al. used advanced post processing techniques to study the development of cortical folding in the preterm brain, specifically focusing on the interface between the inner surface of the cerebral cortex and the underlying white matter (Figure 15).62 The surface based approach developed by Dubois can be used to study environmental effects on the cortical folding process in the premature newborn. Other techniques used in evaluating neonatal brain development include deformation-based morphometry and voxel based morphometry. Deformation-based morphometry has been used by Boardman et al. to identify volumetric reductions in the thalamus and basal ganglia in preterm infant with diffuse non-cystic white matter injury. DBM is advantageous over VBM for two main reasons.63 Firstly, VBM relies on tissue classification which is extremely difficult in the largely unmyelinated newborn brain. Moreover, there are no published VBM protocols to classify neonatal cerebral tissue. Secondly, there is significant variation in shape and size of neonatal brains which is more appropriate for a high-dimensional registration procedure which is performed by DBM. This is in comparison with VBM techniques which rely on affine or very coarse deformation-based spatial normalization. Of note, voxel-based analysis of diffusion tensor data has been performed in premature infants with no brain injury. This study showed higher levels of anisotropy in the cerebral white matter suggesting accelerated white matter development.64
Figure 15.

Volumetric and surface identification at birth for a newborn of 31 weeks gestation. Using T2 and T1 weighted images (A and B), post-processing enabled the classification of cerebral tissues for volumetric measurements (C) [green=cortex, red=unmyelinated white matter, orange=myelinated white matter, maroon=basal ganglia/thalami, yellow=cerebrospinal fluid] and the segmentation of the interface between cortex and white matter for surface measurements (D); Based on this segmentation, the inner cortical surface was reconstructed in 3D [(E) the surface curvature is colour-coded] and the cortical sulci were identified according to negative curvatures [(F) sulci are in purple], which enable the computation of the sulcation index. Reprinted with permission. (From Dubois J, Benders M, Borradori-Tolsa C, et al, “Primary cortical folding in the human newborn: an early marker of later functional development” in Brain, 2008 Vol. 131(8) page 2031. Reprinted by permission of publisher, Oxford University Press)
INTEGRATION OF ADVANCED MR IMAGING TECHNIQUES IN THE EVALUATION OF PERINATAL BRAIN INJURY
Although the application of advanced MR imaging techniques in the evaluation of perinatal brain injury is covered elsewhere in this edition, in the following sections we provide some examples of how these advanced neuroimaging techniques can be integrated in clinical practice.
Neonatal hypoxic-ischemic injury
In neonates who have suffered hypoxic-ischemic injury, diffusion weighted imaging ideally should be performed 2–4 days after insult to most optimally demonstrate the pattern of injury. There are two major patterns of injury, which may be described in neonates who have profound hypotensive injury or cardiac arrest. There patterns are (1) intervascular boundary zones or watershed injury (peripheral pattern); (2) basal ganglia pattern of injury (central) pattern.65–67 The central or basal ganglia pattern of injury can also involve the ventral lateral thalami, the cortical spinal tract, the peri-rolandic cortex and the brainstem tegmentum. The watershed injury peripheral pattern can be variable with respect to amount of cortex involved (Figure 16). Diffusion tensor imaging may also be used to evaluate acute hypoxic-ischemic injury. Barkovich et al. found that although conventional MR anatomic images were nearly normal on the first 2 days after birth, in most patients abnormalities were detected on DTI (both visually and by quantitative interrogation of diffusion maps).66 The mean diffusivity tended to worsen until about day 5 and then normalize. Barkovich et al., upon performing serial MR examinations on neonates with hypoxic-ischemic injury, found that as areas of abnormal diffusivity pseudonormalized within one region of the brain, they would develop in other areas. Therefore, the pattern of injury looked very different when imaging was performed at different times during this evolution (Figure 16). Thus, diffusion imaging performed early during the acute phase of injury may under estimate the overall regional pattern and extent of injury to the neonatal brain.10 Therefore, follow-up MRI is important in this group of infants.
Figure 16.

MRS and DTI in hypoxic-ischemic encephalopathy. Single-voxel MRS at three different echo times in the basal ganglia (right). Note the characteristic modulation of lactate. The top left figure is a spectrum acquired using short echo time (35ms) which shows a myoinositol peak (left side of the spectrum), elevated glutamine/glutamine peak next to a reduced NAA peak (middle spectrum), and a elevated lactate doublet next to a lipid peak (right side of the spectrum). The middle left figure is a spectrum acquired using long echo time (144ms) which show a lactate doublet peak inverted and reduced NAA, but non visualization of myo-inositol, glutamate and lipids. The middle figure is a spectrum acquired using longer echo time (244 ms) which is similar to 144 ms, except that the lactate doublet reverts to the other side of the spectrum. The mean diffusivity maps on the left show evolution of the “peripheral” pattern of neonatal hypoxic-ischemic brain injury. The top right image shows reduced mean diffusivity in the cortex, ventral lateral thalamus and caudate head two days after injury. The middle right image shows pseudo-normalization of the ADC signal in these regions seven days after injury in the same patients. The spin echo T1 imaging at 7 days (bottom right) shows the extent of cortical injury.
In neonates with hypoxic-ischemic injury, acute injury can be detected by MRS when both diffusion imaging and conventional imaging is negative.68–79 Within the first 24 hours of injury, MRS can detect elevated lactate in the cerebral cortex or basal ganglia depending on the pattern of injury. Reduced NAA and elevated glutamate/glutamine is usually detected after 24 hours. NAA and lactate can be detected using either short echo (35ms) or long echo time (144 or 288 ms) (Figure 16). Myo-inositol, glutamate/glutamine, and lipids can only be detected during short echo technique. There are few studies of perfusion MR imaging of hypoxic-ischemic injury in the neonatal population. One study of cerebral perfusion in the neonate using dynamic susceptibility contrast enhanced MR imaging demonstrated that maps of relative cerebral blood flow can be acquired in neonates, especially in more mature neonates.51 Values of relative CBF were greater in grey matter structures compared to white matter structures, which has also been our experience. This study also demonstrated that perfusion abnormalities detected early may result in structural abnormalities detected later with conventional MR. We have found that depending on the timing of perfusion imaging performed relative to the acute hypoxic injury, there may be relatively increased flow seen in the region of acute infarction, which may be related to luxury perfusion or increased metabolism.
The third pattern of infarction in the neonate is the focal type. Neonatal focal infarcts typically occur within 2–3 days from birth, usually presenting with seizures. Most of these infarcts are idiopathic in etiology with a small subset of them related to coagulopathies. Diffusion imaging is the most ideal imaging techniques to demonstrate the acuity of the infarct which is reflected by low ADC or mean diffusivity. The diffusion signal will usually normalize within one week. MR spectroscopy may be used to quantitatively assess the amount of damage to the tissue. Diffusion tensor imaging may also detect associated white matter tract abnormalities, including the corpus callosal fibers and also acute wallerian degeneration of the cortical spinal tract.
Perinatal white matter injury
Advances in neonatal intensive care have resulted in a decrease in the incidence of the focal cystic cavitary form of perinatal white matter injury [periventricular leukomalacia (PVL)].80–88 However, recent studies have demonstrated that the incidence of the diffuse form of perinatal white matter injury in the neonate has actually increased resulting in more cognitive and behavioral deficits compared to the PVL-associated classic forms of cerebral palsy.80–86,89,90 The pathogenesis of both the focal and diffuse forms of perinatal white matter injury is currently thought to be related to interactions between maternal/fetal infection, cytokines and hypoxia-ischemia resulting in the generation of reactive oxygen species and ultimately, apoptotic oligodendrocyte cell death.91–99 There are three major patterns of white matter abnormality which more commonly occur in the premature infant (although these patterns can be seen in term infants, too). These patterns include (a) immature white matter development, (b) focal injury and (c) diffuse injury. All three of these patterns can be diagnosed with conventional MR imaging techniques with diffusion and MR spectroscopic techniques as useful adjunctive tools with respect to timing of the injury and more detailed metabolic/physiologic information about the degree of integrity of the damaged periventricular white matter.
Focal white matter injury (focal white matter necrosis) in the neonate is manifested on T1 weighted imaging as focal T1 hyperintense lesions in the periventricular white matter, deep white matter, the centrum semiovale and the optic radiations (Figure 17). The lesions can be distinguished from blood by use of T2 weighted imaging. Usually, hemorrhage will demonstrate very low T2 signal, while focal white matter necrosis tend to demonstrate intermediate T2 signal. We have found that diffusion weighted and tensor imaging is also useful for determining the acuity of focal periventricular white matter lesions, with the focal white matter necrosis demonstrating restricted diffusion and corresponding low ADC (diffusion weighted) or mean diffusivity (diffusion tensor). These lesions are typically not visualized on cranial ultrasound.98,99 Contrary to focal PVL, the acute diffuse form of perinatal white matter injury is difficult to diagnose with conventional MR imaging. Therefore, at some centers, including our institution, all neonates imaged undergo both diffusion weighted imaging with ADC mapping and diffusion tensor imaging with mean diffusivity and fractional anisotropy mapping. The acute component of the diffuse form of perinatal white matter injury may be reflected by decreased ADC and mean diffusivity, although there are very few studies that support this. The diffuse component of perinatal white matter injury is reflected chronically by ventriclomegaly and increased sulcal size reflecting both white matter hypoplasia and diffuse grey matter volume loss. The chronic diffuse component of white matter injury can also be detected by diffusion imaging with abnormally elevated ADC/ mean diffusivity values ranging from 1.4 to 1.6 × 10⁻³ mm/s in the periventricular and deep white matter at term equivalent age.100,101 The role of MRS in evaluating perinatal white matter injury is similar in the acute phase of injury, lactate is elevated, NAA is reduced and glutamate/glutamate is elevated (Figure 17). Knowledge of the normal developmental changes in MRS metabolites across development is useful when interpreting pathologic cases.68–79,103–107
Figure 17.
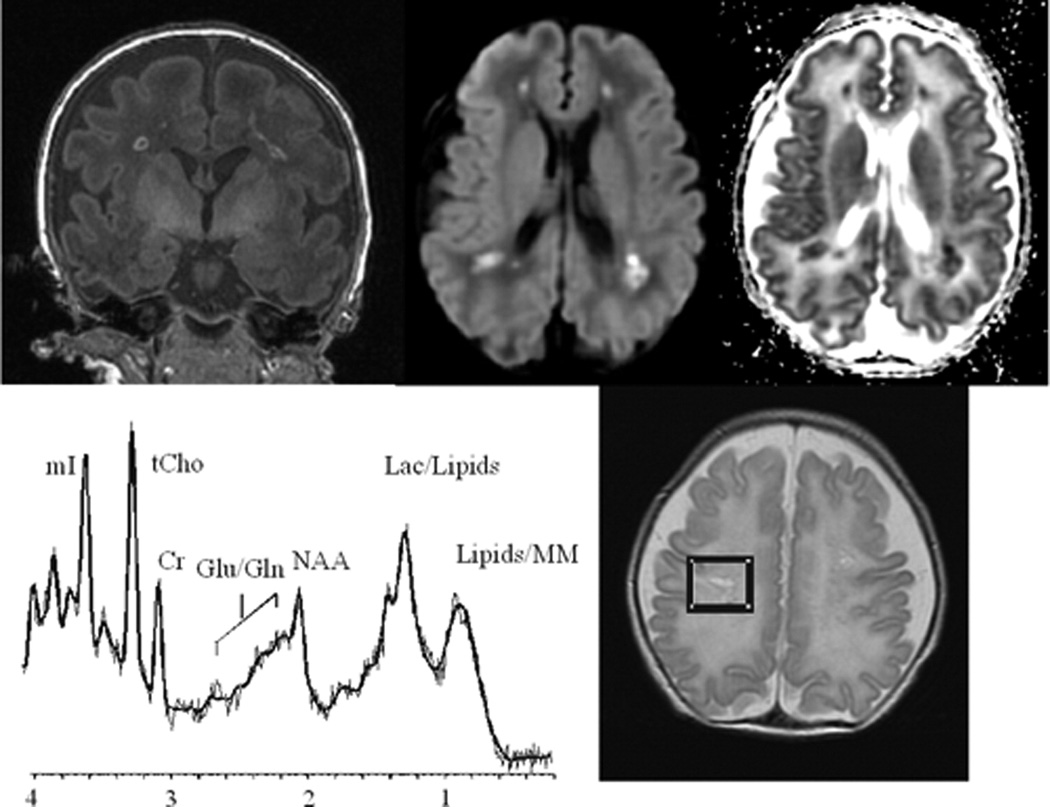
MR spectroscopy and DTI of perinatal white matter injury. The coronal T1 SPGR (left) shows multiple T1 non-cystic hyperintense lesion which correlate with areas of coagulation necrosis. The middle top and right images show abnormal diffusion signal with decreased mean diffusivity (ADC) within the lesion. The MRS short echo of the focal necrosis show reduced NAA and elevated lactate and lipids.
While most white matter injury in the perinatal period is seen in premature babies, white matter injury may also be seen in term babies, particularly those with hypoplastic left heart syndrome and other forms of congenital heart disease. Of note, we have found a large incidence of focal white matter necrosis in MR studies of both preterm and term infants with congenital heart disease. In all infants dying after cardiac surgery, irrespective of the modality, cerebral white matter damage [periventricular leukomalacia (PVL) or diffuse white matter gliosis] was the most significant lesion in terms of severity and incidence, followed by a spectrum of grey matter lesions. The PASL technique was used to quantify preoperative CBF in 25 infants with congenital heart disease.46 The mean CBF value for the cohort was 19.7 +/− 9.1ml/100 g/min. This value was less compared to a study, which calculated CBF in term infant using xenon-133 clearance methodology in which the CBF was calculated to be 50 +/− 3.4 ml/100g/min in “normal” cases. In the congenital heart disease study, PVL occurred in 28% of the cases (7/25) and was associated with decreased baseline CBF values.108
CONCLUSION
Advanced MR imaging techniques including quantitative proton MR spectroscopy and diffusion tensor imaging combined with new technological advances including the MR compatible incubator and neonatal head coil can improve the neuroimaging assessment of both brain development and brain injury. Other techniques like functional and perfusion MR can provide novel physiologic information related to perinatal brain injury. In the future, these advances in MR technique may not only provide improved diagnostic and prognostic information, but may also provide novel information about the mechanism of injury. It should be noted that each new technique does bring new questions and methodological issues related to understanding “normal brain development” and the correlation with brain injury. Serial imaging of selectively chosen clinical groups of neonates with different types of brain injury, combined with long term neurodevelopmental outcome, will be needed to help validate the clinical significance of these advanced MR imaging techniques. In the future, the use of longitudinal imaging studies in which a preterm or term neonate is followed through childhood with multiple serial quantitative imaging studies may yield the useful information regarding brain plasticity and mechanisms of perinatal brain injury.
Figure 8.

Sample spectra and MR images of the developing grey and white matter in the first year of life using short echo proton MR spectroscopy. There is an increase in NAA with a decrease in choline noted during the same period.
Acknowledgments
The authors thank Hari Keshava and Arabhi Nagasunder (quantitative diffusion tensor measurements); Marvin D. Nelson M.D., Istvan Seri M.D., Floyd Gilles M.D. for support and advice; the NICU and MRI staff at Childrens Hospital Los Angeles. The authors thank Julia Castro for editorial support. Grant support: NIH NS063371-01A1; Radiological Society of North American and Rudi Schulte Research Institute and NIH pediatric research loan repayment grant.
Footnotes
Publisher's Disclaimer: This is a PDF file of an unedited manuscript that has been accepted for publication. As a service to our customers we are providing this early version of the manuscript. The manuscript will undergo copyediting, typesetting, and review of the resulting proof before it is published in its final citable form. Please note that during the production process errors may be discovered which could affect the content, and all legal disclaimers that apply to the journal pertain.
REFERENCES
- 1.Ferriero DM. Neonatal brain injury. N Engl J Med. 2004;351:1985–1995. doi: 10.1056/NEJMra041996. [DOI] [PubMed] [Google Scholar]
- 2.Bluml S, Friedlich P, Erberich S, et al. MR imaging of newborns by using an MR-compatible incubator with integrated radiofrequency coils: initial experience. Radiology. 2004;231:594–601. doi: 10.1148/radiol.2312030166. [DOI] [PubMed] [Google Scholar]
- 3.Dumoulin CL, Rohling KW, Piel JE, et al. Magnetic resonance imaging compatible neonate incubator. Concepts Magn Reson. 2002;15:117–128. [Google Scholar]
- 4.Mathur AM, Neil JL, McKinstry RC, et al. Transport, monitoring, and successful MR imaging in unsedated neonates. Pediatr Rad. 2008;38:260–264. doi: 10.1007/s00247-007-0705-9. [DOI] [PubMed] [Google Scholar]
- 5.Forbes KPN, Pipe JG, Bird CR, et al. PROPELLER MRI: clinical testing of a novel technique for quantification and compensation of head motion. J Magn Reson Imaging. 2001;14:215–222. doi: 10.1002/jmri.1176. [DOI] [PubMed] [Google Scholar]
- 6.Rutherford M, Malamateniou C, Zeka J, et al. MR imaging of the neonatal brain at 3 Tesla. 2004;8:281–289. doi: 10.1016/j.ejpn.2004.08.003. [DOI] [PubMed] [Google Scholar]
- 7.Gilmore JH, Zhai G, Wilber K, et al. 3 Tesla magnetic resonance imaging of the brain in newborns. 2004;132:81–85. doi: 10.1016/j.pscychresns.2004.04.004. [DOI] [PubMed] [Google Scholar]
- 8.Srinivasan L, Dutta R, Counsell SJ, et al. Quantification of deep gray matter in preterm infants at Term-Equivalent age using manual volumetry of 3-Tesla magnetic resonance images. 2007;119:759–765. doi: 10.1542/peds.2006-2508. [DOI] [PubMed] [Google Scholar]
- 9.Beaulieu C. The basis of anisotropic water diffusion in the nervous system-a technical review. NMR Biomed. 2002;15:435–455. doi: 10.1002/nbm.782. [DOI] [PubMed] [Google Scholar]
- 10.Le Bihan D, Mangin JF, Poupon C, et al. Diffusion tensor imaging: concepts and applications. J Magn Reson Imaging. 2001;13:534–546. doi: 10.1002/jmri.1076. [DOI] [PubMed] [Google Scholar]
- 11.Conturo TE, McKinstry RC, Akbudah E, et al. Encoding of anisotropic diffusion with tetrahedral gradients: a general mathematical diffusion formalism and experimental results. Magn Reson Med. 1996;35:399–412. doi: 10.1002/mrm.1910350319. [DOI] [PubMed] [Google Scholar]
- 12.Basser PJ, Jones DK. Diffusion-tensor MRI: theory, experimental design and data analysis-a technical review. NMR Biomed. 2002;15:456–467. doi: 10.1002/nbm.783. [DOI] [PubMed] [Google Scholar]
- 13.Wimberger DM, Roberts TP, Barkovich AJ, et al. Identification of “premyelination” by diffusion-weighted MRI. J Comput Assist Tomogr. 1995;19:23–33. doi: 10.1097/00004728-199501000-00005. [DOI] [PubMed] [Google Scholar]
- 14.Prayer D, Barkovich AJ, Kirschner DA, et al. Visualization of nonstructural changes in early white matter development on diffusion-premyelination anisotropy. AJNR Am J Neuroradiol. 2001;22:1572–1576. [PMC free article] [PubMed] [Google Scholar]
- 15.Shimony JS, McKinstry RC, Akbudak E, et al. Quantitative diffusion-tensor anisotropy imaging: normative human data and anatomic analysis. Radiology. 1999;12:770–784. doi: 10.1148/radiology.212.3.r99au51770. [DOI] [PubMed] [Google Scholar]
- 16.Neil JJ, Shiran SI, McKinstry RC, et al. Normal brain in human newborns: apparent diffusion coefficient and diffusion anisotropy measured by using diffusion tensor MR imaging. Radiology. 1998;209:57–66. doi: 10.1148/radiology.209.1.9769812. [DOI] [PubMed] [Google Scholar]
- 17.Partridge SC, Mukherjee P, Hentry RG, et al. Diffusion tensor imaging: serial quantitation of white matter tract maturity in premature newborns. Neuroimage. 2004;22:1302–1314. doi: 10.1016/j.neuroimage.2004.02.038. [DOI] [PubMed] [Google Scholar]
- 18.Mukherjee P, Miller JH, Shimony JS, et al. Normal brain maturation during childhood: developmental trends characterized with diffusion-tensor MR imaging. Radiology. 2001;221:349–358. doi: 10.1148/radiol.2212001702. [DOI] [PubMed] [Google Scholar]
- 19.Mukherjee P, Miller JH, Shimony JS, et al. Diffusion-tensor MR imaging of gray and white matter development during normal human brain maturation. AJNR Am J Neuroradiol. 2002;23:1445–1456. [PMC free article] [PubMed] [Google Scholar]
- 20.Miller JH, Mckinstry RC, Philip JC, et al. Diffusion-tensor MR imaging of normal brain maturation: a guide to structural development and myelination. AJR Am J Roentgenol. 2003;180:851–859. doi: 10.2214/ajr.180.3.1800851. [DOI] [PubMed] [Google Scholar]
- 21.Mukherjee P, Mckinstry RC. Diffusion tensor imaging and tractography of human brain development. In: Castillo M, Mukherji SK, editors. Neuroimaging Clinics of North America. Number 1. Volume 16. Philadelphia, PA: WB Sauders; 2006. pp. 19–43. [DOI] [PubMed] [Google Scholar]
- 22.Pajevic S, Pierpaoli C. Color schemes to represent the orientation of anisotrpic tissues from diffusion tensor data: application to white matter fiber tract mapping in the human brain. Magn Reson Med. 1999;42:526–540. [PubMed] [Google Scholar]
- 23.Conturo TE, Lri NF, Cull TS, et al. Tracking neuronal fiber pathways in the living human brain. Proc Natl Acad Sci U S A. 1999;96:10422–10427. doi: 10.1073/pnas.96.18.10422. [DOI] [PMC free article] [PubMed] [Google Scholar]
- 24.Mori S, Crain BJ, Chacko VP, et al. Three-dimensional tracking of axonal projections in the brain by magnetic resonance imaging. Ann Neurol. 1999;45:265–269. doi: 10.1002/1531-8249(199902)45:2<265::aid-ana21>3.0.co;2-3. [DOI] [PubMed] [Google Scholar]
- 25.Basser PJ, Pajevic S, Pierpaoli C, et al. In vivo fiber tractography using DT-MRI data. Magn Reson Med. 2000;44:625–632. doi: 10.1002/1522-2594(200010)44:4<625::aid-mrm17>3.0.co;2-o. [DOI] [PubMed] [Google Scholar]
- 26.Huppi PS, Maier SE, Peled S, et al. Microstructural development of human newborn cerebral white matter assessed in vivo by diffusion tensor magnetic resonance imaging. Pediatr Res. 1998;44:584–590. doi: 10.1203/00006450-199810000-00019. [DOI] [PubMed] [Google Scholar]
- 27.Barkovich AJ. Pediatric Neuroimaging. ed 4th. Philadelphia, PA: Lippincott; 2005. [Google Scholar]
- 28.Yakovlev PI, Loecours AR. The myelogenic cycles of regional maturation of the brain. In: Minkowski A, editor. Regional Development of the Brain in Early Life. Oxford, UK: Blackwell; 1967. pp. 3–70. [Google Scholar]
- 29.Richardson EP., Jr . Myelination in the human central nervous system. In: Haymaker W, Adams RD, editors. Histology and Histopathology of the Nervous System. Springfield, IL: Charles C Thomas Publishers; 1982. pp. 146–173. [Google Scholar]
- 30.Kinney HC, Brody BA, Kloman AS, et al. Sequence of central nervous system myelination in human infancy. II. Patterns of myelination in autopsied infants. J Neuropathol Exp Neurol. 1988;47:217–234. doi: 10.1097/00005072-198805000-00003. [DOI] [PubMed] [Google Scholar]
- 31.Evans AC for the Brain Development Cooperative Group. The NIH MRI Study of Normal Brain Development. Neuroimage. 2006;30:184–202. doi: 10.1016/j.neuroimage.2005.09.068. [DOI] [PubMed] [Google Scholar]
- 32.McKinstry RC Brain Development Cooperative Group. The NIH MRI Study of Normal Brain Development; Proceedings of the Thirteenth Annual Meeting of the International Society for Magnetic Resonance in Medicine; Miami FL: International Society for Magnetic Resonance in Medicine; 2005. [Google Scholar]
- 33.Cheong JL, Thompson DK, Wang HX, et al. Abnormal white matter signal on MR imaging is related to abnormal tissue microstructure. AJNR Am J Neuroradiol. 2009;30:623–628. doi: 10.3174/ajnr.A1399. [DOI] [PMC free article] [PubMed] [Google Scholar]
- 34.Mukherjee P, Berman JI, Chung SW, et al. Diffusion tensor MR imaging and fiber tractography: theoretical underpinnings. AJNR Am J Neuroradiol. 2008;29:632–641. doi: 10.3174/ajnr.A1051. [DOI] [PMC free article] [PubMed] [Google Scholar]
- 35.Mukherjee P, Chung SW, Berman JI, et al. Diffusion tensor MR imaging and fiber tractography: technical considerations AJNR. Am J Neuroradiol. 2008;29:843–852. doi: 10.3174/ajnr.A1052. [DOI] [PMC free article] [PubMed] [Google Scholar]
- 36.Lien YH, Shapiro JI, Chan L. Effects of hypernatremia on organic brain osmoles. J Clin Invest. 1990;85:1427–1435. doi: 10.1172/JCI114587. [DOI] [PMC free article] [PubMed] [Google Scholar]
- 37.Videen JS. Human cerebral osmolytes during chronic hyponatremia. A proton magnetic resonance spectroscopy study. J Clin Invest. 1995;95:788–793. doi: 10.1172/JCI117728. [see comments.]. [DOI] [PMC free article] [PubMed] [Google Scholar]
- 38.Provencher SW. Estimation of metabolite concentrations from localized in vivo proton NMR spectra. Magn Reson Med. 1993;30:672–679. doi: 10.1002/mrm.1910300604. [DOI] [PubMed] [Google Scholar]
- 39.Erecinska M, Silver IA. Metabolism and role of glutamate in mammalian brain. Prog Neurobiol. 1990;35:245–296. doi: 10.1016/0301-0082(90)90013-7. [DOI] [PubMed] [Google Scholar]
- 40.Daikhin Y, Yudkoff M. Compartmentation of brain glutamate metabolism in neurons and glia. J Nutr. 2000;130 4S Suppl:1026S–1031S. doi: 10.1093/jn/130.4.1026S. [DOI] [PubMed] [Google Scholar]
- 41.Kreis R. Metabolic disorders of the brain in chronic hepatic encephalopathy detected with H-1 MR spectroscopy. Radiology. 1992;182:19–27. doi: 10.1148/radiology.182.1.1345760. [see comments]. [DOI] [PubMed] [Google Scholar]
- 42.Seymour KJ, Bluml S, Sutherling J, et al. Identification of cerebral acetone by 1H-MRS in patients with epilepsy controlled by ketogenic diet. Magma. 1999;8:33–42. doi: 10.1007/BF02590633. [DOI] [PubMed] [Google Scholar]
- 43.Ball WS, Jr, Holland SK. Perfusion imaging in the pediatric patient. Magn Reson Imaging Clin N Am. 2001;9:207–230. [PubMed] [Google Scholar]
- 44.Huisman TA, Sorensen AG. Perfusion-weighted magnetic resonance imaging of the brain: techniques and application in children. Eur Radiol. 2004;14:59–72. doi: 10.1007/s00330-003-1972-y. [DOI] [PubMed] [Google Scholar]
- 45.Ostergaard L, Weisskoff RM, Chelser DA, et al. High-resolution measurement of cerebral blood flow using intravascular tracer bolus passages. Part I: Mathematical approach and statistical analysis. Magn Reson Med. 1996;36(5):715–725. doi: 10.1002/mrm.1910360510. [DOI] [PubMed] [Google Scholar]
- 46.Detre JA, Aslop DC. Perfusion fMRI with arterial spin labeling based perfusion imaging techniques for MRI. In: Moonen CTW, Bandetti PA, editors. Functional MRI. Heidelberg, Germany: Springer-Verlag; 1999. pp. 47–62. [Google Scholar]
- 47.Detre JA, Leigh JS, Williams DS, et al. Perfusion imaging. Magn Reson Med. 1992;23:37–45. doi: 10.1002/mrm.1910230106. [DOI] [PubMed] [Google Scholar]
- 48.Calamante F, Thomas Dl, Pell GS, et al. Measuring cerebral blood flow using magnetic resonance imaging techniques. J Cereb Blood Flow Metab. 1999;19:701–735. doi: 10.1097/00004647-199907000-00001. [DOI] [PubMed] [Google Scholar]
- 49.Wong EC, Buxton RB, Frank LR. Quantitative imaging of perfusion using a single subtraction (QUIPSS and QUIPSS II) Magn Reson Med. 1998;39:702–708. doi: 10.1002/mrm.1910390506. [DOI] [PubMed] [Google Scholar]
- 50.Buxton RB, Frank LR, Wong EC, et al. A general kinetic model for quantitative perfusion imaging with arterial spin labeling. Magn Reson Med. 1998;40:383–396. doi: 10.1002/mrm.1910400308. [DOI] [PubMed] [Google Scholar]
- 51.Tanner SF, Cornette L, Ramenghi LA, et al. Cerebral perfusion in infants and neonates: preliminary results obtained using dynamic susceptibility contrast enhanced magnetic resonance imaging. Arch Dis Child Fetal Neonatal Ed. 2003;88:F525–F530. doi: 10.1136/fn.88.6.F525. [DOI] [PMC free article] [PubMed] [Google Scholar]
- 52.Miranda MJ, Olofsson K, Sidaros K. Noninvasive measurements of regional cerebral perfusion in preterm and term neonates by magnetic resonance arterial spin labeling. Pediatr Res. 2006;60:359–363. doi: 10.1203/01.pdr.0000232785.00965.b3. [DOI] [PubMed] [Google Scholar]
- 53.Deibler AR, Pollock JM, Kraft RA, et al. Arterial spin-labeling in routine clinical practice, part 1: technique and artifacts. AJNR Am J Neuroradiol. 2008;29:1228–1223. doi: 10.3174/ajnr.A1030. [DOI] [PMC free article] [PubMed] [Google Scholar]
- 54.Ogawa S, Lee TM, Kay AR, et al. Brain magnetic resonance imaging with contrast dependent on blood oxygenation. Proc Natl Acad Sci U S A. 1990;87:9868–9872. doi: 10.1073/pnas.87.24.9868. [DOI] [PMC free article] [PubMed] [Google Scholar]
- 55.Rolfe P. In vivo near-infrared spectroscopy. Annu Rev Biomed Eng. 2000;2:715–754. doi: 10.1146/annurev.bioeng.2.1.715. [DOI] [PubMed] [Google Scholar]
- 56.Cui W, Kumar C, Chance B. Experimental study of migration depth for the photons measured at sample surface; Proceedings of time-resolved spectroscopy and imaging of tissues; SPIE; 1991. pp. 180–191. [Google Scholar]
- 57.Hoshi Y. Functional near-infrared optical imaging: utility and limitations in human brain mapping. Psychophysiology. 2003;40:511–520. doi: 10.1111/1469-8986.00053. [DOI] [PubMed] [Google Scholar]
- 58.D'Esposito M, Deouell LY, Gazzaley A. Alterations in the BOLD fMRI signal with ageing and disease: a challenge for neuroimaging. Nat Rev Neurosci. 2003;4:863–872. doi: 10.1038/nrn1246. [DOI] [PubMed] [Google Scholar]
- 59.Duncan A, Meek JH, Clemence M, et al. Measurement of cranial optical path length as a function of age using phase resolved near infrared spectroscopy. Pediatr Res. 1996;37:889–894. doi: 10.1203/00006450-199605000-00025. [DOI] [PubMed] [Google Scholar]
- 60.Huppi PS. MR imaging and spectroscopy of brain development. Magn Reson Imaging Clin N Am. 2001;9:1–17. [PubMed] [Google Scholar]
- 61.Kinney HC, Brody BA, Kloman AS, et al. Sequence of central nervous system myelination in human infancy. II. Patterns of myelination in autopsied infants. J Neurolpathol Exp Neurol. 1988;47:217–234. doi: 10.1097/00005072-198805000-00003. [DOI] [PubMed] [Google Scholar]
- 62.Dubois J, Benders M, Borradori-Tolsa C, et al. Primary cortical folding in the human newborn: an early marker of later functional development. Brain. 2008;131:2028–2041. doi: 10.1093/brain/awn137. [DOI] [PMC free article] [PubMed] [Google Scholar]
- 63.Boardman JP, Counsell SJ, Rueckert D, et al. Abnormal deep grey matter development following preterm birth detected using deformation-based morphometry. Neuroimage. 2006;32:70–78. doi: 10.1016/j.neuroimage.2006.03.029. [DOI] [PubMed] [Google Scholar]
- 64.Gimenez M, Miranda MJ, Born AP, et al. Accelerated cerebral white matter development in preterm infants: a voxel-based morphometry study with diffusion tensor MR imaging. Neuroimage. 2008;41:728–734. doi: 10.1016/j.neuroimage.2008.02.029. [DOI] [PubMed] [Google Scholar]
- 65.Barkovich AJ, Westmark KD, Bedi HS, et al. Proton spectroscopy and diffusion imaging on the first day of life after perinatal asphyxia: preliminary report. AJNR Am J Neuroradiol. 2001;22:1786–1794. [PMC free article] [PubMed] [Google Scholar]
- 66.Barkovich AJ, Miller SP, Bartha A, et al. MR imaging, MR spectroscopy, and diffusion tensor imaging of Sequential studies in neonates with encephalopathy. AJNR Am J Neuroradiol. 2006;27:533–547. [PMC free article] [PubMed] [Google Scholar]
- 67.Grant PE, Yu D. Acute injury to the immature brain with hypoxia with or without hypoperfusion. Radiol Clin N Am. 2006;44:63–77. doi: 10.1016/j.rcl.2005.08.001. [DOI] [PubMed] [Google Scholar]
- 68.Penrice J, Cady EB, Lorek A, et al. Proton magnetic resonance spectroscopy of the brain in normal and term infants and early changes after perinatal hypoxia-ischemia. Pediatr Res. 1996;40:6–14. doi: 10.1203/00006450-199607000-00002. [DOI] [PubMed] [Google Scholar]
- 69.Hanrahan JD, Sargentoni J, Azzopardi D, et al. Cerebral metabolism within 18 hours of birth asphyxia: a proton magnetic resonance spectroscopy study. Pediatr Res. 1996;39:584–590. doi: 10.1203/00006450-199604000-00004. [DOI] [PubMed] [Google Scholar]
- 70.Leth H, Toft PB, Peitersen B, et al. Use of brain lactate levels to predict outcome after perinatal asphyxia. Acta Paediatr. 1996;85:859–864. doi: 10.1111/j.1651-2227.1996.tb14168.x. [DOI] [PubMed] [Google Scholar]
- 71.Holshouser BA, Ashwal S, Luh GY, et al. Proton MR spectroscopy after acute central nervous system injury: outcome prediction in neonates, infants, and children. Radiology. 1997;202:487–496. doi: 10.1148/radiology.202.2.9015079. [DOI] [PubMed] [Google Scholar]
- 72.Groenendaal F, Veenhoven RH, van der Grond J, et al. Cerebral lactate and N-acetylaspertate/choline ratios in asphyxiated full term neonates demonstrated in-vivo using proton magnetic resonance spectroscopy. Pediatr Res. 1994;35:148–151. doi: 10.1203/00006450-199402000-00004. [DOI] [PubMed] [Google Scholar]
- 73.Huppi PS, Posse S, Lazeyras F, et al. Magnetic resonance in preterm and term newborns: H-1 spectroscopy in developing brain. Pediatr Res. 1991;30:574–578. doi: 10.1203/00006450-199112000-00017. [DOI] [PubMed] [Google Scholar]
- 74.Cheong JLY, Cady EB, Penrice J, et al. Proton MR spectroscopy in neonates with perinatal cerebral hypoxic-ischemic injury: metabolite peak-area ratios, relaxation times, and absolute concentrations. AJNR Am J Neuroradiol. 2006;27:1546–1554. [PMC free article] [PubMed] [Google Scholar]
- 75.Moorcraft J, Bolas NM, Ives NK, et al. Spatially localized magnetic resonance spectroscopy of the brains of normal and asphyxiated newborns. Pediatrics. 1991;87:273–282. [PubMed] [Google Scholar]
- 76.Peden CJ, Cowan FM, Bryant, et al. Proton MR spectroscopy of the brain in infants. J Comput Assist Tomogr. 1990;14:886–894. doi: 10.1097/00004728-199011000-00004. [DOI] [PubMed] [Google Scholar]
- 77.Barkovich AJ, Baranski K, Vigneron DB, et al. Proton MR spectroscopy for the evaluation of asphyxiated term neonates. AJNR Am J Neuroradiol. 1999;20:1399–1405. [PMC free article] [PubMed] [Google Scholar]
- 78.Vigneron DB, Barkovich AJ, Noworolski SM, et al. Three-dimensional proton MR spectroscopic imaging of premature and term neonates. AJNR Am J Neuroradiol. 2001;22:1424–1433. [PMC free article] [PubMed] [Google Scholar]
- 79.Kreis R, Hofmann L, Kuhlmann B, et al. Brain metabolite composition during early human brain development as measured by quantitative in vivo 1H magnetic resonance spectroscopy. Magn Reson Med. 2002;48:949–958. doi: 10.1002/mrm.10304. [DOI] [PubMed] [Google Scholar]
- 80.Volpe JJ. Cerebral white matter injury of the premature infant-more common than you think. Pediatrics. 2003;112:176–180. doi: 10.1542/peds.112.1.176. [DOI] [PubMed] [Google Scholar]
- 81.Banker BQ, Larroche JC. Periventricular leukomalacia of infancy. Arch Neurol. 1962;7:386–410. doi: 10.1001/archneur.1962.04210050022004. [DOI] [PubMed] [Google Scholar]
- 82.Leviton A, Gilles FH. An epidemiologic study of perinatal telencephalic leucoencephalopathy in an autopsy population. J Neurol Sci. 1973;18:53–66. doi: 10.1016/0022-510x(73)90020-8. [DOI] [PubMed] [Google Scholar]
- 83.Gilles FH, Leviton A, Dooling EC. The Developing Human Brain. Growth and Epidemiologic Neuropathology. Littleton, MA: Wright-PSG; 1983. [Google Scholar]
- 84.Volpe JJ. Neurology of the newborn. ed 4. Philadelphia, PA: WB Saunders; 2000. [Google Scholar]
- 85.Wood NS, Marlow N, Costeloe K, et al. Neurologic and developmental disability after extremely preterm birth. N Engl J Med. 2000;343:378–384. doi: 10.1056/NEJM200008103430601. [DOI] [PubMed] [Google Scholar]
- 86.Kinney HC. The near-term (late preterm) human brain and risk for periventricular leukomalacia: a review. Semin Perinatol. 2006;30:81–88. doi: 10.1053/j.semperi.2006.02.006. [DOI] [PubMed] [Google Scholar]
- 87.Back SA. Perinatal white matter injury: the changing spectrum of pathology and emerging insights into pathogenetic mechanisms. MRDD Research reviews. 2006;12:129–140. doi: 10.1002/mrdd.20107. [DOI] [PubMed] [Google Scholar]
- 88.Inder TE, Wells SJ, Mogridge NB, et al. Defining the nature of cerebral abnormalities in the premature infant: qualitative magnetic resonance imaging study. J Pediatr. 2003;143:171–179. doi: 10.1067/S0022-3476(03)00357-3. [DOI] [PubMed] [Google Scholar]
- 89.Uggetti C, Egitto ME, Fazzi E, et al. Cerebral visual impaired in periventricular leukomalacia: MR correlation. AJNR Am J Neuroradiol. 1996;17:979–985. [PMC free article] [PubMed] [Google Scholar]
- 90.Jacobson L, Ek U, Fernell E, et al. Visual impairment in preterm children with periventricular leukomalacia-visual, cognitive, and neuropaediatric characteristics related to cerebral imaging. Dev Med Child Neurol. 1996;38:724–735. doi: 10.1111/j.1469-8749.1996.tb12142.x. [DOI] [PubMed] [Google Scholar]
- 91.Wu YW, Colford JM., Jr Chorioamnionitis as a risk factor for cerebral palsy : A meta-analysis. JAMA. 2000;284:1417–1424. doi: 10.1001/jama.284.11.1417. [DOI] [PubMed] [Google Scholar]
- 92.Kinney HC, Armstrong DD. In: Perinatal Neuropathology, in Greenfield’s Neuropathology. Graham DI, Lantos PI, editors. London England: Arnold; 2002. pp. 557–559. [Google Scholar]
- 93.Kadhim H, Tabarki B, Verellen G, et al. Inflammatory cytokines in the pathogenesis of periventricular leukomalacia. Neurology. 2001;56:1278–1284. doi: 10.1212/wnl.56.10.1278. [DOI] [PubMed] [Google Scholar]
- 94.Follett PL, Rosenberg PA, Volpe JJ, et al. NBQX attenuates excitotoxic injury in developing white matter. J Neurosci. 2000;20:9235–9241. doi: 10.1523/JNEUROSCI.20-24-09235.2000. [DOI] [PMC free article] [PubMed] [Google Scholar]
- 95.Back SA, Han BE, Luo NL, et al. Selective vulnerability of late oligodendrocyte progenitors to hypoxia-ischemia. J Neurosci. 2002;22:455–463. doi: 10.1523/JNEUROSCI.22-02-00455.2002. [DOI] [PMC free article] [PubMed] [Google Scholar]
- 96.Gilles FH, Leviton A, Kerr CS. Endotoxin leucoencephalopathy in the telencephalon of the newborn kitten. J Neurol Sci. 1976;27:183–191. doi: 10.1016/0022-510x(76)90060-5. [DOI] [PubMed] [Google Scholar]
- 97.Back SA, Gan X, Li Y, et al. Maturation-dependent vulnerability of oligodendrocytes to oxidative stress-induced cell death caused by glutathione depletion. J Neurosci. 1998;18:6241–6253. doi: 10.1523/JNEUROSCI.18-16-06241.1998. [DOI] [PMC free article] [PubMed] [Google Scholar]
- 98.Inder T, Anderson N, Spencer C, et al. White matter injury in the premature infant: a comparison between serial cranial sonographic and MR findingfs at term. AJNR Am J Neuroradiol. 2003;24:805–809. [PMC free article] [PubMed] [Google Scholar]
- 99.Miller S, Cozzio C, Goldstein R, et al. Comparing the diagnosis of white matter injury in premature newborns with serial MR imaging and transfontanel ultrasonography findings. AJNR Am J Neuroradiol. 2003;241:1661–1669. [PMC free article] [PubMed] [Google Scholar]
- 100.Counsell SJ, Allsop JM, Harrison MC, et al. Diffusion-weighted imaging of the brain in preterm infants with focal and diffuse white matter abnormality. Pediatrics. 2003;112(1 Pt 1):1–7. doi: 10.1542/peds.112.1.1. [DOI] [PubMed] [Google Scholar]
- 101.Miller SP, Ferriero DM, Leonard C, et al. Early brain injury in premature newborns detected with magnetic resonance imaging is associated with adverse early neurodevelopmental outcome. J Pediatr. 2005;147:609–616. doi: 10.1016/j.jpeds.2005.06.033. [DOI] [PubMed] [Google Scholar]
- 102.Kinney HC, Haynes RL, Folkerth RD. White matter lesions in the prenatal period. In: Golden JA, Harding BN, editors. Developmental Neuropathology. Basel, Switzerland: International Society of Neuropathology; 2004. pp. 156–170. [Google Scholar]
- 103.Kreis R, Hofmann L, Kuhlmann B, et al. Brain Metabolite Composition During Early Human Brain Development as Measured by Quantitative In Vivo 1H Magnetic Resonance Spectroscopy. Magn Reson Med. 2002;48:949–958. doi: 10.1002/mrm.10304. [DOI] [PubMed] [Google Scholar]
- 104.Kreis R, Ernst T, Ross BD. Development of the human brain: in vivo quantification of metabolite and water content with proton magnetic resonance spectroscopy. Magn Reson Med. 1993;30(4):424–437. doi: 10.1002/mrm.1910300405. [DOI] [PubMed] [Google Scholar]
- 105.Ernst T, Kreis R, Ross BD. Absolute quantitation of water and metabolites in the human brain. I. Compartments and water. J Magn Reson. 1993;102:1–8. [Google Scholar]
- 106.Provencher SW. Estimation of metabolite concentrations from localized in vivo proton NMR spectra. Magn Reson Med. 1993;30:672–679. doi: 10.1002/mrm.1910300604. [DOI] [PubMed] [Google Scholar]
- 107.Shu SK, Ashwal S, Hosouser BA, et al. Prognostic value of 1-H MRS in perinatal CNS insults. Pediatr Neurol. 1997;17:309–318. doi: 10.1016/s0887-8994(97)00140-9. [DOI] [PubMed] [Google Scholar]
- 108.Kinney HC, Panigrahy A, Newberger J, et al. Hypoxic-ischemic brain injury in infants with congenital heart disease dying after cardiopulmonary bypass surgery. Acta Neuropathol (Berl) 2005;110:563–578. doi: 10.1007/s00401-005-1077-6. [DOI] [PubMed] [Google Scholar]