Study results show that our MR imaging computer-aided diagnosis algorithm, with use of a combination of computer-extracted MR imaging kinetic and morphologic features, has the potential to be extended to two prognostic tasks: (a) classification of noninvasive (ductal carcinoma in situ) versus invasive (invasive ductal carcinoma [IDC]) lesions and (b) further classification of IDC lesions into lesions with positive lymph nodes (LNs) and lesions with negative LNs.
Abstract
Purpose:
To assess the performance of computer-extracted dynamic contrast material–enhanced (DCE) magnetic resonance (MR) imaging kinetic and morphologic features in the differentiation of invasive versus noninvasive breast lesions and metastatic versus nonmetastatic breast lesions.
Materials and Methods:
In this institutional review board–approved HIPAA-compliant study, in which the requirement for informed patient consent was waived, breast MR images were retrospectively collected. The images had been obtained with a 1.5-T MR unit by using a gadodiamide-enhanced T1-weighted spoiled gradient-recalled acquisition in the steady state sequence. The breast MR imaging database contained 132 benign, 71 ductal carcinoma in situ (DCIS), and 150 invasive ductal carcinoma (IDC) lesions. Fifty-four IDC lesions were associated with metastasis-positive lymph nodes (LNs), and 64 IDC lesions were associated with negative LNs. Lesion segmentation and extraction of morphologic and kinetic features were automatically performed by a laboratory-developed computer workstation. Features were first selected by using stepwise linear discriminant analysis and then merged by using Bayesian neural networks. Lesion classification performance was assessed with receiver operating characteristic analysis.
Results:
Differentiation of DCIS from IDC lesions yielded an area under the receiver operating characteristic curve (AUC) of 0.83 ± 0.03 (standard error). AUCs were 0.85 ± 0.02 for differentiation between IDC and benign lesions and 0.79 ± 0.03 for differentiation between DCIS and benign lesions. Differentiation between IDC lesions associated with positive LNs and IDC lesions associated with negative LNs yielded an AUC of 0.82 ± 0.04. AUCs were 0.86 ± 0.03 for differentiation between IDC lesions associated with positive LNs and benign lesions and 0.83 ± 0.03 for differentiation between IDC lesions associated with negative LNs and benign lesions.
Conclusion:
Computer-aided diagnosis of breast DCE MR imaging–depicted lesions was extended from the task of discriminating between malignant and benign lesions to the prognostic tasks of distinguishing between noninvasive and invasive lesions and discriminating between metastatic and nonmetastatic lesions, yielding MR imaging–based prognostic markers.
© RSNA, 2010
Supplemental material: http://radiology.rsna.org/lookup/suppl/doi:10.1148/radiol.09090838/-/DC1
Introduction
Breast magnetic resonance (MR) imaging continues to become an important component of the clinical work-up of patients suspected of having breast carcinoma. Dynamic contrast material–enhanced (DCE) MR imaging enables the visual differentiation of lesions from normal tissue owing to the increased vascularity and capillary permeability of breast lesions (1–4). Thus, dynamic MR imaging has emerged as a modality that is possibly complementary to mammography and ultrasonography (US) because of the additional three-dimensional spatial and temporal information about the lesion that it yields. Results of previous studies have shown that morphologic characteristics and enhancement kinetics—specifically, the time course of the signal intensity within the lesion—can be used in the interpretation of lesions to determine the likelihood of malignancy (5–13).
Studies have been focused on the diagnostic value of MR imaging characterization—that is, the differentiation of malignant from benign lesions. Once a lesion is established as being malignant, knowledge of the prognostic nature of the lesion is also crucial because it influences the choice of treatment and how the lesion will be monitored. Tumor invasiveness is one important prognostic marker. The most common malignant lesion (in approximately 70% of all cases) is invasive ductal carcinoma (IDC) (14,15). Relatively recent research has been performed to investigate the MR imaging–based visual and manual assessment of another type of malignant lesion: noninvasive (in situ) cancer (16–20). Ductal carcinoma in situ (DCIS) is generally considered to be a nonobligate precursor of invasive cancer, with a 30%–50% chance of becoming invasive (21). Accurate characterization of invasive and noninvasive breast lesions is essential for clinical management decisions and successful treatment.
Lymph node (LN) involvement is the most important prognostic marker because the lymph nodes, particularly the axillary LNs, are the first site of metastasis from breast adenocarcinoma. Study results have shown that breast lesions associated with LNs that are positive for metastasis have a poorer prognosis than do breast lesions associated with negative (ie, nonmetastatic) LNs (22–25).
MR imaging assessment of breast cancer cases may involve labor-intensive interpretation methods and inter- and intraobserver variations (26,27). The goal of automated computerized analysis of medical images is to obtain quantitative indexes for diagnosis, prognosis, and response to therapy. Computer-aided diagnosis (CAD) is intended to reduce interobserver variation in interpretations by facilitating a more objective evaluation of the images (28,29).
Various researchers have developed CAD methods for breast imaging modalities—including mammography, US, and MR imaging—and for combined modalities for the tasks of automated lesion segmentation, feature extraction, and lesion characterization (11–13,30–35). In addition, several observer studies of all three of these modalities have revealed the potential usefulness of CAD in clinical settings (36–40). Thus, in this study, our aim was to investigate whether our CAD method can be extended from diagnostic to prognostic tasks to ultimately yield MR imaging–based prognostic markers. Our specific goal was to assess the performance of computer-extracted morphologic and kinetic features of lesions from DCE MR images in the differentiation of certain subtypes of malignant breast lesions, with respect to invasive versus noninvasive cancers and metastatic versus nonmetastatic cancers.
Materials and Methods
Breast MR Imaging Database
M.L.G. and the spouse of G.M.N. are stockholders of and receive royalties from R2 Technology/Hologic (Bedford, Mass). It is the policy of the University of Chicago that investigators publicly disclose actual or potential substantial financial interest that would reasonably appear to be directly and markedly affected by the research activities.
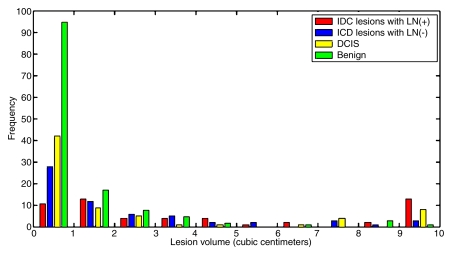
This was an institutional review board–approved, Health Insurance Portability and Accountability Act–compliant study, with the requirement for informed consent waived. Retrospective review of the findings from 600 consecutive breast MR examinations performed at the University of Chicago Medical Center between April 2002 and October 2005 revealed 150 IDC lesions, 71 DCIS lesions, and 132 benign lesions in 311 women (mean age, 53.9 years ± 13.7 [standard deviation]; age range, 22–88 years). Lesions with mixed histologic features (eg, IDC and DCIS) and lesions of other histologic types (eg, invasive lobular carcinoma, mucinous carcinoma, etc) were excluded. All 353 lesions included in the study were examined and documented by experienced pathologists, and all cases were reviewed at a multidisciplinary breast cancer management conference. Of the 150 IDC lesions, 54 were associated with positive LNs and 64 lesions were associated with negative LNs. Invasive lesions for which the work-up was performed at an outside institution were excluded from the LN metastasis portion of the study. Figure 1 shows the distribution of tumor volumes for all of the lesions included in the study.
Figure 1:
Graph illustrates distribution of lesion volumes for all IDC lesions with positive LNs, IDC lesions with negative LNs, DCIS lesions, and benign lesions in the breast MR imaging database.
MR images were obtained by using a T1-weighted three-dimensional spoiled gradient-recalled acquisition in the steady state sequence (7.7/4.2 [repetition time msec/echo time msec], 30° flip angle). Fat suppression was not used. The patients were imaged in the prone position with use of a standard double breast coil and a 1.5-T whole-body MR imaging system (GE Signa; GE Medical Systems, Milwaukee, Wis). After nonenhanced images were acquired, gadodiamide (Omniscan; Nycomed-Amersham, Princeton, NJ) was administered intravenously at a fixed dose of 20 mL; a 20-mL saline flush followed. Three to five contrast-enhanced image series were obtained with a time interval of 68 seconds. Each series consisted of 60 coronal sections with a matrix of 256 × 256 pixels. The in-plane spatial resolution was 1.25 × 1.25 mm, and the section thickness was in the range of 2–3 mm, depending on the breast size.
Data Analyses
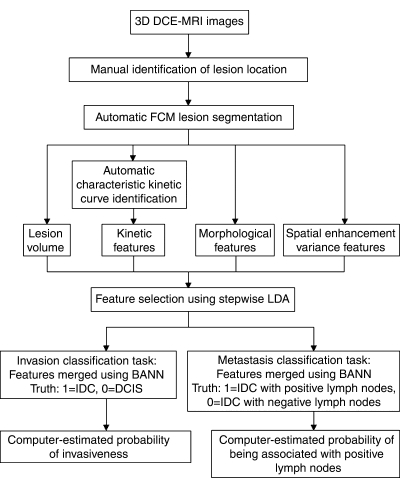
Our automatic analysis (Fig 2) began once the dynamic MR images were acquired, and the lesion location was based on clinical radiology reports. Identification of the lesion location was the only manual step in the analysis; all subsequent steps were automatically performed in real time by the computer. The computer used the fuzzy c-means clustering method to automatically segment the lesion in three dimensions, enabling the calculation of tumor volume (41). Fuzzy c-means clustering used the enhancement of the lesion over time to output a membership map that classified each voxel as lesion or nonlesion. Connected-component labeling and hole filling were the final steps in generating the segmentation outline of the lesion (41).
Figure 2:
Diagram outlines the protocol for automated analysis of breast lesions seen at DCE MR imaging. BANN = Bayesian artificial neural network, FCM = fuzzy c-means clustering, LDA = linear discriminant analysis.
Because of the internal uptake heterogeneity within breast lesions, an average kinetic curve that uses all of the voxels within the lesion was not used. Instead, fuzzy c-means clustering was applied to identify different kinetic time course curves within the lesion. The kinetic curve with the highest initial enhancement was then automatically chosen as the curve from which the kinetic features would be extracted (11). It has been shown that using only the most enhancing voxels, as compared with using the average kinetic curve, improves the performance of kinetic features (11). Spatial enhancement variance features, which describe the spatial variance of the enhancement within a lesion at each acquired time point, were also calculated (12).
In addition to kinetic features, mathematical descriptors of the morphology were extracted. Three-dimensional textural features were calculated by using a three-dimensional volumetric gray-level co-occurrence matrix method (13,42). Geometric features such as size and margin gradient were also computed (43). Overall, thirty-one features (Table 1) were calculated for each lesion.
Table 1.
Computer-extracted Breast Lesion Features
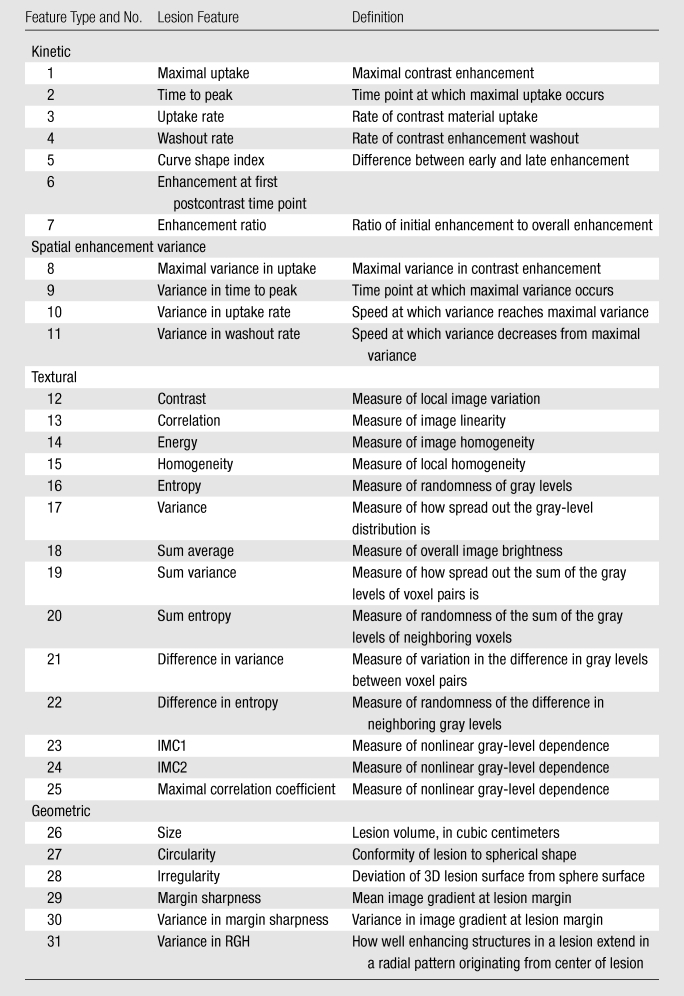
Note.—IMC1 = information measure of correlation 1, IMC2 = information measure of correlation 2, RGH = radial gradient histogram, 3D = three-dimensional.
For each prognostic task, four classifications were investigated. For the classification of invasive versus noninvasive lesions, we considered (a) IDC versus DCIS lesions, (b) IDC versus benign lesions, (c) DCIS versus benign lesions, and (d) malignant (DCIS and IDC) versus benign lesions. Similarly, for the classification of metastatic versus nonmetastatic lesions, we examined (a) IDC lesions with positive LNs versus IDC lesions with negative LNs, (b) IDC lesions with positive LNs versus benign lesions, (c) IDC lesions with negative LNs versus benign lesions, and (d) malignant (IDC lesions with positive and negative LNs) versus benign lesions.
Statistical Analyses
Stepwise feature selection using linear discriminant analysis with a Wilks lambda cost function in a round-robin-by-case method was used to select the subset of features that performed effectively in the classification of lesions for each task (44). Once the feature histogram was generated, the threshold was set at 50% of the frequency of the most chosen feature. Features whose frequency was greater than the threshold were selected for the classification task, and a two-class Bayesian artificial neural network was then used to merge these selected features (45). The round-robin-by-case validation method was used in the performance evaluation for the Bayesian artificial neural network approach. Receiver operating characteristic analysis was used to evaluate the performance of each classification task (46,47). The area under the maximal likelihood–fitted binormal receiver operating characteristic curve (AUC) was used as the index of performance and was calculated by using the ROCKIT software package (ROCKIT, version 0.9b, 1998; C. E. Metz, http://www.radiology.uchicago.edu/krl/roc_soft.htm). The z test was applied to assess the statistical significance of the difference between the calculated AUC and an AUC of 0.50.
Results
Relationships between Lesion Characteristics in the Classification Tasks
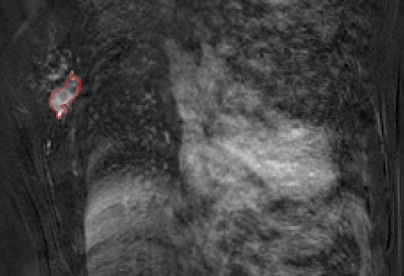
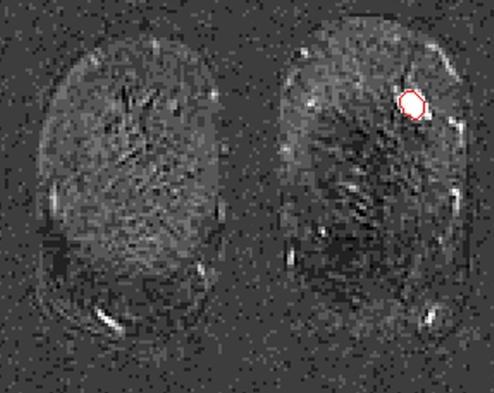
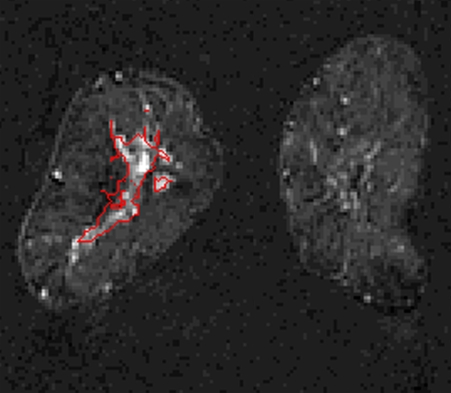
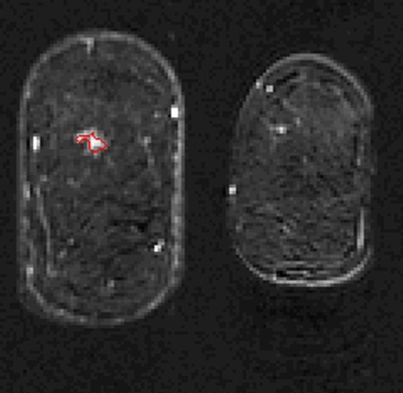
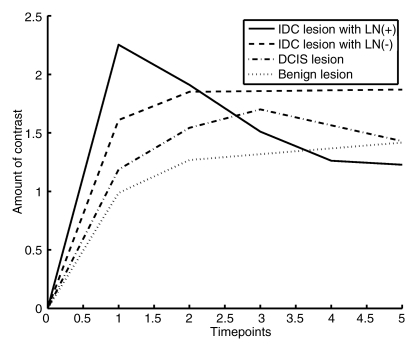
The lesion segmentations and characteristic kinetic curves for four sample breast lesions are demonstrated in Figure 3. Performance values for the computer-extracted kinetic and morphologic features of these four lesions are given in Table 2. The IDC lesion with positive LNs had a fast contrast material uptake, with maximal enhancement at the first postcontrast time point, and a rapid washout, while the benign lesion had a slow and persistent uptake, with maximal enhancement at the fifth postcontrast time point. The DCIS lesion had an intermediate enhancement pattern, with delayed and less enhancement compared with the IDC lesion with negative LNs (Fig 3b). In terms of the shape of the lesions, the DCIS lesion (Fig 3c) was non–mass like and segmental compared with the mass-like IDC and benign lesions (Fig, 3a, 3b, 3d), as evident in the circularity and irregularity feature values (Table 2).
Figure 3a:
Coronal MR images show segmentation (red outline) of (a) IDC lesion with positive LNs in 34-year-old woman, (b) IDC lesion with negative LNs in 39-year-old woman, (c) DCIS lesion in 66-year-old woman, and (d) benign lesion in 48-year-old woman. (e) Corresponding characteristic kinetic curves for these four breast lesions.
Figure 3b:
Coronal MR images show segmentation (red outline) of (a) IDC lesion with positive LNs in 34-year-old woman, (b) IDC lesion with negative LNs in 39-year-old woman, (c) DCIS lesion in 66-year-old woman, and (d) benign lesion in 48-year-old woman. (e) Corresponding characteristic kinetic curves for these four breast lesions.
Figure 3c:
Coronal MR images show segmentation (red outline) of (a) IDC lesion with positive LNs in 34-year-old woman, (b) IDC lesion with negative LNs in 39-year-old woman, (c) DCIS lesion in 66-year-old woman, and (d) benign lesion in 48-year-old woman. (e) Corresponding characteristic kinetic curves for these four breast lesions.
Figure 3d:
Coronal MR images show segmentation (red outline) of (a) IDC lesion with positive LNs in 34-year-old woman, (b) IDC lesion with negative LNs in 39-year-old woman, (c) DCIS lesion in 66-year-old woman, and (d) benign lesion in 48-year-old woman. (e) Corresponding characteristic kinetic curves for these four breast lesions.
Figure 3e:
Coronal MR images show segmentation (red outline) of (a) IDC lesion with positive LNs in 34-year-old woman, (b) IDC lesion with negative LNs in 39-year-old woman, (c) DCIS lesion in 66-year-old woman, and (d) benign lesion in 48-year-old woman. (e) Corresponding characteristic kinetic curves for these four breast lesions.
Table 2.
Computer-extracted Kinetic and Morphologic Feature Values for Four Breast Lesions
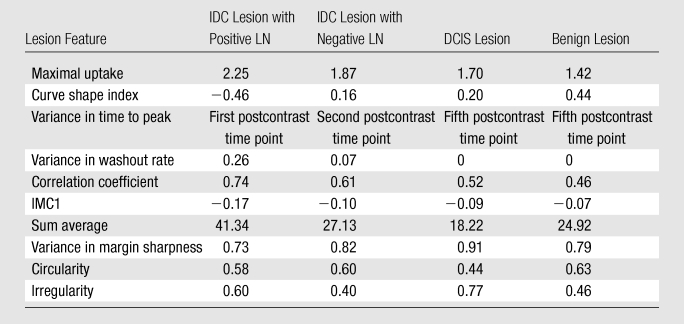
Note.—Data are computer-extracted kinetic and morphologic feature values for an IDC lesion associated with positive LNs in a 34-year-old woman, an IDC lesion associated with negative LNs in a 39-year-old woman, a DCIS lesion in a 66-year-old woman, and a benign lesion in a 48-year-old woman. These four lesions are shown in Figure 3. IMC1 = information measure of correlation 1.
Uptake rate, a measure of how fast the contrast agent is taken up by the lesion, was a strong feature. The DCIS and benign lesions exhibited lower uptake rates compared with the IDC lesions, and the IDC lesions with positive LNs outnumbered the IDC lesions with negative LNs, with greater uptake values (Fig E1 [online]). The correlation coefficient between uptake rate and size was 0.40 (P < .05) for DCIS lesions and −0.02 (P > .1) for benign lesions. Another important kinetic feature was time to peak. The enhancement of the malignant lesions peaked at the first or second postcontrast time point, while the enhancement of the benign lesions was more likely to peak at the 5th or final postcontrast time point. Among the malignant lesions, the IDC lesions with negative lymph nodes and the DCIS lesions tended to peak later than the IDC lesions with positive lymph nodes (Fig E2 [online]).
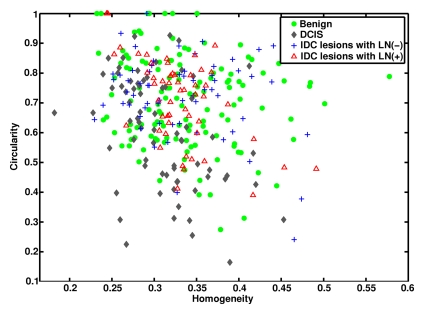
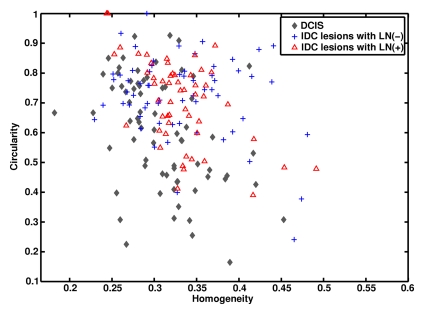
In terms of morphologic lesion characterization, contrast is a textural descriptor of lesion heterogeneity. As expected, the malignant lesions had larger contrast values than did the benign lesions (Fig E1 [online]). Circularity is a geometric feature of how closely a lesion resembles a sphere. There was a general trend toward IDC and benign lesions having higher circularity values than DCIS lesions (Fig 4).
Figure 4a:
Graphs show (a) relationships between homogeneity and circularity for IDC lesions with positive LNs, IDC lesions with negative LNs, DCIS lesions, and benign lesions and (b) relationships between homogeneity and circularity for IDC lesions with positive lymph nodes, IDC lesions with negative lymph nodes, and DCIS lesions.
Figure 4b:
Graphs show (a) relationships between homogeneity and circularity for IDC lesions with positive LNs, IDC lesions with negative LNs, DCIS lesions, and benign lesions and (b) relationships between homogeneity and circularity for IDC lesions with positive lymph nodes, IDC lesions with negative lymph nodes, and DCIS lesions.
Performance of Classification Tasks
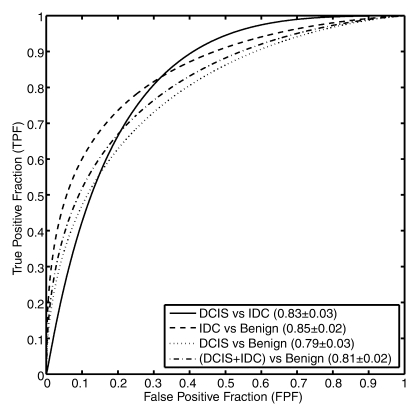
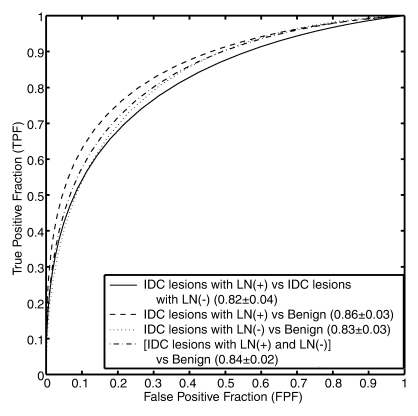
During feature selection, the feature sets were generally stable across the round-robin-by-case iterations (Fig E3 [online]). The features selected for each classification task are shown in Table 3, with performance values cited in AUCs from the resulting classifier. The corresponding receiver operating characteristic curves derived at round-robin-by-case analysis are shown in Figure 5. AUCs were 0.83 ± 0.03 (standard error), 0.85 ± 0.02, 0.79 ± 0.03, and 0.81± 0.02 for the classifications of IDC versus DCIS lesions, IDC versus benign lesions, DCIS versus benign lesions, and malignant (DCIS + IDC) versus benign lesions, respectively. AUCs were 0.82 ± 0.04, 0.86 ± 0.03, 0.83 ± 0.03, and 0.84 ± 0.02 for the classifications of IDC lesions with positive LNs versus IDC lesions with negative LNs, IDC lesions with positive LNs versus benign lesions, IDC lesions with negative LNs versus benign lesions, and malignant (IDC lesions with positive and negative LNs) versus benign lesions, respectively. For the malignant lesions, we achieved a coefficient of 0.31 (P < .001) for the correlation between the computer-estimated probability of cancer invasiveness and the computer-estimated probability of cancer associated with positive LNs (Fig E4 [online]).
Table 3.
Computer-selected Features and Corresponding AUCs for Invasive Cancer and Metastasis Classification Tasks
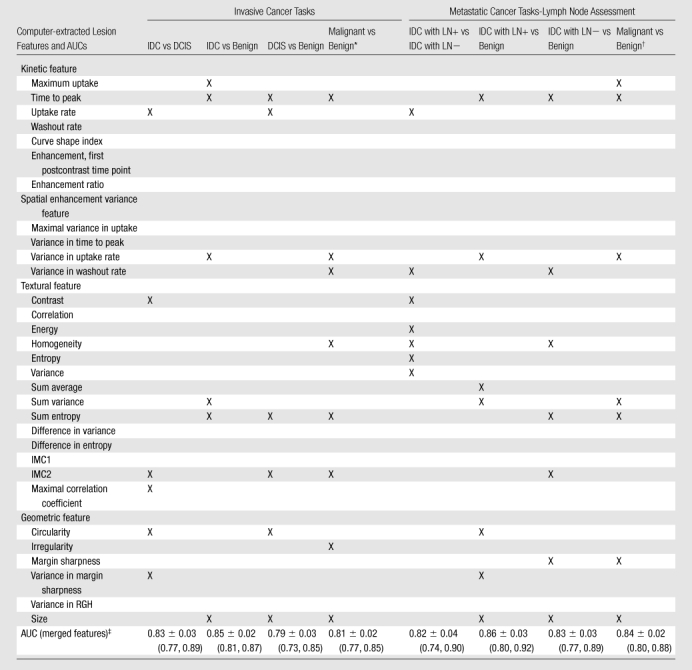
Note.—X indicates the given feature was involved in the specified classification task. IMC1 = information measure of correlation 1, IMC2 = information measure of correlation 2, LN+ = LNs positive for metastasis. LN− = LNs negative for metastasis, RGH = radial gradient histogram. P < .001 for all comparisons at z test analysis.
Malignant refers to DCIS and IDC lesions.
Malignant refers to IDC lesions with positive and negative LNs.
AUCs are cited with standard errors. Numbers in parentheses are 95% confidence intervals.
Figure 5a:
Receiver operating characteristic curves for (a) invasive cancer classification tasks and (b) LN metastasis classification tasks.
Figure 5b:
Receiver operating characteristic curves for (a) invasive cancer classification tasks and (b) LN metastasis classification tasks.
Discussion
Our study results show that our DCE MR imaging CAD algorithm has the potential to be extended to two prognostic tasks—(a) classification of noninvasive (DCIS) and invasive (IDC) lesions and (b) further classification of IDC lesions into IDC lesions with positive LNs and IDC lesions with negative LNs—with the use of combined computer-extracted MR imaging kinetic and morphologic features.
Although DCIS lesions have a variable enhancement pattern, it has been shown that they tend to show delayed as well as decreased enhancement compared with IDC lesions (13). Our results are in agreement with this finding: The DCIS lesions had a lower uptake rate and higher time to peak values compared with the IDC lesions. We found that the IDC lesions with positive LNs had more aggressive kinetics than did the IDC lesions with negative LNs, especially with respect to the uptake rate feature.
In terms of textural features, a common indicator of malignancy was lesion heterogeneity, which can be described by using different mathematic algorithms. Three textural features—contrast, maximal correlation coefficient, and IMC2—were selected for the IDC versus DCIS classification task, while four textural features—contrast, energy, homogeneity, entropy, and variance—were chosen for the IDC lesions with positive LNs versus IDC lesions with negative LNs classification task. Thus, the results from the selection and combination of such features indicate that each malignant lesion subtype—IDC lesions with positive LNs, IDC lesions with negative LNs, and DCIS lesions—may have a characteristic heterogeneity that distinguishes one subtype from the others.
We found that DCIS lesions are generally non–mass like, with enhancement in a linear distribution, compared with mass-like IDC and benign lesions. Thus, circularity was an effective lesion feature for the IDC versus DCIS lesion classification task. This result is in agreement with findings in the literature regarding the clinical MR appearance of DCIS lesions (13–15). Other segmentation algorithms, such as a volume-growing method (43), are based on the assumption that the lesion is mass like. However, our segmentation algorithm is based on the enhancement of the lesion and thereby has the flexibility to enable assessment of the three-dimensional extent of both non–mass-like lesions, such as DCIS, and mass-like lesions.
It should be noted that DCIS can appear as mass-like enhancement; thus, in our analysis, we used both kinetic and morphologic features for classification rather than one feature. The computer program can use other selected features, such as uptake rate and contrast, to help designate mass-like lesions as DCIS.
The IDC versus benign lesion classification task (AUC, 0.85) performed better than did the DCIS versus benign lesion classification task (AUC, 0.79). This might indicate that DCIS and benign lesions have some similar characteristics and thus that it is more difficult to distinguish between these two breast lesion types. On the other hand, the IDC lesions, being inherently more aggressive than the DCIS lesions, were more easily differentiated from the benign lesions. Similarly, the performance of the IDC lesions with positive LNs versus benign lesions classification task (AUC, 0.86) surpassed that of the IDC lesions with negative LNs versus benign lesions classification task (AUC, 0.83), demonstrating that IDC lesions with positive LNs are more aggressive than IDC lesions with negative LNs.
From a biologic standpoint, invasion and metastasis are related events; tumors have to be invasive to develop the ability to metastasize. For the malignant lesions, we achieved a coefficient of 0.31 (P < .001) for the correlation between the computer-estimated probability of invasiveness and the computer-estimated probability of being associated with positive LNs. This result is consistent with the assumption that tumors with associated positive LNs are invasive; however, invasive tumors may not necessarily be associated with positive LNs. Thus, a higher probability of a lesion being IDC might lead to a higher probability of the same lesion having positive LNs. There are also IDC lesions with negative LNs for which there is a high computer-estimated probability of the lesion being IDC but that may be explained by the timing of the MR imaging examination—that is, the IDC lesion had not yet metastasized at the time of the examination.
Tumor size is another important prognostic marker (24,25) because larger tumors are generally associated with a poorer prognosis than smaller tumors. Size was chosen as a feature for all of the classification tasks involving benign lesions; this indicates the importance of size in distinguishing malignant from benign lesions. However, it was not chosen for the DCIS versus IDC classification task (single-feature AUC, 0.61) or the IDC lesions with positive LNs versus IDC lesions with negative LNs task (single-feature AUC, 0.65). Thus, tumor size might not be as strong of a prognostic marker as the other markers; the described computerized analysis does yield new information for the MR characterization of breast lesions.
Although our preliminary results are promising, there were several limitations to the study. As noted earlier, the feature sets were generally stable across the round-robin-by-case iterations, with minimal bias yielded by using the data set for both round-robin feature selection and round-robin classification performance evaluation. We also limited the number of selected features (to four to eight features per task) to preserve the robustness of the classification method and reduce the risk of overtraining. In the future, by expanding the data set, we hope to perform feature selection and validation on independent data sets and thus reinforce our prognostic classification task results. In addition, the estimated standard errors of the estimated AUCs reflect only the finite size of the testing set. A future study of interest would be to further assess the performance variability due to the finite size of the training set, which characterizes the stability of the classifier with respect to varying training sets (48,49).
An additional limitation of the study was that invasive lobular carcinoma and lobular carcinoma in situ lesions were not included in our analysis owing to an insufficient number of these cases. Another limitation was that we performed computer analysis of cases collected at the University of Chicago Medical Center only. Last, due to database size limitations that resulted from further subcategorization, we did not take into account the different grades of IDC and DCIS in our analysis. For example, atypical ductal hyperplasia is a benign lesion that is considered to be a nonobligate precursor of DCIS; thus, it might be more difficult to differentiate low-grade DCIS from atypical ductal hyperplasia.
We believe that it is too early to specify exactly how computerized analysis of breast images for prognosis will affect clinical care. To our knowledge, this is the first study in the CAD field to focus on prognoses rather than diagnoses. Despite the limitations, we believe that the results of this study are promising, showing that computer analysis can be used to discriminate, at some level, cases of varying prognosis. However, preclinical studies need to be completed to determine exactly how such analyses might ultimately fit into clinical care. Although we used round-robin cross validation in our study, the results are likely to be somewhat biased. Validation with an independent data set is required for unbiased assessment.
A computer-aided prognostic workstation that generates MR image–based biomarkers that describe the prognostic nature of lesions has the potential to be clinically useful, especially if these biomarkers are combined with markers from other modalities, such as US, to facilitate multimodal assessment. For example, a radiologist might describe the LNs as normal at MR imaging, but if the workstation findings indicate that the lesion is potentially metastatic, then US or biopsy of the axillary LNs would be performed to rule in possible metastasis.
Future steps in our research include examining the characterization of other invasive breast carcinomas such as invasive lobular carcinoma, as well as investigating other prognostic factors such as histologic grade (50–53), to further test the robustness of our computerized analysis of DCE MR imaging findings and generate multiple prognostic image-based markers for breast carcinoma. By merging or correlating these image-based prognostic markers, we hope to generate an overall prognostic marker for breast lesions. The output from such quantitative image analysis may be useful in the data mining of lesion characteristics with clinical, histopathologic, and genomic data, potentially contributing to personalized medicine.
Advances in Knowledge.
Computer-extracted kinetic and morphologic features of lesions seen at dynamic contrast-enhanced breast MR imaging have the potential to facilitate the characterization and differentiation of invasive cancer, noninvasive (in situ) cancer, and benign lesions.
Computerized analysis of dynamic contrast-enhanced breast MR imaging lesions has the capability for differentiation of metastatic versus nonmetastatic breast lesions.
These two classification tasks can be interpreted as prognostic tasks, thereby yielding promising MR imaging–based prognostic markers.
Implication for Patient Care.
In situ cancer and invasive cancer without metastasis to the lymph nodes (LNs) have a better prognosis than does invasive cancer with LN metastasis; thus, accurate prognostic characterization of breast lesions may influence decisions regarding the clinical management of patients.
Preclinical studies need to be completed to determine exactly how such analyses might ultimately fit into clinical care.
Supplementary Material
Received May 19, 2009; revision requested June 16; revision received September 3; accepted September 11; final version accepted September 22.
Supported in part by NIH grants R33-CA113800 and P50-CA125183, an NIH Medical Scientist Training Program (MSTP) grant, and DOE grant DE-FG02-08ER6478.
Funding: This research was supported by National Institutes of Health (grants R33-113800, P50-CA125183).
See Materials and Methods for pertinent disclosures.
Abbreviations:
- AUC
- area under maximal likelihood–fitted binormal receiver operating characteristic curve
- CAD
- computer-aided diagnosis
- DCE
- dynamic contrast enhanced
- DCIS
- ductal carcinoma in situ
- IDC
- invasive ductal carcinoma
- LN
- lymph node
References
- 1.Schnall MD. Breast MR imaging. Radiol Clin North Am 2003;41:43–50 [DOI] [PubMed] [Google Scholar]
- 2.Morris EA. Breast cancer imaging with MRI. Radiol Clin North Am 2002;40:443–466 [DOI] [PubMed] [Google Scholar]
- 3.Kuhl CK, Schild HH. Dynamic image interpretation of MRI of the breast. J Magn Reson Imaging 2000;12:965–974 [DOI] [PubMed] [Google Scholar]
- 4.Kuhl CK, Mielcareck P, Klaschik S, et al. Dynamic breast MR imaging: are signal intensity time course data useful for differential diagnosis of enhancing lesions?. Radiology 1999;211:101–110 [DOI] [PubMed] [Google Scholar]
- 5.Bartella L, Smith CS, Dershaw DD, Liberman L. Imaging breast cancer. Radiol Clin North Am 2007;45:45–67 [DOI] [PubMed] [Google Scholar]
- 6.Boetes C, Mus RD, Holland R, et al. Breast tumors: comparative accuracy of MR imaging relative to mammography and US for demonstrating extent. Radiology 1995;197:743–747 [DOI] [PubMed] [Google Scholar]
- 7.Warren RM, Pointon L, Thompson D, et al. Reading protocol for dynamic contrast-enhanced MR images of the breast: sensitivity and specificity analysis. Radiology 2005;236:779–788 [DOI] [PubMed] [Google Scholar]
- 8.Heywang-Köbrunner SH, Bick U, Bradley WG, Jr, et al. International investigation of breast MRI: results of a multicentre study (11 sites) concerning diagnostic parameters for contrast-enhanced MRI based on 519 histopathologically correlated lesions. Eur Radiol 2001;11:531–546 [DOI] [PubMed] [Google Scholar]
- 9.Orel SG. MR imaging of the breast. Radiol Clin North Am 2000;38:899–913 [DOI] [PubMed] [Google Scholar]
- 10.Wiener JI, Schilling KJ, Adami C, Obuchowski NA. Assessment of suspected breast cancer by MRI: a prospective clinical trial using a kinetic and morphologic analysis. AJR Am J Roentgenol 2005;184:878–886 [DOI] [PubMed] [Google Scholar]
- 11.Chen W, Giger ML, Bick U, Newstead GM. Automatic identification and classification of characteristic kinetic curves of breast lesions on DCE-MRI. Med Phys 2006;33:2878–2887 [DOI] [PubMed] [Google Scholar]
- 12.Chen W, Giger ML, Lan L, Bick U. Computerized interpretation of breast MRI: investigation of enhancement-variance dynamics. Med Phys 2004;31:1076–1082 [DOI] [PubMed] [Google Scholar]
- 13.Chen W, Giger ML, Li H, Bick U, Newstead GM. Volumetric texture analysis of breast lesions on contrast-enhanced magnetic resonance images. Magn Reson Med 2007;58:562–571 [DOI] [PubMed] [Google Scholar]
- 14.Northridge ME, Rhoads GG, Wartenberg D, et al. The importance of histologic type on breast cancer survival. J Clin Epidemiol 1997;50:283–290 [DOI] [PubMed] [Google Scholar]
- 15.Gamel JW, Meyer JS, Feuer E, et al. The impact of stage and histology on the long-term clinical course of 163,808 patients with breast carcinoma. Cancer 1996;77:1459–1464 [DOI] [PubMed] [Google Scholar]
- 16.Jansen SA, Newstead GM, Abe H, Shimauchi A, Schmidt RA, Karczmar GS. Pure ductal carcinoma in situ: kinetic and morphological MR characteristics compared with mammographic appearance and nuclear grade. Radiology 2007;245:684–691 [DOI] [PubMed] [Google Scholar]
- 17.Neubauer H, Li M, Kuehne-Heid R, Schneider A, Kaiser WA. High grade and non-high grade ductal carcinoma in situ on dynamic MR mammography: characteristic finds for signal increase and morphological patterns of enhancement. Br J Radiol 2003;76:3–12 [DOI] [PubMed] [Google Scholar]
- 18.Van Goethem M, Schelfout K, Kersschot E, et al. Comparison of MRI features of difference grades of DCIS and invasive carcinoma of the breast. JBR-BTR 2005;88:225–232 [DOI] [PubMed] [Google Scholar]
- 19.Menell JH, Morris EA, Dershaw DD, Abramson AF, Brogi E, Liberman L. Determination of the presence and extent of pure ductal carcinoma in situ by mammography and magnetic resonance imaging. Breast J 2005;11:382–390 [DOI] [PubMed] [Google Scholar]
- 20.Fischer U, Westerhof JP, Brinck U, Korabiowdka M, Schauer A, Grabbe E. Ductal carcinoma in situ in dynamic MR mammography at 1.5 T [in German]. Rofo 1996;164:290–294 [DOI] [PubMed] [Google Scholar]
- 21.Recht A, Rutgers EJ, Fentinmann IS, Kurtz JM, Mansel RE, Slane JP. The Fourth EORTC DCIS Consensus Meeting (Château Marquette, Heemskerk, the Netherlands, 23-24 Jan 1998): conference report. Eur J Cancer 1998;34:1664–1669 [DOI] [PubMed] [Google Scholar]
- 22.Arriagada R, Le MG, Dunant A, et al. Twenty-five years of follow-up in patients with operable breast carcinoma: correlation between clinicopathologic factors and the risk of death in each 5-year period. Cancer 2006;106:743–750 [DOI] [PubMed] [Google Scholar]
- 23.Fisher ER, Anderson S, Tan-Chiu E, Fisher B, Eaton L, Wolmark N. Fifteen-year prognostic discriminants for invasive breast carcinoma: National Surgical Adjuvant Breast and Bowel Project Protocol-06. Cancer 2000;91:1679–1687 [PubMed] [Google Scholar]
- 24.Warwick J, Tabar L, Vitak B, Duffy S. Time-dependent effects on survival in breast cancer: results of 20 years of follow-up from the Swedish Two-County Study. Cancer 2004;100:1331–1336 [DOI] [PubMed] [Google Scholar]
- 25.Soerjomataram I, Louwman M, Ribot J, Roukema J, Coebergh JW. An overview of prognostic factors for long-term survivors of breast cancer. Breast Cancer Res Treat 2008;107:309–330 [DOI] [PMC free article] [PubMed] [Google Scholar]
- 26.Kinkel K, Helbich TH, Esserman LJ, et al. Dynamic high-spatial-resolution MR imaging of suspicious breast lesions: diagnostic criteria and interobserver variability. AJR Am J Roentgenol 2000;175:35–43 [DOI] [PubMed] [Google Scholar]
- 27.Ballon DJ, Trenta LR, Hadar O, Abramson A, Dershaw DD. Observer variability and applicability of BIRADS terminology for breast MR imaging: invasive carcinomas as focal masses. AJR Am J Roentgenol 2001;177:551–557 [DOI] [PubMed] [Google Scholar]
- 28.Warren Burhenne LJ, Wood SA, D’Orsi CJ, et al. Potential contribution of computer-aided detection to the sensitivity of screening mammography. Radiology 2000;215:554–562 [DOI] [PubMed] [Google Scholar]
- 29.Jiang Y, Nishikawa RM, Schmidt RA, et al. Improving breast cancer diagnosis with computer-aided diagnosis. Acad Radiol 1999;6:22–33 [DOI] [PubMed] [Google Scholar]
- 30.Polakowski WE, Cournoyer DA, Rogers SK, et al. Computer-aided breast cancer detection and diagnosis of masses using difference of Gaussians and derivative-based feature saliency. IEEE Trans Med Imaging 1997;16:811–819 [DOI] [PubMed] [Google Scholar]
- 31.Chen D, Chang RF, Huang YL. Breast cancer diagnosis using self-organizing map for sonography. Ultrasound Med Biol 2000;26:405–411 [DOI] [PubMed] [Google Scholar]
- 32.Petrick N, Sahiner B, Chan HP, Helvie MA, Paquerault S, Hadjiiski LM. Breast cancer detection: evaluation of a mass-detection algorithm for computer-aided diagnosis—experience in 263 patients. Radiology 2002;224:217–224 [DOI] [PubMed] [Google Scholar]
- 33.Meinel LA, Stolpen AH, Berbaum KS, Reinhardt JM. Breast MRI lesion classification: improved performance of human readers with a backpropagation neural network computer-aided diagnosis (CAD) system. J Magn Reson Imaging 2007;25:89–95 [DOI] [PubMed] [Google Scholar]
- 34.Drukker K, Giger ML, Vyborny CJ, Mendelson EB. Computerized detection and classification of cancer on breast ultrasound. Acad Radiol 2004;11:526–535 [DOI] [PubMed] [Google Scholar]
- 35.Huo Z, Giger ML, Vyborny CJ. Computerized analysis of multiple-mammographic views: potential usefulness of special view mammograms in computer-aided diagnosis. IEEE Trans Med Imaging 2001;20:1285–1292 [DOI] [PubMed] [Google Scholar]
- 36.Huo Z, Giger ML, Vyborny CJ, Metz CE. Effectiveness of CAD in the diagnosis of breast cancer: an observer study on an independence database of mammograms. Radiology 2002;224:560–568 [DOI] [PubMed] [Google Scholar]
- 37.Horsch K, Giger ML, Vyborny CJ, Huo Z, Venta LA. Performance of CAD in the interpretation of lesions on breast sonography. Acad Radiol 2004;11:272–280 [DOI] [PubMed] [Google Scholar]
- 38.Shimauchi A, Giger ML, Bhooshan N, et al. Reader study for the evaluation of radiologists’ interpretation of breast MRI using a CAD breast MRI workstation [abstr]. In: Radiological Society of North America Scientific Assembly and Annual Meeting Program Oak Brook, Ill: Radiological Society of North America, 2008; 268. [Google Scholar]
- 39.Horsch K, Giger ML, Vyborny CJ, Lan L, Mendelson EB, Hendrick RE. Multi-modality computer-aided diagnosis for the classification of breast lesions: observer study results on an independent clinical dataset. Radiology 2006;240:357–368 [DOI] [PubMed] [Google Scholar]
- 40.Sahiner B, Chan H, Hadjiiski LM, et al. The effect of multi-modality computer classifier on radiologists’ accuracy in characterizing breast masses [abstr]. In: Radiological Society of North America Scientific Assembly and Annual Meeting Program. Oak Brook, Ill: Radiological Society of North America, 2004; 447 [Google Scholar]
- 41.Chen W, Giger ML, Bick U. A fuzzy c-means (FCM) based approach for computerized segmentation of breast lesions in dynamic contrast-enhanced MR images. Acad Radiol 2006;13:63–72 [DOI] [PubMed] [Google Scholar]
- 42.Gibbs P, Turnbull LW. Textural analysis of contrast-enhanced MR images of the breast. Magn Reson Med 2003;50:92–98 [DOI] [PubMed] [Google Scholar]
- 43.Gilhuijs KG, Giger ML, Bick U. Automated analysis of breast lesions in three dimensions using dynamic magnetic resonance imaging. Med Phys 1998;25:1647–1654 [DOI] [PubMed] [Google Scholar]
- 44.Johnson RA, Wichern DW. Applied multivariate statistical analysis 3rd ed.Englewood Cliffs, NJ: Prentice-Hall, 1992 [Google Scholar]
- 45.Kupinski MA, Edwards DC, Giger ML, Metz CE. Ideal observer approximation using Bayesian classification neural networks. IEEE Trans Med Imaging 2001;20:886–899 [DOI] [PubMed] [Google Scholar]
- 46.Metz CE. Some practical issues of experimental design and data analysis in radiological ROC studies. Invest Radiol 1989;24:234–245 [DOI] [PubMed] [Google Scholar]
- 47.Metz CE, Herman BA, Roe CA. Statistical comparison of two ROC-curve estimates obtained from partially-paired datasets. Med Decis Making 1998;18:110–121 [DOI] [PubMed] [Google Scholar]
- 48.Yousef WA, Wagner RF, Loew MH. Estimating the uncertainty in the estimated mean area under the ROC curve of a classifier. Pattern Recognit Lett 2005;26:2600–2610 [Google Scholar]
- 49.Yousef WA, Wagner RF, Loew MH. Assessing classifiers from two independent datasets using ROC analysis: a nonparametric approach. IEEE Trans Pattern Anal Mach Intell 2006;28:1809–1817 [DOI] [PubMed] [Google Scholar]
- 50.Haybittle JL, Blamey RW, Elston VW, et al. A prognostic index in primary breast cancer. Br J Cancer 1982;45:361–366 [DOI] [PMC free article] [PubMed] [Google Scholar]
- 51.Duffy SW, Tabar L, Fagerberg G, et al. Breast screening, prognostic factors and survival: results from the Swedish Two County Study. Br J Cancer 1991;64:1133–1138 [DOI] [PMC free article] [PubMed] [Google Scholar]
- 52.Bloom HJ, Richardson WW. Histological grading and prognosis in breast cancer: a study of 1409 cases of which 539 have been followed up for 15 years. Br J Cancer 1957;11:359–377 [DOI] [PMC free article] [PubMed] [Google Scholar]
- 53.Todd JH, Dowle C, Williams MR, et al. Confirmation of a prognostic index in primary breast cancer. Br J Cancer 1987;56:489–492 [DOI] [PMC free article] [PubMed] [Google Scholar]
Associated Data
This section collects any data citations, data availability statements, or supplementary materials included in this article.


