SUMMARY
The field of nanotechnology holds great promise for the diagnosis and treatment of human disease. However, the size and charge of most nanoparticles preclude their efficient clearance from the body as intact nanoparticles. Without such clearance or their biodegradation into biologically benign components, toxicity is potentially amplified and radiological imaging is hindered. Using quantum dots (QDs) as a model system, we have precisely defined the requirements for renal filtration and urinary excretion of inorganic, metal-containing nanoparticles. Zwitterionic or neutral organic coatings prevented adsorption of serum proteins, which otherwise increased hydrodynamic diameter (HD) by over 15 nm and prevented renal excretion. A final HD smaller than 5.5 nm resulted in rapid and efficient urinary excretion, and elimination of QDs from the body. This study provides a foundation for the design and development of biologically targeted nanoparticles for biomedical applications.
Keywords: Nanotechnology, Quantum Dots, Biodistribution, Clearance, Fluorescence Imaging
Although targeted nanoparticles hold promise for the detection and treatment of human disease, toxicity - either potential or real - remains the major roadblock to clinical translation.1 Historically, the U.S. Food and Drug Administration (FDA) has required that agents injected into the human body, especially diagnostic agents, be cleared completely, in a reasonable amount of time. This policy makes sense in that total body clearance minimizes the area under the exposure curve. It also minimizes the chance that the agent will interfere with other diagnostic tests. For example, gold, used extensively in the nanotechnology literature, has a linear attenuation coefficient 150-fold higher than even bone, and at doses injected intravenously would likely preclude accurate computed tomographic (CT) scanning, especially in organs such as the liver, where it eventually accumulates.
Against this backdrop is the inherent stability of most nanoparticles. Indeed, a recent study suggests that quantum dots (QDs) with the appropriate organic coating are retained in the body for at least two years and remain fluorescent.2 When considering that many nanometer-sized objects proposed for clinical use contain heavy metals, regulatory approval of such stable particles is unlikely, and the type of long-term toxicity studies that would be required for such approval will continue to discourage clinical translation.
A potential solution to this conundrum is to focus on the physiology underlying biodistribution and clearance of agents injected intravenously into the body. For globular proteins, a hydrodynamic diameter (HD) of approximately 5–6 nm is associated with the ability to be cleared rapidly from the body via renal filtration and urinary excretion (Table 1). Nanoparticle toxicity would be minimized, if not eliminated, if there were a way to clear them from the body. However, currently it is unknown what the renal filtration threshold is for metal-based nanometer-sized objects, and which organic coatings are compatible with renal clearance. In this study, we employ fluorescent QDs as a model system to define the HD and surface charge combination that permits rapid body elimination of nanometer-sized objects.
Table 1.
Biodistribution and Renal Filtration as a Function of Hydrodynamic Diameter
| Molecule | MW (kDa) | HD (nm) | Urine/Blood filterability (%) | Blood Half-life (min) | Whole Body Half-Life (hr) | Ref |
|---|---|---|---|---|---|---|
| Inulin | 5.0 | 3.0 | 100 | 8.8 | 1.9 | 18,19 |
| Lysozyme | 15 | 3.4 | 80 | 12 | 1.3 | 20, 21 |
| Myoglobin | 17 | 3.8 | 75 | 8.9 | 2.0 | 20, 22 |
| scFv | 30 | 5.3* | 74 | 11 | 1.4 | 5 |
| Bence-Jones | 44 | 6.1* | 10 | – | 3.0 | 23,24 |
| Fab’ | 50 | 6.0 | 9 | 28 | 4.0 | 4,20 |
| Sc(Fv)2 | 60 | 7.0* | – | 78 | 5.1 | 5 |
| HSA | 67 | 7.3* | 0.3 | 110 | 16 | 22 |
| [sc(Fv)2]2 | 120 | 9.3* | – | 170 | 8.9 | 5 |
| IgG | 152 | 11.0 | < 0.1 | 330 | 730 | 5, 20 |
Unknown HDs were calculated using the following power law fit to literature values: HD = A × MW^B + C × MW^D. Where: A = –0.000000002614; B = 3.326; C = 0.9482; D = 0.5001; R2 = 0.999.
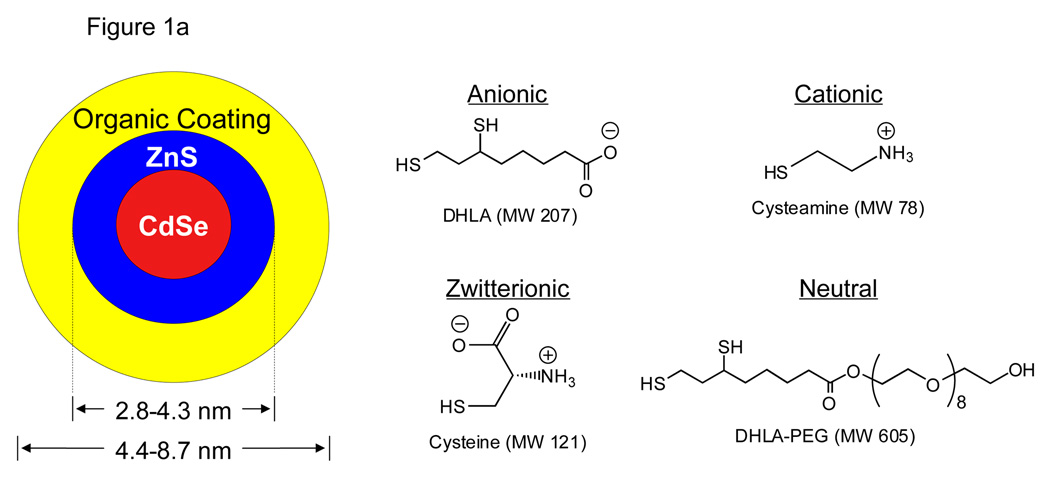
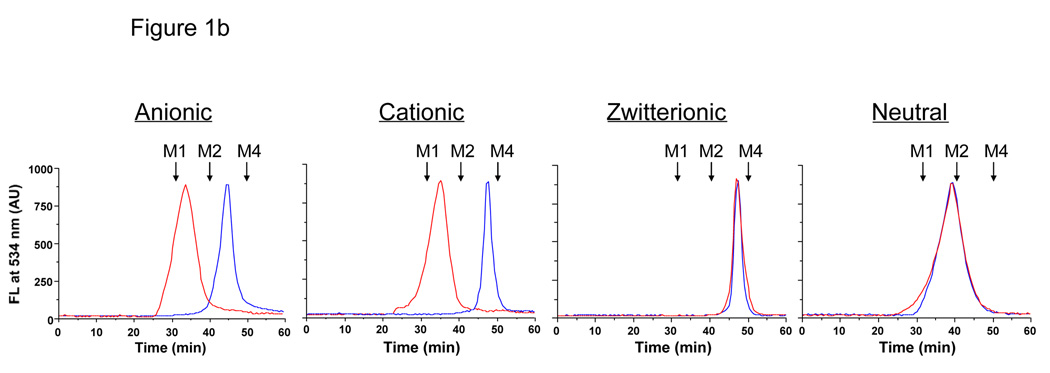
In order to define the renal filtration threshold, a precise size-series of extremely small QDs was synthesized. All QDs had a CdSe/ZnS core/shell, which was coated with anionic (dihydrolipoic acid; DHLA), cationic (cysteamine), zwitterionic (cysteine), or neutral (DHLA-connected polyethylene glycol; DHLA-PEG) small molecules (Fig. 1a). The charge of the coating had a profound effect on the adsorption of serum proteins as well as the HD; purely anionic or cationic charge was associated with an increase in HD of over 15 nm after incubation with serum (Fig. 1b). Although neutral (PEGylated) QDs did not bind serum protein, it was not possible to synthesize them with an HD less than ≈ 13.2 nm. Shorter PEG lengths resulted in insoluble QDs.3 Surprisingly, zwitterionic coatings, in this case the amino acid cysteine (Cys), prevented serum protein adsorption while producing the highest solubility and the smallest possible HD.
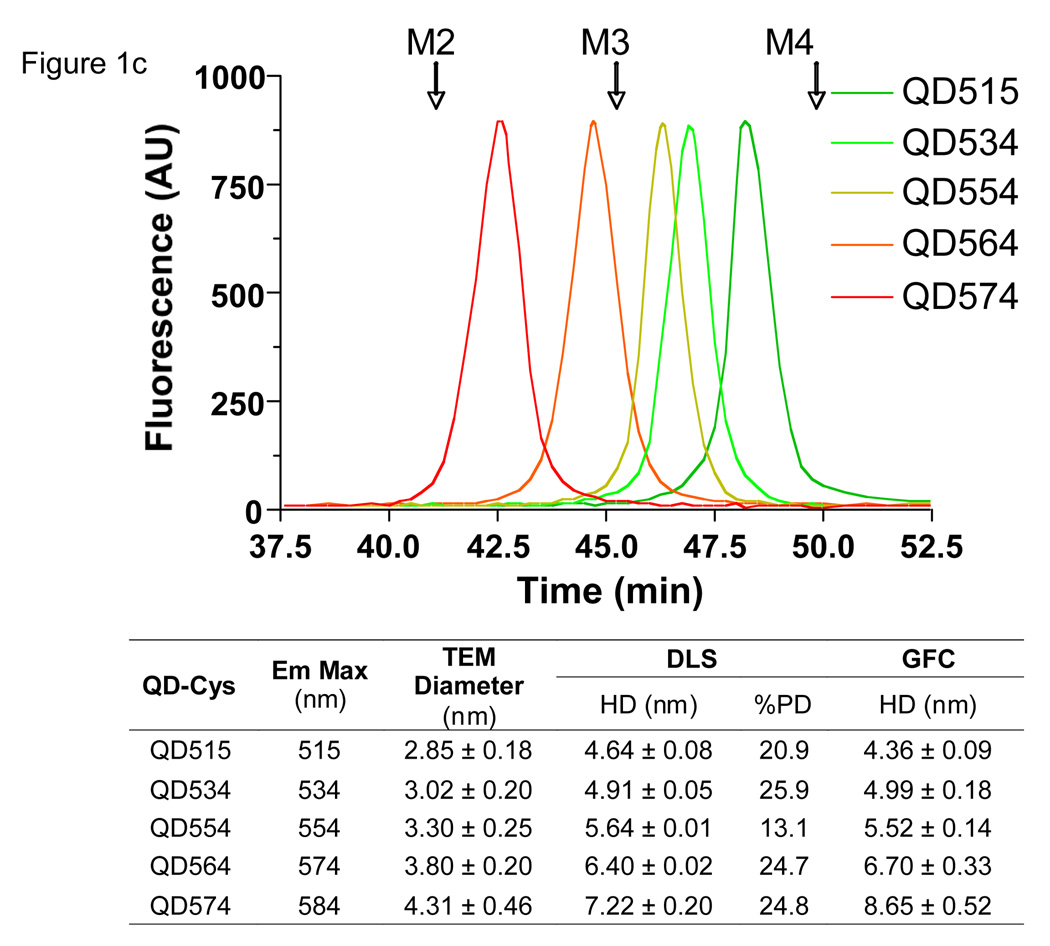
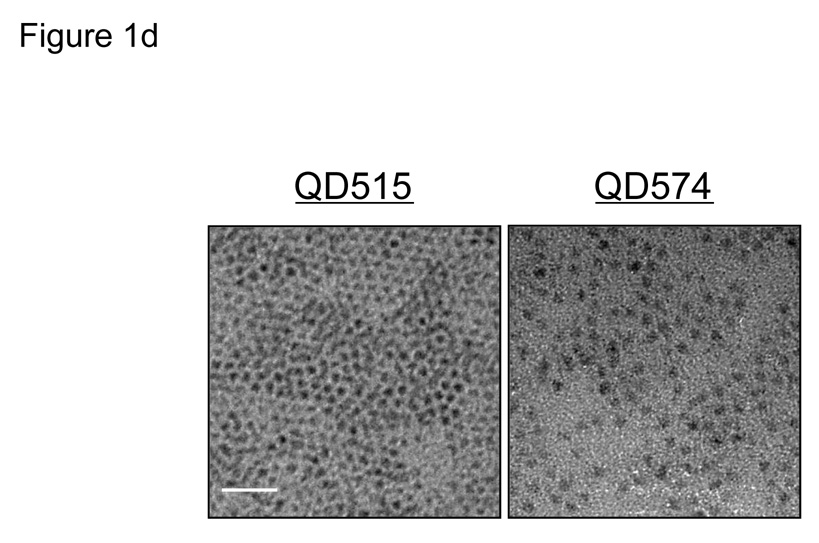
Fig. 1. Design of fluorescent QDs, measurement of hydrodynamic diameter, and interaction of the organic coating with serum proteins.
a. Chemical compositions of CdSe/ZnS QDs with DHLA (anionic), cysteamine (cationic), cysteine (zwitterionic), and DHLA-PEG (neutral) coatings.
b. GFC (mobile phase = PBS, pH 7.4) of QDs (CdSe/ZnS core/shell, diameter 3.02 nm) with organic coatings shown in (a) after treatment with PBS, pH 7.4 (blue line) or FBS (red line). λexc = 414 nm. λem = 534 nm. Molecular weight markers M1 (thyroglobulin; 669 kDa, 18.0 nm HD), M2 (γ-globulin; 158 kDa, 11.9 nm HD), M3 (ovalbumin; 44 kDa, 6.13 nm HD), and M4 (myoglobin; 17 kDa, 3.83 nm HD) are shown by arrows.
c. GFC (mobile phase = PBS, pH 7.4) of QD-Cys of various hydrodynamic diameters. λexc = 414 nm. λem = 554 nm. Molecular weight markers (arrows) are as described in (a). Also shown are the peak emission wavelengths as a function of core/shell diameter measured by TEM, DLS, and GFC. TEM size data for each sample was determined from the average of at least 150 measurements. DLS and GFC measurements (mean ± S.D.) were from N = 3 independent experiments. %PD = poly-dispersity.
d. TEM pictures of QD515 (left, core/shell 2.85 nm) and QD574 (right, core/shell 4.31 nm). Scale bar = 20 nm.
Cys-coated QDs (QD-Cys) were characterized by three independent sizing methods (Fig. 1c). Transmission electronic microscopy (TEM) was used to measure core/shell diameter, which as expected, increased with peak fluorescence emission (Fig. 1d). Dynamic light scattering (DLS) and gel-filtration chromatography (GFC) were highly correlated with respect to HD after addition of the organic coating (Fig. 1c and Supplementary Fig. 1 online). Using these methods, it was possible to create a series of QD-Cys, ranging in final HD from 4.36–8.65 nm and differing only in peak emission wavelength (515–574 nm; i.e., QD515–QD574; Fig. 1e and Supplementary Fig. 2 online), whose HD and stability were unchanged after 4 hr incubation with 37°C serum. Electron paramagnetic resonance (EPR) spectroscopy on QD-Cys samples incubated with spin trapping 5,5-dimethyl-1-pyrroline-N-oxide (DMPO) confirmed that radicals were not produced during photon absorption (see Supplementary Fig. 3 online).
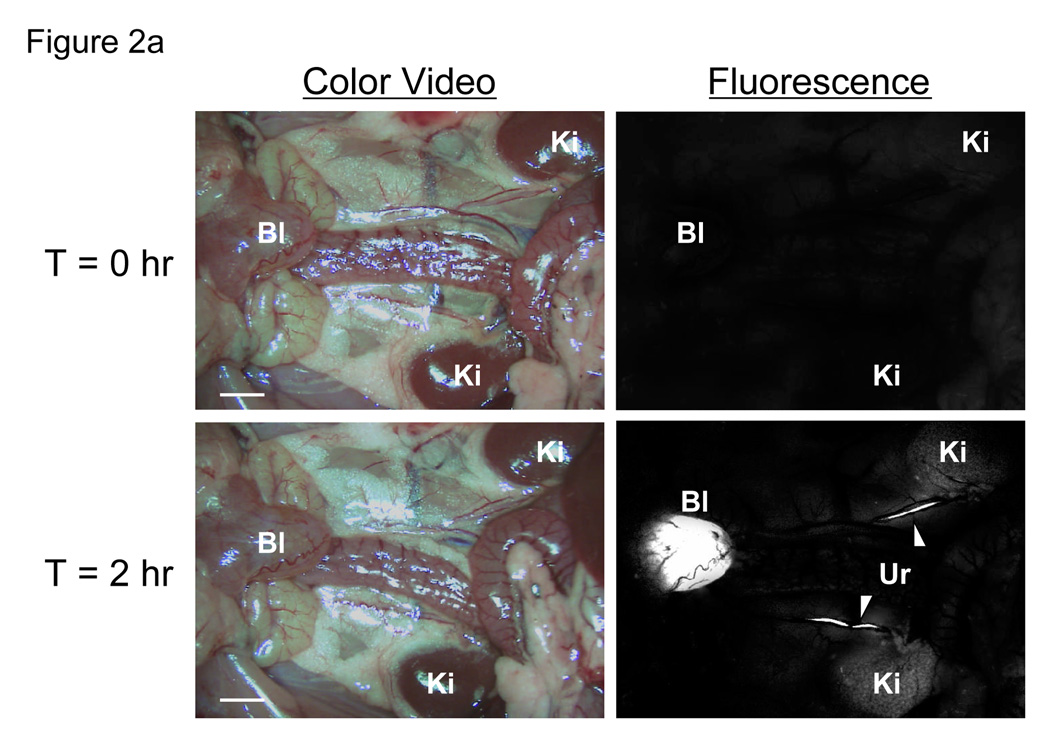
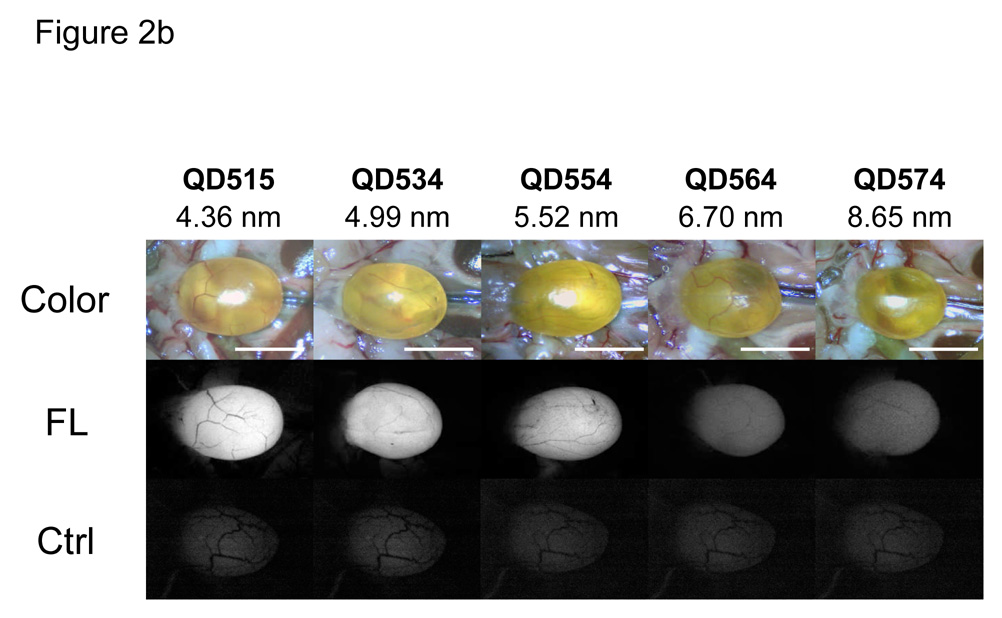
Initial studies focused on the smallest fluorescent nanoparticle, QD515. After dilution into sterile saline and intravenous injection into rat at a dose of 10 pmol/g animal weight, the renal excretion of Cys-coated QD515 could be visualized directly, as could its transport down the ureters bilaterally and into the bladder (Fig. 2a and Supplementary Video). Comparison of all QD HDs in mice revealed that at 4-hr post-injection, only QD515 (HD = 4.36 nm), QD534 (HD = 4.99 nm), and QD554 (HD = 5.52 nm) could be found excreted into the bladder (Fig. 2b), with intensity decreasing as HD increased. The larger QDs including DHLA-, cysteamine-, and DHLA-PEG-coated ones, were never found in the bladder, but instead were trapped in the liver, lung, and spleen in large amounts (data not shown).
Fig. 2. In vivo fluorescence imaging of intravenously injected QD-Cys.
a. Kidneys (Ki), ureters (Ur; arrowheads) and bladder (Bl) either T = 0 (top) or T = 2 hr (bottom) after intravenous injection of QD515 into the rat. Scale bar = 1 cm.
b. Surgically exposed CD-1 mouse bladders after intravenous injection of QD515, QD534, QD554, QD564, or QD574 of defined HD. Shown are color video (top) and fluorescence images (bottom) for uninjected control bladder (Ctrl) and 4 hr post-injection (FL) for each QD. A 525 ± 25 nm emission filter was used for QD515 and QD534. A 560 ± 20 nm filter was used for QD554, QD564, and QD574. The exposure time (200 ms) and normalizations were the same for all fluorescence images. Scale bar = 1 cm.
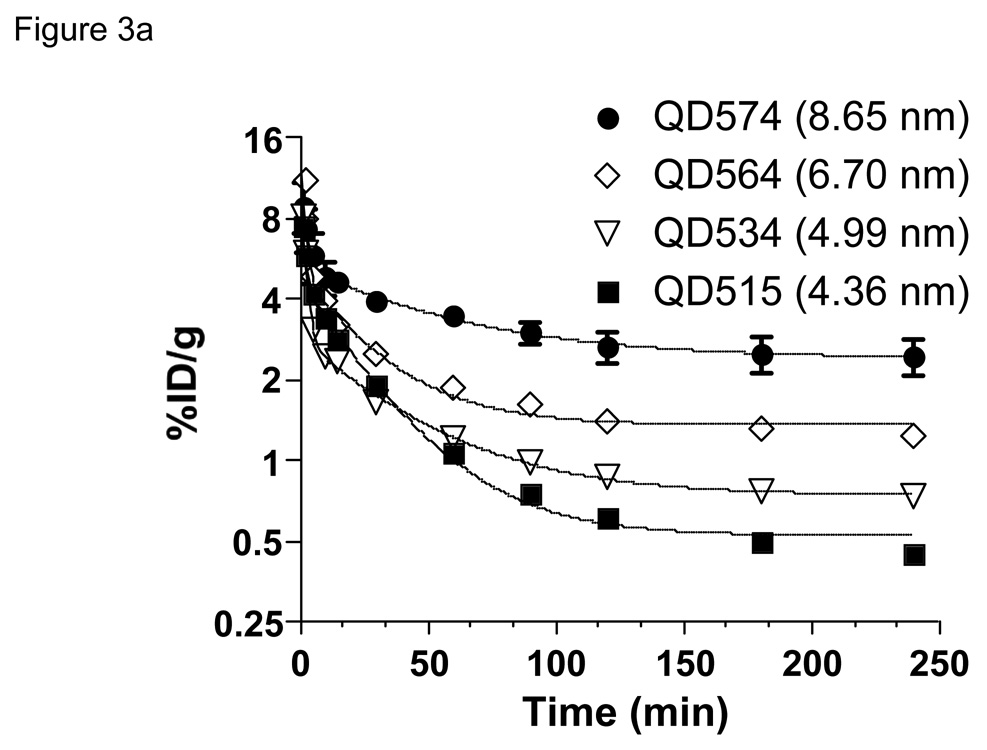
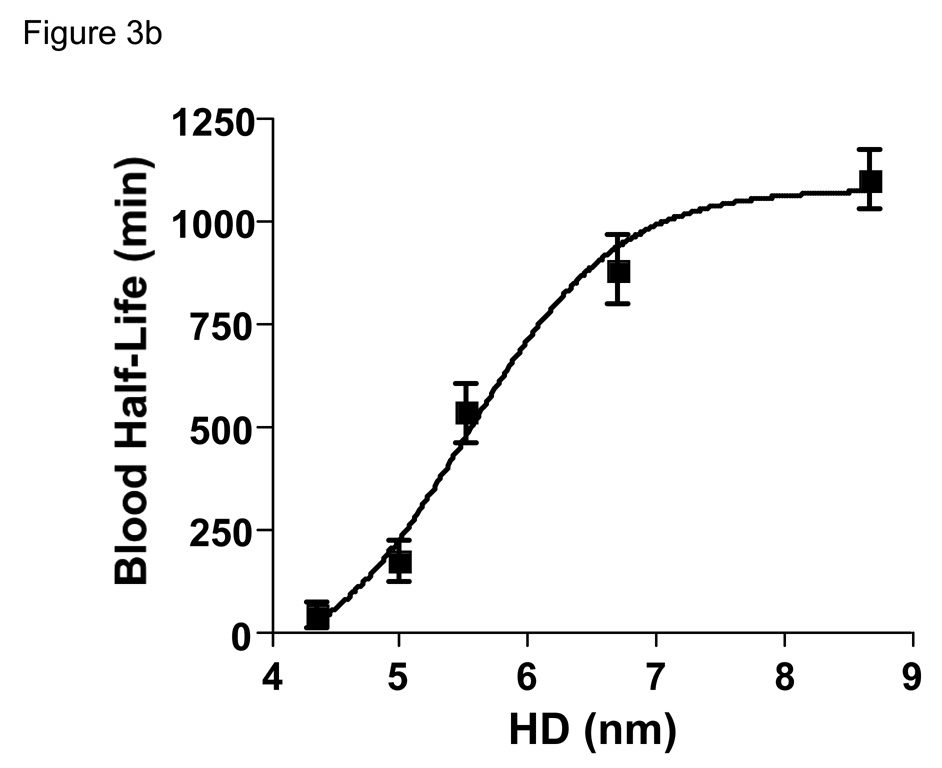
Since in vivo fluorescence imaging provides only qualitative/semi-quantitative measurement of QD behavior in vivo, we developed a technique to label the QD-Cys surface covalently with a chelated form of the gamma ray-emitting isotope 99mTc. Despite non-covalent interaction of Cys with the QD surface, no aggregates were detectable by HPLC analysis, and the amount of unbounded isotope was less than 10% in each preparation. Intravenous injection of 99mTc-labeled QDs revealed that changes in final HD resulted in dramatic changes in blood half-life (Fig. 3a). Indeed, based on the β-phase terminal half-life (t1/2β), the blood half-life of QDs ranged from 48 minutes to 20 hr as the HD increased from 4.36 to 8.65 nm (Fig. 3b).
Fig. 3. Blood clearance, biodistribution, and total body clearance of nano-sized objects.
a. Blood concentration (%ID/g) of 99mTc-labeled QDs after intravenous injection into CD-1 mice. Each data point is the mean ± S.D. from N = 5 animals.
b. Blood half-life (mean ± 95% confidence intervals) as a function of HD calculated from the data in Fig. 3a.
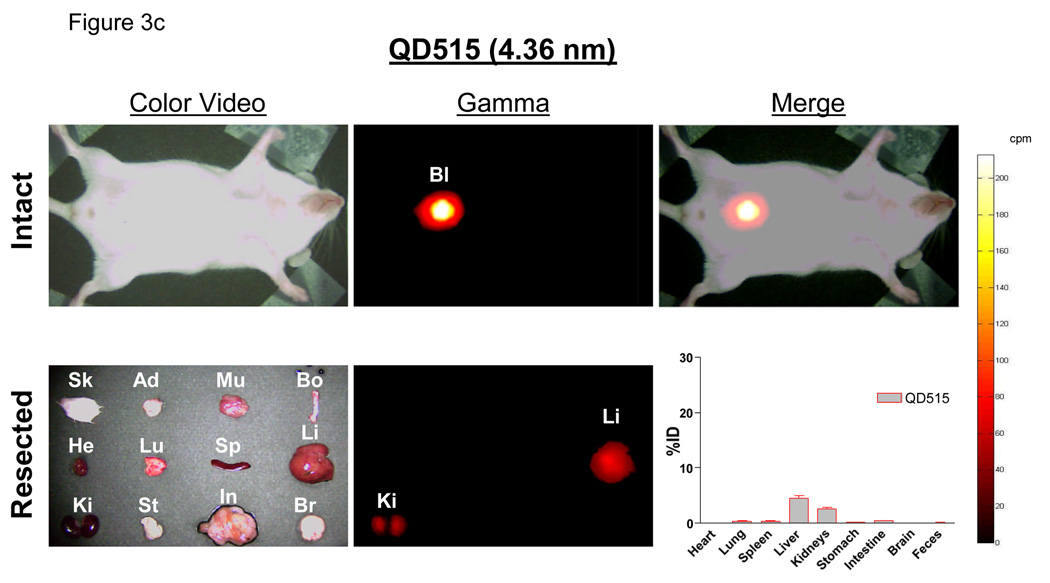
c. Radioscintigraphic images of 99mTc-QD515 (4.36 nm) 4 hr post-intravenous injection. Shown are the color video (left) and Anger camera gamma-ray images (middle) of the intact animal immediately after sacrifice (top row), and of organs after resection (bottom row). Also shown are the merge of the color video and gamma images (top right) and the quantitative distribution of 99mTc-QD515 in all organs after well counting (bottom right). Abbreviations used are: Sk, skin; Ad, adipose; Mu, muscle; Bo, bone; He, heart; Lu, lungs; Sp, spleen; Li, liver; Ki, kidneys; St, stomach; In, intestine; Br, brain; and Bl, bladder. Each point represents the mean ± S.D. of N = 5 animals.
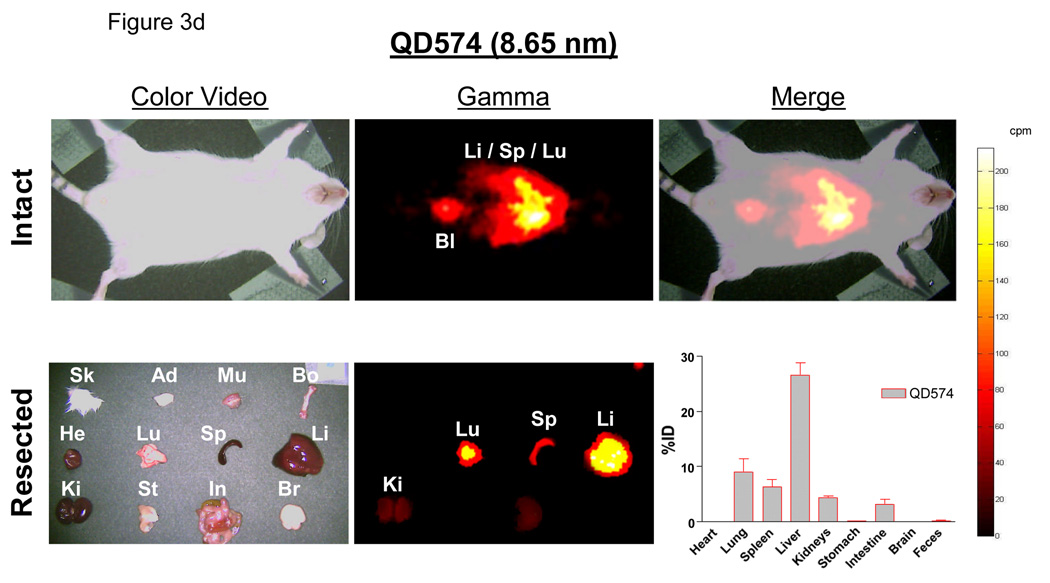
d. In vivo analysis of 99mTc-QD574 (8.65 nm) as described for Fig. 3c.
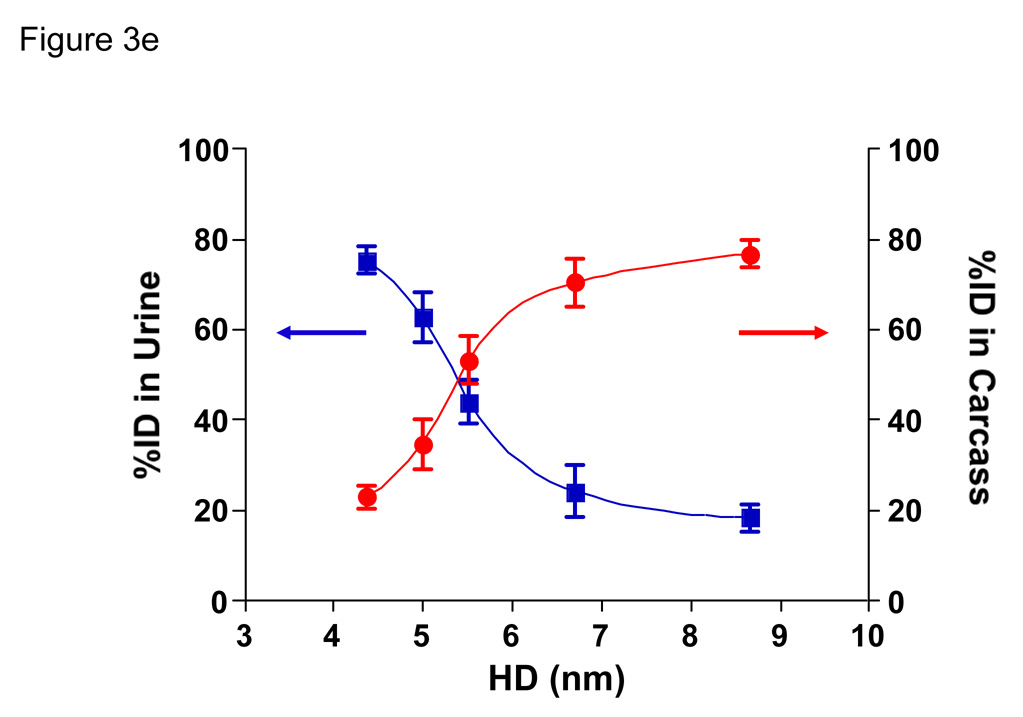
e. Urine excretion (blue curve) and carcass retention (red curve) of 99mTc-QDs of various HDs 4 hr after intravenous injection into CD-1 mice. Each point represents the mean ± S.D. of N = 5 animals.
Using 99mTc-labeled QDs, it was possible to follow distribution and clearance in all organs, and from the body itself, over time. Importantly, radiolabeled QDs remained intact, even after excretion into urine (see Supplementary Fig. 4 online), suggesting that gamma ray emission could be used as a reliable surrogate for QD distribution. Four-hours post-intravenous injection of QD515 (HD = 4.36 nm), the dominant signal was in the bladder, with the only appreciable organ distribution being liver (4.5 ±1.0 %ID) and kidney (2.6 ±0.4 %ID), with the latter likely representing QDs in the process of being excreted (Fig. 3c). In contrast, QD574 (HD = 8.65 nm) exhibited high uptake in liver (26.5 ±3.9%ID), lung (9.1 ± 4.0%ID), and spleen (6.3 ±2.4%ID) and a proportionally lower signal in bladder (Fig. 3d).
By measuring the radioactivity of both excreted and pre-excreted urine, as well as the entire remaining carcass excluding bladder and urethra, it was possible to define the relationship between HD, renal clearance, and total body retention. As shown in Fig. 3e, this relationship was sigmoidal, with the 50% point for total body clearance of QDs at 4 hr being an HD ≈ 5.5 nm.
Inorganic, metal-containing nanoparticles require a solubilizing organic coating for biological (i.e., aqueous) compatibility. In the case of QDs, this coating is also a requirement for maintaining photoluminescence efficiency. Unfortunately, in order to achieve biocompatibility, organic coatings often result in a significant increase of the final HD. Our results suggest that both the molecular weight and charge of the solubilizing ligand contribute to final HD in vivo, and that pure charge (anionic or cationic) is associated with unexpected serum protein adsorption. This adsorption did not appear to affect solubility, but increased HD by almost 15 nm.
Nanoparticle HD is a critical design parameter in the development of potential diagnostic and therapeutic agents. The mammalian vasculature has an average pore size of ≈ 5 nm. Below this value, there is relatively fast equilibrium between agents injected intravenously and the extracellular space, but above this value, transport across the endothelium is remarkably slow. For example, human IgG (HD = 10 nm) requires approximately 24 hr to equilibrate between the vascular and extracellular spaces after intravenous injection.4,5 To a first approximation, glomerular filtration in the kidney is controlled by similar effective pore sizes, and renal excretion is a strong function of HD (Table 1). For nanoparticles that do not biodegrade in vivo into biologically benign components, the only other major route of excretion from the human body is through the liver, into bile, and into feces. The problems with liver excretion for nanoparticles are three-fold. First, the liver is designed specifically to capture and eliminate nanoparticles (e.g., viruses) over ≈ 10–20 nm in HD. Hence, special coatings such as PEG are required just to prevent first-pass extraction from the reticuloendothelial system (RES; liver, spleen, and bone marrow), but these coatings necessarily increase HD. Dense PEGylation might increase blood half-life, but it also precludes elimination from the body. Second, excretion of intact nanoparticles into bile is an extremely slow and inefficient process. Third, long-term retention in the RES leads to a large area under the exposure-time curve and increases the likelihood of toxicity. At the very least, our data suggest that analysis of bodily fluids, including urine and bile, should be part of human risk assessment after environmental exposure to nanoparticles, and can help estimate total retained dose if the exposure dose is known.
The importance of total body clearance of nanometer-sized objects is not a trivial one. Consider, for example, what would occur if retention affected other medical tests. Radiological tests are particularly susceptible. Metals with high atomic numbers deposited in organs would interfere with x-ray imaging (i.e., plain films, fluoroscopy, and CT) due to changes in linear attenuation coefficient, magnetic resonance imaging due to proton-free voids, ultrasound due to increased echogenicity, and possibly even SPECT and PET due to photon attenuation (both) and/or effects on positronium production (PET). Renally-cleared nanoparticles, even metal-containing ones, would minimize or eliminate these problems.
Several caveats, though, must be considered. First, the absolute value for the renal filtration threshold (HD = 5.5 nm in this study) depends on the calibration curves of the sizing techniques. Since the reported HDs of the molecules used for calibration vary in the literature by as much as 10%, so too must our confidence in the 5.5 nm cutoff. For this reason, it will be important to test each nanometer-sized object independently in vivo, and not rely solely on in vitro predictions. Second, our study has not addressed the effect of nanoparticle shape on renal filtration. For example, quantum rods6 and other non-spherical nanoparticles will need separate in vivo analyses. If eventual results correlate with those from long rigid proteins, it is likely that the long axis of the particle will dominate its in vivo behavior. Finally, our study suggests that molecularly targeting QDs and other nanoparticles requires careful attention to HD. Indeed, our results suggest that only extremely small targeting molecules will be of use for in vivo targeting if renal excretion is to be maintained. Fortunately, the increased affinity associated with multimerization of such ligands on the QD surface7 may permit a small number of targeting ligands to be used relative to coating ligands.
Thus far, few nanometer-sized objects are being actively translated to the clinic. Our study suggests that in order to satisfy both patient safety and regulatory review, nanoparticle biodistribution and clearance must be carefully considered. We propose three criteria for distinguishing a nanoparticle that has potential clinical utility: 1) a final HD ≤ 5.5 nm to permit complete elimination from the body and/or 2) a formulation with completely non-toxic components and/or 3) biodegradability to clearable components. We suggest that without satisfying these criteria, metal containing nanoparticles will have limited clinical utility.
METHODS
Synthesis of CdSe/ZnS Core/Shells
CdSe/ZnS Core/shell nanocrystals were synthesized using the following methods: QD515,8 QD534,9,10 QD554,9,10 QD564,9,10 and QD574.9,10 See Supplementary Methods for detailed experimental methods.
DHLA and DHLA-PEG Organic Coatings
Dihydrolipoic acid (DHLA) and DHLA conjugated to a polyethylene glycol spacer (n = 8, DHLA-PEG) was prepared using procedures from the literature.3,11 Ligand exchange was performed according to reported procedures,3,11 with modifications. Briefly, an aliquot of QD growth solution (0.2 mL) was precipitated with the addition of acetone followed by centrifugation at 3500 g for 4 min. The supernatant was discarded, and 50 µL of neat DHLA or DHLA-PEG along with 50 µL of MeOH was added to the pellet. The mixture was stirred at 60° C for 2 hr and precipitated with the addition of ethanol, chloroform, and hexane followed by centrifugation at 3500 g for 4 min. The supernatant was discarded and the QD sample was redispersed in PBS (pH 7.4) for analysis.
Cysteine and Cysteamine Organic Coatings
Ligand exchange with cysteine and cysteamine were carried out using a biphasic exchange method, in which QDs size-selectively precipitated twice using acetone were redispersed in CHCl3 to which a solution of cysteine (40 mg/mL) or cysteamine (50 mg/mL) in PBS (1 mL) was added. This biphasic mixture was stirred vigorously for 2–6 hr until the organic layer became colorless. The CHCl3 phase was removed by pipette, and residual organic solvent removed under reduced pressure. The QDs were precipitated twice with the addition of ethanol and redispersed in PBS (pH 7.4) for analysis. The cysteine-coated QDs (QD-Cys) were stabilized by adding dithiothreitol (DTT, 1 mM) to prevent the dimerization of cysteine. QD-Cys formulations treated in this fashion are stable for up to 1 week in PBS, pH 7.4 storage buffer under ambient conditions, and exhibit quantum yields (QY) between 10–15% (see Supplementary Methods and Supplementary Fig. 5 online). Prior to conjugation, any free ligands were removed by three cycles of dilution/concentration through Vivaspin 6 (MWCO 10,000) spin concentrators (Vivascience, Stonehouse, UK).
TEM Sizing of QD Core/Shell
The size of CdSe/ZnS core/shell structures was measured using a JEOL 200CX TEM operating at 200 kV. One drop of a dilute sample of QDs in hexane was placed onto a Formvar coated copper grid, allowed to settle for 20 seconds, and wicked away using an absorbent tissue. Size analysis was performed on captured digital images using ImageJ V. 1.34s.
HD Measurements by Dynamic Light Scattering
Light scattering analysis was performed on a DynaPro Dynamic Light Scattering system (Qyatt, Santa Barbara, CA). The concentration of stock QDs was 2–3 µM, and all QDs were filtered through a 0.02 µm filter before analysis. Typical count rates were between 100–300 kHz. Each autocorrelation function (ACF) was acquired for 10 seconds, and averaged for 10 minutes per measurement. A software filter was employed to discard all ACF fits with sum of squares errors >15. The resulting ACF was fitted using the Dynamics V6 software employing a non-negative least squares fitting algorithm. Hydrodynamic size data were obtained from a mass weighted size distribution analysis and reported as the mean of triplicate measurements ± SD.
Gel-Filtration Chromatography (GFC)
Details of the custom GFC system, which permits online, full-spectrum analysis of QD absorbance and fluorescence, have been published previously.12 GFC was performed on a Superose-6 10/300 GL column (Amersham Biosciences, Piscataway, NJ) using PBS, pH 7.4 supplemented with 1 mM cysteine as mobile phase. Flow rate was 0.4 mL/min. Calibration (see Supplementary Methods) of HD was performed by injecting 50 µL of protein standards (cat. 151-1901, Bio-Rad, Hercules, CA) containing thyroglobulin (669 kDa, 18.0 nm HD), γ-globulin (158 kDa, 11.9 nm HD), ovalbumin (44 kDa, 6.13 nm HD), myoglobin (17 kDa, 3.83 nm HD), and vitamin B12 (1.35 kDa, 1.48 nm HD). All HD measurements were performed with three independent experiments. For measurement of the effects of serum protein adsorption, 1 µM QDs were incubated in PBS or 100% fetal bovine serum (FBS) for 4 hr at 37°C prior to loading 100 µL onto the GFC column.
99mTc-Labeling of QDs
Preparation of high-specific-activity N-hydroxysuccinimide (NHS) ester of 99mTc-MAS3, in neat aprotic solvent, has been described previously.13 See Supplementary Methods for detailed experimental methods and Supplementary Figure 6. 99mTc-QD conjugation was performed by the addition of 80 µL of 99mTc-MAS3-NHS (2 mCi) in DMSO to 1 mL of QDs (1 µM) in PBS, pH 7.8. After stirring for 1 hr, the radiolabeled conjugates were purified by washing five times in Vivaspin concentrators (MWCO 10,000) with pH 7.4 PBS and analyzed by RP-HPLC on a 8 × 300 mm, 200 Å Diol (YMC, Kyoto, Japan) size-exclusion column using PBS, pH 7.4 supplemented with 1 mM cysteine as mobile phase. Details of the RP-HPLC system have been described previously.14
Animal Models
Animals were housed in an AAALAC-certified facility staffed by full-time veterinarians, and were studied under the supervision of an approved institutional protocol. 300–350 g Sprague-Dawley (SD) male rats were purchased from Taconic Farms (Germantown, NY) and 30 g CD-1 male mice were from Charles Laboratories (Wilmington, MA). All animals acclimated to the animal facility for at least 48 hr prior to experimentation. For surgery, rats and mice were anesthetized with 65 mg/kg intraperitoneal pentobarbital. QDs in saline (N = 5 mice each) were administered intravenously at a dose of 10 pmol/g of animal weight (1 mL of a 3 µM stock solution for rats and 100 µL of a 3 µM stock solution for mice). After each study, animals were euthanized by intraperitoneal injection of 200 mg/kg pentobarbital, a method consistent with the recommendations of the Panel on Euthanasia of the American Veterinary Medical Association.
Intraoperative Fluorescence Imaging
An intraoperative fluorescence imaging system optimized for animal surgery has been described in detail previously.15–17 For fluorescence excitation, three 100 mW L470-66-60 LEDs (Marubeni Epitex, New York, NY) fitted with 470 ±20 nm excitation filters in custom holders were used. Emission filters were 525 ± 25 nm or 560 ± 20 nm, depending on QD. The exposure time (200 ms) and normalizations were the same for all fluorescence images. Color video was collected on a separate optical channel using computer-controlled camera acquisition via custom LabVIEW (National Instruments, Austin, TX) software.
QD Biodistribution and Clearance
100 µL of 3 µM 99mTc-QDs (~250 µCi) were administered intravenously to N = 5 CD-1 mice per QD. Mice were housed in special cages to allow for the collection of urine and feces. Measurement of blood clearance was performed by intermittent sampling of the tail vein. Mice were sacrificed at 4 hr post-injection. To measure total urinary excretion, the ureters and urethra were ligated with silk sutures, and the bladder removed en masse and combined with excreted urine, prior to measurement of radioactivity in a dose calibrator. The remaining carcass was also measured in a dose calibrator, then the skin, adipose, muscle, bone, heart, lungs, spleen, liver, kidneys, stomach, intestine, brain, and feces were resected, washed twice in PBS, pH 7.4, weighed, and their radioactivity measured on a Wallac Wizard (model 1470, Perkin Elmer, Wellesley, MA) 10-detector gamma counter. Curve fitting was performed using Prism version 4.0a (GraphPad, San Diego, CA) software. Gamma radioscintigraphy was performed with a Research Digital Camera (Isocam Technologies, Castana, IA) equipped with a 1/2" NaI crystal, 86 photomultiplier tubes, and high-resolution (1 mm) low-energy lead collimator.
Supplementary Material
Note: Supplementary Information is available on the Nature Biotechnology website.
ACKNOWLEDGMENTS
The Biophysical Instrumentation Facility for the Study of Complex Macromolecular Systems (NSF-0070319 and NIH GM68762) is gratefully acknowledged. This work was supported in part by the US National Science Foundation–Materials Research Science and Engineering Center Program under grant DMR-9808941 (MGB), and NIH grant # R21/R33 EB-000673 (JVF and MGB). MGB also acknowledges support from the NIH funded MIT-Harvard NanoMedical Consortium (1U54-CA119349, a Center of Cancer Nanotechnology Excellence). We thank Barbara L. Clough for medical editing and Grisel Vazquez for administrative assistance.
Footnotes
COMPETING INTERESTS STATEMENT
The authors declare that they have no competing financial interests.
REFERENCES
- 1.Hardman R. A toxicologic review of quantum dots: toxicity depends on physicochemical and environmental factors. Environ Health Perspect. 2006;114:165–172. doi: 10.1289/ehp.8284. [DOI] [PMC free article] [PubMed] [Google Scholar]
- 2.Ballou B, et al. Sentinel lymph node imaging using quantum dots in mouse tumor models. Bioconjug Chem. 2007;18:389–396. doi: 10.1021/bc060261j. [DOI] [PubMed] [Google Scholar]
- 3.Uyeda HT, Medintz IL, Jaiswal JK, Simon SM, Mattoussi H. Synthesis of compact multidentate ligands to prepare stable hydrophilic quantum dot fluorophores. J Am Chem Soc. 2005;127:3870–3878. doi: 10.1021/ja044031w. [DOI] [PubMed] [Google Scholar]
- 4.Chapman AP, et al. Therapeutic antibody fragments with prolonged in vivo half-lives. Nat Biotechnol. 1999;17:780–783. doi: 10.1038/11717. [DOI] [PubMed] [Google Scholar]
- 5.Goel A, et al. Genetically engineered tetravalent single-chain Fv of the pancarcinoma monoclonal antibody CC49: improved biodistribution and potential for therapeutic application. Cancer Res. 2000;60:6964–6971. [PubMed] [Google Scholar]
- 6.Fu A, et al. Semiconductor quantum rods as single molecule fluorescent biological labels. Nano Lett. 2007;7:179–182. doi: 10.1021/nl0626434. [DOI] [PMC free article] [PubMed] [Google Scholar]
- 7.Mammen M, Choi SK, Whitesides GM. Polyvalent interactions in biological systems: implications for design and use of multivalent ligands and inhibitors. Angew Chem Int Ed Engl. 1998;37:2754–2794. doi: 10.1002/(SICI)1521-3773(19981102)37:20<2754::AID-ANIE2754>3.0.CO;2-3. [DOI] [PubMed] [Google Scholar]
- 8.Peng ZA, Peng X. Formation of high-quality CdTe, CdSe, and CdS nanocrystals using CdO as precursor. J Am Chem Soc. 2001;123:183–184. doi: 10.1021/ja003633m. [DOI] [PubMed] [Google Scholar]
- 9.Dabbousi BO, et al. (CdSe)ZnS core-shell quantum dots: synthesis and characterization of a size series of highly luminescent nanocrystallites. J Phys Chem B. 1997;101:9463–9475. [Google Scholar]
- 10.Fisher BR, Eisler H-J, Stott NE, Bawendi MG. Emission intensity dependence and single-exponential behavior in single colloidal quantum dot fluorescence lifetimes. J Phys Chem B. 2004;108:143–148. [Google Scholar]
- 11.Mattoussi H, et al. Self-assembly of CdSe-ZnS quantum dot bioconjugates using an engineered recombinant protein. J Am Chem Soc. 2000;122:12142–12150. [Google Scholar]
- 12.Frangioni JV, Kim SW, Ohnishi S, Kim S, Bawendi MG. Sentinel Lymph Node Mapping With Type-II Quantum Dots. Methods Mol Biol. 2007;374:147–160. doi: 10.1385/1-59745-369-2:147. [DOI] [PMC free article] [PubMed] [Google Scholar]
- 13.Misra P, Humblet V, Pannier N, Maison W, Frangioni JV. Production of multimeric prostate-specific membrane antigen small molecule radiotracers using a solid-phase 99mTc pre-loading strategy. J Nuc Med. 2007 doi: 10.2967/jnumed.107.040303. In Press. [DOI] [PMC free article] [PubMed] [Google Scholar]
- 14.Humblet V, Misra P, Frangioni JV. An HPLC/mass spectrometry platform for the development of multimodality contrast agents and targeted therapeutics: prostate-specific membrane antigen small molecule derivatives. Contrast Media Mol Imaging. 2006;1:196–211. doi: 10.1002/cmmi.106. [DOI] [PMC free article] [PubMed] [Google Scholar]
- 15.Kim S, et al. Near-infrared fluorescent type II quantum dots for sentinel lymph node mapping. Nat Biotechnol. 2004;22:93–97. doi: 10.1038/nbt920. [DOI] [PMC free article] [PubMed] [Google Scholar]
- 16.De Grand AM, Frangioni JV. An operational near-infrared fluorescence imaging system prototype for large animal surgery. Technol Cancer Res Treat. 2003;2:553–562. doi: 10.1177/153303460300200607. [DOI] [PubMed] [Google Scholar]
- 17.Nakayama A, del Monte F, Hajjar RJ, Frangioni JV. Functional near-infrared fluorescence imaging for cardiac surgery and targeted gene therapy. Mol Imaging. 2002;1:365–377. doi: 10.1162/15353500200221333. [DOI] [PubMed] [Google Scholar]
- 18.Pappenheimer JR, Renkin EM, Borrero LM. Filtration, diffusion and molecular sieving through peripheral capillary membranes; a contribution to the pore theory of capillary permeability. Am J Physiol. 1951;167:13–46. doi: 10.1152/ajplegacy.1951.167.1.13. [DOI] [PubMed] [Google Scholar]
- 19.Prescott LF, McAuslane JA, Freestone S. The concentration-dependent disposition and kinetics of inulin. Eur J Clin Pharmacol. 1991;40:619–624. doi: 10.1007/BF00279982. [DOI] [PubMed] [Google Scholar]
- 20.Olmsted SS, et al. Diffusion of macromolecules and virus-like particles in human cervical mucus. Biophys J. 2001;81:1930–1937. doi: 10.1016/S0006-3495(01)75844-4. [DOI] [PMC free article] [PubMed] [Google Scholar]
- 21.Hansen NE, Karle H, Andersen V. Lysozyme turnover in the rat. J Clin Invest. 1971;50:1473–1477. doi: 10.1172/JCI106632. [DOI] [PMC free article] [PubMed] [Google Scholar]
- 22.Lund U, et al. Glomerular filtration rate dependence of sieving of albumin and some neutral proteins in rat kidneys. Am J Physiol Renal Physiol. 2003;284:F1226–F1234. doi: 10.1152/ajprenal.00316.2002. [DOI] [PubMed] [Google Scholar]
- 23.Solomon A, Waldmann TA, Fahey JL, McFarlane AS. Metabolism of Bence Jones Proteins. J Clin Invest. 1964;43:103–117. doi: 10.1172/JCI104884. [DOI] [PMC free article] [PubMed] [Google Scholar]
- 24.Bradwell AR, Carr-Smith HD, Mead GP, Harvey TC, Drayson MT. Serum test for assessment of patients with Bence Jones myeloma. Lancet. 2003;361:489–491. doi: 10.1016/S0140-6736(03)12457-9. [DOI] [PubMed] [Google Scholar]
Associated Data
This section collects any data citations, data availability statements, or supplementary materials included in this article.
Supplementary Materials
Note: Supplementary Information is available on the Nature Biotechnology website.


