Abstract
We investigated CD4+ and CD8+ T cell turnover in both healthy and HIV-1–infected adults by measuring the nuclear antigen Ki-67 specific for cell proliferation. The mean growth fraction, corresponding to the expression of Ki-67, was 1.1% for CD4+ T cells and 1.0% in CD8+ T cells in healthy adults, and 6.5 and 4.3% in HIV-1–infected individuals, respectively. Analysis of CD45RA+ and CD45RO+ T cell subsets revealed a selective expansion of the CD8+ CD45RO+ subset in HIV-1–positive individuals. On the basis of the growth fraction, we derived the potential doubling time and the daily turnover of CD4+ and CD8+ T cells. In HIV-1–infected individuals, the mean potential doubling time of T cells was five times shorter than that of healthy adults. The mean daily turnover of CD4+ and CD8+ T cells in HIV-1–infected individuals was increased 2- and 6-fold, respectively, with more than 40-fold interindividual variation. In patients with <200 CD4+ counts, CD4+ turnover dropped markedly, whereas CD8+ turnover remained elevated. The large variations in CD4+ T cell turnover might be relevant to individual differences in disease progression.
During the course of HIV-1 infection there is a progressive decrease of CD4+ T cells, but CD8+ T cells usually remain at higher levels than those of uninfected individuals (1, 2). In late stage disease, both T cell populations decline rapidly (3). CD4+ T cell decrease has been linked to the extent of viral replication (4), the efficacy of the host immune response such as CD8+ T cell mediated cytotoxicity (5–7), and apoptosis (8). In addition, late CD4+ T cell depletion might result from a progressive exhaustion through a continuously elevated T cell turnover (9).
T cell turnover in HIV-1–infected individuals has been explored by two approaches, providing divergent results (9–11). Ho et al. (9) and Wei et al. (10) studied T cell turnover after drug-induced disruption of quasi-steady state viremia by measuring the slope of the CD4+ T cell rise in the peripheral blood. They reported an increased daily turnover of CD4+ lymphocytes estimated at 2 × 10⁹ cells (9, 10). Wolthers et al. (11) evaluated CD4+ and CD8+ T cell turnover by measuring telomere length as an indicator of T cell replicative history. They reported shortening of telomere length in CD8+ but not in CD4+ T cells of HIV-1–infected individuals, and concluded that only CD8+ T cells have an elevated turnover in HIV-1 infection (11). Recently, Autran et al. (12) showed that during potent antiviral therapy of HIV-1–infected patients there was an early rise of CD45RO+ CD4+ T cells, suggesting a high turnover of this subset in the pretreatment quasi-steady state in HIV-1–infected patients. So far, the interpretation of T cell turnover in HIV-1 infected individuals has been hampered by the lack of data in healthy humans (13).
In this investigation, we determined T cell turnover in HIV-1–infected individuals and healthy adults on the basis of the T cell growth fraction as defined by the expression of Ki-67 antigen, which is expressed exclusively in proliferating cells of human origin (14) during the late G1, S, G2, or M phases of the cell cycle (15–17), with a short half-life of 1 h (15). The protein with two polypeptide chains of 345 and 395 kD is encoded by a highly conserved region on chromosome 10q25-ter (18). We determined Ki-67– positive CD4+ and CD8+ T cells in HIV-1–infected individuals and healthy adults with three-color flow cytometry analysis and calculated turnover of these T cell subsets on the basis of their respective growth fraction and the T cell blood concentration.
Materials and Methods
Study Subjects.
42 HIV-1–infected adult patients (cared for by private practitioners, the Geneva AIDS Center, and the AIDS consultation of the Ambilly Hospital) and 23 age-matched healthy adults (Geneva Blood Center) were included. None of the HIV-1–infected patients had been seroconverting in the 12 mo preceding enrollment and none of them had received antiretroviral treatment in the 3 mo preceding enrollment. The HIV-1–infected patients were stratified into subgroups according to their CD4+ T cell levels (Table 1). HIV-1 RNA copies per milliliter of plasma (viremia) was quantified by PCR (AMPLICOR HIV MONITOR; Roche, Basel, Switzerland).
Table 1.
Concentration and Percentage (mean ± SD) of CD4+ and CD8+ T Cells Expressing Ki-67+ in HIV-1–infected Individuals and Healthy Adults
| HIV+ | HIV− | |||||||||||
|---|---|---|---|---|---|---|---|---|---|---|---|---|
| <200* (n = 15) | 200–500 (n = 10) | >500 (n = 17) | Total (n = 42) | Total (n = 23) | P ‡ | |||||||
| CD4+/mm3 | 71 ± 64 | 374 ± 95 | 685 ± 163 | 392 ± 295 | 846 ± 230 | |||||||
| CD4+ (%) | 9.8 ± 7.5 | 24.1 ± 8.2 | 33.0 ± 6.8 | 22.6 ± 12.6 | 47.3 ± 7.8 | |||||||
| CD4+Ki-67+/mm3 | 6.1 ± 5.7 | 19.1 ± 12.3 | 24.5 ± 12.9 | 16.6 ± 13.3 | 8.9 ± 5.1 | <0.001 | ||||||
| CD4+Ki-67+ (%) | 10.2 ± 5.2 | 5.6 ± 4.2 | 3.7 ± 1.8 | 6.5 ± 4.8 | 1.1 ± 0.6 | <0.001 | ||||||
| CD8+/mm3 | 359 ± 247 | 795 ± 316 | 855 ± 292 | 663 ± 360 | 448 ± 153 | |||||||
| CD8+ (%) | 47.4 ± 16.9 | 47.6 ± 12.9 | 39.9 ± 8.1 | 44.4 ± 13.2 | 25.3 ± 7.8 | |||||||
| CD8+Ki-67+/mm3 | 18.8 ± 17.3 | 31.5 ± 28.7 | 28.9 ± 17.6 | 25.9 ± 20.8 | 4.2 ± 3.0 | <0.001 | ||||||
| CD8+Ki-67+ (%) | 5.9 ± 3.6 | 3.5 ± 2.6 | 3.4 ± 1.6 | 4.3 ± 2.9 | 1.0 ± 0.5 | <0.001 | ||||||
| log HIV RNA/ml | 5.0 ± 0.9 | 4.2 ± 1.1 | 3.8 ± 0.8 | 4.4 ± 1.0 | ||||||||
CD4+ T cell concentration per mm3.
Mann-Whitney test: comparison between healthy adults and HIV-1–infected patients (total).
Cell Separation and Antibody Staining.
EDTA venous blood samples were collected and processed within 4 h. PBMCs were isolated by centrifugation on a Ficoll Hypaque density gradient (GIBCO BRL, Gaithersburg, MD). For each assay, 2 × 10⁵ PBMCs were incubated with fluorochrome-labeled specific monoclonal antibodies against surface antigens for 15 min (monoclonal antibodies CD3-PE, CD4-PE-Cy5, and CD8-PE-Cy5 supplied by Immunotech, Marseille, France; and CD14-PE/CD45-FITC by Dako, Glostrup, Denmark). After fixation and permeabilization (19) with ORTHO PERMEAFIX® (Ortho Diagnostic Systems, Raritan, NJ), the cells were incubated for 40 min with Ki-67–FITC (MIB-1) (Immunotech) or matching isotype controls. Antibodies were used in the following combinations: CD3/CD4/Ki-67, CD3/ CD8/Ki-67, and CD14/CD45. In a subgroup of 9 age-matched control blood donors and 16 HIV-1–infected patients, additional combinations of CD4/CD45RA/Ki-67, CD4/CD45RO/Ki-67, CD8/CD45RA/Ki-67, and CD8/CD45RO/Ki-67 were used. Antibodies were as follows: CD4-PE-Cy5, CD8-PE-Cy5, CD45RA-PE clone ALB11, CD45RO-PE clone UCHL1, and Ki-67–FITC (MIB-1) (all from Immunotech). After staining, cells were washed in PBS and resuspended in 1% FCS, 1.5% BSA, 0.0015% sodium azide, and 0.0055% NaEDTA in PBS.
Flow Cytometry.
The cells were immediately analyzed by flow cytometry (Coulter EPICS XL2; Instrumentation Laboratory, Schlieren, Switzerland). At least 5,000 CD4+ or CD8+ T cells and 2,500 cells of the CD45RA+/CD45RO+ subset were counted. A large lymphocyte gate in the forward scatter/side scatter diagram was used to include blasts, whereas a combination of CD14/CD45 was used in parallel as control to exclude monocytes (<2%). Gating of Ki-67+ cells was selected on the basis of isotypic negative controls and positive controls with PHA-stimulated PBMCs.
Cell Cycle Distribution of Ki-67+ Cells.
To determine cell cycle distribution of Ki-67+ cells in infected and control individuals, parallel fluorescence-activated cell sorter analysis of T cells labeled with double combinations of CD4-FITC, Ki-67-FITC (MIB-1), and propidium iodide (20) was performed in a subgroup of nine HIV-1 infected individuals and four control blood donors. In each assay, 2 × 10⁵ PBMCs were incubated with monoclonal antibody CD4-FITC (Dako, Glostrup, Denmark) for 15 min and were permeabilized for 40 min as described above. In a second tube, there was no incubation with CD4-FITC, but Ki-67-FITC was added after permeabilization. After incubation with Ki-67 for 40 min and two wash steps, propidium iodide was added in the presence of RNase A (Sigma Chemical Co.), followed by immediate FACS® analysis. Thus, percentages of Ki-67 and cells in the S2GM phase within the CD4+ T cells could be quantified, as well as the proportion of S2GM T cells expressing Ki-67.
Calculation of Doubling Time and Turnover.
Lymphocyte proliferation was assessed assuming that cells were in balanced exponential growth, i.e., changing according to the equation dT/dt = α p T − d T = 0, where α is the growth fraction determined by Ki-67 (16, 17), p is the proliferation rate per cell, and d is the per capita death rate. The population doubling time in the absence of cell death is the potential doubling time, Dtpot, and can be determined by the equation Dtpot = ln 2 / (α p). The cell proliferation rate was taken from published data (21, 22). The turnover of T cell populations was estimated based on two assumptions: first, we assumed the T cell population was in quasi-steady state condition (23), i.e., on a short timescale the number of cells produced each day by proliferation was equal to the number being destroyed; and second, we assumed that there was a dynamic exchange between lymphocytes in blood and peripheral tissues (24, 25), with T cells in the blood being 2% of the total (26). The daily turnover of T cells and their subsets in HIV-1–infected individuals and control blood donors was calculated by multiplying α p by the T cell concentration per cubed millimeter, a factor taking into account an estimated 5 liters total blood volume (5 × 10⁶) and a factor of 50 to extrapolate to total body T cells (26).
Statistical Analysis.
The results are expressed as the mean ± 1 SD. All statistical analyses were performed with the SPSS software. Statistical significance between patient groups and healthy adults was analyzed with the Mann-Whitney U test. Significant correlations were analyzed with the Spearman test. Comparison of paired samples was performed with the Wilcoxon matched-pairs signed-rank test.
Results
Detection of the Ki-67 Antigen in Proliferating T Cells.
As shown in Fig. 1, using triple labeling of PBMCs, CD3+ CD4+ T cells colabeled with Ki-67 antibodies are easily identified, as are CD3+CD8+ T cells colabeled with Ki-67 (data not shown). After 48 h in vitro stimulation of PBMCs of five uninfected controls with phytohemagglutinin, 60–70% of the cells were Ki-67–positive (Fig. 1 B). In nine infected and four control individuals, a high proportion (>60%) of PBMCs expressing Ki-67 were in the SG2M phase, as defined by propidium iodide labeling. There was a high correlation (R >0.7; P = 0.038) between Ki-67 expression and propidium iodide staining in CD4+ T cells in nine HIV-1–infected individuals (data not shown).
Figure 1.
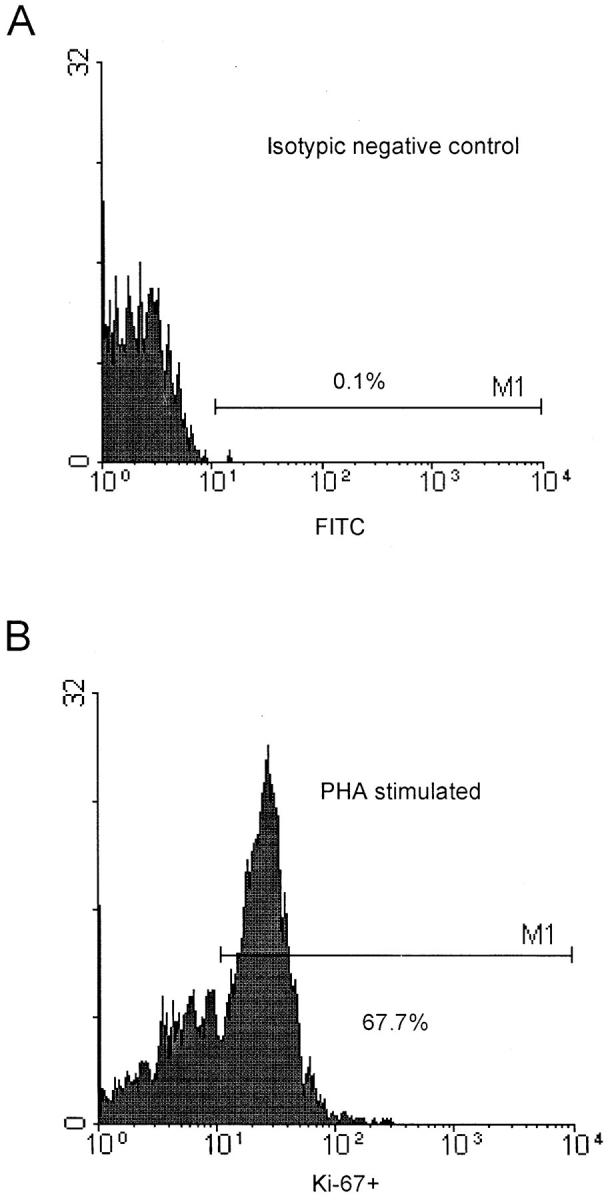
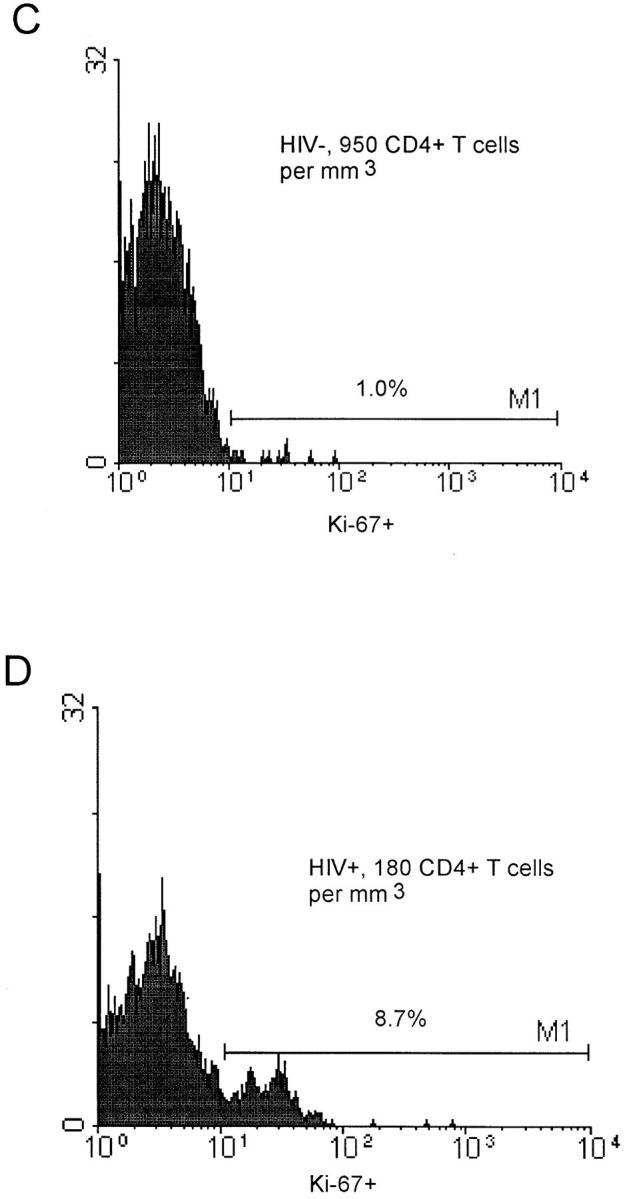
Flow cytometry analysis of CD3+CD4+ and CD3+ CD8+cells stained with Ki-67. (A) Isotypic negative control (FITC). (B) Expression of Ki-67 (percentage) in CD3+CD4+ T cells of a control blood donor after a 48-h in vitro stimulation with phytohemagglutinin. (C) Expression of Ki-67 (percentage) in CD3+CD4+ T cells of a control blood donor with 950 CD4+ T cells/mm3. (D) Expression of Ki-67 (percentage) in CD3+CD4+ T cells of a HIV-1–infected patient with 180 CD4+ T cells/mm3.
Higher Expression of Ki-67 Found in CD4+ and CD8+ T Cells in HIV-1–infected Individuals than in Healthy Adults.
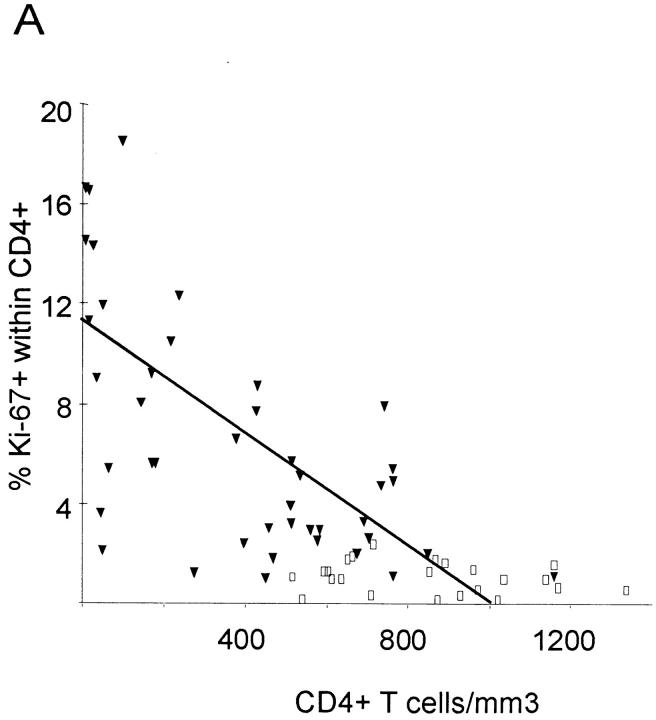
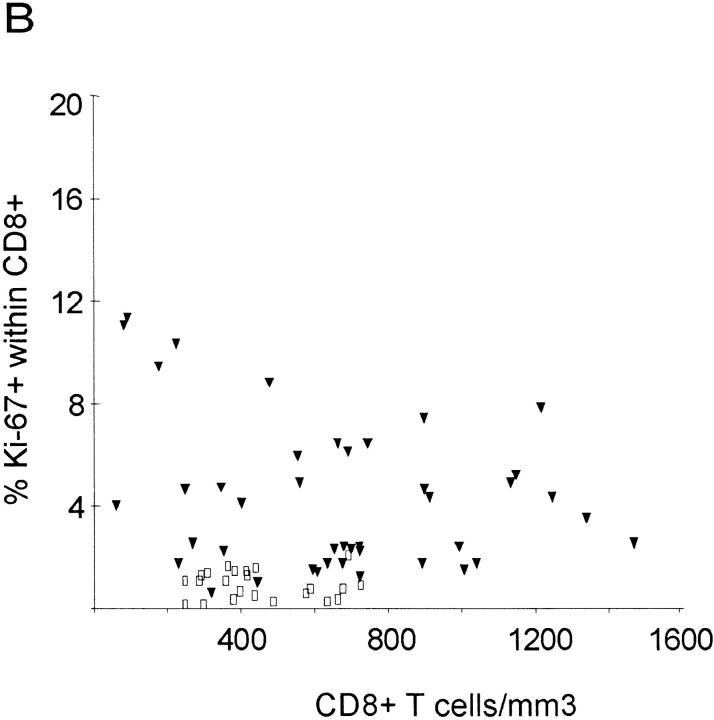
In healthy adults, 1.1 ± 0.6% of CD4+ T cells and 1.0 ± 0.5% of CD8+ T cells were Ki-67–positive (Table 1). In HIV-1–infected individuals, growth fractions (percentage of Ki-67) of CD4+ (6.5 ± 4.8%) and CD8+ T cells (4.3 ± 2.9%) were higher, with a wide variability, ranging from 1.1 to 18.6% in CD4+ T cells and 0.7 to 11.4% in CD8+ T cells (Fig. 2, A and B). In healthy adults, growth fractions of CD4+ and CD8+ T cells were associated (Wilcoxon matched-pairs signed rank test; P = 0.15), as well as in HIV-1–infected patients, with >500 CD4+ counts (P = 0.46). The latter also had the lowest growth fractions (Table 1). In contrast, both groups of patients with 200–500 CD4+ counts and <200 CD4+ counts had higher growth fractions that were not associated (P = 0.008 and 0.005, respectively).
Figure 2.
Percentage of Ki-67 expression in CD4+ and CD8+ T cells in HIV-1–infected patients (filled triangles) and healthy adults (open squares) versus absolute CD4+ and CD8+ counts. Regression lines are plotted for patient values only. (A) There is an inverse correlation between CD4+ T cell count and expression of Ki-67 in CD4+ T cells in HIV-1–infected patients (R = −0.64; P <0.001), but not in healthy adults (R = −0.18; P = 0.4). (B) HIV-1–infected patients have higher absolute CD8+ T cell counts and higher expression of Ki-67 in CD8+ T cells than do healthy adults. There is no correlation between percentage of Ki-67 and CD8+ count in HIV-1–infected patients (R = −0.12; P = 0.44) or in healthy adults (R = −0.03; P = 0.91).
When expressed in absolute numbers instead of percentages, there were 8.9 ± 5.1 CD4+ lymphocytes/mm3 expressing Ki-67 in healthy individuals compared to 16.6 ± 13.3 cells/mm3 in HIV-1–infected patients (Table 1). High levels were detected in patients with >200 CD4+ T cells/ mm3, whereas patients with <200 CD4+ T cells/mm3 had less Ki-67+CD4+ cells/mm3 than healthy individuals (Table 1). In controls, the concentration of proliferating CD8+ lymphocytes was 4.2 ± 3.0 cells/mm3, and these values were increased in HIV-1–infected individuals by approximately sevenfold in the subgroups with >200 CD4+ T cells/mm3 and fourfold in patients with <200 CD4+ T cells/mm3.
Growth Fractions of CD4+ and CD8+ T Cells Are Inversely Correlated with the CD4+ Count.
In HIV-1–infected patients, expression of Ki-67 in CD4+ lymphocytes was inversely correlated to the CD4+ T cell concentration (Fig. 2 A) but remained constant at ∼1% in healthy controls over a wide range of CD4+ T cell concentrations (Fig. 2 A). Using regression analysis in infected patients, the fraction of Ki-67+, i.e., proliferating CD4+ T cells, can be described by the equation α = 0.106 − 0.0001 T, where T is the CD4+ T cell concentration per mm3 and α is the proliferating fraction. Assuming that a similar relationship holds within a single individual as CD4+ counts change, an appropriate description of CD4+ T cell kinetics is given by the equation (I):
 |
where p is the per capita proliferation rate of CD4+ T cells, estimated to be 0.69 day−1 and dT their per capita death rate. In healthy individuals, the T cell death rate has been estimated by McLean and Michie (27) to be 0.00014 day−1, and thus can be ignored compared with the other terms in the equation. Thus, equation (I) predicts that, at steady state, the CD4+ cell concentration per mm3, T, is 1,060 cells/mm3, consistent with the average value found in healthy adults. In HIV-1–infected patients, CD4+ lymphocyte concentrations are lower and the CD4+ T cell death rate will be substantially elevated. For example, if T = 200/mm3, then dT = 0.059 day−1 (by equation (I), at steady state).
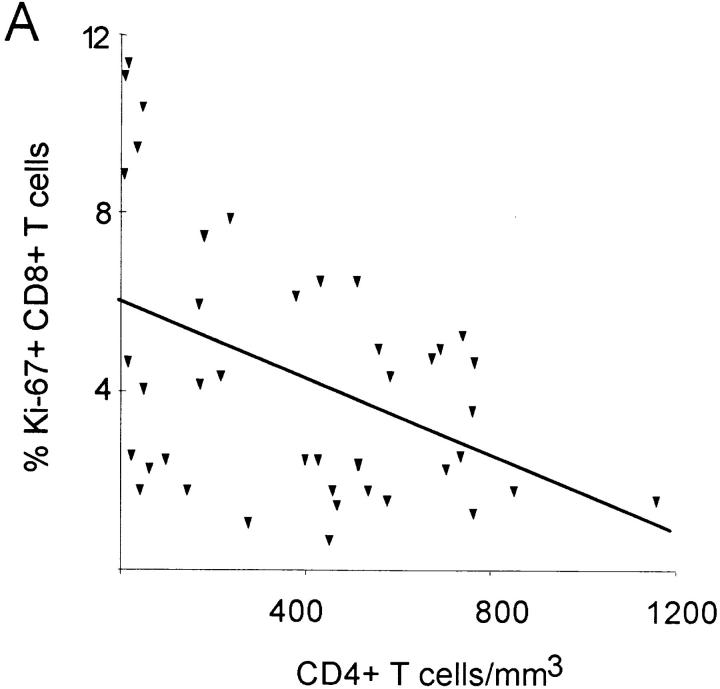
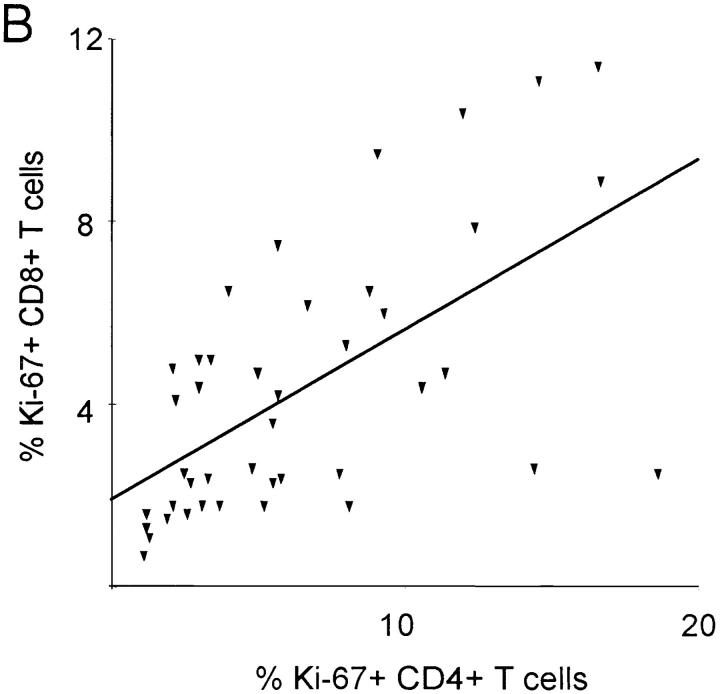
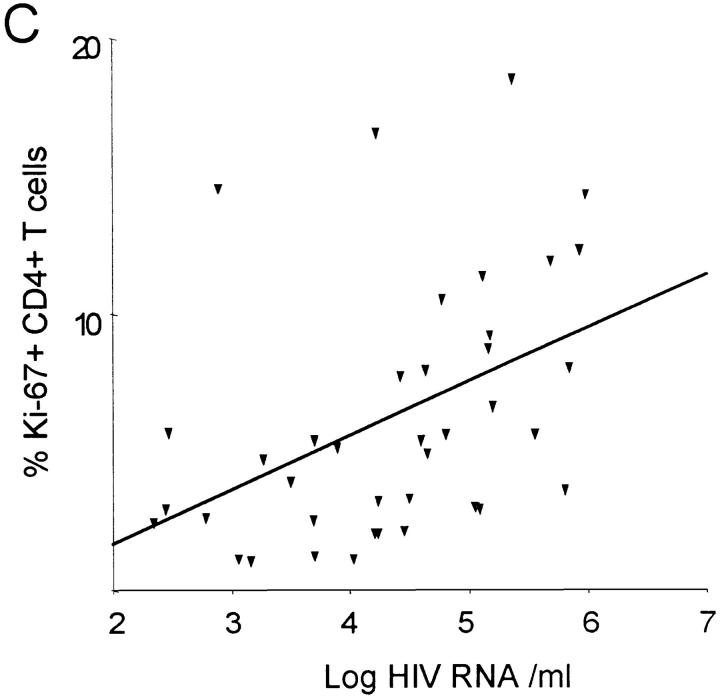
The growth fraction of CD8+ lymphocytes (percentage of Ki-67+) did not correlate with the CD8+ count in HIV-1–infected patients (Fig. 2 B), but was inversely correlated (R = −0.44; P = 0.003) with the CD4+ count (Fig. 3 A), suggesting that low CD4+ counts are associated with increased proliferation of both CD4+ and CD8+ lymphocytes. Consistent with this interpretation, the growth fractions of CD4+ and CD8+ lymphocytes were positively correlated (R = 0.62; P <0.001; Fig. 3 B), suggesting that proliferative factors act in parallel on both T cell subsets. Lastly, the growth fraction of CD4+ but not CD8+ lymphocytes was correlated (R = 0.43; P = 0.006) with viral load (data not shown) and with the logarithm of the viral load (R = 0.44; P = 0.005; Fig. 3 C).
Figure 3.
Association between the percentage of Ki-67 expression, CD4+ T cell concentration and viremia. (A) Significant negative correlation between the percentage of Ki-67–positive CD8+ T cells and CD4+ T cell concentration (R = −0.44; P = 0.003). (B) Significant positive correlation between percentage of CD4+Ki-67+ and percent of CD8+Ki-67+ T cells (R = 0.62; P <0.001). (C) Positive correlation between percentage of Ki-67–positive CD4+ lymphocytes and the logarithm of the viral load (R = 0.44; P = 0.005).
High Expression of Ki-67 in T Cells With the CD45RO+ Phenotype, and Expansion of Proliferating CD8+CD45RO+T Cells, but not of CD4+CD45RO+ T Cells Are Found in HIV-1–infected Individuals.
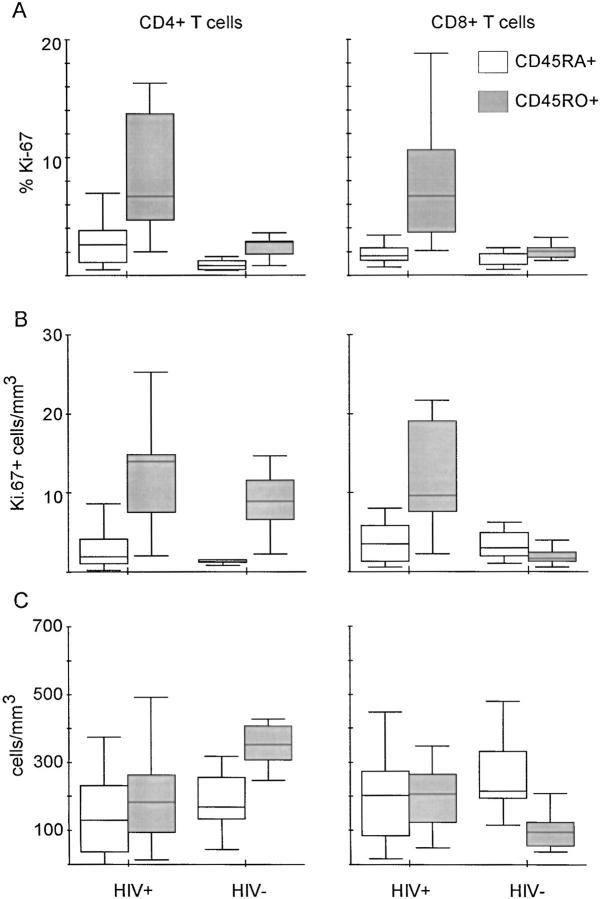
The percentage of Ki-67+ cells (growth fraction) was two- to fourfold higher among CD45RO+ cells than among CD45RA+ cells in CD4+ and CD8+ subsets in both 16 HIV-1–infected and 9 healthy adults (Fig. 4 A). In CD4+ T cells of healthy adults, the median growth fraction was 0.8% in the CD45RA+ and 2.8% in the CD45RO+ subset. In CD8+ T cells, the corresponding values were 0.9 and 2.0%, respectively. As expected, in HIV-1–infected individuals, there were elevated median growth fractions in the CD45RO+ subsets of 6.7% in CD4+ T cells and 6.8% in CD8+ T cells. The median growth fraction in the CD45RA+ subsets was elevated to 2.7% in CD4+ T cells and to 1.7% in CD8+ T cells, compared with healthy adults. There was a significant correlation between viral load and the percentage of Ki-67– positive CD4+CD45RO+ T cells (R = 0.71; P = 0.004) and between viral load and percentage of Ki-67–positive CD4+CD45RA+ T cells (R = 0.52; P = 0.048) (data not shown). In HIV-1–infected individuals, the concentration of CD8+CD45RO+/mm3 (median: 206 cells/mm3) was increased twofold compared with healthy adults (median: 94 cells/mm3) (P = 0.008), as shown in Fig. 4 C. Conversely, the median of the concentration of CD4+CD45RO+ T cells in HIV-1–infected individuals was significantly decreased to 182 cells/mm3, compared with healthy adults (median: 352 cells/mm3; P = 0.008). There was a sixfold elevated concentration of proliferating CD8+CD45RO+ T cells (median: 9.6 cells/mm3) in HIV-1–infected individuals (Fig. 4 B) compared with controls (median: 1.7), whereas the concentration of proliferating CD4+CD45RO+ T cells was only slightly elevated (median values: 14.0 in HIV-1–infected individuals versus 8.9 cells/mm3 in controls), despite similar growth fractions in both CD4+CD45RO+ and CD8+CD45RO+ subsets in HIV-1–infected individuals (Fig. 4 A).
Figure 4.
Higher expression of Ki-67 in CD45RO+ than in CD45RA+ subsets of both CD4+ and CD8+ T cells are found in HIV-1– infected individuals and in healthy adults. Results are depicted in box plot diagrams, where the box represents the 25th and 75th quartile and the line is the median value. Bars indicate 5th and 95th percentiles. (A) Higher percentage of Ki-67 in CD45RO+ than CD45RA+ subsets of CD4+ and CD8+ T cells in HIV-1–infected (Wilcoxon test, P = 0.008 and P <0.001, respectively) and healthy adults (P = 0.008 and P = 0.03, respectively). (B) Absolute numbers of proliferating cells of the CD45RA+ and CD45RO+ phenotype. There is no significant difference between HIV-1–infected individuals and healthy adults for the CD4+CD45RA+ (Mann-Whitney U test, P = 0.40), CD4+CD45RO+ (P = 0.22) and the CD8+CD45RA+ subset (P = 0.87), whereas Ki-67– positive CD8+CD45RO+ T cells are eightfold elevated in HIV-1–infected individuals (P <0.001). (C) Absolute numbers of CD4+CD45RA+, CD4+CD45RO+, CD8+CD45RA+, and CD8+ CD45RO+ T cells in HIV-1–infected and healthy adults. Significant differences between both groups were found in the CD4+CD45RO+ subset (P = 0.006) and the CD8+CD45RO+ subset (P = 0.007), but not in the CD4+CD45RA+ (P = 0.16) or the CD8+CD45RA+ subset (P = 0.31).
Potential Doubling Time and Turnover of both CD4+ and CD8+ T Lymphocytes Are Altered in HIV-1–infected Individuals.
The mean potential doubling time of CD4+ and CD8+ T cells was approximately five times shorter in HIV-1–infected individuals than in healthy adults (Table 2). In HIV-1–infected individuals with <200 CD4+ T cells/ mm3, the potential doubling time of CD4+ T cells was considerably shorter than in patients with higher CD4+ T cell concentrations. The same tendency was observed in CD8+ T cells, with the highest values of potential doubling time in the group with 200–500 CD4+ T cells/mm3 (Table 2). This observation is in line with more rapid T cell population doublings in severely immunocompromised individuals.
Table 2.
Potential Doubling Times and Daily Turnover Values (mean ± SD) of CD4+ and CD8+ T Cells in HIV-1–infected Individuals and Healthy Adults. HIV-1–infected Patients Are Stratified into Three Subgroups According to CD4+ T Cell Concentrations
| HIV+ | HIV− | |||||||||||
|---|---|---|---|---|---|---|---|---|---|---|---|---|
| <200* (n = 15) | 200–500 (n = 10) | >500 (n = 17) | Total (n = 42) | Total (n = 23) | P § | |||||||
| CD4+ doubling time‡ | 13.9 ± 10.6 | 34.9 ± 29.9 | 35.1 ± 20.8 | 27.5 ± 22.6 | 156.4 ± 147.4 | <0.001 | ||||||
| CD8+ doubling time | 25.4 ± 16.9 | 50.3 ± 41.2 | 38.0 ± 19.1 | 36.4 ± 26.5 | 166.9 ± 134.7 | <0.001 | ||||||
| CD4+ turnover‖ | 1.05 ± 0.98 | 3.30 ± 2.14 | 4.24 ± 2.23 | 2.88 ± 2.31 | 1.54 ± 0.88 | 0.029 | ||||||
| CD8+ turnover | 3.25 ± 2.99 | 5.45 ± 4.98 | 5.02 ± 3.04 | 4.49 ± 3.61 | 0.73 ± 0.51 | <0.001 | ||||||
CD4+ T cell concentration per mm3.
In days.
Mann-Whitney U-test: comparison between healthy adults and HIV-1–infected patients (total).
Number × 109 cells per day.
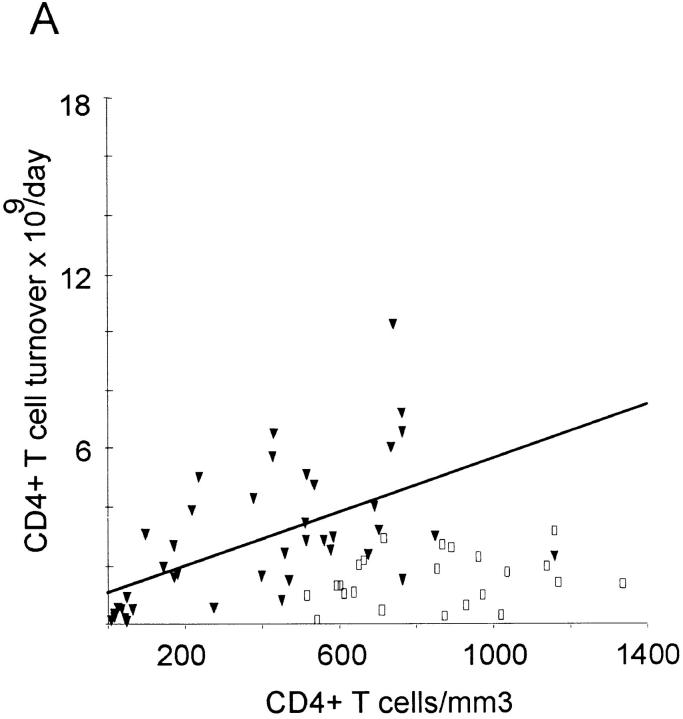
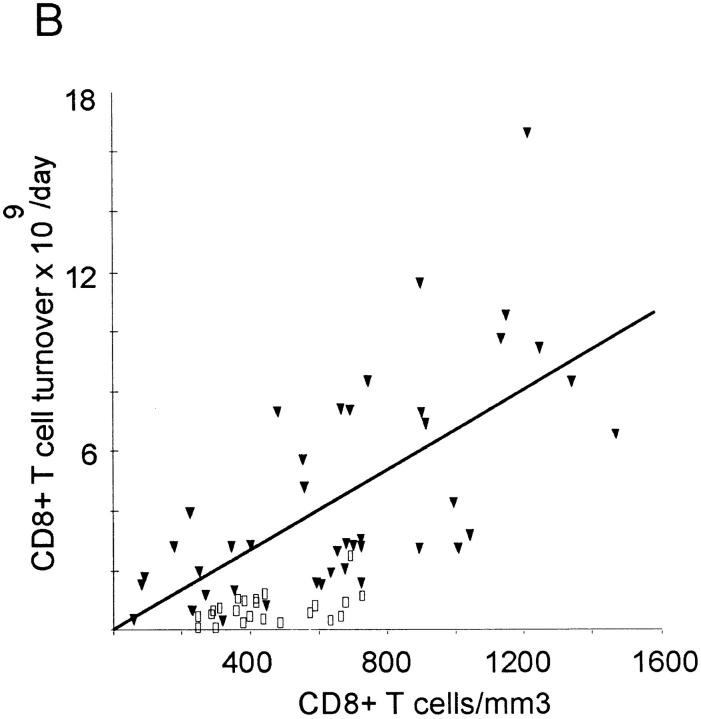
The mean daily turnover of CD4+ lymphocytes was calculated at 1.5 ± 0.9 × 10⁹ cells in healthy individuals and 2.9 ± 2.3 × 10⁹ cells in HIV-1–infected patients, whereas the corresponding mean daily CD8+ T cell turnover was 0.7 ± 0.53 × 10⁹ and 4.5 ± 3.6 × 10⁹ cells/day, respectively (Table 2). Compared with the mean control values, 10 out of 15 patients with <200 CD4+ counts had decreased CD4+ T cell turnover (Table 2), despite high growth fractions (Table 1). On the other hand, CD8+ T cell turnover remained elevated in this subgroup. Thus, CD8+ T cell turnover was elevated in all disease stages, whereas CD4+ T cell turnover fell below the values of healthy adults in late stage disease. There was a significant correlation between CD4+ and CD8+ T cell turnover in both HIV-1–infected (R = 0.69; P <0.001) and control individuals (R = 0.53; P = 0.009). A significant correlation was also found between CD4+ count and CD4+ turnover on the one hand and between CD8+ count and CD8+ turnover on the other in HIV-1–infected individuals, but not in healthy adults (Fig. 5, A and B). There was no correlation between CD4+ count and CD8+ turnover (data not shown).
Figure 5.
Daily T cell turnover (×109) versus T cell concentration in HIV-1–infected patients (filled triangles) and healthy adults (open squares). Regression lines are plotted for patient values only. (A) CD4+ T cells: there is a tendency to higher turnover in HIV-1–infected individuals (2.88 ± 2.31) than in healthy adults (1.54 ± 0.88). CD4+ T cell turnover is positively associated with CD4+ T cell concentration (R = 0.66, P <0.001) in HIV-1–infected individuals, but not in healthy adults (R = 0.29; P = 0.19). (B) CD8+ T cell turnover is increased up to 15-fold in HIV-1–infected individuals (4.49 ± 3.61) compared with values of healthy adults (0.73 ± 0.51). There is also a positive correlation between CD8+ T cell turnover and CD8+ T cell concentration in HIV-1–infected individuals (R = 0.68; P <0.001), but not in healthy adults (R = 0.38; P = 0.08).
Discussion
In this study, we evaluated the CD4+ and CD8+ T cell growth fraction in HIV-1–infected patients and healthy adults as measured by expression of the nuclear antigen Ki-67. In HIV-1–infected individuals, the mean increase in CD4+ T cell growth fraction (percentage of Ki-67+ cells) was around sixfold and that of CD8+ T cells fourfold as compared to healthy adults. There was a positive correlation between CD4+ and CD8+ T cell growth fractions. In addition, CD4+ and CD8+ T cell growth fractions were inversely correlated with absolute CD4+ counts. Thus, proliferation of CD4+ and CD8+ T cells appears to be governed by similar mechanisms.
HIV-1–infected individuals had elevated levels of CD8+CD45RO+ T cells, as previously reported (28, 29). In addition, we measured the levels of proliferating CD8+ CD45RO+ T cells and found that they were raised sixfold as compared to healthy adults, possibly reflecting an antigen-driven expansion of this subset (30). These findings suggest that under steady-state conditions, the elevated production of CD8+CD45RO+ T cells is counterbalanced by high death rates of this subset, probably due to apoptosis (31). In contrast, the levels of CD4+CD45RO+ T cells in HIV-1–infected individuals were below those of healthy adults, despite a growth fraction as high as that of CD8+CD45RO+ T cells. The lack of expansion of CD4+CD45RO+ T cells may partly be due to direct or indirect virus-mediated destruction (32). We found a positive correlation between viral load and CD4+CD45RO+ T cell growth fraction, suggesting that the high growth fraction of CD4+CD45RO+ T cells might account in part for the early rise in CD4+ T cell counts observed after initiation of potent antiviral treatment (12).
The issue of T lymphocyte turnover is central to the understanding of HIV-1 pathogenesis (33). We estimate that HIV-1–infected individuals have a mean sixfold increase of CD8+ T cell turnover, whereas the mean turnover of CD4+ T cells only increases by twofold. The higher turnover of CD8+ T cells reflects the inversion of the CD4+/ CD8+ ratio in HIV-1–infected patients (3). Differences in CD4+ and CD8+ T cell turnover also depend on the disease stage, as defined by CD4+ T cell counts. Whereas CD8+ T cell turnover remained high during all stages of disease, CD4+ T cell turnover dropped below the normal levels as measured in healthy adults in patients with CD4+ counts below 200/mm3. In these patients, progressive CD4+ T cell loss occurred in spite of the high proliferative activity of CD4+ T cells.
Recent studies based on measurements of telomere length failed to detect changes in CD4+ T cell turnover in HIV-1–infected patients (11), in contrast to the data reported here. Possible explanations for this divergence involve patient selection and sensitivity of telomere length measurements. A two- to threefold increase in CD4+ T cell turnover might be too small for detection based on changes in telomere length. In addition, changes in telomere length may insufficiently reflect the degree of proliferation in cell populations in which dividing cells are rapidly destroyed. In a study of twins heterogeneous for HIV-1 infection, telomere length in CD4+ T cells was significantly greater in the HIV-1–infected twin (34), supporting the idea of abnormal population dynamics or telomerase activity skewing the results (35). Previous studies, based on CD4+ T cell recovery after initiation of potent antiviral treatment, reported a high CD4+ T cell turnover of 2 × 10⁹ cells daily (9, 10). The data reported here are consistent with this rate of CD4+ T cell turnover, but also show that CD4+ T cell turnover is only increased twofold in HIV-1–infected individuals, as compared to healthy individuals. We also confirmed the wide interindividual variability in CD4+ T cell growth and turnover rates that might mirror individual differences in disease progression. The impressive eightfold increase in CD8+ T cell turnover in HIV-1 patients described here is consistent with the data derived from the measurement of telomere length (11).
The rapid rise in CD4+ counts after initiation of potent antiviral therapy (9, 10) may be explained by two mechanisms: first, by an inhibition of virus-mediated CD4+ T cell destruction in the presence of an ongoing elevated CD4+ T cell production (9, 10); and second, by a release of CD4+ T cells from lymphoid tissues into blood (36, 37). The high mean production of CD4+ T cells we observed in HIV-1– infected individuals may be sufficient to raise CD4 counts independent of redistribution. Moreover, our study was performed without causing any perturbation of the steady state between lymphocyte distribution in lymphoid tissues and peripheral blood. However, our estimates on total body T cell turnover were derived from the measurement of Ki-67+ T cells in the peripheral blood and should be further explored by studies in lymph nodes.
In patients with low CD4+ counts high viral loads were accompanied by diminished CD4+ T cell turnover values, as compared to healthy adults. In contrast, in patients with higher CD4+ counts there were lower viral loads and elevated CD4+ T cell turnover values. Given the in vitro estimates that one infected CD4+ T cell can produce up to 102 infectious virus and up to 105 noninfectious virus particles (38, 39), the number of CD4+ T cells required to produce the minimal estimate of 1010 to 1011 virions per day (40) represents a small fraction of the 2–7 × 10⁹ CD4 T cells produced each day in patients with >200 CD4+ T cells (Table 2, Fig. 5 A). In patients with <200 CD4+ counts, a lower production of ∼109 CD4+ T cells is associated with higher viral loads. Thus, virus-mediated destruction may substantially contribute to CD4+ T cell depletion in patients with very low CD4+ counts, whereas other mechanisms such as apoptosis (8, 41) or CTL-mediated lysis (5–7) would play a predominant role in patients with >200 CD4+ counts.
In conclusion, our study shows elevated turnover of CD8+ T cells and to a lesser extent CD4+ T cells in HIV-1–infected patients. The large expansion of CD8+CD45RO+ T cells in the absence of a comparable expansion of CD4+CD45RO+ T cells, despite similar growth characteristics, contributes to the imbalance of T cell populations in HIV-1 infection.
Acknowledgments
We thank J. Geiselmann and A. McLean for discussion and E. Ramirez for technical support.
This work was supported by the Swiss National Research Foundation (no. 3239-041951.94), the Swiss HIV Cohort Study, and the National Institutes of Health (RR-06555).
References
- 1.Fauci AS, Schnittman SM, Poli G, Koening S, Pantaleo G. Immunopathogenic mechanisms in human immunodeficiency virus (HIV) infection. Ann Intern Med. 1991;114:678–693. doi: 10.7326/0003-4819-114-8-678. [DOI] [PubMed] [Google Scholar]
- 2.Margolick JB. Changes in T and non-T lymphocyte subsets following seroconversion to HIV-1: stable CD3+and declining CD3 populations suggest regulatory responses linked to loss of CD4 lymphocytes. J Acquir Immune Defic Syndr. 1993;6:153–161. [PubMed] [Google Scholar]
- 3.Margolick JB, Munoz A, Donnenberg AD, Park LP, Galai N, Giorgi JV, O'Gorman MRG, Ferbas J. Failure of T-cell homeostatis preceding AIDS in HIV-1 infection. Nat Med. 1995;1:1674–1680. doi: 10.1038/nm0795-674. [DOI] [PubMed] [Google Scholar]
- 4.Piatak M, Saag MS, Yang LC, Clark SJ, Kappes JC, Luk K-C, Hahn BH, Shaw GM, Lifson JD. High levels of HIV-1 in plasma during all stages of infection determined by competitive PCR. Science. 1993;259:1749–1754. doi: 10.1126/science.8096089. [DOI] [PubMed] [Google Scholar]
- 5.Pantaleo G, Graziosi C, Fauci AS. New concepts in the immunopathogenesis of human immunodeficiency virus infection. N Engl J Med. 1993;328:327–335. doi: 10.1056/NEJM199302043280508. [DOI] [PubMed] [Google Scholar]
- 6.Klein MR, van Baalen CA, Holwerda AM, Kerkhof SR, Garde, Bende RJ, Keet IP, Eeftinck-Schattenkerk J-K, Osterhaus AD, Schuitemaker H, Miedema F. Kinetics of Gag-specific cytotoxic T lymphocyte responses during the clinical course of HIV-1 infection: a longitudinal analysis of rapid progressors and long-term asymptomatics. J Exp Med. 1995;181:1365–1372. doi: 10.1084/jem.181.4.1365. [DOI] [PMC free article] [PubMed] [Google Scholar]
- 7.Rinaldo C, Huang XL, Fan ZF, Ding M, Beltz L, Logar A, Panicali D, Mazzara G, Liebmann J, Cottrill M. High levels of anti-human immunodeficiency virus type 1 (HIV-1) memory cytotoxic T-lymphocyte activity and low viral load are associated with lack of disease in HIV-1 infected long-term nonprogressors. J Virol. 1995;69:5838–5842. doi: 10.1128/jvi.69.9.5838-5842.1995. [DOI] [PMC free article] [PubMed] [Google Scholar]
- 8.Gougeon M-L, Montagnier L. Apoptosis in AIDS. Science. 1993;260:1269–1270. doi: 10.1126/science.8098552. [DOI] [PubMed] [Google Scholar]
- 9.Ho DD, Neumann AU, Perelson AS, Chen W, Leonard JM, Markowitz M. Rapid turnover of plasma virions and CD4 lymphocytes in HIV-1 infection. Nature. 1995;373:123–126. doi: 10.1038/373123a0. [DOI] [PubMed] [Google Scholar]
- 10.Wei X, Gosh SK, Taylor ME, Johnson VA, Emini EA, Deutsch P, Lifson JD, Bonhoeffer S, Nowak MA, Hahn BH, et al. Viral dynamics in human immunodeficiency virus type 1 infection. Nature. 1995;373:117–122. doi: 10.1038/373117a0. [DOI] [PubMed] [Google Scholar]
- 11.Wolthers KC, Wisman BA, Otto SA, de Roda AM, Husman, Schaft N, de Wolf F, Goudsmit J, Coutinho RA, van der Zee AGJ, Meyaard L, Miedema F. T cell telomere length in HIV-1 infection: no evidence for increased CD4+T cell turnover. Science. 1996;274:1543–1547. doi: 10.1126/science.274.5292.1543. [DOI] [PubMed] [Google Scholar]
- 12.Autran B, Garcelain G, Li TS, Blanc C, Mathez D, Tubiana R, Katlama C, Debré P, Leibowitch J. Positive effects of combined antiretroviral therapy on CD4+T cell homeostasis and function in advanced HIV disease. Science. 1997;277:112–116. doi: 10.1126/science.277.5322.112. [DOI] [PubMed] [Google Scholar]
- 13.Bukrinsky M, Manogue K, Cerami A. HIV results in the frame. Other approaches. Nature. 1995;375:195–196. doi: 10.1038/375195b0. [DOI] [PubMed] [Google Scholar]
- 14.Gerdes J, Lemke H, Baisch H, Wacker H-H, Schwab U, Stein H. Cell cycle analysis of a cell proliferation-associated human nuclear antigen defined by the monoclonal antibody Ki-67. J Immunol. 1984;133:1710–1715. [PubMed] [Google Scholar]
- 15.Bruno S, Darzynkiewicz Z. Cell cycle dependent expression and stability of the nuclear protein detected by Ki-67 antibody in HL-60 cells. Cell Prolif. 1992;25:31–40. doi: 10.1111/j.1365-2184.1992.tb01435.x. [DOI] [PubMed] [Google Scholar]
- 16.Schwarting R, Gerdes J, Niehus J, Jaeschke L, Stein H. Determination of the growth fraction in cell suspensions by flow cytometry using the monoclonal antibody Ki-67. J Immunol Methods. 1986;90:65–70. doi: 10.1016/0022-1759(86)90384-4. [DOI] [PubMed] [Google Scholar]
- 17.Tsurusawa M, Ito M, Zha Z, Kawai S, Takasaki Y, Fujimoto T. Cell-cycle associated expressions of proliferating cell nuclear antigen and Ki-67 reactive antigen of bone marrow blast cells in childhood acute leukemia. Leukemia. 1992;6:669–674. [PubMed] [Google Scholar]
- 18.Duchrow M, Schlüter C, Wohlenberg C, Flad H-D, Gerdes J. Molecular characterization of the gene locus of the human cell proliferation-associated nuclear protein defined by monoclonal antibody Ki-67. Cell Prolif. 1996;29:1–12. [PubMed] [Google Scholar]
- 19.Pizzolo G, Vincenzi C, Nadali G, Veneri D, Vinante F, Chilosi M, Basso G, Connelly M, Janossy G. Detection of membrane and intracellular antigens by flow cytometry following ORTHO PermeaFix™ fixation. Leukemia. 1996;8:672–676. [PubMed] [Google Scholar]
- 20.Pollice AA, McCoy JP, Shackney SE, Smith CA, Agarwal J, Burholt DR, Janocko LE, Hornicek FJ, Singh SG, Hartsock RJ. Sequential paraformaldehyde and methanol fixation for simultaneous flow cytometric analysis of DNA, cell surface proteins, and intracellular proteins. Cytometry. 1992;13:432–444. doi: 10.1002/cyto.990130414. [DOI] [PubMed] [Google Scholar]
- 21.Crabtree GR. Contingent genetic regulatory events in T lymphocyte activation. Science. 1989;243:355–361. doi: 10.1126/science.2783497. [DOI] [PubMed] [Google Scholar]
- 22.Tedeschi, H., 1991. Cell. In Encyclopedia of Human Biology, Vol. 2. Academic Press Inc., San Diego, CA. 243–244.
- 23.Perelson, A.S., P. Essunger, and D.D. Ho. 1997. Dynamics of HIV-1 and CD4+ lymphocytes in vivo. AIDS. 11(suppl. A): S17–S24. [PubMed]
- 24.Matsuda S, Uchida T, Kariyone S. Kinetic studies on lymphocytes with indium 111-oxine in patients with chronic lymphopenic leukaemia. Scand J Haematol. 1985;35:210–218. doi: 10.1111/j.1600-0609.1985.tb01575.x. [DOI] [PubMed] [Google Scholar]
- 25.Young AJ, Hay JB. Rapid turnover of the recirculating lymphocyte pool in vivo. Int Immunol. 1995;7:1607–1615. doi: 10.1093/intimm/7.10.1607. [DOI] [PubMed] [Google Scholar]
- 26.Sprent J, Tough DF. Lymphocyte life span and memory. Science. 1994;265:1395–1400. doi: 10.1126/science.8073282. [DOI] [PubMed] [Google Scholar]
- 27.McLean AR, Mitchie CA. In vivo estimates of division and death rates of human T lymphocytes. Proc Natl Acad Sci USA. 1995;92:3707–3711. doi: 10.1073/pnas.92.9.3707. [DOI] [PMC free article] [PubMed] [Google Scholar]
- 28.Roederer M, Dubs JG, Anderson MT, Raju PA, Herzenberg LA, Herzenberg LA. CD8 naive T cell counts decrease progressively in HIV-infected adults. J Clin Invest. 1995;95:2061–2066. doi: 10.1172/JCI117892. [DOI] [PMC free article] [PubMed] [Google Scholar]
- 29.Froebel KS, Doherty KV, Whitelaw JA, Hague RA, Mok JY, Bird AG. Increased expression of the CD45RO (memory) antigen on T cells in HIV-infected children. AIDS. 1991;5:97–99. doi: 10.1097/00002030-199101000-00015. [DOI] [PubMed] [Google Scholar]
- 30.Mackall CL, Hakim FT, Gress RE. T-cell regeneration: all repertoires are not created equal. Immunol Today. 1997;18:245–251. doi: 10.1016/s0167-5699(97)81664-7. [DOI] [PubMed] [Google Scholar]
- 31.Gougeon M-L, Lecoeur H, Dulioust A, Enouf M-G, Crouvoisier M, Goujard C, Debord T, Montagnier L. Programmed cell death in peripheral lymphocytes from HIV-infected persons. J Immunol. 1996;156:3509–3520. [PubMed] [Google Scholar]
- 32.Schnittman SM, Lane HC, Greenhouse J, Justement JS, Baseler M, Fauci AS. Preferential infection of CD4+memory T cells by human immunodeficiency virus type 1: evidence for a role in the selective T-cell functional defects observed in infected individuals. Proc Natl Acad Sci USA. 1990;87:6058–6062. doi: 10.1073/pnas.87.16.6058. [DOI] [PMC free article] [PubMed] [Google Scholar]
- 33.Antia R, Halloran ME. Recent developments in theories of pathogenesis of AIDS. Trends Microbiol. 1996;4:282–285. doi: 10.1016/0966-842x(96)10044-5. [DOI] [PubMed] [Google Scholar]
- 34.Palmer D, Weng NP, Levine BL, June CH, Lane HC, Hodes RJ. Telomere length, telomerase activity, and replicative potential in HIV infection: analysis of CD4+ and CD8+T cells from HIV-discordant monozygotic twins. J Exp Med. 1997;185:1381–1386. doi: 10.1084/jem.185.7.1381. [DOI] [PMC free article] [PubMed] [Google Scholar]
- 35.Bodnar AG, Kim NW, Effros RB, Chiu C-P. Mechanism of telomerase induction during T cell activation. Exp Cell Res. 1996;228:58–64. doi: 10.1006/excr.1996.0299. [DOI] [PubMed] [Google Scholar]
- 36.Mosier DE. HIV results in the frame. CD4+cell turnover. Nature. 1995;375:193–194. doi: 10.1038/375193b0. [DOI] [PubMed] [Google Scholar]
- 37.Sprent J, Tough D. HIV results in the frame. CD4+cell turnover. Nature. 1995;375:194. doi: 10.1038/375194a0. [DOI] [PubMed] [Google Scholar]
- 38.Dimitrov DS, Martin MA. HIV results in the frame. CD4+cell turnover. Nature. 1995;375:194–195. doi: 10.1038/375194b0. [DOI] [PubMed] [Google Scholar]
- 39.Levy JA, Ramachandran B, Barker E, Guthrie J, Elbeik T. Plasma viral load, CD4+cell counts, and HIV-1 production by cells. Science. 1996;271:669–670. doi: 10.1126/science.271.5249.670. [DOI] [PubMed] [Google Scholar]
- 40.Ho DD. Dynamics of HIV-1 replication in vivo. J Clin Invest. 1997;99:2565–2567. doi: 10.1172/JCI119443. [DOI] [PMC free article] [PubMed] [Google Scholar]
- 41.Ascher M, Sheppard HW, Anderson RW, Krowka JF, Bremermann HJ. Paradox remains. Nature. 1995;375:196–197. doi: 10.1038/375196a0. [DOI] [PubMed] [Google Scholar]


