Abstract
The muscle regulators MyoD and Myf-5 control cell cycle withdrawal and induction of differentiation in skeletal muscle cells. By immunofluorescence analysis, we show that MyoD and Myf-5 expression patterns become mutually exclusive when C2 cells are induced to differentiate with Myf-5 staining present in cells which fail to differentiate. Isolation of these undifferentiated cells reveals that upon serum stimulation they reenter the cell cycle, express MyoD and downregulate Myf-5. Similar regulations of MyoD and Myf-5 were observed using cultured primary myoblasts derived from satellite cells. To further analyze these regulations of MyoD and Myf-5 expression, we synchronized proliferating myoblasts. Analysis of MyoD and Myf-5 expression during cell cycle progression revealed distinct and contrasting profiles of expression. MyoD is absent in G0, peaks in mid-G1, falls to its minimum level at G1/S and reaugments from S to M. In contrast, Myf-5 protein is high in G0, decreases during G1 and reappears at the end of G1 to remain stable until mitosis. These data demonstrate that the two myogenic factors MyoD and Myf-5 undergo specific and distinct cell cycle–dependent regulation, thus establishing a correlation between the cell cycle–specific ratios of MyoD and Myf-5 and the capacity of cells to differentiate: (a) in G1, when cells express high levels of MyoD and enter differentiation; (b) in G0, when cells express high levels of Myf-5 and fail to differentiate.
Keywords: cell cycle, MyoD, Myf-5, muscle, differentiation
Cell cycle withdrawal and onset of differentiation are tightly linked processes that depend on growth factor activity. During skeletal muscle differentiation, mononucleated proliferating myoblasts stop dividing, coordinately activate muscle-specific gene expression and fuse into plurinucleated myotubes. Cell cycle arrest, a prerequisite for differentiation, occurs before S phase during the G1 phase of the cell cycle (Nadal-Ginard, 1978; Clegg et al., 1987). Except under specific circumstances, terminally differentiated myotubes are unable to reenter the cell cycle in response to growth factors.
The apparent antagonism between proliferation and differentiation implies that signaling pathways driving proliferation must be suppressed to allow induction of differentiation. Indeed, by inactivating G1/S cyclin-dependent kinase (cdk)1 activity, cyclin-dependent kinase inhibitors (CKI) such as p21 block cell cycle progression before S phase (for review see Hunter and Pines, 1994; Walsh and Perlman, 1997). p21 expression is upregulated during myogenesis while, in parallel, cdk activities decline (Guo et al., 1995; Halevy et al., 1995; Skapek et al., 1995). This p21 upregulation has been associated with permanent cell cycle arrest of muscle cells (Andrés and Walsh, 1996). One target of the cdk is the retinoblastoma protein (pRb). Inactivation of pRb is required for G1/S progression and occurs in late G1 as a result of its phosphorylation by cdks (for review see Bartek et al., 1996). In its hypo-phosphorylated form, pRb prevents S phase entry by sequestering E2F transcription factors (Chelappan et al., 1991), a family of proteins essential for G1/S transition. Interestingly, pRb is found hypophosphorylated in myotubes and it has been involved in the maintenance of the permanent cell cycle withdrawal in myotubes (Gu et al., 1993; Schneider et al., 1994; Novitch et al., 1996).
During myogenesis, these different cell cycle regulatory pathways can be antagonized or, in contrast, reinforced by muscle-specific regulators of the MyoD family. The basic HLH protein MyoD and related members Myf-5, myogenin, and MRF4 are essential transcriptional activators of muscle-specific genes required throughout myogenesis (Weintraub et al., 1991, 1993). Of these four muscle regulatory factors, only MyoD and Myf-5 are expressed in proliferating myoblasts (Weintraub, 1993). Interestingly, overexpression of MyoD directly modulates the cell cycle of normal and transformed cells by blocking G1/S progression (Crescenzi et al., 1990; Sorrentino et al., 1990). Different mechanisms may explain the cell cycle inhibitory activity of MyoD. MyoD enhances p21 transcription (Halevy et al., 1995) ultimately leading to cdks downregulation. Additionally, the interaction between MyoD and the hypophosphorylated form of pRb may maintain pRb in its active form (Gu et al., 1993). Finally, MyoD has also been shown to downregulate cyclin B1 expression (Chu et al., 1997). Conversely, cyclin D1 is upregulated in response to growth factors and antagonizes the myogenic activity of MyoD (Rao et al., 1994; Skapek et al., 1995). Thus, it appears that the decision to differentiate relies on cross-talk between MyoD and cell cycle signaling pathways. In this context, slight variations in MyoD expression and/or activity may change the balance between proliferation and differentiation. Indeed, in many myogenic cell lines, the capacity of cell to differentiate appears linked to the level of MyoD expression (Montarras et al., 1996). In addition, the known positive inducers of myogenesis such as insulin like growth factors, thyroid hormones and retinoic acid enhance both MyoD expression and muscle differentiation (Pinset et al., 1988; Florini et al., 1991; Carnac et al., 1992; Albagli-Curiel et al., 1993) implying that a minimal threshold of MyoD protein must be reached before differentiation can take place. Consistent with this hypothesis, it has been observed that the amount of immunostained MyoD protein varies considerably in the nuclei of proliferative myoblasts, whereas it is homogeneously high in myotubes (Tapscott et al., 1988; our own unpublished results).
These observations suggest that the induction of differentiation at a precise time of the cell cycle, presumably G1, may be related to variations in MyoD level and raises the question of a potential cell cycle–dependent regulation of MyoD.
In this report, we show that the expression of MyoD and Myf-5 (muscle regulatory factors) is mutually exclusive during differentiation. We have isolated a subpopulation of undifferentiated myoblasts from differentiated C2 cells that express high levels of Myf-5 and no MyoD. These data were also obtained using cultured primary mouse myoblasts derived from satellite cells. Upon serum stimulation, these cells proliferate, reexpress MyoD, and differentiate. Further, we show that MyoD/Myf-5 ratios appear to be controlled in a cell cycle–dependent manner. Using a combination of low serum and methionine-depleted medium, we were able to block cell proliferation without differentiation. The kinetics of cell cycle progression after reentry of quiescent myoblasts into proliferation reveals a good level of synchronization. Analysis of the expression pattern of MyoD and Myf-5 at different phases of cell cycle revealed that the two myogenic factors undergo specific cell cycle– dependent regulation. Thus, we propose a model where myoblasts can potentially exit at two different phases of the cell cycle characterized by their opposing MyoD/Myf-5 ratios and capacity for differentiation.
Materials and Methods
Reagents and Cell Culture
Ham-F12, DME with or without methionine were purchased from Life Technology/Gibco-BRL (Eragny, France). FCS came from Institute Boy (Reims, France). All-trans retinoic acid was diluted in dimethyl sulfoxide (DMSO).
C2.7 (a subclone of C2 cells)- and C2-inducible myoblasts (Yaffe and Saxel, 1977; Pinset et al., 1988) were routinely grown in proliferation medium (a 1/1 mixture of HAM-F12/DME) supplemented with 10% (vol/ vol) FCS and subcultured twice a week. For differentiation, confluent C2 cells were refed with DME plus 2% FCS (“differentiation medium”) for indicated times. For data shown in Fig. 4 B, the differentiation medium additionally contained 10−6 M of all-trans retinoic acid which has been shown to accelerate entry into differentiation (Albagli-Curiel et al., 1993).
Figure 4.
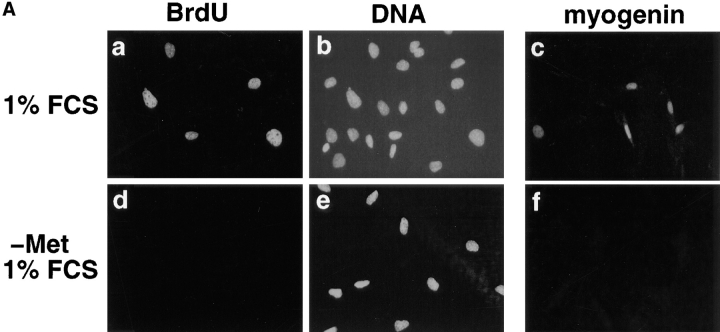
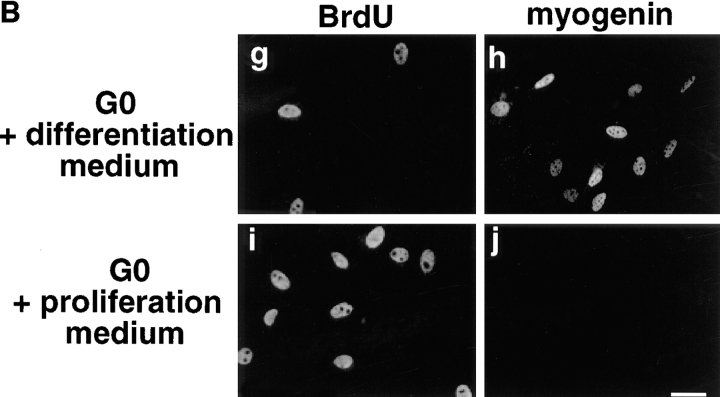
Methionine deprivation efficiently arrests mouse C2 myoblasts in a quiescent and nondifferentiated state. (A) 2 × 10⁴ C2 cells were plated on 35-mm dishes, grown in proliferation medium for 24 h and then were further grown for 36 h either in Ham F12 medium supplemented 1% serum (a–c) or in methionine-depleted medium plus 1% serum (d–f). At the end of this incubation time, cells were further incubated for 15 min with 0.1 mM BrdU (a and b) and then processed for immunofluorescence analysis using antibodies directed against BrdU to probe for DNA synthesis (a and d) or myogenin to probe for differentiation (c and f). Total nuclei corresponding to the cells described in a and d were revealed after DNA staining with Hoechst (b and e). (B) C2 cells cultured for 36 h in methionine-depleted medium + 1% FCS were then incubated for 15 h in either differentiation medium (g and h) or proliferation medium (i and j; see Materials and Methods) for 15 h in presence (g and i) or absence (h and j) of 0.1 mM BrdU. Cells were then fixed and processed for immunofluorescence analysis using antibodies against BrdU (g and i) or myogenin (h and j). Bar, 10 μM.
Preparation of Primary Mouse Myoblasts Culture
This protocol is derived from that of Alterio et al. (1990) and Pinset and Montarras (1994). Primary myoblasts were prepared from three 6-wk-old BALBc mice. After sterile dissection, muscles from legs were minced in PBS supplemented with 200 U/ml of penicillin and 0.2 mg/ml of streptomycin. After three washes muscles were digested with pronase (Boehringer-Mannheim, Meylan, France) at 0.15%/g of tissue for 90 min with gentle pipetting every 15 min. After centrifugation at 130 g for 10 min to eliminate fragments, mouse primary cells were washed three times in DME/HAMF12 (1/1) supplemented with 10% FCS by centrifugation at 600 g for 10 min. Satellite cells were then plated on 35-mm collagen-coated (Poly-labo, Strasbourg, France) dishes and grown in DME/ HAMF12 (1/1) supplemented with 20% FCS and 2% Ultroser (Bio Sepra SA, Villeneuve La Garenne, France) for 72–96 h. For differentiation, DME plus 5% FCS was added for 12 h (see Fig. 3, e and f) and for 3 d (see Fig. 3, c, d, g, and h).
Figure 3.
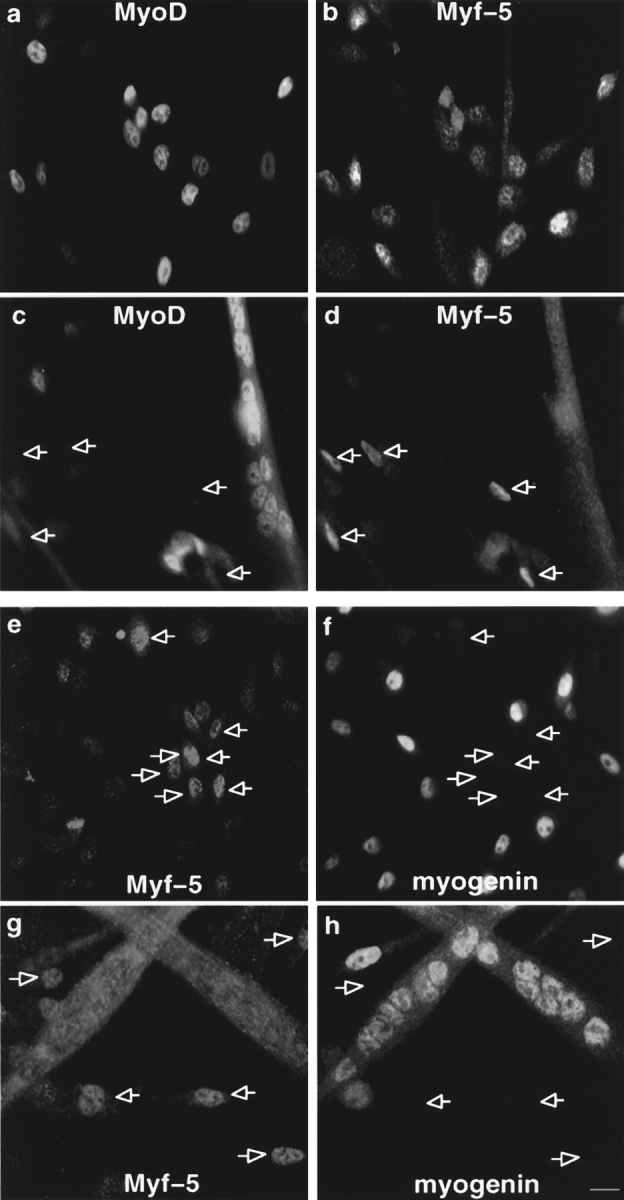
Coimmunofluorescence analysis of MyoD, Myf-5, and myogenin reveal two populations of myoblasts in mouse primary cells with different commitment to differentiation. Coimmunofluorescence analysis of MyoD and Myf-5 and in exponentially growing mouse primary myoblasts (a and b) and in differentiated cells after 3 d in DME 5% FCS (c and d). Coimmunofluorescence analysis of Myf-5 and myogenin in satellite cells differentiated for 12 h (e and f) and for 3 d (g and h). Arrowed in c and d are mononucleated cells expressing Myf-5 with no MyoD and arrowed in e–h are cells expressing Myf-5 which are devoid of myogenin. Bar, 10 μM.
Synchronization
2 × 10⁴ C2.7- and C2-inducible myoblasts were plated on 35-mm dishes. 24 h after plating, cells were rinsed twice in PBS and then shifted in DME without methionine supplemented with 1% FCS for 36 h. Quiescent (G0) myoblasts were allowed to reenter cell cycle by changing the medium to fresh DME containing 10% FCS. To determine S phase entry, 0.1 mM 5-bromodeoxyuridine (BrdU) was added to the culture during 15 min and then cells were processed for immunofluorescence analysis. Cells were also synchronized at the G1/S boundary by adding 1 mM hydroxyurea (HU; SIGMA, La Verpillère, France) 1 h after release of methionine deprivation and for a total period of 15 h. Cells were then extensively washed successively in PBS and DME plus 10% FCS. Maximal S phase (after a 15 min BrdU pulse) and M phase were obtained, respectively, 2 and 6 h after release of HU. Alternatively, quiescent myoblasts were obtained after differentiation of cultured myoblasts. Confluent C2 cells and primary mouse myoblasts were allowed to differentiate for 3 d. On average, 60–70% of myoblasts fuse and differentiate while 30–40% of myoblasts stop proliferating but do not differentiate. We found that myotubes are more sensitive to trypsinization than residual myoblasts. Thus, a short trypsinization (0.15%, 15″) allows removal of all the myotubes leaving only quiescent undifferentiated myoblasts still adherent to the culture dishes. These quiescent cells were then allowed to reenter the cell cycle by addition of fresh proliferation medium to the culture.
Western Blot Analysis
C2 or inducible cells were lysed in 5× Laemmli buffer (250 mM Tris-HCl, pH 6.8, 5% SDS, 35% glycerol, 40 mM DTT, and 1% of Bromophenol blue in ethanol). 50 μg total protein (protein concentrations were determined using the BioRad DC kit; BioRad, Ivry/Seine, France) were transferred onto nitrocellulose membranes (Schleicher and Schuell, Dassel, Germany). Membranes were blocked with PBS containing 5% skimmed milk and incubated for 1 h with primary antibodies: polyclonal C20 anti-MyoD (from Santa-Cruz, Biotechnology, Santa Cruz, CA) diluted 1/400, polyclonal anti-Myf-5 directed against the COOH-terminal portion of the protein, diluted 1/500 both antibodies anti-MyoD and anti-Myf-5 were already used in Carnac et al. (1998), anti-Myf-5 antibodies were also used in Auradé et al. (1997) and in Lindon et al. (1998), polyclonal anti-cyclin A (Girard et al., 1991) diluted 1/400, F5D supernatant anti-myogenin (the monoclonal antibody F5D developed by Wright et al. [1989] was obtained from the Developmental Studies Hybridoma Bank [DSHB] developed under Department of Biological Sciences, Iowa City, IA) diluted 1/5 and monoclonal DMA1A anti-tubulin (SIGMA) diluted 1/2,000. Membranes were washed and incubated for 30 min with a peroxidase-conjugated secondary antibody (Amersham, Les Ulis, France) at a dilution of 1/5,000. After several washes in PBS, membranes were incubated with chemiluminescence reagents.
cdk2 Immunoprecipitation and Histone H1 Assays
Synchronized C2 cells (as indicated in Fig. 2 B) were washed twice in 1× PBS and scrapped in 1 ml of PBS. After centrifugation at 3,000 rpm, the pellets were resuspended in lysis buffer (50 mM Tris, pH 7.4, 150 mM NaCl, 0,4% NP40, 2 mM EDTA, 50 mM NaF, 10 mM β-glycerophosphate, 1 mM ATP, 2 μg/ml of Leupeptin and Aprotinin, 2 mM Sodium Vanadate, and 2 mM DTT). After 10 passages through a 21-gauge needle, cell lysates were cleared by centrifugation at 13,000 rpm. Protein concentrations were determined using the BioRad DC kit. 200 μg of extract were immunoprecipitated with polyclonal anti-cdk2 (M2, used at a 1/50 dilution; Santa-Cruz Biotechnology). Protein A–Sepharose was added for 1 h at 4°C. After centrifugation, pellets were washed three times with lysis buffer, twice in lysis buffer containing 400 mM NaCl and twice in kinase buffer (25 mM Hepes, pH 7.4, 25 mM MgCl2, 25 mM β-glycerophosphate, 2 mM DTT, and 0.1 mM NaVO3). Beads containing immunoprecipitated cdk2 were incubated in 20 μl of kinase buffer containing 50 μM ATP, 5 μCi of γ-[32P]ATP (3,000 Ci/mmol; Amersham) and 2 μg of histone H1 (Boehringer-Mannheim) for 40 min at room temperature. Kinase reactions were stopped by addition of 5 μl of 5× Laemmli buffer (250 mM Tris-HCl pH 6.8, 5% SDS, 35% glycerol, 40 mM DTT, and 1% of Bromophenol blue in ethanol), boiled for 5 min before loading onto a 12% SDS–polyacrylamide gel and transferred to nitro-cellulose membranes (Schleicher and Schuell). The membranes were first exposed to Kodak X-ray films (Kodak, Marne La Vallée, France) and then used for Western blot analyses.
Figure 2.
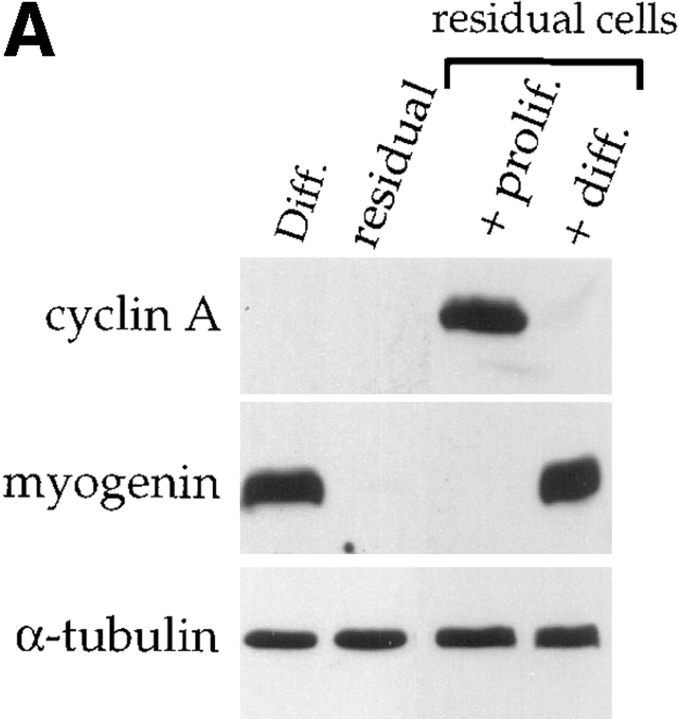
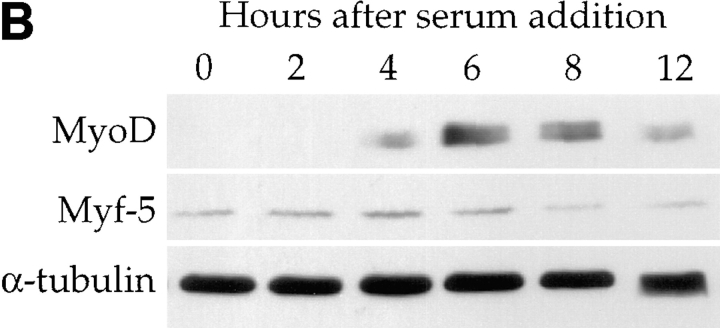
Differentiation-deficient myoblasts isolated from differentiated cells can reinduce MyoD and reactivate the differentiation program. C2 cells were allowed to differentiate for three days in differentiation medium. Mononucleated myoblasts were isolated after removing the population of myotubes after a short trypsinization of the culture. (A) Western blot analysis was carried out for cyclin A, myogenin, and α-tubulin on protein extracts from the total differentiated cells before trypsinization (Diff.), residual adherent cells after trypsinization (residual), residual cells refed for 24 h with serum-containing medium (residual cells + prolif.) or residual cells first refed with proliferation medium for 24 h and then switched to differentiation medium for 2 d (residual cells + diff.). (B) Adherent residual cells were allowed to reenter the cell cycle by adding serum-containing medium to the culture. Protein extracts at the indicated times after refeeding with proliferation medium were analyzed by Western blotting for MyoD, Myf-5, and α-tubulin expression.
Northern Blot Analysis
Total RNA was extracted using the guanidinium isothiocyanate/LiCl procedure as described by Catala et al. (1983). The fractioning of total RNA and procedures for transfer and hybridization to nylon membranes have been described in Carnac et al., 1992. Filters were hybridized using the following cDNA probes which were labeled by random priming mouse MyoD1 (Davis et al., 1987) and human Myf-5 (American Type Culture Collection, Rockville, MD).
Immunofluorescence
C2 cells and primary mouse myoblasts were fixed for 5 min in 3.7% formalin PBS followed by a 30-s extraction in −20°C acetone and rehydration in PBS containing 0.5% BSA. Expression of Myf-5, MyoD, and myogenin were analyzed using rabbit polyclonal anti–Myf-5 antibody (directed against the NH2-terminal portion of the protein diluted 1/300;) used in Auradé et al. (1997), Carnac et al. (1998), and Lindon et al. (1998), 5.8A mouse monoclonal antibody against MyoD diluted 1/5 (a gift of Drs P. Dias and P. Houghton, St. Jude Children's Hospital, Memphis, TN; Dias et al., 1992) and mouse monoclonal antibody against myogenin (F5D supernatant anti-myogenin, a gift from Dr. W.E. Wright, Department of Cell Biology, Vanderbilt University, Nashville, TN). BrdU was detected using monoclonal anti-BrdU antibody (Amersham). Primary antibodies diluted in PBS/BSA were incubated for 1 h at 37°C, then washed in PBS, followed by a 30-min incubation with biotinylated anti-rabbit or fluorescein-conjugated anti-mouse antibodies (1/200; Amersham). Biotinylated antibodies were finally revealed after 30 min incubation with streptavidin– Texas red (1/200; Amersham). DNA was stained with Hoechst (0.1 μg/ml; SIGMA).
Mitotic Shake Off and Nocodazole Block
Mitotic cells from a 80% subconfluent populations of asynchronous C2 cells grown in flasks were mechanically detached by repeated shaking. Supernatants were centrifuged at 1,000 rpm for 7 min and the pellet containing mitotic cells resuspended in DME plus 10% FCS and plated at 105 cells per 60-mm dish. For Western blot analysis, cells were lysed in Laemmli buffer immediately, when mitotic cells are initially collected, point 0, at 1, 2, 3, 4, and 5 h after mitotic cells have been plated. MyoD and α-tubulin protein levels were analyzed as previously described (see Western Blot Analysis). For immunofluorescence analysis, cells were fixed at different times after reattachment. Cells were subsequently stained for MyoD or BrdU (after a 15-min BrdU pulse) as described above (see Immunofluorescence).
Dishes of 80% subconfluent populations of asynchronous Inducible C2 cells were treated with 1 μM of Nocodazole (SIGMA) for 14 h. Cells blocked in pseudo-metaphase were detached by gently shaking and released from nocodazole by three washes in PBS by centrifugation at 1,000 rpm for 7 min. The pellet was resuspended in DME plus 10% FCS and plated at 105 cells per 60-mm dish. For Western blot analysis, cells were lysed in Laemmli buffer immediately after the three washes and at 2, 4, 6, and 9 h after release from nocodazole and replating. (In Fig. 8, cont) represents proteins from asynchronous proliferative inducible C2 cells. Myf-5 and α-tubulin protein levels were analyzed as previously described (see Western Blot Analysis).
Figure 8.
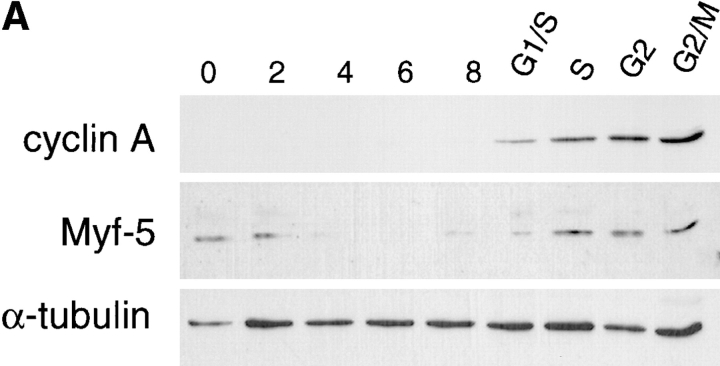
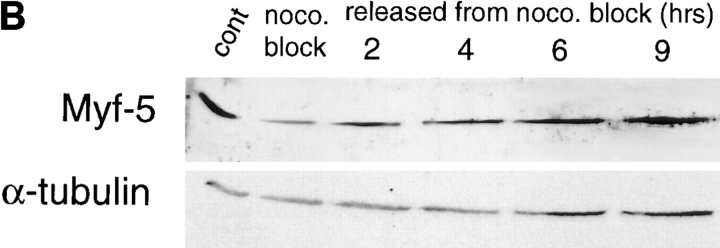
Cell cycle variation of Myf-5 occurs independently of MyoD and Myf-5 expression declines only in mitosis in cycling cells. (A) To examine if the cyclic pattern of Myf-5 expression was associated with the changes in MyoD expression, we examined Myf-5 expression pattern in inducible C2 cells, a variant of C2 cells which express Myf-5 but not MyoD (see Materials and Methods). Cells were synchronized by methionine deprivation and HU block as for the C2 parental cells (see Fig. 5). Protein extracts were analyzed by Western blot analysis for cyclin A, Myf-5 and α-tubulin expression at indicated times, in G1 cells (G0 to 8 h after refeeding) and in cells resynchronized in S-phase with HU (G1/ S to G2/M). (B) To examine Myf-5 expression in the course of a nonarrested cell cycle, inducible C2 cells were blocked with nocodazole and Myf-5 expression pattern was analyzed after release from nocodazole (at the indicated times) in comparison with nocodazole blocked cells (0) and asynchronous cells (cont). Protein extracts were analyzed by Western blot analysis for Myf-5 and α-tubulin expression.
ImgCalc Quantification
Western blot and Northern blot analyses were scanned and quantified (see Fig. 9), using ImgCalc sensitivity software (developed by N.J.C. Lamb, details upon request) on a Silicon Graphics Indigo 2 workstation.
Figure 9.
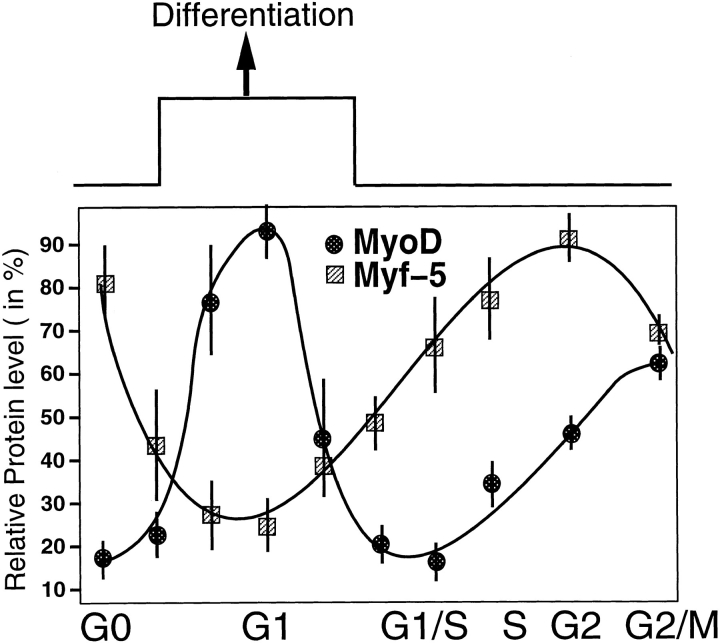
Schematic representation of the cell cycle related changes in MyoD and Myf-5, with the potential links to the capacity of muscle cells to differentiate. Entry into differentiation occurs in G1 phase of muscle division cycle as determined by Nadal-Ginard (1978). The values plotted of MyoD and Myf-5 from G1/S boundary to G2/M were drawn from double block synchronization (first block in G0 after methionine deprivation, second block in G1/S after HU treatment), whereas the values plotted for G0 and G1 were drawn from single G0 block. Arbitrary units correspond to the relative protein levels of MyoD or Myf-5 corrected for loading variations using α-tubulin immunoblot as a control. Error bars represent maximal variations for each value.
Results
The Expression of MyoD and Myf-5 Defines Two Populations of Cells in Differentiated C2 Myoblasts and Primary Mouse Myoblasts
To assess the possible link between the expression of MyoD and Myf-5 and cell cycle withdrawal leading into differentiation, we examined MyoD and Myf-5 levels during C2 cells differentiation by coimmunofluorescence staining for MyoD and Myf-5 and for Myf-5 and myogenin, an early marker of differentiation (Wright et al., 1989). As shown in Fig. 1 A (a and b), exponentially growing cells can coexpress MyoD and Myf-5 whereas Myf-5, and MyoD expression are mutually excluded in differentiated cells with Myf-5 immunoreactivity being only detected in a subpopulation of mononucleated cells and not in multinucleated myotubes (Fig. 1 A, c and d). Costaining for Myf-5 and myogenin shows that Myf-5 positive cells do not express the differentiation marker myogenin (Fig. 1 A, e and f) and are apparently quiescent as judged by the absence of DNA synthesis (unpublished observations). In contrast, MyoD protein is mostly found in multinucleated myotubes expressing myogenin and is absent from Myf-5 positive cells (unpublished observations and Fig. 1 A, c and d). These data show that when cells exit from the cell division cycle and enter differentiation, the expression profiles of MyoD and Myf-5 become mutually exclusive in contrast to proliferating myoblasts. These data are in agreement with a report analyzing Myf-5 and MyoD immunostaining during in vitro muscle differentiation (Lindon et al., 1998).
Figure 1.
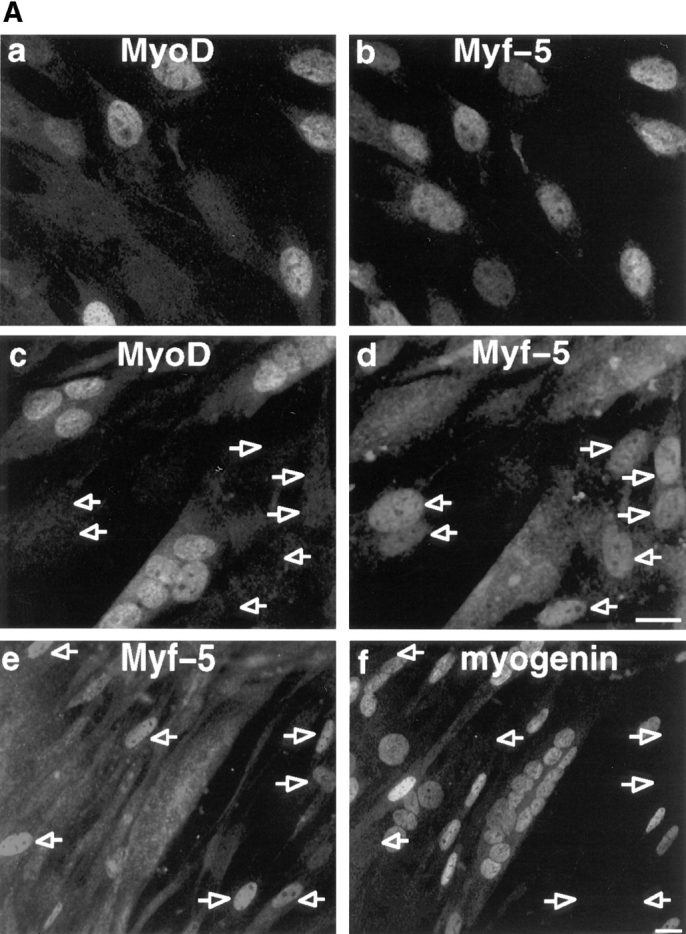
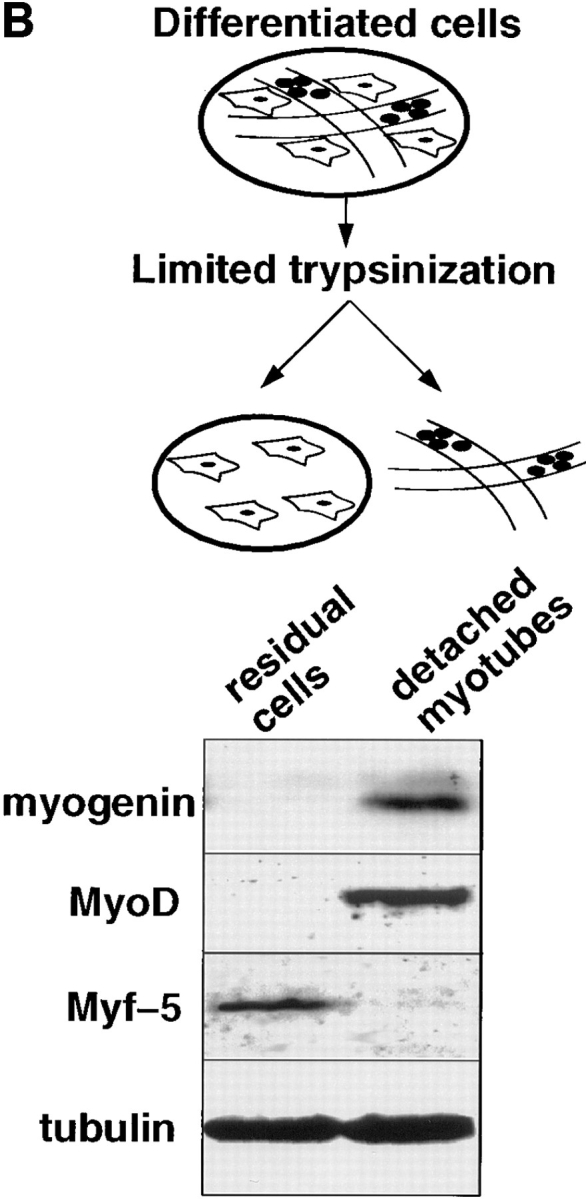
Analysis of MyoD, Myf-5 and myogenin reveal two populations of myoblasts with different commitment to differentiation. (A) Coimmunofluorescence analysis of MyoD and Myf-5 in exponentially growing C2 cells (a and b) and in differentiated cells after 3 d in differentiation medium (c and d). Differentiated cells were also analyzed by costaining for Myf-5 with myogenin (e and f). Arrowed in c and d are mononucleated cells expressing Myf-5 with no MyoD and arrowed in e and f are cells expressing Myf-5 that are devoid of myogenin. (B) Limited trypsinization of differentiated cells gave rise to two populations of cells: residual adherent cells and detached myotubes (top). Western blot analysis of these two populations was carried out for myogenin, MyoD, Myf-5, and α-tubulin (bottom). Bar, 10 μM.
Immunofluorescence on Fig. 1 A shows a cytoplasmic staining for Myf-5 in differentiated cells (d and e). To check if this cytoplasmic staining was specific for Myf-5, we have examined the patterns of Myf-5 and MyoD proteins by comparative Western blot analysis of the detached myotubes versus residual nondifferentiated cells. The population of adherent myoblasts was enriched by removing most if not all myotubes after short trypsinization of the differentiated culture (see Materials and Methods and Fig. 1 B, top). Western blot analysis in Fig. 1 B reveals that residual cells are not differentiated since they do not express the early differentiation marker myogenin. These cells clearly express Myf-5 but not MyoD. An opposite pattern is observed for detached myotubes that contain a high level of myogenin and MyoD but little or no Myf-5. This result suggests that the cytoplasmic staining observed for Myf-5 in myotubes results from a nonspecific signal. This was confirmed by preincubating Myf-5 antibody with GST-Myf-5 before immunofluorescent staining of differentiated C2 cells. Such preincubation only suppressed the nuclear staining but not the cytoplasmic staining for Myf-5 (unpublished observations). Together with the immunoblot in Fig. 1 B, these data show that myotubes do not contain Myf-5.
To investigate whether the loss of MyoD expression observed in differentiation-deficient myoblasts was an irreversible process or a cell cycle–dependent event, residual cells were stimulated with serum. As shown in Fig. 2 A residual adherent cells do not express either the myogenic marker myogenin (as previously shown on Fig. 1 B), or cyclin A, an early marker of S phase (Girard et al., 1991) suggesting they are quiescent. These undifferentiated and nonproliferative myoblasts can be induced to reenter the cell cycle upon addition of fresh proliferation medium to the culture for 24 h as attested by the upregulation of cyclin A expression (Fig. 2 A). When subsequently placed in differentiation medium for 48 h, these cells undergo apparently normal differentiation and reexpress myogenin (Fig. 2 A). Western blotting of MyoD and Myf-5 expression was carried out at different times after refeeding residual quiescent myoblasts with serum-containing medium. MyoD, absent from quiescent myoblasts, peaks 6 h after addition of fresh medium and then decreases by 12 h, before the appearance of cyclin A which is first detected by 15 h (Fig. 2 B and data not shown). In contrast, Myf-5 that is expressed in quiescent cells decreases as cells reenter the cell cycle.
To examine if our observations could be extended beyond the C2 cells “in vitro” system, to other myogenic cell populations, primary mouse myoblasts culture was performed. We examined MyoD and Myf-5 levels during primary mouse myoblasts proliferation and differentiation by coimmunofluorescence staining for MyoD and Myf-5, and for Myf-5 and myogenin. As shown in Fig. 3 (a and b), exponentially growing cells can coexpress MyoD and Myf-5 whereas Myf-5 and MyoD expression are mutually excluded in differentiated cells with Myf-5 immunoreactivity being only detected in a subpopulation of mononucleated cells and not in multinucleated myotubes (Fig. 3, c and d). Costaining for Myf-5 and myogenin shows that Myf-5 positive cells do not express the differentiation marker myogenin (Fig. 3, e–h) and that this mutual exclusion occurs as soon as 12 h of differentiation (Fig. 3, e and f). In contrast, MyoD protein is mostly found in multinucleated myotubes expressing myogenin and is absent from Myf-5 positive cells (Fig. 3, c and d and data not shown). Therefore, as previously shown for C2 cells (Fig. 1 A), the expression profiles of MyoD and Myf-5 become mutually exclusive during primary mouse myoblasts differentiation allowing two populations to be defined. One population of undifferentiated cells expressing high levels of Myf-5 without MyoD, in contrast to the other population of differentiated cells expressing MyoD without Myf-5. These primary mouse myoblasts also reinduced MyoD expression (with a concomitant decrease of Myf-5) after myotubes removal (by mild trypsinization) and serum stimulation of residual quiescent cells (as for C2 cells, see Fig. 2 B, unpublished observations). These results confirm the correlation between the potential of cells to differentiate and their ratios of Myf-5 and MyoD expression.
Taken together, these results show that C2 myoblasts as well as cultured primary mouse myoblasts, express different ratios of MyoD and Myf-5 correlated to their potential to differentiate: myoblasts containing high levels of Myf-5 appear quiescent and fail to differentiate whereas myoblasts expressing high levels of MyoD are differentiated. These data also show that the expression of both MyoD and Myf-5 proteins is regulated upon reentry of quiescent cells into proliferation and thus must be subject to cell cycle–dependent regulation.
Methionine Deprivation Blocks C2 Myoblast Proliferation without Induction of Differentiation
To determine the impact of cell cycle on MyoD and Myf-5 gene expression, we needed to produce highly synchronized muscle cells. Although a number of procedures have been developed for establishing synchronous cultures of mammalian cells in G0/G1, many of these protocols, based on serum starvation to block cell proliferation, are not applicable in muscle cells because they induce differentiation (Krek and DeCaprio, 1995). To obtain myoblasts in a quiescent state but without entry into the differentiation pathway, we used two methods based on manipulation of medium conditions. We used Ham F12 nutrient mixture, a poor medium for myogenic induction (Pinset and Whalen, 1984) and methionine-depleted medium since methionine is an essential amino acid required for growth but not for cell viability (Nadal-Ginard, 1978). C2 myoblasts were grown in Ham F12 supplemented with 1% serum, or in methionine-depleted DME medium plus 1% serum. After 36 h, cells were pulse labeled with BrdU which is incorporated into DNA during DNA synthesis and thus allows the identification of cells undergoing S phase. Cells were then fixed and processed for immunofluorescence analysis using monoclonal antibodies directed against BrdU or myogenin. In Ham F12 plus 1% serum, cells showed some incorporation of BrdU (10–15% of cells are BrdU positive; Fig. 4 A, a and b) and tend to differentiate as shown by the significant proportion of myogenin positive cells (10% of cells are myogenin positive; Fig. 4 A, c). Myoblasts grown in methionine-depleted DME + 1% serum do not incorporate BrdU and therefore appear to be quiescent (Fig. 4 A, d and e). In contrast to cells treated with low serum only, these cells do not differentiate as judged by the lack of myogenin positive nuclei (Fig. 4 A, f). Thus, amino acid deprivation allowed efficient arrest of muscle cells in a quiescent and nondifferentiated state.
To verify that such quiescent myoblasts retain the ability to either proliferate or differentiate, C2 cells cultured for 36 h in methionine-depleted medium were incubated with either proliferation or differentiation medium for 15 h in the presence of BrdU. Cells were then analyzed for BrdU incorporation or myogenin expression by immunofluorescence. As shown in Fig. 4 B, addition of differentiation medium to quiescent myoblasts is accompanied by a significant induction of myogenin (50–60% of cells are myogenin positive) and only limited progression into S phase (5–10% of cells are BrdU positive; Fig. 4 B, g and h). In contrast, quiescent myoblasts refed with proliferation medium passed through S phase (50–60% of cells are BrdU positive) and do not expressed myogenin (Fig. 4 B, i and j).
These results demonstrate that mouse C2 myoblasts can be efficiently arrested by methionine deprivation in a quiescent state without any induction of differentiation. This growth arrest is reversible since quiescent C2 myoblasts can either reenter proliferation or undergo differentiation depending on extracellular signals received.
Characterization of C2 Myoblasts Cell Cycle
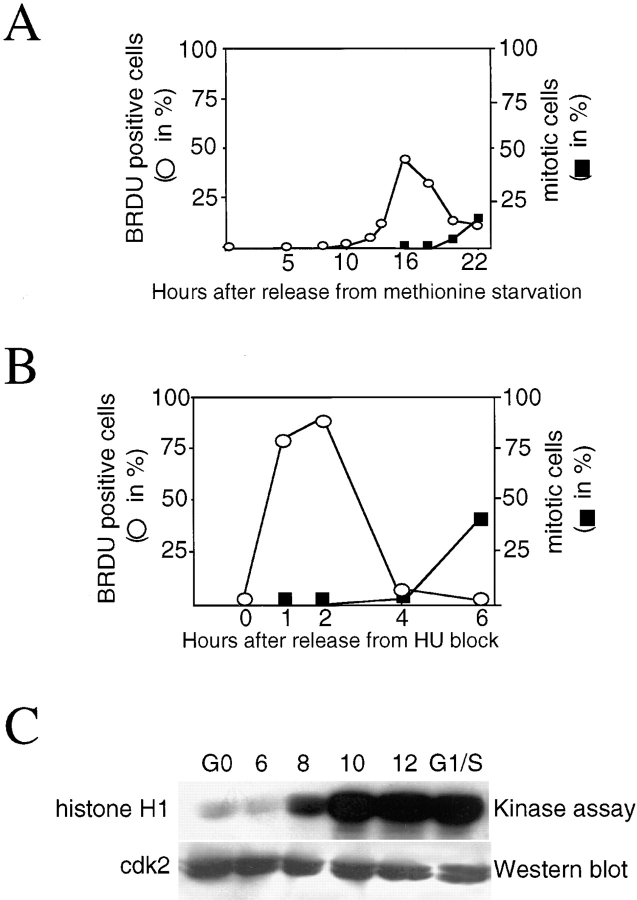
To analyze MyoD and Myf-5 expression during the cell cycle, initial experiments were performed to assess accurately the proportion of cells in a given phase of the cell cycle. We estimated the percentage of cells entering S phase and the length of S phase by measuring the incorporation of BrdU using immunofluorescence analysis. For this purpose, myoblasts cultured in methionine-depleted medium were refed with proliferation medium and at the time indicated thereafter, were pulse-labeled for 15 min with BrdU, before fixation and immunofluorescence treatment for detection of BrdU incorporation. As shown in Fig. 5 A, the first BrdU positive cells are detected 12–14 h after refeeding and for the next 5–6 h, with a peak of 50% cells incorporating BrdU by 16 h after refeeding. The majority of cells have progressed through S phase by 18 h after refeeding. Beyond this time, <20% of the myoblasts are still BrdU positive indicating that DNA synthesis is nearly completed, as confirmed by entry into mitosis 20 h after refeeding. Quiescent myoblasts are thus able to undergo normal cell cycle progression upon serum refeeding. However, the pulses of BrdU incorporation show that the peak of S phase is large, spreading over 8 h. This indicates that cells enter S phase successively and not synchronously, most likely due to their variable length of G1 phase. Drugs such as hydroxyurea (HU) prevent DNA replication and have been successfully used to synchronize cells at G1/S boundary. HU block is fully reversible and allows progression into S phase synchronously (Lamb et al., 1992; for review see Krek and DeCaprio, 1995). Thus, to resynchronize C2 myoblasts at the G1/S boundary, quiescent (G0) cells were treated with HU during G1 progression, by addition of HU from 1 to 15 h after release from methionine deprivation. To estimate the length of S phase, cells were pulse labeled with BrdU for 15 min at different times after released from HU treatment and analyzed for BrdU incorporation by immunofluorescence analysis. As shown in Fig. 5 B, >90% of cells went through S phase in a period that does not exceed 4 h after release from HU block, with a peak between 1 and 3 h. 6 h after HU release, 40% of myoblast entered mitosis. This mitotic index is extremely high considering that mitosis itself is an event which lasts <1 h. Therefore, C2 myoblast synchronization by double-block (G0-methionine deprivation and G1/S-HU block) allows accurate determination of the length of the different cell cycle phases: G1 spreads from 0 to 12– 14 h after refeeding, followed by 2–3 h of S phase and 3–4 h of G2 before cells reach mitosis, representing a total length for C2 cell cycle of 20–22 h after release from a quiescent state. The efficiency of synchronization during G1 and G1/S was also evaluated by measuring the histone H1 activity of cdk2 which is maximal at the end of G1 and G1/S transition (Pagano et al., 1993). This kinase was immunoprecipitated from quiescent myoblasts, at different times after release from methionine deprivation and from HU-treated cells, to assay for its kinase activity against histone H1. The efficiency of immunoprecipitation was determined by Western blot analysis. As expected, the histone H1 activity of cdk2 is not detected in quiescent cells and is strong 10 to 12 h after refeeding in late G1 cells (Fig. 5 C). In HU-blocked cells, cdk2 histone H1 activity is identical to that in late G1 cells, indicating that HU treatment efficiently blocked cells at the G1/S boundary (Fig. 5 C).
Figure 5.
C2 myoblasts can be efficiently and accurately synchronized in a precise phase of their cell division cycle. Asynchronous C2 cells were arrested in quiescence by incubation in methionine depleted medium containing 1% serum for 36 h. Reentry into the cell cycle was allowed by refeeding them with proliferation medium. At different times after refeeding, cells were pulse-labeled for 15 min with BrdU before fixation and analysis for BrdU incorporation by immunofluorescence. (A) Plotted values represent the percentage of cells positive for BrdU incorporation (empty circles) and the percentage of mitotic cells (filled squares) over the total population of cells at given times after restimulation. (B) Cells, made quiescent by methionine deprivation, were induced to proliferate with serum containing medium and HU was added from 1 to 15 h after refeeding, allowing cells to progress through G1. Cells were subsequently released from HU block by washing off the HU and addition of serum containing medium, pulse-labeled for 15 min with BrdU and processed for immunofluorescence analysis at the indicated times. The percentage of cells in S phase was determined by counting BrdU positive cells over the total number of cells (empty circles). The percentage of mitotic cells is also plotted (filled squares). Percentages in A and B were determined after counting >300 cells for each point. (C) cdk2 protein was immunoprecipitated from quiescent myoblasts at different times after release from methionine deprivation and from G1/S blocked myoblasts which were released 15 h after the addition of HU as in B (see Material and Methods). cdk2 kinase activity was evaluated against histone H1. Shown is an autoradiograph of the radioactivity incorporated into histone H1 and a Western blot analysis of the same membrane probed for anti-cdk2. Times above are in hours after refeeding. Synchronized cells with HU block are marked G1/S.
Together, these data show that we developed a method allowing effective synchronization of muscle cells and production of cells synchronized in a given phase of their cell division cycle.
Cell Cycle Dependence of MyoD and Myf-5 Expression
To analyze the expression of MyoD and Myf-5 in the course of the cell cycle, proteins and mRNA extracts were prepared from synchronized myoblasts at different times after release from methionine deprivation and from HU block. Western blot analysis revealed that MyoD protein is barely detectable in G0, peaks in the middle of G1, then decreases at the end of G1, before the appearance of cyclin A to reincreases until mitosis (Fig. 6 A). Using HU block to better synchronize cells in the second half of their division cycle, we confirm that MyoD is low or absent at the G1/S boundary and reincreases as cells progress through S phase (Fig. 6 B). Therefore, MyoD appears to undergo a bimodal pattern of expression in the course of one division cycle after release from quiescence, with a peak in the middle of G1 and at the end of G2. In contrast to MyoD, Myf-5 protein level is high in quiescent myoblasts, decreases to barely detectable level during early G1 phase, and reappears at the end of G1 before cyclin A to remain stable until mitosis (Fig. 6, A and B). HU block reveals that Myf-5 is effectively maintained as myoblasts go through S and G2 phases but tends to decrease in G2/M (Fig. 6 B). The cell cycle–dependent changes in MyoD protein are well correlated with the level of MyoD mRNA which show a low level in G0, a peak in early G1, a downregulation in late G1 and a slight increase during progression into G2/M phase (Fig. 6 C). Myf-5 mRNA is present at high level in G0 myoblasts and decreases during the G0/ G1 transition to remain relatively unchanged during the rest of cell cycle progression. This constant level of Myf-5 mRNA seen after G1 suggests that posttranscriptional mechanisms must be also involved in the upregulation of Myf-5 protein observed at the end of G1 and as DNA synthesis proceeds (Fig. 6 C).
Figure 6.
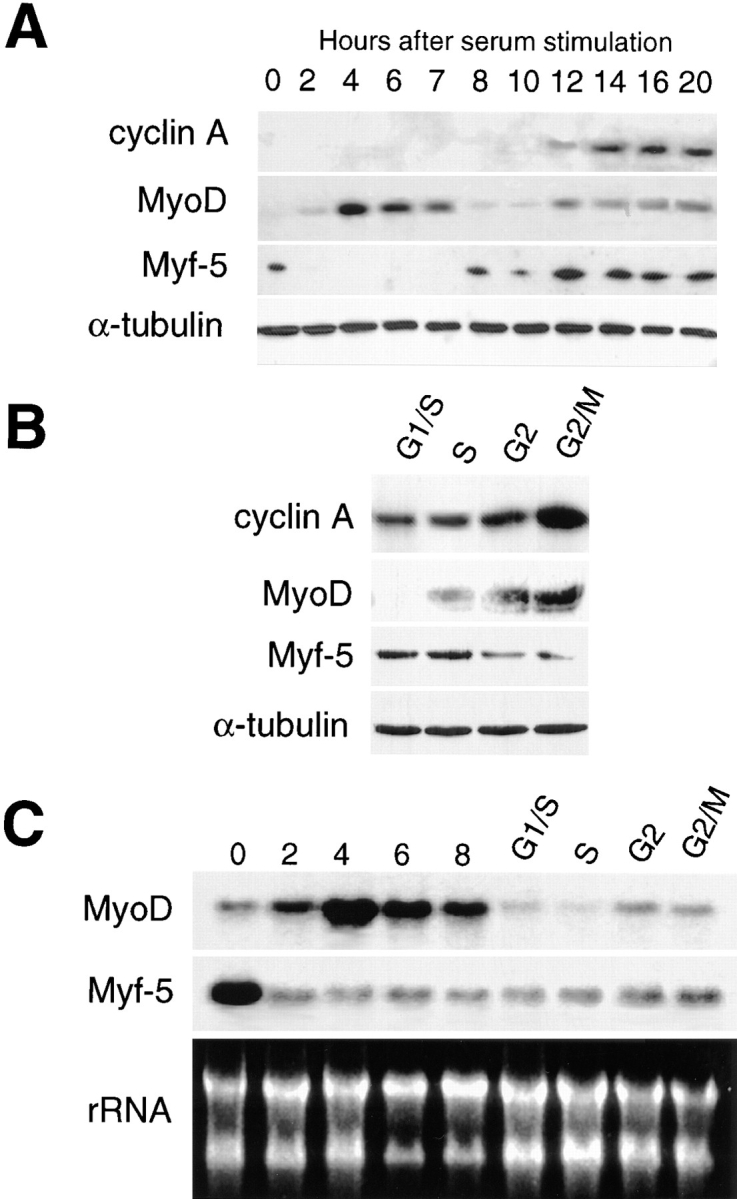
MyoD and Myf-5 are subject to different cell cycle– dependent regulation. C2 myoblasts cultured with methionine-depleted medium containing 1% serum were refed with proliferation medium. Proteins (A and B) and mRNA (C) were extracted at different times after refeeding. (A) Western blot analysis of proteins extracted from G0 to 20 h. Similar membranes were blotted for cyclin A, Myf-5, MyoD, and α-tubulin (an internal loading control). (B) To analyze the expression of proteins in the second part of the cell cycle, i.e., from G1/S to G2/M, cells were resynchronized after methionine starvation by incubation in HU for 15 h in proliferation medium. Shown is the expression of cyclin A, Myf-5, MyoD, and α-tubulin in resynchronized cells: S, G2, and G2/M represent cells fixed 2, 4, and 6 h, respectively, after release from HU. (C) mRNA expression was analyzed in G1 cells (G0 to 8 h after refeeding) and in cells resynchronized in S-phase with HU (G1/S to G2/M). Expression of Myf-5 and MyoD mRNA is shown with homogeneity in RNA loading demonstrated by revealing ribosomal RNA after ethidium bromide staining.
Together these data show that the expressions of MyoD and Myf-5 are subject to opposite cell cycle–dependent regulation in dividing myoblasts in particular as cells come out of quiescent G0-stage. To assess the changes in MyoD protein in cell cycling without passing through a G0 quiescent stage, i.e., from M to G1 phase, we performed mitotic shake off experiments. Exponentially growing myoblasts were subject to repeated shake off to detach the population of cells in mitosis. Detached cells were subsequently allowed to reattach in dishes and analyzed by immunofluorescence at the time indicated for MyoD expression and for BrdU incorporation to determine exactly the entry into S phase. Mitotic cells progress very quickly into the next cell cycle reaching the S phase 4 h after the initial shake off (Fig. 7 A) and entering mitosis 10–12 h after the shake off (unpublished observations). The total length of C2 myoblasts cycle between two mitosis is therefore 10–12 h, in complete agreement with the doubling time in a culture of growing C2 myoblasts, which we have measured to be 12 h (unpublished observations). It is worth noting that the length of G1 phase determined after release from the quiescent state exceeds by ∼6 h the estimated G1 phase after the mitotic shake off (12 and 4 h, respectively; compare Figs. 5 and 7). However, quiescent cells have to go through an exceeding 6–8-h period to exit from G0 (for review see Zetterberg et al., 1995), thus explaining the 6-h difference between the length of G1 after G0 or mitosis.
Figure 7.
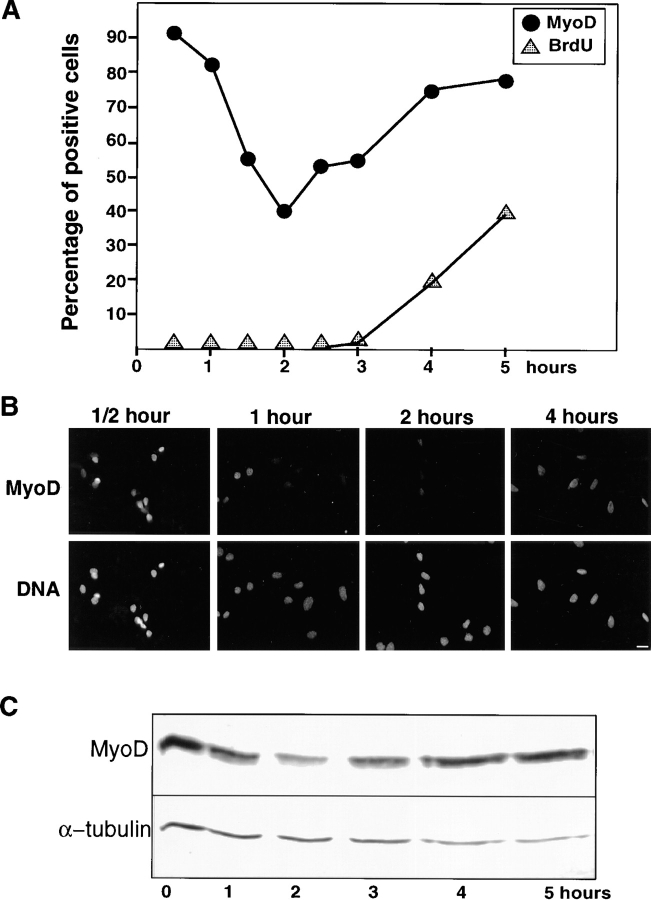
Analysis of MyoD expression after mitotic shake off reveals rapid changes in its expression. The expression profile for MyoD was also assessed in the course of normal cell cycle. Mitotic cells, detached by repeated shakes, were allowed to attach and grown for different times prior (a) to a 15-min pulse labeling with BrdU to assess S-phase (b) immunofluorescence analysis to assess the proportion of MyoD positive cells, (c) Western blotting to assess the amount of MyoD. (A) Comparative percentage of MyoD-expressing cells and of cells positive for BrdU incorporation after immunofluorescence analysis. (B) Immunofluorescence analysis photomicrographs of replated myoblasts stained for MyoD at different times after mitotic shake off. Shown are cells stained for MyoD (top) and the same cells stained for DNA with Hoechst (bottom). (C) Protein extracts, from cells replated after mitotic shake off and grown for 1–5 h, were analyzed for MyoD expression (top) and α-tubulin as an internal control (bottom). Bar, 10 μM.
During the first hour after the mitotic shake off, the percentage of MyoD-expressing cells observed by immunofluorescence is very high, between 80–90%, then drops markedly to 40% 2 h after shake off and reincreases to 80% at 4 h when cells entered S phase and remains high as cells progress into S phase (Fig. 7, A and B). To confirm these observations, Western blot analyses were performed on mitotic cells harvested immediately after the shake off and 1, 2, 3, 4, and 5 h after reattachment. Immunoblot analysis shown in Fig. 7 C confirms the data obtained by immunofluorescence: the expression of MyoD is high during the first hour after the initial shake off, drops markedly at 2 h and then reincreases between 3 to 5 h post shake off. Thus, MyoD expression is maintained at high levels at the M to G1 transition. The pattern of expression observed during progression from G1 to S is similar to that observed in G0-synchronized myoblasts (see Fig. 6) and shows that in continuously cycling cells, MyoD is also downregulated before entry into S.
The respective patterns of MyoD and Myf-5 expression during cell cycle progression are clearly different suggesting that their expression may be controlled by distinct regulatory pathways. However, since it has been reported that MyoD can repress Myf-5 expression both in vivo and in vitro (Rudnicki et al., 1992; Montarras et al., 1996), the downregulation of Myf-5 we observed during early G1 may be due to a suppressive effect of MyoD high expression. To test this possibility, we used a C2-derived variant, termed inducible-C2 (IND-C2; Pinset et al., 1988). Unlike parental C2 cells, inducible myoblasts do not express MyoD at the myoblast stage and fail to differentiate spontaneously in the absence of added insulin. However, these differentiation-deficient myoblasts do express Myf-5 (Montarras et al., 1996). We have investigated the cell cycle variation of Myf-5 in inducible-C2 cells after double synchronization by methionine deprivation and HU block as done for the parental cells. Western blot analysis shows that these cells are highly synchronized as attested by the appearance of cyclin A as DNA synthesis proceeds (Fig. 8 A). In such synchronized cell extracts, Myf-5 expression pattern is similar to that described above for parental cells: Myf-5 is already expressed in G0, decreases to barely detectable in early G1 phase and after a rise in G1/S, remains at a high level from S to mitosis (compare Fig. 8 A with Fig. 6). Thus, it appears clear that the cell cycle–specific modulation of Myf-5 protein level occurs independently of MyoD.
We have investigated the oscillation of Myf-5 expression in randomly growing (i.e., without starvation) inducible cells by blocking cells with nocodazole (which blocks cells at the pseudometaphase stage; Fig. 8 B). Western blot analysis shows that Myf-5 protein level is largely decreased in pseudometaphase arrested cells (Fig. 8 B, noco block) compared with Myf-5 protein level in randomly growing IND C2 cells (Fig. 8 B, cont) as previously shown by Lindon et al. (1998). After release from nocodazole, Myf-5 expression progressively increased. In light of this, we believe a drop in Myf-5 level takes place between G2 and G1 and, in growing cells, this time window is relatively short.
Discussion
Effective synchronization of dividing C2 myoblasts allowed us to examine accurately the expression patterns of the key myogenic regulators MyoD and Myf-5 at specific phases of the myoblast cell cycle. Both MyoD and Myf-5 protein levels fluctuated in a cell cycle–dependent fashion although their expression patterns differed as myoblasts progressed through the different cell cycle phases (see Fig. 9). MyoD expression peaked in mid G1 whereas Myf-5 showed maximal protein levels in G0 and G2 cells. Therefore during G1, a time when cells may potentially exit the cell cycle and enter differentiation (Nadal-Ginard, 1978), myoblasts display the highest expression of MyoD accompanied by low levels of Myf-5. Such a MyoD/Myf-5 ratio might represent a prerequisite for the initiation of differentiation. Importantly, this conclusion could be extended beyond the C2 cell line system, to primary mouse myoblasts derived from adult muscle, i.e., satellite cells.
Serum and Amino Acid Starvation Represent a Reproducible Means for Synchronizing Myoblasts
Under standard growth conditions, removal of serum growth factors from proliferating myoblasts coincides with the withdrawal of myoblasts from the cell cycle and initiation of myogenesis. We have described for the first time a reproducible method for synchronizing myoblasts without inducing entry into myogenesis. We used a combination of methionine deprivation and serum starvation to block muscle cells in a quiescent (G0) stage without concomitant induction of differentiation. Such G0 arrested myoblasts retained the potential to either reenter proliferation or undergo differentiation in a manner dependent on extracellular signaling. After stimulation, G0 arrested myoblasts progress through the cell cycle expressing key cell cycle regulators, with kinetics identical to those described for nontransformed fibroblasts (Girard et al., 1991; Lamb et al., 1992). This artificially induced quiescent state appears identical to a naturally occurring quiescence found in populations of myoblasts that failed to differentiate after myogenic induction and can be isolated by limited trypsinization to remove differentiated cells. These residual attached cells can subsequently enter into proliferation or differentiation upon appropriate stimulation.
Use of synchronized C2 cells as a model to study muscle cell cycle is further supported by our observations that, like C2 cells, primary mouse myoblasts allowed to differentiate retain a subpopulation of undifferentiated cells that can be reinduced to proliferate or differentiate (data not shown). Moreover, MyoD and Myf-5 expression patterns appeared similar in both systems, with Myf-5 expressed at its highest level and MyoD absent in arrested cells. This ratio is reversed as cells reenter the cell cycle or differentiate. These similarities suggest that the conclusions of the study we have carried out in C2 cells can be validly extended to primary myoblasts isolated from adult mouse muscle.
Peak Expression of MyoD Coincides with the Initiation of Myogenesis
Heterogeneous levels of MyoD expression in asynchronous myoblasts was first observed by Tapscott et al. (1988) who hypothesized a possible link between cell cycle transit and variations in MyoD expression. We demonstrate here that MyoD expression is indeed modulated by cell cycle– dependent events in proliferating myoblasts. We have shown that MyoD is induced at the G0/G1 transition, peak in mid G1 and after falling to a minimum level coincident with entry into S-phase, MyoD levels are maximal as cells pass through mitosis and early G1 of a new cell cycle.
After the upregulation at the G0/G1 transition, we show that MyoD expression drops to its minimal level at the end of G1, before S phase entry. Interestingly, when MyoD is ectopically expressed and thus artificially maintained during G1, cells do not progress into S phase and thus appear stopped in G1 (Crescenzi et al., 1990; Sorrentino et al., 1990; Thorburn et al., 1993). Together with these reports using ectopic expression of MyoD, our data imply that downregulation of MyoD in late G1 is a prerequisite point for further cell cycle progression into S phase. As such, MyoD, like pRb (Bartek et al., 1996) and the cdk inhibitor p27kip1 (Polyak et al., 1994; Coats et al., 1996), may participate in the establishment of a restriction point (defined as a point beyond which cell cycle progression becomes independent of growth factors; Zetterberg et al., 1995) in muscle cells and thereby control the decision to proliferate or differentiate.
We observed a second peak of MyoD expression in late G2/M phase. Since cell cycle exit and induction of differentiation only take place in G1 (Nadal-Ginard, 1978) and in any case in late G2/mitosis, MyoD activity must be suppressed at this period of the cell cycle. One way to inhibit MyoD activity may be phosphorylation, as MyoD is a phosphoprotein (Tapscott et al., 1988). We observed that MyoD is hyperphosphorylated during mitosis and that cdc2-cyclinB (active during mitosis; Nurse, 1994) is most likely implicated in this phosphorylation (M. Kitzmann, M. Vandromme, V. Schaeffer, G. Carnac, J.C. Labbé, N. Lamb, and A. Fernandez, manuscript in preparation).
This cell cycle–dependent expression of MyoD emphasizes the fact that MyoD is the muscle regulatory factor primarily responsible for the initiation of differentiation. Therefore, a strong expression of MyoD in G1 phase of the cell cycle may define a “time-window” in which differentiation can take place (Fig. 9).
MyoD and Myf-5 Are Nonredundant Muscle Regulatory Factors
We found that cells positive for differentiation markers expressed MyoD and not Myf-5 whereas cells that remain undifferentiated expressed Myf-5 and were devoid of MyoD. The expression profile observed for Myf-5 during G0 and G1 phases of the cell cycle, high in G0 and minimal during G1, is exactly opposite to the pattern seen for MyoD expression. Interestingly although Myf-5 and MyoD expression patterns closely coincide in these two systems, they differ from those observed in cells released from mitosis after mitotic shake off or nocodazole block. A number of significant differences exists between G0/G1 and M/G1 transitions. In cells sychronized by mitotic shake off, we observed a rapid entry into S phase (G1 lasting from 4–5 h), in contrast to that observed when cells exit from G0 after serum refeeding (G1 of 12–14 h). That the length of G1 after serum arrest differs from that observed in cells passing from M to G1 has previously been described (Zetterberg et al., 1995). This difference defines an “early G1”, a 6–8-h period necessary to exit G0, which corresponds to the time required to reinitiate de novo gene expression and protein synthesis. Absence of this “early G1” explains why neither the first peak of MyoD expression nor the downregulation of Myf-5 can be observed in randomly growing cells. As such, in actively replicating myoblasts, MyoD is high in M and G2 whereas Myf-5 drops to its minimal level during M phase.
Lindon et al. (1998) reported a specific phosphorylation and degradation of Myf-5 during mitosis in cells blocked by nocodazole treatment in pseudometaphase. This result led them to propose that cycling cells need to degrade Myf-5 during mitosis to enter into a new cell cycle. In agreement with these observations, we detected the lowest levels of Myf-5 protein in nocodazole blocked cells. Posttranslational modulation of Myf-5 may control the up regulation of Myf-5 protein we observed during G1/S transition when the level of Myf-5 mRNA appeared to remain constant. In summary, in growing cells, MyoD level drops before S-phase and Myf-5 at mitosis.
Differentiated, synchronized and growing cells give rise to the same result, MyoD and Myf-5 have distinct and opposite cell cycle–dependent regulation. Overexpression of either Myf-5 or MyoD in a fibroblast background was sufficient to induce muscle differentiation. Although Myf-5 overexpression may induce endogenous MyoD expression, this observation led to the notion that Myf-5 and MyoD performed overlapping and redundant functions in myogenesis (Weintraub, 1993). From the data we have presented here, this is clearly not the case since the proteins are not coexpressed during the early stages of cell cycle progression.
MyoD and Myf-5 Upstream Regulatory Pathways
It is likely that the induction of MyoD expression during G0/G1 progression that is seen for both protein and mRNA, is controlled by growth factor signaling cascades. Although some growth factors inhibit both the expression of MyoD and its activity, several specific growth factors such as insulin like growth factor, fibroblast growth factor 6, and transforming growth factor β are required for MyoD expression (Florini et al., 1991; Filvaroff et al., 1994; Montarras et al., 1996; Floss et al., 1997). In addition, we have recently shown that the GTPase RhoA, which is activated by serum and by several growth factors, is required for MyoD expression (Carnac et al., 1998).
While MyoD has been shown to inhibit Myf-5 (Rudnicki et al., 1992; Montarras et al., 1996), we report here that a similar downregulation of Myf-5 during early G1 also occurs in myoblasts devoid of MyoD. Therefore, the low levels of Myf-5 seen in G1 are not due to a suppressive effect of the concomitant upregulation of MyoD. It appears that forced expression of a high level of Myf-5 is incompatible with cell proliferation (Auradé et al., 1994; our unpublished results). Consistent with these observations G0 arrested myoblasts expressed high level of Myf-5 whereas reentry into proliferation was accompanied by a decrease in Myf-5 protein. Recently, Lindon et al. (1998) reported a similar low level of Myf-5 protein during G1 phase in a C2-derived cell line that does not express MyoD. However, the data reported by these authors on Myf-5 in G0 myoblasts is less clear, with apparently a low level in G0 whereas we found that Myf-5 expression is at its highest level in quiescent myoblast. Such discrepancy might be explained by the poor efficiency of “G0” synchronization achieved in the study by Lindon et al. (1998) as judged by the presence of a significant proportion of proliferating cells in the “G0” population (see FACS® analysis in Fig. 4). In myoblasts, quiescence is associated with exclusive Myf-5 expression raising the question of the role of Myf-5 in keeping muscle precursor cells in their determined state. Further investigations using synchronized cells may help to answer this question.
Role of MyoD and Myf-5 Cell Cycle–dependent Regulation during Muscle Regeneration
In vivo observations reveal that mature muscles possess a population of mononucleated myoblasts located on their surface. These satellite cells are normally quiescent in the adult and do not express differentiation markers (Smith et al., 1994; Yablonka-Reuveni and Rivera, 1994). They can reenter cell cycle in response to fiber damage, possibly in response to released mitogens (Schultz and Jaryszak, 1994; Smith et al., 1994; Floss et al., 1996) and proliferate before differentiating into new muscle cells. The release from G0 arrest using the method we developed for myoblasts synchronization appears to closely mimic the process of reinduction of satellite cell proliferation before regeneration. Single cell analysis by Cornelison and Wold (1997) concluded that a subset of freshly isolated satellite cells expressed either MyoD or Myf-5 and that 24 h after cell culture, satellite cells could coexpress MyoD and Myf-5. This observation is consistent with our results where satellite cells may be found principally at two points along the cell cycle. In G0 as cells express Myf-5 without MyoD and in mid G1 as cells express MyoD and withdraw from cell cycle into differentiation. When these satellite cells enter into proliferation, they will coexpress MyoD and Myf-5 as we observed during S and G2 in C2 myoblasts.
Clearly, our data imply that mechanisms leading to a specific activation or downregulation of MyoD and Myf-5 during muscle regeneration is tightly linked with cell cycle–dependent events. These events can now be further investigated in C2 cells knowing that this cell system reliably reflects the situation found in cultured primary myoblasts derived from satellite cells.
Acknowledgments
We wish to thank Dr. Margaret Buckingham (Institut Pasteur, Paris) for her interest in our work and support of M. Primig. We thank Peter Dias and Peter Houghton and Woody Wright for their generous gifts of MyoD and myogenin antibodies, respectively. We are grateful to Drs. Anne Bonnieu, Anne Debant, and Jacques Piette for many helpful discussions and critical reading of the manuscript. We are grateful to Dr. Francis Bacou for helpful in advice setting up primary myoblast culture.
This work was supported by grants from Association Française contre les Myopathies (A.F.M.), a fellowship from the Ministère de l'Education Nationale, de l'Enseignement Supérieur, de la Recherche et de l'Insertion professionnelle fellowship to M. Kitzmann and from A.F.M. to G. Carnac.
Abbreviations used in this paper
- BrdU
5-bromodeoxyuridine
- cdk
cyclin-dependent kinase
- CKI
cyclin-dependent kinase inhibitor
- HU
hydroxyurea
- pRb
retinoblastoma protein
Footnotes
The first two authors contributed equally to this work.
References
- Albagli-Curiel O, Carnac G, Vandromme M, Vincent S, Crepieux P, Bonnieu A. Serum-induced inhibition of myogenesis is differentially relieved by retinoic acid and triiodothyronine in C2 murine muscle cells. Differentiation. 1993;52:201–210. doi: 10.1111/j.1432-0436.1993.tb00632.x. [DOI] [PubMed] [Google Scholar]
- Alterio J, Courtois Y, Robelin J, Bechet D, Martelly I. Acidic and basic fibroblast growth factor mRNAs are expressed by skeletal muscle satellite cells. Biochem Biophys Res Commun. 1990;166:1205–1212. doi: 10.1016/0006-291x(90)90994-x. [DOI] [PubMed] [Google Scholar]
- Andrés V, Walsh K. Myogenin expression, cell cycle withdrawal, and phenotypic differentiation are temporally separable events that precede cell fusion upon myogenesis. J Cell Biol. 1996;132:657–666. doi: 10.1083/jcb.132.4.657. [DOI] [PMC free article] [PubMed] [Google Scholar]
- Auradé F, Pinset C, Chaffey P, Gros F, Montarras D. Myf-5, MyoD, Myogenin and MRF4myogenic derivatives of the embryonic mesenchymal cell line 10T1/2 exhibit the same adult phenotype. Differentiation. 1994;55:185–192. doi: 10.1046/j.1432-0436.1994.5530185.x. [DOI] [PubMed] [Google Scholar]
- Auradé F, Pfarr CM, Lindon C, Garcia A, Primig M, Montarras D, Pinset C. The glucocorticoid receptor and AP-1 are involved in a positive regulation of the muscle regulatory gene Myf-5 in cultured myoblasts. J Cell Sci. 1997;110:2771–2779. doi: 10.1242/jcs.110.22.2771. [DOI] [PubMed] [Google Scholar]
- Bartek J, Bartkova J, Lukas J. The retinoblastoma protein pathway and the restriction point. Curr Opin Cell Biol. 1996;8:805–814. doi: 10.1016/s0955-0674(96)80081-0. [DOI] [PubMed] [Google Scholar]
- Carnac G, Albagli-Curiel O, Vandromme M, Pinset C, Montarras D, Laudet V, Bonnieu A. 3,5,3′-Triiodothyronine positively regulates both MyoD1 gene transcription and terminal differentiation in C2 myoblasts. Mol Endocrinol. 1992;6:1185–1194. doi: 10.1210/mend.6.8.1406697. [DOI] [PubMed] [Google Scholar]
- Carnac G, Primig M, Kitzmann M, Chafey P, Tuil D, Lamb N, Fernandez A. RhoA GTPase and serum response factor control selectively the expression of MyoD without affecting Myf-5 in mouse myoblasts. Mol Biol Cell. 1998;9:1891–1902. doi: 10.1091/mbc.9.7.1891. [DOI] [PMC free article] [PubMed] [Google Scholar]
- Catala G, Savouret JF, Mendez B, West BL, Karin M, Martial JA, Baxter JD. A method for isolation of intact, translationally active ribonucleic acid. DNA. 1983;2:329–335. doi: 10.1089/dna.1983.2.329. [DOI] [PubMed] [Google Scholar]
- Chelappan SP, Hiebert S, Mudryj M, Horowitz JM, Nevins JR. The E2F transcription factor is a cellular target of the RB protein. Cell. 1991;65:1053–1061. doi: 10.1016/0092-8674(91)90557-f. [DOI] [PubMed] [Google Scholar]
- Chu C, Cogswell J, Kohtz DS. MyoD functions as a transcriptional repressor in proliferating myoblasts. J Biol Chem. 1997;272:3145–3148. doi: 10.1074/jbc.272.6.3145. [DOI] [PubMed] [Google Scholar]
- Clegg CH, Linkhart TA, Olwin BB. Growth factor control of skeletal muscle differentiation: commitment to terminal differentiation occurs in G1 phase and is repressed by fibroblast growth factor. J Cell Biol. 1987;105:949–956. doi: 10.1083/jcb.105.2.949. [DOI] [PMC free article] [PubMed] [Google Scholar]
- Coats S, Flanagan WM, Nourse J, Roberts JM. Requirement of p27kip1 for restriction point control of the fibroblast cell cycle. Science. 1996;272:877–880. doi: 10.1126/science.272.5263.877. [DOI] [PubMed] [Google Scholar]
- Crescenzi M, Fleming TP, Lassar AB, Weintraub H, Aaronson SA. MyoD induces growth arrest independent of differentiation in normal and transformed cells. Proc Natl Acad Sci USA. 1990;87:8442–8446. doi: 10.1073/pnas.87.21.8442. [DOI] [PMC free article] [PubMed] [Google Scholar]
- Cornelison DDW, Wold B. Single-cell analysis of regulatory gene expression in quiescent and activated mouse skeletal muscle satellite cells. Dev Biol. 1997;191:270–284. doi: 10.1006/dbio.1997.8721. [DOI] [PubMed] [Google Scholar]
- Davis RL, Weintraub H, Lassar AB. Expression of a single transfected cDNA converts fibroblasts to myoblasts. Cell. 1987;51:987–1000. doi: 10.1016/0092-8674(87)90585-x. [DOI] [PubMed] [Google Scholar]
- Dias P, Parham DM, Shapiro DN, Tapscott SJ, Houghton PJ. Monoclonal antibodies to the myogenic regulatory protein MyoD1: epitope mapping and diagnostic utility. Cancer Res. 1992;52:6431–6439. [PubMed] [Google Scholar]
- Filvaroff EH, Ebner R, Derynck R. Inhibition of myogenic differentiation in myoblast expressing a truncated type II TGF-β receptor. Development (Camb) 1994;120:1085–1095. doi: 10.1242/dev.120.5.1085. [DOI] [PubMed] [Google Scholar]
- Florini JR, Magri KA, Ewton DZ, James PL, Grindstaff K, Rotwein PS. “Spontaneous” differentiation of skeletal myoblasts is dependent upon autocrine secretion of insulin-like growth factor-II. J Biol Chem. 1991;24:15917–15923. [PubMed] [Google Scholar]
- Floss T, Arnold HH, Braun T. A role for FGF-6 in skeletal muscle regeneration. Genes Dev. 1997;11:2040–2051. doi: 10.1101/gad.11.16.2040. [DOI] [PMC free article] [PubMed] [Google Scholar]
- Girard F, Strausfeld U, Fernandez A, Lamb NJC. CyclinA is required for the onset of DNA replication in mammalian fibroblasts. Cell. 1991;67:1169–1179. doi: 10.1016/0092-8674(91)90293-8. [DOI] [PubMed] [Google Scholar]
- Gu W, Schneider JW, Condorelly G. Interaction of myogenic factors and the retinoblastoma protein mediates muscle cell commitment and differentiation. Cell. 1993;72:309–324. doi: 10.1016/0092-8674(93)90110-c. [DOI] [PubMed] [Google Scholar]
- Guo K, Wang J, Andres V, Smith R, Walsh K. MyoD-induced expression of p21 inhibits cyclin-dependent kinase activity upon myocyte terminal differentiation. Mol Cell Biol. 1995;15:3823–3829. doi: 10.1128/mcb.15.7.3823. [DOI] [PMC free article] [PubMed] [Google Scholar]
- Halevy, O., B.G. Novitch, D.B. Spicer, S.X. Skapek, J. Rhee, G.J. Hannon, D. Beach, and A.B. Lassar. 1995. Correlation of terminal cell cycle arrest of skeletal muscle with induction of p21 by MyoD. Science. 1018–1021. [DOI] [PubMed]
- Hunter T, Pines J. Cyclins and cancer II: cyclin D and CDK inhibitors come of age. Cell. 1994;79:573–582. doi: 10.1016/0092-8674(94)90543-6. [DOI] [PubMed] [Google Scholar]
- Krek W, DeCaprio JA. Cell synchronization. Methods Enzymol. 1995;254:114–125. doi: 10.1016/0076-6879(95)54009-1. [DOI] [PubMed] [Google Scholar]
- Lamb JC, Fernandez A, Watrin A, Labée JC, Cavadore JC. Microinjection of p34cdc2 kinase induces marked changes in cell shape, cytoskeletal organisation, and chromatin structure in mammalian fibroblasts. Cell. 1992;60:151–165. doi: 10.1016/0092-8674(90)90725-t. [DOI] [PubMed] [Google Scholar]
- Lindon C, Montarras D, Pinset C. Cell cycle-regulated expression of the muscle determination factor Myf-5 in proliferating myoblasts. J Cell Biol. 1998;140:111–118. doi: 10.1083/jcb.140.1.111. [DOI] [PMC free article] [PubMed] [Google Scholar]
- Montarras D, Aurade F, Johnson T, Ilan J, Gros F, Pinset C. Autonomous differentiation in the mouse myogenic cell line, C2, involves a mutual positive control between insulin like growth factor II and MyoD, operating as early as the myoblast stage. J Cell Sci. 1996;109:551–560. doi: 10.1242/jcs.109.3.551. [DOI] [PubMed] [Google Scholar]
- Nadal-Ginard B. Commitment, fusion and biochemical differentiation of a myogenic cell line in the absence of DNA synthesis. Cell. 1978;15:855–864. doi: 10.1016/0092-8674(78)90270-2. [DOI] [PubMed] [Google Scholar]
- Novitch BG, Mulligan GJ, Jacks T, Lassar AB. Skeletal muscle cells lacking the retinoblastoma protein display defects in muscle gene expression and accumulate in S and G2 phases of the cell cycle. J Cell Biol. 1996;135:441–456. doi: 10.1083/jcb.135.2.441. [DOI] [PMC free article] [PubMed] [Google Scholar]
- Nurse P. Ordering S phase and M phase in the cell cycle. Cell. 1994;79:547–555. doi: 10.1016/0092-8674(94)90539-8. [DOI] [PubMed] [Google Scholar]
- Pagano M, Pepperkok R, Lukas J, Baldin V, Ansorge W, Bartek J, Draetta G. Regulation of the cell cycle by the cdk2 protein kinase in cultured human fibroblasts. J Cell Biol. 1993;121:101–111. doi: 10.1083/jcb.121.1.101. [DOI] [PMC free article] [PubMed] [Google Scholar]
- Pinset, C., and D. Montarras. 1994. A system for ex vivo studies of myogenesis: a protocol for the isolation of stable muscle cell populations from newborn adult mice. In Cell Biology: A Laboratory Handbook. J. Celis, editor. Academic Press, Inc., San Diego, CA. 199–206.
- Pinset C, Whalen RG. Manipulation of medium conditions and differentiation in the rat myogenic cell line L6. Dev Biol. 1984;102:269–277. doi: 10.1016/0012-1606(84)90192-1. [DOI] [PubMed] [Google Scholar]
- Pinset C, Montarras D, Chenevert J, Minty A, Barton P, Laurent C, Gros F. Control of myogenesis in the mouse myogenic C2 cell line by medium composition and by insulin: characterisation of permissive and inductible C2 myoblasts. Differentiation. 1988;38:28–34. doi: 10.1111/j.1432-0436.1988.tb00588.x. [DOI] [PubMed] [Google Scholar]
- Polyak K, Lee MH, Erdjument-Bromage H, Koff A, Roberts JM, Tempst P, Massague J. Cloning of P27Kip1, a cyclin dependent kinase inhibitor and a potential mediator of extracellular antimitogenic signals. Cell. 1994;78:59–66. doi: 10.1016/0092-8674(94)90572-x. [DOI] [PubMed] [Google Scholar]
- Rao S, Kohtz DS. Positive and negative regulation of D-type cyclin expression in skeletal myoblasts by basic fibroblast growth factor and transforming growth factor β. J Biol Chem. 1994;270:4093–4100. doi: 10.1074/jbc.270.8.4093. [DOI] [PubMed] [Google Scholar]
- Rudnicki MA, Braun T, Hinuma S, Jaenisch R. Inactivation of MyoD in mice leads to up-regulation of the myogenic HLH gene Myf-5 and results in apparently normal muscle development. Cell. 1992;71:383–390. doi: 10.1016/0092-8674(92)90508-a. [DOI] [PubMed] [Google Scholar]
- Schneider JW, Gu W, Zhu L, Mahdavi V, Nadal-Ginard B. Reversal of terminal differentiation mediated by p107 in Rb−/−muscle cells. Science. 1994;264:1467–1471. doi: 10.1126/science.8197461. [DOI] [PubMed] [Google Scholar]
- Schultz E, McCormick KM. Skeletal muscle satellite cells. Rev Physiol Biochem Pharmacol. 1994;123:213–257. doi: 10.1007/BFb0030904. [DOI] [PubMed] [Google Scholar]
- Skapek SX, Rhee J, Spicer DB, Lassar AB. Inhibition of myogenic differentiation in proliferating myoblasts by cyclin D1-dependent kinase. Science. 1995;267:1022–1024. doi: 10.1126/science.7863328. [DOI] [PubMed] [Google Scholar]
- Smith CK, Janney MJ, Allen RE. Temporal expression of myogenic regulatory genes during activation, proliferation, and differentiation of rat skeletal muscle satellite cells. J Cell Physiol. 1994;159:379–385. doi: 10.1002/jcp.1041590222. [DOI] [PubMed] [Google Scholar]
- Sorrentino V, Pepperkok R, Davis RL, Ansorge W, Pilipson L. Cell proliferation inhibited by myoD1 independently of myogenic differentiation. Nature. 1990;345:813–815. doi: 10.1038/345813a0. [DOI] [PubMed] [Google Scholar]
- Tapscott SJ, Davis RJ, Thayr MJ, Cheng P, Weintraub H, Lassar AB. MyoD1: a nuclear phosphoprotein requiring a myc homology region to convert fibroblasts to myoblasts. Science. 1988;242:405–411. doi: 10.1126/science.3175662. [DOI] [PubMed] [Google Scholar]
- Thorburn AM, Walton PA, Feramisco JR. MyoD induced cell cycle arrest is associated with increased nuclear affinity of the Rb protein. Mol Biol Cell. 1993;4:705–713. doi: 10.1091/mbc.4.7.705. [DOI] [PMC free article] [PubMed] [Google Scholar]
- Walsh K, Perlman H. Cell cycle exit upon myogenic differentiation. Curr Opin Gen Dev. 1997;7:597–602. doi: 10.1016/s0959-437x(97)80005-6. [DOI] [PubMed] [Google Scholar]
- Weintraub H, Dwarki VJ, Verma I, Davis R, Hollemberg S, Snider L, Lassar AB, Tapscott SJ. Muscle-specific transcriptional activation by MyoD. Genes Dev. 1991;5:1377–1386. doi: 10.1101/gad.5.8.1377. [DOI] [PubMed] [Google Scholar]
- Weintraub H. The MyoD family and myogenesis: redundancy, networks, and thresholds. Cell. 1993;75:1241–1244. doi: 10.1016/0092-8674(93)90610-3. [DOI] [PubMed] [Google Scholar]
- Wright WE, Sassoon DA, Lin VK. Myogenin, a factor regulating myogenesis, has a domain homologous to MyoD. Cell. 1989;56:607–617. doi: 10.1016/0092-8674(89)90583-7. [DOI] [PubMed] [Google Scholar]
- Yablonka-Reuveni Z, Rivera AJ. Temporal expression of regulatory and structural muscle proteins during myogenesis of satellite cells on isolated adult rat fibers. Dev Biol. 1994;164:588–603. doi: 10.1006/dbio.1994.1226. [DOI] [PMC free article] [PubMed] [Google Scholar]
- Yaffe D, Saxel O. Serial passaging and differentiation of myogenic cells isolated from dystrophic mouse muscle. Nature. 1977;270:725–727. doi: 10.1038/270725a0. [DOI] [PubMed] [Google Scholar]
- Zetterberg A, Larsson O, Wiman KG. What is the restriction point? . Curr Opin Cell Biol. 1995;7:835–842. doi: 10.1016/0955-0674(95)80067-0. [DOI] [PubMed] [Google Scholar]


