Abstract
Aims
To evaluate the relationship between tacrolimus whole blood concentrations and side-effects and rejections in 14 renal transplant recipients.
Methods
Tacrolimus was measured by MEIA in whole blood in samples collected repeatedly during the first year after transplantation. Retrospectively, tacrolimus trough concentrations on the days with adverse events (n = 172) or rejection (n = 28) were related to the total distribution of the concentration values (n = 656).
Results
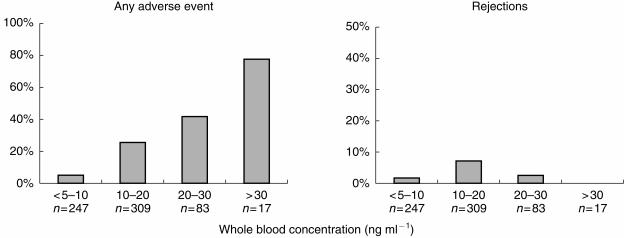
Side-effects (one or more) were noted in connection with 76% of tacrolimus concentrations above 30 ng ml−1, with 41% of concentrations within the interval of 20–30 ng ml−1, with 26% of the concentrations within the interval of 10–20 ng ml−1 and with only 5.3% on the concentrations lower than 10 ng ml−1. No relation to the tacrolimus concentration was seen for rejection episodes.
Conclusions
We conclude that therapeutic drug monitoring may be helpful in the management of tacrolimus therapy and that tacrolimus whole blood trough concentrations (MEIA) should preferably be kept below 20 ng ml−1 to avoid side-effects, such as nephro-and neurotoxicity and infections. The lower limit of the therapeutic range has yet to be defined.
Keywords: adverse events, renal transplantation, tacrolimus, whole blood concentration
Introduction
Tacrolimus is a macrolide immunosuppressant, approved for the prophylaxis of organ rejection in renal and liver transplantation. Despite structural differences between cyclosporin and tacrolimus it is currently believed that the drugs suppress the immune response by similar mechanisms [1]. In clinical trials tacrolimus proved to be at least comparable with cyclosporin in preventing acute and chronic rejection in liver and kidney transplant recipients [2, 3]. Its clinical use is associated with the risk of (reversible) nephrotoxicity, neurotoxicity, hypertension and diabetogenic effects [3]. Guidelines for therapeutic drug monitoring based on the use of immunoassays with antibodies that cross-react with metabolites have been published [2–6]. However, few reports have focused on the concentration-effect relationship and the current knowledge concerning the role of tacrolimus whole blood measurements in optimizing therapy is still limited. We report the relation between observed adverse events and rejections and individual whole blood trough concentrations of tacrolimus in renal transplant recipients.
Methods
The study included 14 patients; 10 men (mean weight 77 kg) and 4 women (mean weight 54 kg), age 27–73 years (mean 50 years.). The reason for transplantation was glomerulonephritis (8 patients), cystic kidney disease (2 patients), unspecified renal insufficiency (2 patients), malignant hypertension (1 patient) and tubular sclerosis (1 patient). All patients were taking part in a European multicentre study, comparing the effect of tacrolimus vs cyclosporin on the frequency of rejection after cadaveric renal transplantation [3]. The study was approved by the Ethics Committee at the Karolinska Institute in Stockholm.
The patients were followed for between 1 to 12 months after transplantation, with a mean follow-up time of 204 days and a mean of 47 samples collected from each patient.
The starting dose of tacrolimus was 0.3 mg kg−1, divided on two daily doses. Doses were subsequently adjusted according to the clinical condition of the patient and to target concentration intervals, defined in the study protocol as 10–20 ng ml−1 during the first 3 months after transplantation and 5–15 ng ml−1 after the third month and onwards. Concomitant immunosuppressive treatment was with prednisolone and azathioprin. Other concomitant drugs were sulphamethoxazole-trimethoprim and frusemide (in all patients) and nifedipine, omeprazole, acyclovir and/or different β- adrenoceptor blocking agents and antibiotics as needed. All blood samples were collected before the morning dose in EDTA tubes to give trough concentration values. The tacrolimus concentrations in whole blood were measured by microparticle enzyme immunoassay (Abbott, Abbott Park). The limit of detection was 5 ng ml−1 and the CV at 15 ng ml−1 was 11%.
Adverse events were evaluated by the investigator and registered continuously according to the protocol of the multicentre study [3]. For the purpose of this analysis, adverse events that were judged to be possibly related to the tacrolimus treatment were divided into four groups; nephrotoxicity (seen in 9 patients), neurotoxicity (in 3 patients), infections (in 8 patients) and miscellaneous adverse events (in 8 patients). Hyperglycaemia was considered separately.
Blood samples that would most probably correspond to the occurrence of the clinical events were chosen according to the following, predetermined criteria: for nephrotoxicity—one sample within four days before and all samples during the period of toxicity, for infections (urinary tract infections, wound infections, sepsis, intestinal infections and oral candidiasis)—samples taken during the first week and two samples from the week prior to the infection, for neurological events (headache, tremor and cramps) and miscellaneous adverse events (increased liver enzyme values, gastritis, leucopenia or diarrhoea)—samples of the same day as the symptom.
For rejection episodes, the concentration value of the day of a positive biopsy and one sample within 4 days before were included in the analysis.
Retrospectively, tacrolimus trough concentrations of the days with adverse events (n = 172) or rejection (n = 28) were related to the total distribution of the concentration values (n = 656).
Results
Mean tacrolimus daily doses at 1, 3, 6 and 12 months after transplantation were 0.25, 0.13, 0.10 and 0.11 mg kg−1, respectively. Corresponding steady-state mean concentrations were 15, 11, 8.6 and 7.5 ng ml−1.
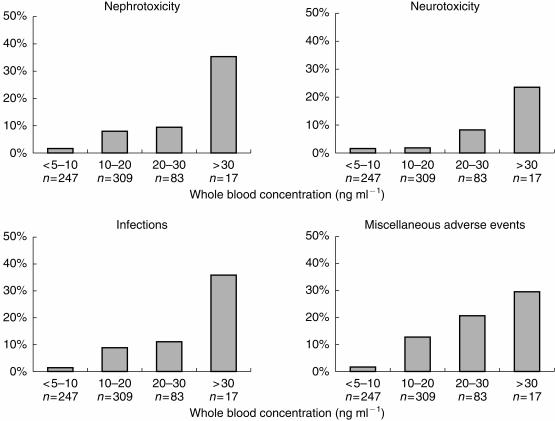
With tacrolimus whole blood concentrations above 30 ng ml−1, the incidence of adverse events was 76%, while with concentrations lower than 10 ng ml−1 the incidence was only 5.3% (Figure 1). A concentration-effect relationship was also evident for the separate groups of adverse events: nephrotoxicity, neurotoxicity, infections and miscellaneous adverse events (Figure 2).
Figure 1.
Incidence of adverse events (days with one or more adverse events, n = 139) and days with rejection (n = 28) at different tacrolimus whole blood concentration levels (total number of samples, n = 656).
Figure 2.
Incidence of nephrotoxicity (n = 44), neurotoxicity (n = 21), infections (n = 44) or miscellanous adverse events (n = 63) at different tacrolimus whole blood concentration levels (total number of samples, n = 656).
Eight of 14 patients developed hyperglycaemia, four of whom required insulin treatment, within 1 to 5 weeks after transplantation and remained hyperglycaemic for several months or throughout the study period. Due to the long duration of this symptom, it was not included in the present analysis.
No relation to the tacrolimus concentration was seen for a total of 14 rejection episodes, which occurred in six patients. However, in no case was the concentration value at onset above 18 ng ml−1. In the 10 episodes of rejection that occurred during the first 3 months, the mean concentration on the day of biopsy was 17 ng ml−1 (range 11.3–21.6 ng ml−1) and in four rejection episodes, occurring later than 3 months after transplantation, the corresponding mean concentration was 9.6 ng ml−1 (range <5–15.0 ng ml−1).
Discussion
Evidence that a correlation exists between high concentrations of tacrolimus and toxicity are in agreement with previous reports [5–8]. We were surprised to find such a seemingly clear relation between tacrolimus whole blood concentrations and the different adverse events in this study, as the method we have used must be considered to be rather crude. For example blood sampling was not performed on a daily basis and the time of sampling may not correspond exactly to the occurrence of an adverse event. Also, the MEIA method for analysing tacrolimus is not specific. On the other hand, the strength of this method of studying drug-induced adverse events is that it includes all available data on individual patients, and does not rely on mean values for groups of patients or time periods and can be performed in a clinical setting, using routine therapeutic drug monitoring data.
It can be argued that most side-effects can be expected to occur early in the postoperative phase, when the tacrolimus dose and also the concentrations are the highest. In this study, 49% of the adverse events were reported after the first month after transplantation.
The experience so far indicates that tacrolimus concentrations above 20 ng ml−1 are frequently associated with toxicity. A lower limit of the therapeutic interval has not yet been defined. Until recently, reliable assays of concentrations below 5 ng ml−1 have not been available. In addition, clinical experience is based on results from studies with higher doses of tacrolimus.
No relation to the tacrolimus concentration was seen for the rejection episodes in this study, which in part may be explained by the limited number of subjects. Also, the relation between immunosuppression and rejection is most probably both concentration and time dependent. A study within a defined time period after transplantation and with a high variety of concentrations amongst the patients is more likely to reveal a possible correlation between tacrolimus concentrations and graft rejections, as in the study by Kershner & Fitzsimmons [8].
We conclude, on the basis of this study, that therapeutic drug monitoring may be helpful in the management of tacrolimus therapy and that tacrolimus whole blood trough concentrations should preferably be kept below 20 ng ml−1 to avoid side-effects, such as infections and nephro-and neurotoxicity, and that concentrations below 10 ng ml−1 seems to be even more beneficial with respect to side-effects.
References
- 1.Shreiber S, Crabtree G. The mechanism of action of cyclosporine A and FK506. Immunol Today. 1992;13:136–142. doi: 10.1016/0167-5699(92)90111-J. [DOI] [PubMed] [Google Scholar]
- 2.European FK, 506 Multicentre Liver Study Group. Randomised trial comparing tacrolimus (FK506) and cyclosporin in prevention of liver allograft rejection. Lancet. 1994;344:423–428. [PubMed] [Google Scholar]
- 3.Mayer AD, Dmitrewski J, Squifflet JP, et al. Multicenter randomized trial comparing tacrolimus (FK506) and cyclosporine in the prevention of renal allograft rejection: a report of the European Tacrolimus Multicenter Renal Study Group. Transplantation. 1997;64:436–443. doi: 10.1097/00007890-199708150-00012. [DOI] [PubMed] [Google Scholar]
- 4.Alessiani M, Cillo U, Fung JJ, et al. Adverse effects of FK 506 overdosage after liver transplantation. Transplant Proc. 1993;25:628–634. [PMC free article] [PubMed] [Google Scholar]
- 5.Winkler M, Jost U, Ringe B, Gubernatis G, Wonigeit K, Pichlmayr R. Association of elevated FK 506 plasma levels with nephrotoxicity in liver-grafted patients. Transplant Proc. 1991;23:3153–3155. UI 92087191. [PubMed] [Google Scholar]
- 6.Bäckman L, Nicar M, Levy M, et al. FK506 trough levels in whole blood and plasma in liver transplant recipients. Correlation with clinical events and side effects. Transplantation. 1994;57:519–525. [PubMed] [Google Scholar]
- 7.Jusko WJ, Thomson AW, Fung J, et al. Consensus document: Therapeutic monitoring of tacrolimus (FK506) Ther Drug Monit. 1995;17:606. doi: 10.1097/00007691-199512000-00011. [DOI] [PubMed] [Google Scholar]
- 8.Kershner R, Fitzsimmons W. Relationship of FK506 whole blood concentrations and efficacy and toxicity after liver and kidney transplantation. Transplantation. 1996;62:920–926. doi: 10.1097/00007890-199610150-00009. [DOI] [PubMed] [Google Scholar]


