

Abstract
The protein CA forms the mature capsid of human immunodeficiency virus. Hexamerization of the N-terminal domain and dimerization of the C-terminal domain, CAC, occur during capsid assembly, and both domains constitute potential targets for anti-HIV inhibitors. CAC homodimerization occurs mainly through its second helix, and is abolished when its sole tryptophan is mutated to alanine. Previous thermodynamic data obtained with the dimeric and monomeric forms of CAC indicate that the structure of the mutant resembles that of a monomeric intermediate found in the folding and association reactions of CAC. We have solved the three-dimensional structure in aqueous solution of the monomeric mutant. The structure is similar to that of the subunits in the dimeric, nonmutated CAC, except the segment corresponding to the second helix, which is highly dynamic. At the end of this region, the polypeptide chain is bent to bury several hydrophobic residues and, as a consequence, the last two helices are rotated 90° when compared to their position in dimeric CAC. The previously obtained thermodynamic data are consistent with the determined structure of the monomeric mutant. This extraordinary ability of CAC to change its structure may contribute to the different modes of association of CA during HIV assembly, and should be taken into account in the design of new drugs against this virus.
INTRODUCTION
During the last stages of infection by HIV-1, several thousand copies of the Gag polyprotein self-associate on the membrane of the infected cell and bud to form an immature capsid. Subsequent to budding, Gag is proteolytically cleaved by the viral protease into the mature proteins: the matrix, capsid (CA), nucleocapsid, and p6, as well as the spacer peptides p2 and p1 (1–3). After the proteolytic cleavage, CA reassembles to form the mature capsid (4). In vitro, CA spontaneously assembles into cylindrical structures and cones resembling the viral capsid (5–10). Several studies have shown that capsid assembly is critical for viral infectivity (11–13). Thus, inhibition of CA assembly by some mutations has a lethal effect, and the alteration of capsid stability reduces virus replication (11). Further, there is a wide body of evidence suggesting that dimerization through its carboxy terminal domain is a driving force in virus assembly (8,9,14,15).
CA of HIV-1 is formed by two independently folded domains separated by a flexible linker (16–19). The N-terminal domain (residues 1–145 of the intact protein) is composed of five coiled-coil α-helices, with two additional short α-helices after an extended proline-rich loop (16–18). The C-terminal domain (residues 146–231), CAC, is a dimer both in solution and in the crystal form (19,20). Each CAC monomer is composed of a short 310-helix followed by an extended strand and four α-helices: α-helix 1 (residues 160–172), α-helix 2 (residues 178–191), α-helix 3 (residues 195–202), and α-helix 4 (residues 209–214), that are connected by short loops or turnlike structures. The dimerization interface is largely formed by the mutual docking of α-helix 2 from each monomer, being the side chains of each tryptophan (Trp184) deeply buried in the dimer interface (19,20). The two other aromatic residues in each monomer, Tyr164 and Tyr169, are within the hydrophobic core of each monomer, well away from the dimer interface. We have previously described the folding and association reactions of CAC, which involve a monomeric intermediate that rearranges and dimerizes to yield the native dimer (21). The structure of this monomeric intermediate, as shown by CD and fluorescence, is nativelike with a solvent-exposed tryptophan (21). This monomeric intermediate has been observed in the thermal unfolding of the dimeric species by FTIR and NMR spectroscopies (22). We have determined by thermodynamic analysis, using alanine mutants, the energetic contribution of each side chain at the dimerization interface to the folding and association of CAC (23). These studies have shown that the side chain of Trp184 (21,23) and those of Ile150, Leu151, Arg154, Leu172, Glu175, Val181, Met185, and Leu189 are key for CAC dimerization (23). Moreover, the Trp184Ala mutant remains essentially monomeric at protein concentrations of hundreds of micromolar (23). The spectroscopic results, as well as the quantitative agreement of the thermodynamic parameters (free energies and m-values) of the folding of the nonmutated CAC and of the monomeric CAC mutant Trp184Ala (23), indicate that the structure of the latter may resemble that of the monomeric intermediate detected during the folding and association of nonmutated, dimeric CAC. To provide further insights into the association of CA from HIV, we have solved the three-dimensional structure of CAC mutant Trp184Ala in solution by NMR. In this work, for the sake of clarity, the mutant will be referred to as CACW40A to denote the position of the mutation in the C-terminal domain; also, we will be numbering the amino acids of CACW40A from its first residue, i.e., the added N-terminal methionine is Met1, and the second residue is Ser2 (which corresponds to Ser146 in the numbering of the intact CA). The results revealed that, in CACW40A, only three of the four native α-helices of CAC are stably formed. The second helix seems to be involved in a conformational exchange equilibrium. The third and fourth α-helices (second and third helices in CACW40A) are rotated 90° with respect to its orientation in the nonmutated protein. The extraordinary ability of the CAC monomer to change its structure may contribute to the different modes of association of CA during HIV assembly.
MATERIALS AND METHODS
Materials
Deuterium oxide was obtained from Apollo Scientific (Stockport, UK), and the sodium trimethylsilyl [2,2,3,3-2H4] propionate, TSP, was from Sigma (St. Louis, MO). Dialysis tubing with a molecular weight cutoff of 3500 Da was from Spectrapor (Spectrum Laboratories, Ibaraki, Japan). Standard suppliers were used for all other chemicals. Water was deionized and purified on a Millipore system (Millipore, Billerica, MA).
Protein expression and purification
The unlabeled mutant CACW40A protein was expressed in Escherichia coli BL21(DE3) in Luria Broth and purified as described in the literature (21–23), with the following modifications: 1), after ammonium sulfate precipitation, the protein was redissolved in 50 mM acetate buffer, pH 5.2; 2), the same buffer containing NaCl was used to elute the protein from the SP- and Heparin-Sepharose columns; and 3), before the size-exclusion chromatographic step, the protein was dialyzed against 25 mM phosphate buffer, pH 7.3, and the solution supplemented with NaCl up to a final concentration of 150 mM. Protein stocks were run in SDS-PAGE gels and found to be >97% pure. The 15N-labeled sample was obtained by using Bioexpress medium (Cambridge Isotope Laboratories, Andover, MA). The labeled protein was purified with the same protocol. Protein concentration was calculated from the absorbance measured at 280 nm, by using the extinction coefficients of amino acids (24). Samples were concentrated at the final NMR concentration by using Centriprep Amicon devices (Millipore), with a molecular weight cutoff of 3500 Da.
Fourier transform infrared spectroscopy (FTIR)
Samples of nonmutated CAC and mutant CACW40A in phosphate buffer 10 mM, pH 6.8, were concentrated with Vivaspin devices (Vivascience, Hannover, Germany), with a molecular weight cutoff of 5000 Da, to a final protein concentration of 160 μM. Volumes of 100 μl of this stock sample were dried in a Speed Vac concentrator (Savant, Farmingdale, NY), resuspended in D2O and incubated at room temperature for 90 min to maximize the H-D exchange of the protein. Finally, the samples were dried again, dissolved in 20 μl of D2O, and placed amid a pair of CaF2 windows separated by a 50-μm thick spacer in a Harrick (Ossining, NY) demountable cell. Spectra were acquired at 298 K on a model No. FTIR-66S instrument (Bruker Optik, Ettlingen, Germany) equipped with a deuterated triglycine sulfate detector and fitted with a water bath (Thermo Haake, Paramus, NJ). The cell container was continuously filled with dry air. Usually, 500 scans per sample were taken, averaged, apodized with a Happ-Genzel function, and Fourier-transformed to give a final resolution of 2 cm−1. The contributions of the buffer spectra were subtracted, and the resulting spectra were used for analysis, as described (25). The error in the estimation of the percentage of secondary structure depends mainly on the removal of spectral noise, and based on several model proteins, this error was estimated to be 2% (25). To be conservative, we have considered that in our band decomposition the estimated error was 4%.
Protein secondary structure components were quantified from curve-fitting analysis by band decomposition of the original amide I′ band after spectrum smoothing. Spectrum smoothing was carried out by applying the maximum entropy method, assuming that noise and band shape follow a normal distribution. The minimum bandwidth was set to 12 cm−1. The resulting spectra had a signal/noise ratio >4500:1. Derivation of IR spectra was performed using a power of 3, breakpoint of 0.3, and Fourier self-deconvolution was performed using a Lorentzian bandwidth of 18 cm−1 and a resolution enhancement factor (the so-called factor k) of 2.0. To quantify the secondary structure, the number and position of the absorbance band components were taken from the deconvoluted spectra; the bandwidth was estimated from the derived spectra; and the absorbance height from the original spectra. The iterative curve-fitting process was performed under Spectra-Calc (Galactic Industries, Salem, NH). The number, position, and band shape were kept fixed during the first 200 iterations. The fittings were further refined by allowing the band positions to vary for 50 additional iterations. The agreement between experimental and theoretical spectra was assessed from the χ2 values (within the range 1 × 10⁻⁵ to 4.5 × 10⁻⁵). The area of the fitted absorbance band components was used to calculate the percentage of secondary structure.
NMR samples
All NMR experiments were acquired on a model DRX-500 spectrometer (Bruker) equipped with a triple resonance probe and z-pulse field gradients. Homonuclear 1D- and 2D-NMR experiments were performed with ∼1 mM samples in 0.5 ml at 293, 298, and 303 K, pH 7 (uncorrected for deuterium isotope effects) in either H2O/D2O (90%/10%, v/v) or D2O. Heteronuclear two- and three-dimensional spectra were acquired at 293 K. Centriprep Amicon devices (Millipore) were used to exchange the sample in 100% D2O, during 4 h at 278 K. TSP was used as the internal chemical shift reference in the homonuclear experiments.15N chemical shifts were referenced following the method of Wishart (26).
Translational diffusion measurements (DOSY experiments)
Translational self-diffusion measurements were performed with the pulsed-gradient spin-echo NMR method (27,28). The following relationship exists between the translational self-diffusion coefficient, D, and the NMR parameters,
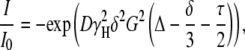 |
(1) |
where I is the measured peak intensity of a particular (or a group of) resonance(s); I0 is the maximum peak intensity of the same resonance(s) at the smaller gradient strength; D is the translational self-diffusion constant (in cm2 s−1); δ is the duration (in seconds) of the gradient; G is the strength of the gradient (in T cm−1); Δ is the time (in seconds) between the gradients; and τ is the recovery delay between the bipolar gradients (100 μs). Data are usually represented as the −ln(I/I0) vs. G2, and the slope of the line is 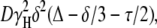 from where D can be easily obtained.
The Stokes-Einstein equation relates D with the R, the hydrodynamic radius of the sphere, and the viscosity of the solvent, η, according to
 |
(2) |
where T is the temperature (in K) and k the Boltzmann constant.
The viscosity of a solution is very weakly influenced by the macromolecule component at the concentrations used in the NMR studies, and therefore, the viscosity of the solution is that of the solvent. Solvent viscosity is temperature-dependent, according to Lapham et al. (29): 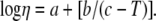 The terms a, b, and c are given for a particular D2O:H2O ratio. In our conditions, a 100% D2O solution, the values are a = −4.2911, b = −164.97, and c = 174.24. This yields a value of η = 1.253 kg/(cm s) at 293 K, used in our calculations.
The gradient strength was calibrated by using the diffusion rate for the residual proton water line in a sample containing 100% D2O in a 5-mm tube, and backcalculating G. Experiments were acquired with a postgradient eddy-current relaxation delay of 5 ms. Each experiment was averaged over 128 scans and the number of points was 16 K. The strength of the gradient was varied from 2% of the total power of the gradient coil to 95%, with a sine function shape. The largest protein concentration used was 1 mM, and the other used concentrations were dilutions of that protein stock. The duration of the gradient was varied between 2.2 and 3 ms, and the time between both gradients was between 100 and 150 ms. The most upfield-shifted methyl groups were used to measure the changes in intensity.
1D-, 2D-, and 3D-NMR spectroscopy
All spectra were acquired in the phase-sensitive mode. Frequency discrimination in the indirect dimensions was achieved by using either the time-proportional phase incrementation technique, TPPI (30), or States-TPPI (31).
One-dimensional spectra were acquired with 16 K data points, averaged over 512 scans with 6000 Hz of spectral width (12 ppm). 1H homonuclear TOCSY (32), using the MLEV-17 sequence, with mixing times of 45, 60, and 80 ms (33), and NOESY (34) spectra with 80, 150, and 200 ms mixing times were recorded by standard methods with water suppression achieved by WATERGATE (35). Usually, the size of the acquisition data matrix was 2048 × 512 points in t2 and t1, respectively, with 64 scans (TOCSY) or 128 scans (NOESY) per increment in the t2 dimension. The spectral width was 6000 Hz in both dimensions. Before Fourier transformation, the two-dimensional data matrix was multiplied by a phase-shifted sine bell or square sine bell function in both dimensions. The corresponding shift was optimized in every experiment. Base-line correction and zero-filling were applied in both dimensions. All spectra were processed and analyzed by using XWINNMR (Bruker AXS, Karlsruhe, Germany) working on a PC computer.
Heteronuclear experiments included 15N-HSQC (36), three-dimensional 15N- TOCSY-HSQC (37), three-dimensional 15N-NOESY-HSQC (37), and HNHA (38). Spectral widths were 6000 Hz for 1H and 1000 Hz for 15N. Mixing times for the NOESY experiments were 150 and 200 ms, and 45, 60, and 80 ms for the TOCSY experiments. In the three-dimensional experiments, 2 K data points were acquired in the t3 dimension (1H), and 64 and 512 scans were acquired in the t2 and t1 dimensions, respectively. In the 2D-HSQC experiments, 4 K data points were obtained in the 1H dimension and 128 scans were acquired in the 15N axis.
Geometrical restraints
1H NMR resonances were assigned by using standard sequential assignment procedures (39). Spin systems were identified by analysis of the two- and three-dimensional TOCSY experiments. The use of the three temperatures and the two- and three-dimensional experiments allowed us to resolve most of the ambiguities that arose from chemical shift degeneracies. All spectra were analyzed by using the Sparky software (40).
The signals from the 2D-NOESY experiment recorded at 150 ms were used as input for the structure calculation. After integration, the peak volumes and chemical shifts list were output to a CYANA-compatible format (41). The automatic calibration method implemented in CYANA, CALIBA (42), was run to transform the peak volumes into distances. Default weighting factors were attributed to the different restraint categories for different types of atoms. The upper limits obtained were used without modification for the initial structure calculations.
The assignment of cross-peaks in the NOESY spectrum was carried out in several steps. A preliminary NOE data set (∼500 NOEs) was used to calculate initial structures with CYANA. The resulting conformers with the lowest target functions were used to assign additional peaks in the NOESY spectrum. The cycle of calculations and assignments was repeated until no further assignments were possible. The quality of the introduced constraints was checked at every step by analyzing the restraint violations of the calculated conformers. The NOE cross-peaks corresponding to restraints that were consistently violated in a significant number of structures were checked for possible overlap in the 3D-NOESY, and the corresponding restraints were modified. The cycle was repeated until no consistent violation was detected. An example of this procedure is exemplified by the region Ser34 to Ala40, where no cross-peaks in the HSQC spectrum were observed (see Results). However, the first runs of the structure calculations indicated the proximity between the aliphatic chains of residues in this region and the aromatic moieties at the first helix (Phe17, Tyr20, Tyr24, and Phe25). If such proximity was observed in greater than three-quarters of the calculated structures, and there were unassigned NOEs involving the aromatic moieties, then those NOEs were tentatively assigned, involving the side chain of a residue in that region.
Slowly exchanging amide protons were identified in a 2D-NOESY recorded after the exchanging step. Hydrogen-bond restraints were included in the last steps of the calculation if 1), the amide proton signal was observed in the exchange NOESY experiment; and 2), the hydrogen bond was present in at least one-third of the structures inspected. Each hydrogen bond was specified by two distance restraints: HN-O distance of 1.7–2.3 Å and N-O distance of 2.4–3.3 Å.
The 3JHNHα coupling constants were measured from a 3D-HNHA, and the corresponding backbone dihedral φ-angles obtained by means of the appropriate Karplus curve (38). The 3JHNHαs measured were not corrected for relaxation effects and were likely to be 5–10% underestimated (43). Backbone φ-angles were constrained to –60° ± 30° for 3JHNHα < 5.5 Hz, and –120° ± 60° for 3JHNHα > 7 Hz. From the ratio between intraresidue and sequential HN-Hα NOESY cross-peak intensities and the secondary structure indicated by the conformational shifts of the Hα protons, the ψ-torsion angles were extracted, and introduced as constraints. The conformational shifts of the Hα protons were obtained from the tabulated random-coil values (39).
In the last rounds of the calculations, stereospecific assignments of diastereotopic protons were included. Stereospecific assignments were carried out by using the GLOMSA module of CYANA (42). The stereospecifically assigned protons were: Asp8 (Hβ), Arg10 (Hγ), Pro13 (Hδ), Pro16 (Hβ), Phe17 (Hβ), Arg18 (Hβ), Arg29 (Hβ), Leu46 (Hβ), Val47 (Hγ), Gln48 (Hβ,Hγ), Pro52 (Hβ), Leu61(Hβ), Leu67 (Hβ, Hδ), Glu68 (Hβ), and Glu69 (Hβ).
Structure calculations and analysis
All histidine, arginine, and lysine residues were regarded as positively charged, and glutamate and aspartate side chains as negatively charged. In the NOESY experiments, all proline residues (namely, Pro13, Pro16, Pro52, and Pro63), except Pro3 and Pro80, which could not be assigned, were in a trans conformation, as concluded from the Hα−Hδ NOEs with the corresponding preceding residues. A total of 500 random conformers were annealed in 12,000 steps. The 50 conformers with the lowest target function constituted the final family. Each member of this family was subjected to restrained energy minimization by using the AMBER 8 package (44). Force-field constants of 32 kcal mol−1 Å−2 and 32 kcal mol−1 rad−2 were used for NOE and torsion angle constraints, respectively. Thus, calculations were carried out with the standard force field of the program in vacuo plus the NOEs and angle constraint terms.
The quality of the structures was evaluated in terms of deviations from ideal bond lengths, angles, and through Ramachandran plots by using PROCHECK (45) and PROCHECK-NMR (46). Based on those analysis, the coordinates of the 30 best structures of the AMBER family were chosen. Structures have been represented either with PyMOL (47) or MOLMOL (48).
RESULTS
FTIR measurements
We determined the percentage of secondary structure of CAC and CACW40A by FTIR, since this technique uses similar concentrations to those employed in NMR experiments. Previously, we have reported that at CD concentrations (in the range of μM), the percentage of helicity was identical in CACW40A and in the nonmutated protein (21,23). The results obtained by using FTIR show that CAC and CACW40A had the same degree of helicity (Table 1), and confirm our previous CD results, indicating that the structure of the mutant is similar at the concentrations used in NMR and CD.
TABLE 1.
Secondary structure analysis of nonmutated CAC and CACW40A as determined by FTIR
| Percentage of secondary structure
|
|||
|---|---|---|---|
| Wavenumber (cm−1)* | Nonmutated CAC | CACW40A | Structural assignment† |
| 1673.7 | 9.4 | 8.2 | Turns |
| 1660.3 | 15.2 | 6.9 | 310-helix/α-helix |
| 1650.1 | 48.7 | α-helix | |
| 1647.1 | 41.3 | α-helix | |
| 1635.5 | 17.0 | 23.6 | —‡ |
| 1625.7 | 9.8 | 6.3 | Extended chains |
Errors in the wavenumbers are estimated to be ±2 cm−1.
There is one more band centered at 1614 cm−1. This band is assigned to the amino-acid side chains (49) and it accounts for 6% of the total area of the amide I′ band. The percentages of secondary structure shown in the table do not take into account the contribution of this band. The 1673.7 cm−1 component corresponds to turns (49); the 1660.3 cm−1 band is assigned to 310- and α-helix structures (50,51); the 1650.1 and 1647.1 cm−1 bands are assigned to α-helix (49,52); and the 1625.7 cm−1 band is assigned to extended chains (50).
It is important to indicate here the caveats of the FTIR technique when comparing the α-helical content of both proteins. In both proteins, there was a clear band assigned unambiguously to α-helix, at 1650 cm−1 (Table 1), which was shifted at smaller wave-numbers in the nonmutated CAC. Further, in both proteins there was a band at 1660 cm−1, which could be assigned to either 310 or α-helix (both kind of structures were present in both protein species); and finally, both proteins had a band at 1626 cm−1, whose assignment was ambiguous (51–53). Taken together, it is not possible, given the uncertainties, to make a statistical analysis of the exact content of the α-helical structure in both proteins. We can provide, however, an estimation of the overall content of helical structure in both proteins, and conclude that, within the limitations of FTIR and the experimental uncertainty, the helical content in both proteins was identical. This result agrees with that obtained by CD (21), since at the same concentration of monomeric species, no differences in the measured ellipticities are observed in the far-UV CD spectra of both proteins.
CACW40A is monomeric at NMR concentrations
Some CAC mutants, which, at moderate concentrations, revealed no detectable tendency to dimerize, could show a monomer-dimer equilibrium at the high concentrations used for NMR studies. To determine whether CACW40A was monomeric under NMR conditions, we carried out DOSY experiments in the concentration range from 50 μM to 1 mM.
The translational diffusion coefficient of CACW40A increased linearly as the protein concentration decreased (Fig. 1 B), since at lower protein concentrations, the molecular impairment of the translational diffusion was smaller. The extrapolated D at infinite dilution of the protein (i.e., the y-axis intersection) was 1.20 ± 0.04 × 10⁻⁶ cm2 s−1 at 293 K. Equation 2 yielded a hydrodynamic radius for a spherical CACW40A of 14.2 ± 0.3 Å.
FIGURE 1.

DOSY-NMR experiments of CACW40A. (A) The logarithm of the normalized intensity of the most upfield-shifted peaks is shown as a function of the squares of the gradient strengths at two concentrations: 1 mM (continuous line and open squares) and 500 μM (dotted line and solid squares). The slopes of the plots give the apparent diffusion constant of the molecule in solution at the particular concentration used. (B) NMR diffusion coefficients of the protein as a function of protein concentration. The bars are fitting errors to Eq. 1. The solid line is the fitting to a linear equation whose y-axis intersection yields the diffusion coefficient at 0 M protein concentration.
The hydrodynamic radius for an ideal unsolvated spherical molecule can be theoretically calculated considering that the anhydrous molecular volume,  equals the volume of a sphere (54,55), R, and thus
 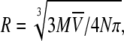 where M is the molecular mass of the protein,
  is its partial specific volume, and N is the Avogadro's number. The molecular mass of a monomeric CACW40A is 9534.9 Da, and
 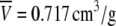 as calculated from amino-acid composition (55). The above expression led to a hydrodynamic radius of 13.9 Å, which agrees very well with that obtained from diffusion measurements. We then conclude that CACW40A is monomeric in solution even at millimolar concentrations, and we can anticipate that its shape is nearly spherical.
In addition to the results of the DOSY experiments supporting the monomeric state of CACW40A at millimolar concentrations, there are other independent pieces of evidence supporting the above conclusion. First, previous ultracentrifugation experiments have shown that CACW40A was monomeric up to concentrations of 23 μM, and probably, to much higher concentrations (19); the lowest concentration used in the DOSY experiments was 50 μM (Fig. 1 B). Second, gel filtration chromatography has shown that CACW40A remains monomeric at protein concentrations of hundreds of micromolar (23). Third, NMR relaxation measurements were carried out at two different concentrations (1 mM and 400 μM, which overlap with the concentration used in the DOSY experiments; see Fig. 1), and they did not show any variation in the rates as the protein concentration was varied (data not shown). Fourth, and finally, DOSY measurements, in other proteins, have been shown to constitute an unambiguous probe to determine protein aggregation and oligomerization even at protein concentrations <100 μM (56–62), and whose results have also been supported by other biophysical techniques (63,64).
Assignment of CACW40A
In the 2D-HSQC, 63 cross-peaks (out of the expected 80 signals) could be clearly identified. The intensity and the broadness among the cross-peaks in the HSQC was very different, suggesting that some amino acids were affected by movements within several timescales. For instance, the cross-peaks of residues Ser34 to Ala40, except those of Val37 and Lys38, were not present at any of the explored temperatures. These residues are close to the mutation site, Ala40, and the absence of resonances could be due to line broadening, arising from conformational exchange. Absence of signals in HSQC experiments due to exchange processes has also been observed in loops and highly mobile regions (65,66). Resonances of residues at the N-terminus, Ser2 to Ser5, and at the C-terminus, Pro80 to Leu87, could not be unambiguously assigned (Supplementary Material, Table S1). Sequential cross-correlations were established based on Hα-HN (or Hα-Hδ for proline residues), Hβ-HN, and/or HN-HN NOEs observed between adjacent residues. For all the residues unambiguously assigned, at least one sequential NOE could be identified.
The intensities of the main chain NOEs, the observed short-, medium-, and long-range NOEs, and the conformational chemical shifts of the Hα resonances indicated that the secondary structure of CACW40A in solution consists of three α-helices (Fig. 2). A total of 24 amide protons showed protection. The location of these protected amide protons is in agreement with the limits of secondary structure determined by NOE data (Fig. 2).
FIGURE 2.

Summary of NMR data. NOEs are classified into strong, medium, or weak, according to the height of the of bar. The corresponding sequential Hα NOEs with the following Hδ of the proline residue are indicated by an open bar in the row corresponding to the αN (i, i+1) NOEs. The light bars indicate residues detected in a two-dimensional NOESY experiment after 4 h of exchange. Residues whose conformational shifts were >0.1, positive or negative, are represented by a + or −, respectively; 0 indicates those residues whose conformational shifts are (positive or negative) <0.1; and the * indicates the glycine residues, with two different chemical shifts for each Hα proton. The 3JNHHα are represented by a dark bar for those residues with a value <5.5 Hz, as measured from HNHA experiments.
The cysteine residues, Cys54 and Cys74, were spatially close, as shown by the Hβ-Hβ NOEs between both residues and the NOEs between the side chains of Cys54 and Met71. However, no disulfide-bond restrictions were included during the calculations (which could have helped in lowering the target function and the final RMSD). The presence of a disulfide bridge has been observed in the nonmutated dimer (20,21,67), but the percentage of free thiols in freshly purified protein was found to be as large as 50% (20). In a recent crystallographic study, where the nonmutated CAC was bound to a peptide, the disulfide bridge was present in the nonbound protein, but it was absent in the unliganded protein (67). However, in CACW40A, due to the absence of a larger number of NOES between both cysteine residues or between adjacent residues, we preferred not to include the disulfide bond as a restriction. This precaution has provided to be certain since in some of the structures of the family ensemble of CACW40A, the side chains of both cysteine residues are not close enough to form the covalent bond.
Calculation of the solution structure of CACW40A
A total of 927 NOEs were collected and translated into 779 relevant distance restraints; further, 66 angle restraints and 40 hydrogen-bond restraints (two for each hydrogen bond) were included in the calculations. The 50 structures with the lowest target functions from CYANA had an average target function of 0.88 (with a minimum at 0.39 and a maximum at 1.18), and an RMS deviation of 1.20 ± 0.20 Å for backbone residues and 1.73 ± 0.22 for all atoms in the ordered polypeptide region (Leu7-Gln75). The NMR structure of CACW40A is represented by the best 30 conformers obtained by AMBER (Table 2). The elements of secondary structure comprising the three α-helices are among the best defined regions of the protein (Fig. 3).
TABLE 2.
NMR restraints and structural statistics for the best 30 structures
| Restraints and statistics | |
|---|---|
| Total number of restraints | 885 |
| NOE restraints | 779 |
| Intraresidue (i-j = 0) | 249 |
| Sequential (|i-j| = 1) | 183 |
| Medium range (|i-j| ≤ 4) | 200 |
| Long range (|i-j| ≥ 4) | 147 |
| Dihedral angle restraints | 66 (for the φ- and ψ-angles) |
| Hydrogen-bond restraints | 20 × 2 |
| Average number of NOE violations > 0.3 Å | 0.23 |
| RMSD from average structure (residues Leu7 to Gln75) | |
| Backbone (Å) | 1.2 ± 0.1 |
| Heavy atoms (Å) | 1.8 ± 0.4 |
| Ramachandran statistics | |
| Most favored region (%) | 60.0 |
| Additionally allowed (%) | 35.3 |
| Generously allowed (%) | 4.3 |
| Disallowed (%) | 0.4 |
FIGURE 3.

Solvent-accessible surface area (A) and root mean-square deviations from mean coordinates (B) per residue. Calculation of the solvent-accessible surface area was carried out with MOLMOL (using a solvent radius of 1.4 Å) (48). The main-chain and side-chain RMS deviations (in Å) are indicated in black and red, respectively. The bars at the top of the panels indicate the α-helices.
Description of the structure
The overall shape of the molecule is nearly spherical (Fig. 4), confirming the results from DOSY measurements. The N-terminal region (residues 1–7) was largely disordered and solvent-exposed (Fig. 3 A). However, there are long-range NOEs between the side chains of Ile6 and Phe24, indicating that the former residue is close to the core of the protein. In 25 conformers out of 30, hydrogen bonds are observed between the NH of Ile9 and the CO of Ile6; and in 15 conformers, the hydrogen bond between Asp8 to Ser5 is present (both hydrogen bonds were not included during the calculations). Further, short-range NOEs are observed between Ile9 and Leu7, and Ile9 and Ile6, and sequential NH-NH protons are present for the patch Leu7 to Ile9 (Fig. 2). Taken together, these data indicate the presence of a 310-helix turn, comprising residues Leu7-Ile9.
FIGURE 4.

Structure of CACW40A. Different views of the ensemble of the best 30 structures of CACW40A. The perpendicular arrangement of the last two helices with the first one is best shown in panel A; the parallel arrangement between the last two helices is best shown in panel B; and, the proximity between the long disordered loop and the first helix is best shown in panel C. The figures were produced with MOLMOL (48). The N and C letters indicate the N- and C-termini of the protein, respectively.
This 310-helix is followed by a type I β-turn formed by Arg10 to Lys14, as suggested by the hydrogen bond between Lys14 and Gly12 (which was not included during the calculations) and angle analysis. This region is immediately followed by the first α-helix, comprising residues Phe17 to Arg29. Fraying at the N- and C-termini of the helix is observed, as concluded from the hydrogen bonds between Tyr20 and Phe17 (which was not included in the calculations), Ala30 and Thr27, and Gln31 and Leu28.
The first α-helix contains the four aromatic residues of the protein, namely Phe17, Tyr20, Phe24, and Tyr25, which form the main core. The side chain of Val21 is deeply inserted in the core as shown by NOEs with the side chains of Leu46, Val47, and Met71. Thus, all these NOEs anchor the C-terminal region of the protein to the first helix.
After the first helix a long loop bulges out, whose residues show a large RMS deviation, especially at the N-terminus (Fig. 3 B). Conversely, residues Thr44, Leu45, Leu46, and Val47 are forming the core of the protein with a low RMS deviation (Fig. 3 B). All these residues belong to the second α-helix in the nonmutated CAC. Thereafter, the second helix (residues Asp53 to Lys59) is highly regular, showing NOEs with Phe17 and with the third α-helix (residues Glu68 to Met71). The following residues, Gly62 to Ala65, adopt a type II β-turn. The last helix is formed by residues Thr66 to Cys74 and it is well defined; in this helix, residues Met70, Met71, and Thr72 are buried. The second and third helices are arranged in a parallel way between them, and in a perpendicular fashion to the first helix (Fig. 4, B and C).
The analysis of the variances of the 30 conformers with PROCHECK-NMR (46) for the φ-, ψ-, and χ1-angles showed that the polypeptide patches Phe17 to Leu28, Asp53 to Leu58, and Glu68 to Ala73 have the smaller variance, with backbone angles close to those expected for ideal α-helices (φ- and ψ-angles), or with side chains in a well-fixed conformation (for the χ1-angle).
DISCUSSION
Structural comparison between the dimeric and monomeric forms of CAC
The structure of the monomeric CACW40A consists of a one-turn of a 310-helix at its N-terminus and three α-helices connected by loops (Fig. 4). The structural features, and the similarities and differences with each subunit in dimeric CAC are discussed next.
The one-turn 310-helix (Leu7-Ile9) of dimeric CAC is also formed in monomeric CACW40A (Fig. 4), as concluded from the FTIR measurements (Table 1), and the observed medium-range NOEs (Fig. 2). The hydrogen-bonding scaffold of the helix was not very stable, as concluded from 1), the hydrogen exchange experiments (Fig. 2); and 2), the fact that some hydrogen bonds are not present in all the structures. Thus, the 310-helix in CACW40A shows a nativelike conformation with a high flexibility.
The first α-helix of dimeric CAC (Phe17 to Arg29) is also present in CACW40A, although the behavior of the four aromatic residues was different to that observed in nonmutated CAC. Whereas Tyr20 and Phe24 showed native contacts (with Leu46 and Asn49; and, with Leu45 and Leu46, respectively), Phe17 and Tyr25 adopted nonnative orientations:
In dimeric CAC, the side chain of Phe17 extends into the hydrophobic cluster formed by the last two helices, being close to the side chains of Cys54, Leu58, Met70, Met71, and Cys74 (19,20,67). In monomeric CACW40A, NOEs between the side chains of Phe17 and Leu58, Met70, Met71, and Cys74 were detected. However, nonnative NOEs were also observed between Phe17 and the side chains of Leu46 and Val47. Residues Leu46 and Val47 are separated from the side chain of Phe17 >6 Å in the nonmutated CAC (19,20). Thus, Phe17 in CACW40A adopts a dual role: firstly, it anchors the last region of the protein to the first helix in a nativelike environment; and secondly, it forces the long disordered loop to stay closer to the first helix, adopting a nonnative conformation.
In dimeric CAC, Tyr25 is close to Val21, Thr27, Leu28, Arg29, Thr42, and Leu67 (19,20,67). In monomeric CACW40A, the side chain of Tyr25 showed NOEs with the side chains of Val21, Leu28, Leu67, but also with that of Leu46.
Then, both aromatic residues adopt a nonnative conformation, as shown by the nonnative NOEs with the side chains of Leu46 and Val47 (these residues also have nonnative contacts with Val21). It is tempting to suggest that the changes in the orientation of the aromatic moieties in the first helix are modulated by the proximity of Thr42, Thr44, Leu45, Leu46, and Val47. In dimeric CAC, these latter residues form the last turn of the second helix, where a kink occurs (19,20). Since this helix is not stably formed in CACW40A (see below), the protein must hide most of its hydrophobic residues from the solvent; the solution adopted is to bend the C-cap region of the second helix making nonnative contacts with the middle and last regions of the first α-helix (Fig. 4 C).
The last two helices are parallel to each other (Fig. 4, A and B), as in dimeric CAC (19,20,67). However, as the region between Leu45 and Asn49 is bent, the last two helices are arranged perpendicularly to the orientation adopted by the same helices in nonmutated dimeric CAC (Fig. 4 B), and are, thus, in a nonnative conformation.
We also inspected whether the highly conserved region in CA from retroviruses, known as the MHR, adopts a nativelike conformation in CACW40A. In dimeric CAC, the conserved MHR residues (Asp8 to Leu28) form a compact strand-turn-helix motif, stabilized by an extensive hydrogen-bonding network (19,20,67). This network involves the side chains of Arg10, Gln11, Glu15, Arg23, and Asn51. We could not detect any of these hydrogen-bonds in the calculated structures. However, two pieces of evidence suggest that the MHR adopts a nativelike conformation in CACW40A. Firstly, the structure and orientation of first α-helix is nativelike (Fig. 4 A and Fig. 5 A). And secondly, the Hδ protons of Arg10 and Arg23 did show different chemical shifts, suggesting a fixed conformation for both side chains (Supplementary Material, Table S1).
FIGURE 5.

Comparison of the structures of each subunit in nonmutated, dimeric CAC and in monomeric CACW40A. (A) Ribbon diagrams of the superposition of a subunit in dimeric CAC (Protein Data Bank: 1A43) (light blue) with the best structure of CACW40A (green). (B) The same superposition of the structures in panel A, as viewed from the bottom of the orientation shown in panel A. The figures were produced with PyMOL (47), and the CAC structure was protonated with MOLMOL (48).
The CACW40A does not form dimeric species due to the absence of the indole moiety, with the loss of van der Waals and hydrophobic interactions. However, due to the absence of the tryptophan side chain, the conformations of other residues involved in the dimerization surface of nonmutated CAC were changed. Residues, which showed dimer contacts, were (19,20,67): Thr2, Ser5, Ile6, Leu7, Asp8, Arg10, Glu31, Glu32, Ala33, Ser34, Glu36, Val37, Trp40 (which is an alanine residue in the monomeric CACW40A), Met41, Glu43, Thr44, Leu45, Val47, Gln48, Asn49, Lys59, and Pro63. In monomeric CACW40A, Thr2, Ser5, Glu31, Glu32, Ala33, Ser34, Glu36, and Ala40 were not completely assigned or not assigned at all (Supplementary Material, Table S1), probably due to line broadening, as it has been discussed. It seems, that in the absence of quaternary interactions, those residues are exploring different conformations (see below). Residue Val37 showed different φ- and ψ-angles to those observed for the residue in nonmutated CAC. The region from Met41 to Asn49, which makes contact in the nonmutated CAC with the MHR region of the other monomer (19,20,67), adopted a nonnative conformation in monomeric CAC, which allowed the burial of a hydrophobic surface (see above). Residues Ile6 to Arg10, which in the dimeric protein are closer to the dimerization helix (residues Thr44 to Asn49), showed a similar structure in both species (see above), but no long-range NOEs were observed with the region Thr44 to Asn49. Then, it seems that the secondary structure of the polypeptide patch Ile6 to Arg10 is not regulated by quaternary interactions with the other monomer. Finally, Lys59 and Pro63 in CACW40A showed similar backbone angles to those observed in the nonmutated protein, but they did not show contacts with the N-terminus of the protein, due to the rotation of this region.
The structure of CACW40A and its implications for understanding folding and association of CA of HIV-1
The folding and association of nonmutated CAC (either by chemical- or heat-denaturation) involves a monomeric intermediate (21–23). The spectroscopic evidence from CD and the very similar values for the thermodynamic parameters in chemical denaturation experiments (free energy and m-values) for the monomeric intermediate of nonmutated CAC and the monomeric CACW40A mutant (21) indicate that both monomeric forms are very similar. This monomeric intermediate does not expose to the solvent a large amount of hydrophobic patches as concluded from the lack of 8-anilino-1-naphtalene-sulfonate binding at room temperature (21,22). However, during the thermal unfolding of nonmutated CAC, the monomeric species binds 8-anilino-1-naphtalene-sulfonate (22). With the structure of CACW40A in hand, we suggest that upon heating, the loop region, which makes nonnative contacts, separates from the first α-helix, exposing the hydrophobic residues.
The NMR structure of CACW40A is highly consistent with spectroscopic observations of this mutant carried out by CD and FTIR. However, there is an apparent contradiction. In the structure of the nonmutated CAC, helix 2 (the dimerization helix) is fully formed (19,20) but not in the monomeric CACW40A (Fig. 4). If helix 2 was totally unstructured in the monomeric form, one could, in principle, expect a significant decrease in helicity relative to the dimer, determined by CD and FTIR; this decrease is not observed either in the monomeric intermediate of CAC or in the CACW40A mutant ((21) and Table 1). It could be argued that 1), in CACW40A the putative decrease in absolute ellipticity at 222 nm might be counterbalanced by a similar increase due to the different environment adopted by the aromatic residues (see above), which also absorb at 222 nm (68,69); and 2), that the mathematical deconvolution of the FTIR spectrum might be unreliable. We cannot rule out the errors in the deconvolution procedure of FTIR, but the method is robust enough, as it has been shown in determination of secondary structure of model proteins (49–51). Either way, we cannot rule out that there is a compensation in the ellipticities upon aromatic rearrangements, although we believe that an exact matching is highly improbable. We favor a simpler explanation based in the reported fact that highly flexible proteins can yield almost nativelike spectra by CD (as well as by other probes), if the interconversion between the different conformations is fast enough (70). We have shown that the segment formed by residues Ser34 to Glu36 and residues Asn39 to Ala40 could not be assigned. The reason behind the absence of assignments is the lack of observable resonances, not the inability to assign the observed ones. The only reasonable explanation for the missing peaks is that those residues are involved in a conformational exchange process that broadens the signals beyond detection (65,66). Such exchange process could be due to exchange of amide protons with the solvent, or to interconversion between different conformers (conformational exchange). The NMR experiments described in this work were acquired with gradients, which minimize the amide protein exchange with solvent; further, control NOESY experiments were acquired at 283 K, to reduce solvent exchange, and still no resonances could be observed for residues in that region (data not shown). Thus, we propose that this region of monomeric CAC samples a nativelike conformation (as shown by CD and FTIR) and one or more partially folded states. These equilibria should be intermediate in the NMR timescale, but fast enough in the FTIR and CD time regimes.
Unfolding of helical elements has been observed in other helical proteins when a cofactor has been removed (66), or when a single residue has been mutated (71,72). Interestingly enough, a helical region in wild-type apocytochrome b562 (residues 1–20) is unstructured in a single point mutant (71). This mutant shows also nonnative contacts that involve the aromatic moieties of the core, similar to what is observed in CACW40A. The structure of the apocytochrome b562 mutant has been proposed to be similar to that of an unfolding intermediate, detected by kinetic methods. However, there is an important difference between the partially unfolded state of CAC and that in apocytochrome b562. In the apocytochrome b562 mutant, the rest of the protein scaffold remains nativelike, while in CACW40A, the last two helices are rotated when compared to nonmutated CAC. To the best of our knowledge, this is the first example where such major rearrangements have been described, as a consequence of a single mutation. It could be thought that this rotation was the result of the structure calculation. However, several lines of evidence argue against the possibility of an artifact. Firstly, the large number of nonnative NOEs observed between the first α-helix and the patch formed by residues Thr42 to Leu46. Secondly, residues Leu45 to Leu46 were unambiguously assigned and their methyl protons are the most upfield-shifted protons of the spectra, showing facile distinguishable contacts with other regions of the protein (Supplementary Material, Table S1). And finally, the rotation of the last two helices is observed during molecular dynamics simulations (by using the standard AMBER force field) of the in silico constructed CACW40A (L. A. Alcaraz, unpublished results). Taken together, these results support the view that nonnative hydrophobic interactions and nonnative structural rearrangements occur in partially unfolded states and, probably, in folding intermediates.
The structural differences observed for the monomeric form of CAC, as revealed by the NMR results with mutant CACW40A, are entirely consistent with the previous thermodynamic data obtained for the monomeric and dimeric forms of CAC and other CAC mutants (21–23). Specifically, the observation is that α-helix 2 is not stably formed and that the packing of some residues is altered—which is consistent with the reduced stability of both CACW40A and the monomeric intermediate, relative to each subunit in the fully formed dimeric CAC (21). Finally, the structure is also consistent with our predictions that the monomeric species of CAC: 1), lacks some of the native tertiary interactions seen in the dimer; and 2), has a conformation that differs from that of the subunits in the dimer (21,22).
Flexibility in CAC and possible biological implications
Our study of the solution structure of CACW40A indicates that CAC, while preserving most of the native scaffold, is structurally highly flexible. In this regard, our results resemble those obtained with a bovine pancreatic trypsin inhibitor mutant whose structure is nativelike, but whose dynamics is highly altered relative to the nonmutated protein (72). However, one question can be raised: is the flexibility observed in CACW40A a consequence of the mutation (as it is in bovine pancreatic trypsin inhibitor), or, alternatively, is it intrinsic to the CAC domain and is it only enhanced by the mutation, which yields a monomeric species? We will try to answer this question by comparing the different structural changes detected in CAC in three previous studies and in the present one.
In the first study it was proposed, based on the NMR structure of a structurally homologous CAC protein, that the MHR of CAC forms dimeric swapped domains (73) during assembly of the immature particle, within the context of the intact Gag protein. The authors propose that the MHR of CAC in one of the monomers moves out and disrupts the intramonomer contacts between the 310-helix and the hydrophobic residues in the first α-helix. Concomitantly, α-helix 2, which forms most of the dimerization region of CAC, is pushed toward the 310-helix of the other monomer. Thus, the nativelike scaffold remains mainly nativelike, but nonnative interactions involve the other monomer and the second dimerization helix of CAC. Furthermore, an aromatic residue, homologous to Phe17 in CACW40A, shows contacts with other regions of the domain. We have shown here that in CACW40A, the 310-helix is flexible and that Phe17 adopts nonnative contacts, indicating a plasticity for the N-terminal region. While this article was being reviewed, the x-ray structure of a dimeric domain swapped variant of the CAC has been reported by the same authors (74). This domain-swapped structure is obtained by a single deletion mutant in CAC (the Ala33), where the swapping zones are the N-terminal region and the first α-helix; on the other hand, the MHR-containing region is involved in the dimerization interface (74); furthermore, the α-helix 2 region appeared slightly shorter than in the dimeric protein.
In a second study, the four-helix bundle scaffold of each subunit in dimeric CAC is altered by the binding of a heterologous peptide to form a five-helix bundle, as shown by x ray (67). Most of the structure of the protein remains unaltered except for the second helix (the dimerization helix), which is displaced 6 Å toward the first helix. Moreover, the majority of the new contacts with the binding peptide occur through the patch of hydrophobic residues Val21, Phe24, Tyr25, Leu28, Arg29, Glu43, Leu46, Leu68, and Met71. The shift changes the dimerization interface of CAC, although the protein is still a dimer. Thus, this study shows that the middle and the C-cap of the first helix, and the C-cap of the second helix, have a tendency to adopt nonnative contacts. Interestingly enough, the residues involved are nearly the same observed to adopt nonnative contacts in CACW40A. Then, preventing dimerization, due to the tryptophan to alanine replacement, leads to a tertiary structure of CAC that looks similar in some regions (but not in others) to that observed in the peptide-bound dimer (67), although the significance of this observation remains to be established.
In a third study it was proposed, based on FTIR, fluorescence, and theoretical analyses, that upon binding to lipid membranes, CAC remains dimeric, but the region around Trp40 and, thus the dimerization helix, shows large structural changes (75). Furthermore, the third and fourth helices also seem conformationally altered, while the rest of the structure is nativelike.
In brief, those three studies reveal that, upon binding to other molecules (lipids, peptides, or other regions of the Gag protein), the molecular environment around the dimerization helix might be substantially altered. In the monomeric CACW40A mutant, the absence of intermonomer (quaternary) interactions favors the unfolding of the second helix and makes the orientation of the last two helices change. In fact, different biophysical techniques (Table 1 and (21,23)), and molecular dynamics simulations (L. A. Alcaraz, unpublished results) suggest that this region fluctuates between the nativelike conformation and other more disordered states. It seems that the plasticity shown by the CAC domain (when faced to different molecular environments) relies on the second helical region, and the changes in this region trigger the changes in the aromatic residues, in the 310-helix, in the second helix, or in the second, third, and fourth helices (67,73–75). Further, in CACW40A, the orientation of the last two helices is also altered to hide from the solvent the hydrophobic residues of the second helix. Taken together, these findings suggest that the multiple roles of CA during assembly of HIV may be mediated by its rather unique ability to adopt different conformations while preserving a similar scaffold in response to different molecular environments.
The fact that the dimerization helix of CAC is not conformationally stable without the intermonomer (quaternary) contacts may also have important implications for the design of drugs able to effectively inhibit the assembly of the HIV-1 capsid by disrupting the CA dimerization interface. We have previously shown that a short peptide comprising the second helical region of CAC (residues Ser34 to Val57) is unfolded in solution, but it is able to bind CAC with an affinity that approached that of the complete CAC domain (76). Similar studies with other peptides have shown that upon binding the peptide acquires a helical conformation, but the exact structure when the peptide is isolated in solution is unknown (67,77). The entropic cost of binding an unstructured peptide that mimics the CAC dimerization interface could not detract from its inhibitory capacity, as a similar entropic cost would have to be paid during the formation of helix 2 on dimerization of CA during assembly of the HIV-1 capsid.
Coordinate and data deposition
The 1H and 15N assignments have been deposited in the BioMagRes bank, BMRB accession No. 15137. The atomic coordinates for an ensemble of 30 structures that represent the solution structure of CACW40A have been deposited in the Protein Data Bank together with the list of restraints used for the structure calculation, PDB code No. 2jo0.
SUPPLEMENTARY MATERIAL
To view all of the supplemental files associated with this article, visit www.biophysj.org. The assignment list of CACW40A is shown in Table S1.
Supplementary Material
Acknowledgments
We thank the two anonymous reviewers for critical ideas and thoughtful suggestions. We thank Drs. M. Bruix and M. A. Jiménez for critical reading of the article. We deeply thank May García, María del Carmen Fuster, Javier Casanova, María T. Garzón, Helena López, and Eva Martínez for excellent technical assistance.
This work was supported by grants from Ministerio de Sanidad y Consumo (MSC) (grant No. FIS 01/0004-02) and Ministerio de Educación y Ciencia (MEC) (grant No. CTQ2005-00360/BQU) to J.L.N., grants from MSC (No. FIS 01/0004-01) and MEC (No. BIO2003-04445) to M.G.M., and by institutional grants from Grupo Urbasa to the Instituto de Biología Molecular and Celular and from Fundación Ramón Areces to the Centro de Biología Molecular “Severo Ochoa”. F.N.B. was the recipient of a predoctoral fellowship from MEC. M.A. was the recipient of a research fellowship from Comunidad Autónoma de Madrid.
L. A. Alcaraz and J. L. Neira contributed equally to this work.
Abbreviations used: 1D, one-dimensional; 2D, two-dimensional; 3D, three-dimensional; CA, capsid protein of HIV-1 (p24); CAC, C-terminal domain of CA, comprising residues 146–231 of the intact protein; CACW40A, mutant of CAC with Ala instead of Trp at position 184; CD, circular dichroism; DOSY, diffusion-ordered spectroscopy; FTIR, Fourier transform infrared spectroscopy; Gag, the structural polyprotein of retroviruses; HSQC, heteronuclear single quantum coherence; MHR, major homology region; NMR, nuclear magnetic resonance spectroscopy; NOE, nuclear Overhauser effect; RMS, root mean square.
Editor: Heinrich Roder.
References
- 1.Freed, E. O. 1998. HIV-1 Gag proteins: diverse functions in the virus life cycle. Virology. 251:1–15. [DOI] [PubMed] [Google Scholar]
- 2.Freed, E. O., and M. Martin. 2001. HIVs and their replication. In Field Virology. D. M. Knipe and P. M. Howley, editors. Lippincott, Philadelphia, PA.
- 3.Vogt, V. M. 1996. Proteolytic processing and particle maturation. Curr. Top. Microbiol. Immunol. 214:95–132. [DOI] [PubMed] [Google Scholar]
- 4.Fuller, T. W., T. Wilk, B. E. Gowen, H.-G. Kräusslich, and V. M. Vogt. 1997. Cryo-electron microscopy reveals ordered domains in the immature HIV-1 particle. Curr. Biol. 7:729–738. [DOI] [PubMed] [Google Scholar]
- 5.Ehrlich, L. S., B. E. Agresta, and C. A. Carter. 1992. Assembly of recombinant human immunodeficiency virus type 1 capsid protein in vitro. J. Virol. 66:4874–4883. [DOI] [PMC free article] [PubMed] [Google Scholar]
- 6.Gross, I., H. Hohenberg, and H.-G. Kräusslich. 1997. In vitro assembly properties of purified bacterially expressed capsid proteins of human immunodeficiency virus. Eur. J. Biochem. 249:592–600. [DOI] [PubMed] [Google Scholar]
- 7.Gross, I., H. Hohenberg, C. Huckangel, and H.-G. Kräusslich. 1998. N-terminal extension of human immunodeficiency virus capsid protein converts the in vitro assembly phenotype from tubular to spherical particles. J. Virol. 72:4798–4810. [DOI] [PMC free article] [PubMed] [Google Scholar]
- 8.Ganser, B. K., S. Li, V. Y. Kliskho, J. T. Finch, and W. I. Sundquist. 1999. Assembly and analysis of conical models for the HIV-1 core. Science. 283:80–83. [DOI] [PubMed] [Google Scholar]
- 9.Li, S., C. P. Hill, W. I. Sundquist, and J. T. Finch. 2000. Image reconstructions of helical assemblies of the HIV-1 CA protein. Nature. 407:409–413. [DOI] [PubMed] [Google Scholar]
- 10.Ehrlich, L. S., T. Liu, S. Scarlata, B. Chu, and C. A. Carter. 2001. HIV-1 capsid proteins forms spherical (immature-like) and tubular (mature-like) particles in vitro: structure switching by pH-induced conformational changes. Biophys. J. 81:586–594. [DOI] [PMC free article] [PubMed] [Google Scholar]
- 11.von Schwedler, U. K., T. L. Stemmler, V. Y. Kliskho, S. Li, K. H. Albertine, D. R. Davis, and W. I. Sundquist. 1998. Proteolytic refolding of the HIV-1 capsid protein amino-terminus facilitates viral core assembly. EMBO J. 17:1555–1568. [DOI] [PMC free article] [PubMed] [Google Scholar]
- 12.Forshey, B. M., U. K. von Schwedler, W. I. Sundquist, and C. Aiken. 2002. Formation of a human immunodeficiency virus type 1 core of optimal stability is crucial for viral replication. J. Virol. 76:5667–5677. [DOI] [PMC free article] [PubMed] [Google Scholar]
- 13.Tang, S., T. Murakami, B. E. Agresta, S. Campbell, E. O. Freed, and J. G. Levin. 2001. Human immunodeficiency virus type 1 N-terminal capsid mutants that exhibit aberrant core morphology are blocked in initiation of reverse transcription in infected cells. J. Virol. 75:9357–9366. [DOI] [PMC free article] [PubMed] [Google Scholar]
- 14.Borsetti, A., Å. Öhagen, and H. G. Göttlinger. 1998. The C-terminal half of the human immunodeficiency virus type 1 Gag precursor is sufficient for efficient particle assembly. J. Virol. 72:9313–9317. [DOI] [PMC free article] [PubMed] [Google Scholar]
- 15.Wang, C. T., and E. Barklis. 1993. Assembly, processing and infectivity of human immunodeficiency virus type 1 Gag mutants. J. Virol. 67:4264–4273. [DOI] [PMC free article] [PubMed] [Google Scholar]
- 16.Momany, C., L. C. Kovari, A. J. Prongay, W. Keller, R. K. Gitti, B. M. Lee, A. E. Gorbalenya, L. Tong, J. McClure, L. S. Ehrlich, M. F. Summers, C. Carter, and M. G. Rossmann. 1996. Crystal structure of dimeric HIV-1 capsid protein. Nat. Struct. Biol. 3:763–770. [DOI] [PubMed] [Google Scholar]
- 17.Gitti, R. K., B. M. Lee, J. Walker, M. F. Summers, S. Yoo, and W. I. Sundquist. 1996. Structure of the amino-terminal core domain of the HIV-1 capsid protein. Science. 273:231–235. [DOI] [PubMed] [Google Scholar]
- 18.Gamble, T. R., F. F. Vajdos, S. Yoo, D. K. Worthylake, M. Houseweart, W. I. Sundquist, and C. P. Hill. 1996. Crystal structure of human cyclophilin A bound to the amino-terminal domain of HIV-1 capsid. Cell. 87:1285–1294. [DOI] [PubMed] [Google Scholar]
- 19.Gamble, T. R., S. Yoo, F. F. Vajdos, U. K. von Schwedler, D. K. Worthylake, H. Wang, J. P. McCutcheon, W. I. Sundquist, and C. P. Hill. 1997. Structure of the carboxyl-terminal dimerization domain of the HIV-1 capsid protein. Science. 278:849–853. [DOI] [PubMed] [Google Scholar]
- 20.Worthylake, D. K., H. Wang, S. Yoo, W. I. Sundquist, and C. P. Hill. 1999. Structures of the HIV-1 capsid protein dimerization domain at 2.6 Å resolution. Acta Crystallogr. D55:85–92. [DOI] [PubMed] [Google Scholar]
- 21.Mateu, M. G. 2002. Conformational stability of dimeric and monomeric forms of the C-terminal domain of human immunodeficiency virus-1 capsid protein. J. Mol. Biol. 318:519–531. [DOI] [PubMed] [Google Scholar]
- 22.Lidón-Moya, M. C., F. N. Barrera, M. Bueno, R. Pérez-Jiménez, J. Sancho, M. G. Mateu, and J. L. Neira. 2005. An extensive thermodynamic characterization of the dimerization domain of the HIV-1 capsid protein. Protein Sci. 14:2387–2404. [DOI] [PMC free article] [PubMed] [Google Scholar]
- 23.del Alamo, M., J. L. Neira, and M. G. Mateu. 2003. Thermodynamic dissection of a low-affinity protein-protein interface involved in human immunodeficiency virus assembly. J. Biol. Chem. 278:27923–27929. [DOI] [PubMed] [Google Scholar]
- 24.Pace, C. N., and J. M. Scholtz. 1997. Measuring the conformational stability of a protein. In Protein Structure, 2nd Ed. T. E. Creighton, editor. Oxford University Press, Oxford.
- 25.Echabe, I., J. A. Encinar, and J. L. R. Arrondo. 1997. Removal of spectral noise in the quantitation of protein structure through infrared band decomposition. Biospectroscopy. 3:469–475. [Google Scholar]
- 26.Wishart, D. S., C. G. Bigam, J. Yao, F. Abilgaard, H. J. Dyson, E. Oldfield, J. L. Markley, and B. D. Sykes. 1995. 1H,13C and 15N chemical shift referencing in biomolecular NMR. J. Biomol. NMR. 6:135–141. [DOI] [PubMed] [Google Scholar]
- 27.Price, W. S. 1997. Pulse-field gradient nuclear magnetic resonance as a tool for studying translational diffusion. I. Basic theory. Concepts Magn. Reson. 9:299–336. [Google Scholar]
- 28.Price, W. S. 1998. Pulse-field gradient nuclear magnetic resonance as a tool for studying translational diffusion. II. Experimental aspects. Concepts Magn. Reson. 10:197–237. [Google Scholar]
- 29.Lapham, J., J. P. Rife, P. B. Moore, and D. M. Crothers. 1997. Measurement of diffusion constants for nucleic acids by NMR. J. Biomol. NMR. 10:255–262. [DOI] [PubMed] [Google Scholar]
- 30.Marion, D., and K. Wüthrich. 1983. Application of phase sensitive two-dimensional correlated spectroscopy (COSY) for measurements of 1H-1H spin-spin coupling constants in proteins. Biochem. Biophys. Res. Commun. 11:967–975. [DOI] [PubMed] [Google Scholar]
- 31.States, D. J., R. A. Haberkorn, and D. J. Ruben. 1982. A two-dimensional nuclear Overhauser experiment with pure absorption phase in four quadrants. J. Magn. Reson. 48:286–292. [Google Scholar]
- 32.Braunschweiler, L., and R. R. Ernst. 1983. Coherence transfer by isotropic mixing: application to proton correlation spectroscopy. J. Magn. Reson. 53:521–528. [Google Scholar]
- 33.Bax, A., and D. G. Davis. 1985. MLEV-17 based two-dimensional homonuclear magnetization transfer spectroscopy. J. Magn. Reson. 65:355–360. [Google Scholar]
- 34.Jeener, J., B. H. Meier, P. Bachmann, and R. R. Ernst. 1979. Investigation of exchange processes by two-dimensional NMR spectroscopy. J. Chem. Phys. 71:4546–4553. [Google Scholar]
- 35.Piotto, M., V. Saudek, and V. Sklenar. 1993. Gradient-tailored excitation for single-quantum NMR spectroscopy of aqueous solutions. J. Biomol. NMR. 2:661–665. [DOI] [PubMed] [Google Scholar]
- 36.Bodenhausen, G., and D. J. Ruben. 1980. Natural abundance nitrogen-15 NMR by enhanced heteronuclear spectroscopy. Chem. Phys. Lett. 69:185–188. [Google Scholar]
- 37.Zhang, O., L. E. Kay, J. P. Olivier, and J. D. Forman-Kay. 1994. Backbone 1H and 15N resonance assignments of the N-terminal SH3 domain of DRK in folded and unfolded states using enhanced-sensitivity pulsed field gradient NMR techniques. J. Biomol. NMR. 4:845–858. [DOI] [PubMed] [Google Scholar]
- 38.Vuister, G. W., and A. D. Bax. 1993. Quantitative J correlation: a new approach for measuring homonuclear three-bond J(HNHα) coupling constants in 15N enriched proteins. J. Am. Chem. Soc. 115:7772–7777. [Google Scholar]
- 39.Wüthrich, K. 1986. NMR of Proteins and Nucleic Acids. J. Wiley and Sons, New York.
- 40.Goddard, T. D., and D. G. Kneller. 2004. SPARKY. University of California, San Francisco, CA.
- 41.Güntert, P., C. Mumenthaler, and K. Wüthrich. 1997. Torsion angle dynamics for NMR structure calculation with the new program DYANA. J. Mol. Biol. 273:283–298. [DOI] [PubMed] [Google Scholar]
- 42.Güntert, P., W. Braun, and K. Wüthrich. 1991. Efficient computation of three-dimensional protein structures in solution from nuclear magnetic resonance data using the program DIANA and the supporting programs CALIBA, HABAS and GLOMSA. J. Mol. Biol. 217:517–530. [DOI] [PubMed] [Google Scholar]
- 43.Cavanagh, J. F., J. Wayne, A. G. Palmer III, and N. J. Skelton. 1996. Protein NMR Spectroscopy: Principles and Practice. Academic Press, San Diego, CA.
- 44.Case, D. A., D. A. Pearlman, J. W. Cadwell, W. S. Ross, T. E. Cheatman, D. M. Ferguson, G. L. Seible, U. C. Singh, P. K. Weiner, and P. A. Kollman. 2003. AMBER 8. University of California, San Francisco, CA.
- 45.Laskowski, R. A., M. W. MacArthur, D. S. Moss, and J. M. Thorton. 1993. PROCHECK: a program to check the stereochemical quality of protein structures. J. Appl. Crystallogr. 26:283–291. [Google Scholar]
- 46.Laskowski, R. A., J. A. C. Rullmann, M. W. MacArthur, R. Kaptein, and J. M. Thronton. 1996. AQUA and PROCHECK-NMR: programs for checking the quality of proteins structures solved by NMR. J. Biomol. NMR. 8:477–486. [DOI] [PubMed] [Google Scholar]
- 47.DeLano, W. L. 2002. The PyMOL Molecular Graphics System. DeLano Scientific, San Carlos, CA.
- 48.Koradi, R., M. Billeter, and K. Wüthrich. 1996. MOLMOL: a program for display and analysis of macromolecular structure. J. Mol. Graph. 14:51–55. [DOI] [PubMed] [Google Scholar]
- 49.Surewicz, W. K., and H. H. Mantsch. 1988. New insight into protein secondary structure from resolution-enhanced infrared spectra. Biochim. Biophys. Acta. 952:115–130. [DOI] [PubMed] [Google Scholar]
- 50.Arrondo, J. L., and F. M. Goni. 1999. Structure and dynamics of membrane proteins as studied by infrared spectroscopy. Prog. Biophys. Mol. Biol. 72:367–405. [DOI] [PubMed] [Google Scholar]
- 51.Surewicz, W. K., H. H. Mantsch, and D. Chapman. 1993. Determination of protein secondary structure by FT-IR. A critical assessment. Biochemistry. 32:389–394. [DOI] [PubMed] [Google Scholar]
- 52.Chehin, R., I. Iloro, M. J. Marcos, E. Villar, V. L. Shnyrov, and J. L. Arrondo. 1999. Thermal and pH-induced conformational changes of a beta-sheet protein monitored by infrared spectroscopy. Biochemistry. 38:1525–1530. [DOI] [PubMed] [Google Scholar]
- 53.Shaw, R. A., G. W. Buchko, G. Wang, A. Rozek, W. D. Treleaven, H. H. Mantsch, and R. J. Cushley. 1997. Infrared spectroscopy of human apolipoprotein fragments in SDS/D2O: relative lipid-binding affinities and a novel amide I assignment. Biochemistry. 36:14531–14538. [DOI] [PubMed] [Google Scholar]
- 54.Cantor, C. R., and P. R. Schimmel. 1980. Biophysical Chemistry. W. H. Freeman and Company, New York.
- 55.Creighton, T. E. 1993. Proteins. Structures and Macromolecular Properties, 2nd Ed. W. H. Freeman, New York.
- 56.Price, W. S., F. Tsuchiya, and Y. Arata. 2001. Time dependence of aggregation in crystallizing lysozyme solutions probed by using NMR self-diffusion measurements. Biophys. J. 80:1585–1590. [DOI] [PMC free article] [PubMed] [Google Scholar]
- 57.Narayanan, S., B. Bösl, S. Walter, and B. Reif. 2003. Importance of low-oligomeric-weight species for prion propagation in the yeast prion system Sup35/Hsp104. Proc. Natl. Acad. Sci. USA. 100:9286–9291. [DOI] [PMC free article] [PubMed] [Google Scholar]
- 58.Moreau, V. H., A. C. da Silva, R. M. P. Siloto, A. P. Valente, A. Leite, and F. C. L. Almeida. 2004. The bZIP region of the plant transcription factor opaque-2 forms stable homodimers in solution and retains its helical structure upon subunit dissociation. Biochemistry. 43:4862–4868. [DOI] [PubMed] [Google Scholar]
- 59.Price, W. S., M. Nara, and Y. Arata. 1997. A pulse field gradient NMR study of the aggregation and hydration of parvalbumin. Biophys. Chem. 65:179–187. [DOI] [PubMed] [Google Scholar]
- 60.Dingley, A. J., J. P. Mackay, B. E. Caphaman, M. B. Morris, P. W. Kuchel, B. D. Hambly, and G. F. King. 1995. Measuring protein self-association using pulsed-field-gradient NMR spectroscopy: application to myosin light chain 2. J. Biomol. NMR. 6:321–328. [DOI] [PubMed] [Google Scholar]
- 61.Altieri, A. S., D. P. Hinton, and R. A. Byrd. 1995. Association of biomolecular systems via pulsed field gradient NMR self-diffusion measurements. J. Am. Chem. Soc. 117:7566–7567. [Google Scholar]
- 62.Ilyina, E., V. Roongta, H. Pan, C. Woodward, and K. H. Mayo. 1997. A pulse field gradient NMR study of bovine pancreatic trypsin inhibitor self-association. Biochemistry. 36:3383–3388. [DOI] [PubMed] [Google Scholar]
- 63.Choy, W. Y., F. A. Mulder, K. A. Crowhurst, D. R. Muhandiram, I. S. Millett, S. Doniach, J. D. Forman-Kay, and L. E. Kay. 2002. Distribution of molecular size within an unfolded state ensemble using small-angle x-ray scattering and pulse field gradient NMR techniques. J. Mol. Biol. 316:101–112. [DOI] [PubMed] [Google Scholar]
- 64.Casares, S., M. Sadqi, O. López-Mayorga, F. Conejero-Lara, and N. A. J. van Nuland. 2004. Detection and characterization of partially unfolded oligomers of the SH3 domain of a-spectrin. Biophys. J. 86:2403–2413. [DOI] [PMC free article] [PubMed] [Google Scholar]
- 65.Fischer, M. W. F., A. Majumdar, and E. R. P. Zuiderweg. 1998. Protein NMR relaxation: theory, applications and outlook. Progress NMR Spectrosc. 33:207–272. [Google Scholar]
- 66.Eliezer, D., and P. E. Wright. 1996. Is apomyoglobin a molten globule? Structural characterization by NMR. J. Mol. Biol. 263:531–538. [DOI] [PubMed] [Google Scholar]
- 67.Ternois, F., J. Stitch, S. Duquerroy, H.-G. Kräusslich, and F. A. Rey. 2005. The HIV-1 capsid protein C-terminal domain in complex with a virus assembly inhibitor. Nat. Struct. Mol. Biol. 12:678–682. [DOI] [PubMed] [Google Scholar]
- 68.Kelly, S. M., and N. C. Price. 2000. The use of circular dichroism in the investigation of protein structure and function. Curr. Protein Peptide Sci. 1:349–384. [DOI] [PubMed] [Google Scholar]
- 69.Woody, R. W. 1995. Circular dichroism. Methods Enzymol. 246:34–71. [DOI] [PubMed] [Google Scholar]
- 70.Mayor, U., N. R. Guydosh, C. M. Johnson, G. Grossmann, S. Sato, G. S. Jas, S. M. V. Freund, D. O. V. Alonso, V. Daggett, and A. R. Fersht. 2003. The complete folding pathway of a protein from nanosecond to microsecond. Nature. 42:863–867. [DOI] [PubMed] [Google Scholar]
- 71.Feng, H., H. Takei, R. Lipsitz, N. Tjandra, and Y. Bai. 2003. Specific non-native interactions in a hidden folding intermediate: implications for protein folding. Biochemistry. 42:12461–12465. [DOI] [PubMed] [Google Scholar]
- 72.Battiste, J. L., R. Li, and C. Woodward. 2002. A highly destabilizing mutation of G37A of the bovine pancreatic trypsin inhibitor retains the average native conformation but greatly increases local flexibility. Biochemistry. 41:2237–2245. [DOI] [PubMed] [Google Scholar]
- 73.Ivanov, D., J. R. Stone, J. L. Maki, T. Collins, and G. Wagner. 2005. Mammalian SCAN domain dimer is a domain swapped homolog of the HIV capsid C-terminal domain. Mol. Cell. 17:137–143. [DOI] [PubMed] [Google Scholar]
- 74.Ivanov, D., O. V. Tsodikov, J. Kasanov, T. Elenberger, G. Wagner, and T. Collins. 2007. Domain-swapped dimerization of the HIV-1 capsid C terminal domain. Proc. Natl. Acad. Sci. USA. 104:4353–4358. [DOI] [PMC free article] [PubMed] [Google Scholar]
- 75.Barrera, F. N., E. Hurtado-Gómez, M. C. Lidón-Moya, and J. L. Neira. 2006. Binding of the C-terminal domain of the HIV-1 capsid protein to lipid membranes: a biophysical characterization. Biochem. J. 394:345–353. [DOI] [PMC free article] [PubMed] [Google Scholar]
- 76.Garzón, M. T., M. C. Lidón-Moya, F. N. Barrera, A. Prieto, J. Gómez, M. G. Mateu, and J. L. Neira. 2004. The dimerization domain of the HIV-1 capsid protein binds a capsid protein-derived peptide: a biophysical characterization. Protein Sci. 13:1512–1523. [DOI] [PMC free article] [PubMed] [Google Scholar]
- 77.Stitch, J., M. Humbert, S. Fidnlow, J. Bodem, B. Müller, U. Dietrich, J. Werner, and H.-G. Kräusslich. 2005. A peptide inhibitor of the HIV-1 assembly in vitro. Nat. Struct. Mol. Biol. 12:671–677. [DOI] [PubMed] [Google Scholar]
Associated Data
This section collects any data citations, data availability statements, or supplementary materials included in this article.