Abstract
MicroRNAs (miRNAs) represent a newly discovered class of posttranscriptional regulatory noncoding small RNAs that bind to targeted mRNAs and either block their translation or initiate their degradation. miRNA profiling of hematopoietic lineages in humans and mice showed that some miRNAs are differentially expressed during hematopoietic development, suggesting a role in hematopoietic cell differentiation. In addition, recent studies suggest the involvement of miRNAs in the initiation and progression of cancer. miR155 and BIC, its host gene, have been reported to accumulate in human B cell lymphomas, especially in diffuse large B cell lymphomas, Hodgkin lymphomas, and certain types of Burkitt lymphomas. Here, we show that Eμ-mmu-miR155 transgenic mice exhibit initially a preleukemic pre-B cell proliferation evident in spleen and bone marrow, followed by frank B cell malignancy. These findings indicate that the role of miR155 is to induce polyclonal expansion, favoring the capture of secondary genetic changes for full transformation.
Keywords: transgenic mouse, malignant lymphoproliferation, microRNAs
MicroRNAs (miRNAs) represent a new class of abundant small RNAs that play important regulatory roles at the posttranscriptional level; by binding to their targeted mRNAs, they either block their translation or initiate their degradation, according to the degree of complementarity with the target.
Since their discovery in 1993 in Caenorhabditis elegans (1), there have been numerous reports that implicated these tiny molecules in the posttranscriptional regulation of a large array of proteins with very diverse roles, ranging from cell proliferation and differentiation to lipid metabolism (2–6).
miRNA profiling of hematopoietic lineages in humans and mice showed that miRNAs are differentially expressed in the course of hematopoietic development, suggesting a potential role in hematopoietic differentiation (7–9). We have shown that miR-15a and miR-16-1 are deleted or down-regulated in ≈68% of cases of chronic lymphocytic leukemia (CLL) (10, 11), and that miRNAs genes are frequently located at fragile sites and other genomic regions involved in cancers (12). Transcripts of miR155 and BIC (its host gene) transcripts have been shown to accumulate in human B cell lymphomas, especially diffuse large B cell lymphomas (13), Hodgkin lymphomas (14), and subsets of Burkitt lymphomas (latency type III Epstein–Barr virus-positive Burkitt lymphoma; ref. 15). These reports provide indirect evidence that miR155 may play a role in B cell development and lymphomagenesis. We have also reported that miR155 is overexpressed in the aggressive form of CLL (11).
Here, we show that the transgenic mice carrying a miR155 transgene whose expression is targeted to B cells (Eμ-mmu-miR155) exhibit initially a preleukemic pre-B cell proliferation, evident in spleen and bone marrow, and later develop a frank B cell malignancy.
Results and Discussion
Production and Characterization of Eμ-mmu-miR155.
We generated transgenic mice in which the expression of mmu-miR155 (mouse miR155) is under the control of a VH promoter-Ig heavy chain Eμ enhancer, which becomes active at the late pro-B cell stage of the B cell development. Fifteen transgenic founders were identified by Southern blot hybridization, seven on C57BL/B6 and eight on FVB/N backgrounds. These were bred to wild-type mice of the same strain to produce 15 independent transgenic lines.
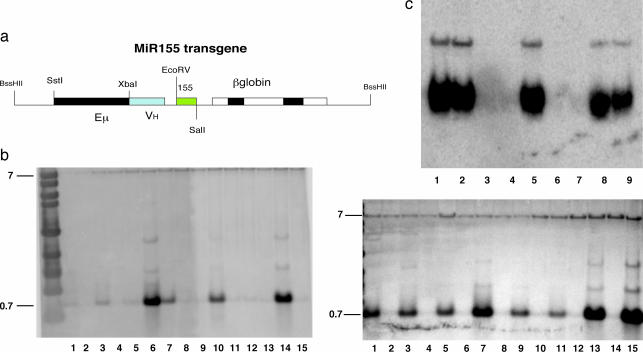
Northern blot and real-time PCR analysis (data not shown) performed on total RNA extracted from transgenic and wild-type spleens showed a very good expression of miR155, described in Fig. 1c. All other founder lines but one also expressed the transgene. Wild-type mice did not express mature miR155 in the spleen, as reported previously (16).
Fig. 1.
Production and characterization of Eμ-mmu-miR155. (a) A construct for the miR155 transgene was designed as shown. The mmu-miR155 was cloned between the EcoRV and SalI sites, putting the transgene under the control of the VH promoter Eμ enhancer. The construct was then injected in the male pronuclei of the oocytes of pregnant C57BL/6 and FVB/N female mice. (b) Southern blot was used to genotype the founders. Fifteen transgenic founders were born, seven on a C57BL/6 background (b Left, lanes 1, 3, 5, 6, 7, 10, and 14 are transgenics, and lanes 2, 4, 8, 9, 11, 12, 13, and 15 are wild types) and eight on an FVB/N background (b Right, lanes 1, 3, 5, 7, 9, 11, 13, and 15 are transgenics, and lanes 2, 4, 6, 8, 10, 12, and 14 are wild types). These were then bred to wild-type strain-matched mice to produce 15 transgenic lines. (c) In each of the 15 transgenic lines, expression of the transgene was assessed by Northern blot on total RNA extracted from the lymphocytes isolated from the spleens of 3-week-old mice by using the antisense oligonucleotide of the mmu-miR155 mature sequence as a probe. Five of the transgenic lines with the highest level of expression of the mature miR155 in the splenocytes were selected for further breeding and analysis; one transgenic line did not express the transgene [lanes 1, 2, 3, 5, 8, and 9 (transgenics); lanes 4, 6, and 7 (wild types)].
Eμ-mmu-miR155 Exhibited Splenomegaly as Early as 3 Weeks of Age.
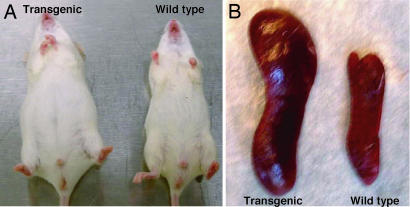
Spleens of transgenic mice were enlarged, with a spleen weight/body weight ratio three to four times greater than that of wild-type mice at 3 weeks of age and did not increase significantly with age (Table 1 and Fig 2).
Table 1.
Spleen and body measurements for transgenic compared with wild-type mice
| Mice | Line (founder) | Age, wks | BW, g | SW, mg | WI, mg/g |
|---|---|---|---|---|---|
| 72tg | 8 | 3 | 22.68 | 210 | 9.25 |
| 69wt | 8 | 3 | 23.90 | 90 | 3.76 |
| 74tg | 8 | 3 | 23.98 | 270 | 11.25 |
| 68wt | 8 | 3 | 24.54 | 60 | 2.44 |
| 8tg | 8 | 24 | 38.3 | 380 | 9.92 |
| 24wt | N/A | 24 | 26.5 | 100 | 3.77 |
| 50tg | 10 | 3 | 21.7 | 200 | 9.21 |
| 49wt | 10 | 3 | 20.4 | 80 | 3.92 |
| 148tg | 8 | 6 | 26.97 | 240 | 8.89 |
| 149wt | 8 | 6 | 25.9 | 100 | 3.86 |
| 156tg | 10 | 6 | 23.44 | 280 | 11.94 |
| 157wt | 10 | 6 | 23.91 | 100 | 4.18 |
| 220wt | 8 | 7 | 23.13 | 120 | 5.2 |
| 221tg | 8 | 7 | 22.37 | 260 | 11.6 |
| 222tg | 8 | 7 | 21.67 | 250 | 11.5 |
| 223wt | 8 | 7 | 22.44 | 120 | 5.2 |
Mice were weighed after being killed, and the spleens were measured and weighed. Spleens of transgenic mice were enlarged, with a spleen weight/body-weight ratio three to four times greater than that of wild-type mice. BW, body weight; SW, spleen weight; WI, weight index.
Fig. 2.
Transgenic mice, 6 months old, presented an enlarged abdomen and important splenomegaly. (A) Transgenic mice, 6 months old, had a considerably enlarged abdomen compared with wild-type mice, due to the clinically evident splenomegaly. (B) Spleens of the mice shown in A. The transgenic spleen is enlarged due to expansion of leukemic/lymphoma cells.
Transgenic Mice Overexpressing miR155 Are Leukopenic.
The white blood cell count (WBC) of transgenics 3 months of age was 10 × 106 ± 1 × 10⁶/ml compared with 40 × 106 ± 1.5 × 10⁶/ml for normal age-matched mice. The WBC for transgenic mice 6 months of age was even lower, at 6 × 10⁶ ± 0.5 × 10⁶/ml, whereas that of wild type was unchanged.
Histological and Immunohistochemical Analysis of Eμ-mmu-miR155 Mice.
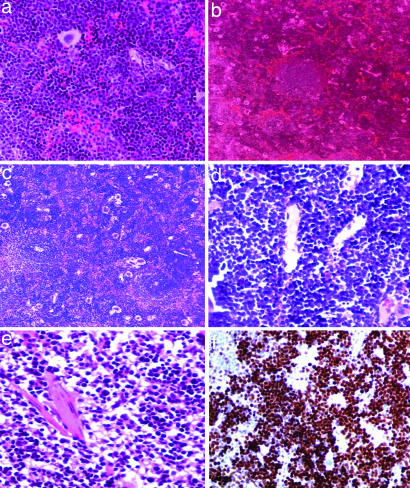
The histopathology of the spleens [hematoxylin/eosin (H&E) stain] from 3-week-old mice featured a consistent atypical lymphoid population invading the red pulp and expanding it; the lymphoid follicles were unaffected, and there were multiple foci of secondary hematopoiesis (Fig. 3a). Mice at 6 months of age presented histologically a greatly increased malignant lymphoid population with marked atypia and blastic appearance, proliferating in the vascular channels of the red pulp and gradually replacing the white pulp. The number of lymphoid follicles was decreased, and the overall architecture of the spleen was distorted by lymphoid proliferation (Fig. 3 b and c). A histologically similar lymphoid population was present in the bone marrow of 6-month-old mice. Expression of the proliferation Ki67 antigen showed a marked lymphoid proliferation in transgenic mice, not observed in wild-type mice (Fig. 3f).
Fig. 3.
Histology and immunohistochemistry of transgenic spleens compared with the wild type. (a) H&E, spleen (×200), atypical lymphoid proliferation compressing the white pulp in mouse no. 50 (founder 10), 3 weeks old. (b) H&E, spleen (×100), founder no. 8, 6 months of age. The overall architecture of the spleen is being replaced by the atypical lymphoid proliferation. There are only a few remaining germinal lymphoid follicles, greatly decreased in size, compressed by the proliferation. (c) H&E, spleen (×200), transgenic mouse, founder line no. 8, 6 months old. The spleen architecture has been almost completely effaced by the lymphoblastic proliferation. There are still visible remnants of two small compressed lymphoid follicules. (d) H&E, bone marrow (×400), transgenic mouse, founder line no. 8, 6 months old showing the lymphoblastic proliferation in the bone marrow that leads to the replacement of the hematopoietic foci. (e) H&E, normal spleen (×200). (f) Immunohistochemistry, spleen, transgenic mouse no. 72, 3 weeks old, for Ki67, showing increased lymphoid proliferation in the spleen (×200).
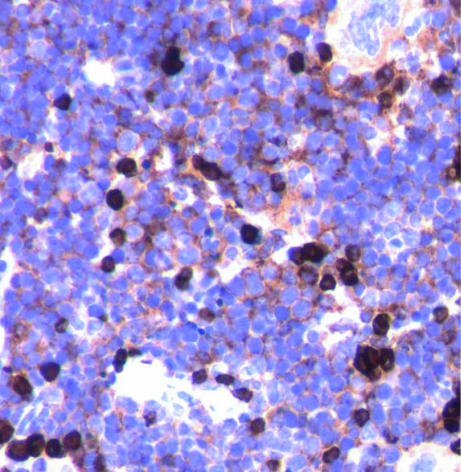
Immunohistochemistry performed to identify the immunophenotype of the lymphoid proliferation showed low positivity of the atypical expanded lymphocytes for B220 and VpreB1 (CD179a), although CD43 was negative (data not shown). The IgM staining of the paraffin-embedded sections of the transgenic spleens showed the presence of μ chains in the cytoplasm of the proliferating lymphocytes (Fig. 4), whereas flow cytometry analysis failed to identify the expression of IgM on the surface of these cells, indicating that the expanded lymphoid cells expressed cytoplasmic μ chain but did not express surface IgM.
Fig. 4.
IgM staining of the atypical lymphoid proliferation in the spleen of a transgenic mouse, 3 weeks old. IgM is present in the cytoplasm of the proliferating lymphocytes (cIgM) as a brown perinuclear halo in the transgenic mice, whereas the wild-type lymphocytes are intensely brown, with no distinct nuclei, due to the presence of both sIgM and cIgM; immunohistochemistry (×400), spleen, mouse no. 50, 3 weeks old, malignant lymphoid cells with cIgM-positive stained cytoplasm.
Flow Cytometry Analysis of Eμ-mmu-miR155 Reveals an Expansion of the B220low/CD10low/IgM−/CD5−/TCR−/CD43− Population.
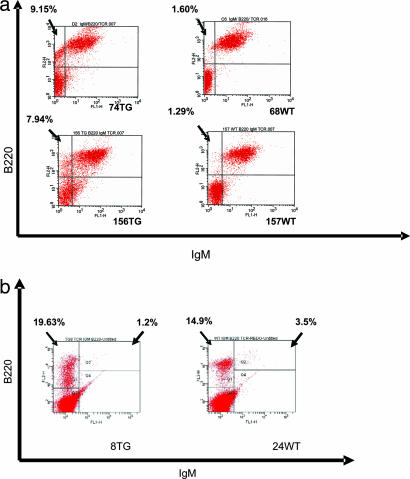
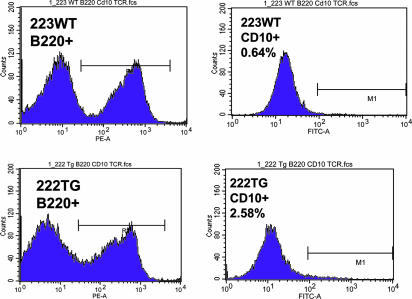
Flow cytometry analysis, performed on single-cell suspensions of WBC from spleens and bone marrows of transgenic and wild-type mice of 3, 6, and 7 weeks and 6 months of age, showed an increase of B220low/CD10low/IgM−/CD5−/TCR−/CD43− lymphoid cells in both spleen and bone marrow in the transgenic mice compared with their wild-type counterparts. This phenotype resembles the phenotype of proliferating lymphocytes observed in human acute lymphoblastic leukemia or lymphoblastic lymphoma. Our findings indicate that the B220low/CD19low/CD10low/IgM−/TCR−/CD43− lymphoid population in the spleens of transgenic mice at 3 weeks old (assessed on one transgenic and one wild-type mouse) is 9% out of the entire gated lymphoid population and only 1.65% in the wild type; this becomes 6.6 ± 1.4% in the spleen of 6-week-old transgenic mice (two transgenics analyzed from two different founding lines and two wild-type mice) and 4.7 ± 0.3% for mice 7 weeks of age (two transgenics and one wild type), while remaining unchanged for the wild type. In the bone marrow of transgenic mice 6 months old, we found an increase of the pre-B cell population as defined by B220low/IgM− expression, compared with the wild type (Figs. 5 and 6).
Fig. 5.
Flow cytometry analysis reveals an expansion of the B220low/CD10low/IgM−/CD5−/TCR−/CD43− population in the spleen and bone marrow of transgenic mice. Flow cytometry analysis of the spleen and bone marrow was used to characterize the immunophenotypic profile of the lymphocytes in the spleen (a) and bone marrow (b) of mice coming from two different lines of founders (founders 8 and 10), with ages between 3 weeks and 6 months. (a) Gated splenocytes for two transgenic mice and two wild types, 3 weeks of age (Tg no. 74, F8; and WT no. 68, F10) and 7 weeks of age (Tg no. 156; and WT no. 157). The upper left quadrant gating the B220+/IgM− population shows an increase of the precursor B cells, in comparison with wild type. (b) Gated bone marrow white cells for one transgenic and one wild-type mouse, 6 months of age (Tg no. 8 and WT no. 24). The upper right quadrant indicates the decrease of the B200+ IgM+ gated mature B cell population of the bone marrow.
Fig. 6.
CD10 expression evaluated by flow cytometry on B220+ gated splenocytes in transgenic and wild-type mice. Flow cytometry analysis on B220+ gated splenocytes of transgenic and wild-type mice, 7 weeks of age, showing an increase in the transgenic compared with the wild type. The right column shows the B220+ gated population in transgenic and wild-type mice. The increase of the B220low population is noticeable (intercalated between the two peaks of B220− and B220+) in the transgenic mouse. The left column shows the increase in percentage of the CD10+ population in the B220+ gated population only, in transgenics and wild-type mice, proving that the B220low proliferation is due, at least in part, to an increase of the CD10+ population.
Forward-scatter analysis of the B220low/IgM− cell population showed that these cells are large blastoid cells (data not shown).
Cytogenetics Indicated Genomic Alterations.
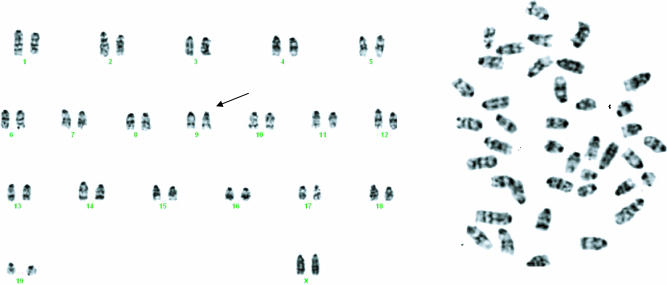
Cytogenetic studies of the karyotype of the splenocytes failed to identify consistent chromosomal abnormalities in the transgenic spleens compared with the normal littermates but showed occasionally some genomic alterations (Fig. 7). These results indicate that the expanded population of pre-B cells is diploid and cytogenetically quasinormal.
Fig. 7.
Chromosome 9 abnormality, identified by a thick extra band. Cytogenetics of the lymphoid cells isolated from a transgenic spleen. Splenocytes were grown and assessed for chromosomal deletions, translocations, inversions, and number of metaphases. Few abnormalities were identified, but none seemed to be consistently present in all of the samples analyzed.
Southern Blot Analysis for Ig Heavy Chain Rearrangements Showed a Polyclonal Pre-B Cell Proliferation at Least Until 6 Weeks of Age.
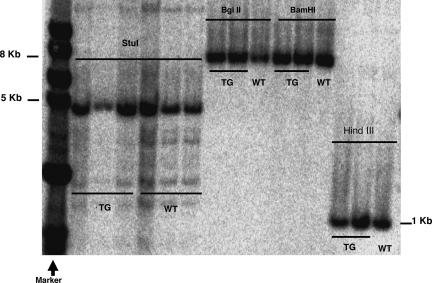
Southern blot analysis for clonality by V(D)J rearrangements on splenocyte mouse DNA 3–6 weeks of age using multiple digestion enzymes did not show the presence of clonally rearranged bands in the transgenic compared with wild-type mice (except for one transgenic mouse that had a single prominant rearranged band on all of the Southern blots performed with different restriction enzymes; data not shown). This shows that the B cell population in mice of this age range was usually polyclonal, indicating that the lymphoproliferation was, for the most part, polyclonal, at least until 6 weeks of age (Fig. 8).
Fig. 8.
Ig heavy chain rearrangement. Southern blot on DNA extracted from the splenocytes of transgenic and wild-type mice. Southern blot on transgenic and wild-type DNA extracted from splenocytes (five transgenic and four wild-type mice, 3–6 weeks of age) using the JH4 probe and different digesting enzymes: StuI, BglII, BamHI, and HindIII. The thick bands of high molecular weight correspond to the germ line; there are no rearranged bands in the transgenics, compared with the wild type (TG, transgenic mice; WT, wild-type mice).
Microarray Analysis Confirmed the Up-Regulation of VpreB1 mRNA, Specific for the Pre-B Cells.
Microarray analysis of miRNAs was performed on the total RNA extracted from the splenic white cells of five transgenics (among which one did not have the expression of the transgene) and six wild-type littermate counterparts, revealing a 10- to 20-fold increase in expression of miR155, -194, -224, -217, and -151 (Table 2, which is published as supporting information on the PNAS web site) and a decrease of expression of miR146 and -138, 2- to 3-fold in transgenic mice overexpressing miR155. Using an Affymetrix microarray chip, we studied the differential expression of mRNAs in the same group of transgenics, compared with their littermate controls. The statistical analysis of the Affymetrix microarray showed that 200 proliferation genes were up-regulated, whereas 50 genes were down-regulated in the miR155-overexpressing mice (data not shown). Interestingly enough, the VpreB1 mRNA was up-regulated, as one would expect when the proliferation of pre-B cells takes place. These data complement the data from flow cytometry analysis and immunohistochemistry (Table 3, which is published as supporting information on the PNAS web site).
Eμ-mmu-miR155 Transgenic Mice Present Pre-B Cell Proliferation and Lymphoblastic Leukemia/High-Grade Lymphoma.
We concluded, based on the flow cytometry, histological and immunohistochemical analyses, that a pre-B cell proliferation defined as IgM−/CD43−/TCR− occurred in the spleens and bone marrows of transgenic mice, already detectable at 3 weeks of age. This proliferation led later on to splenomegaly, bone marrow replacement, and marked lymphopenia, features often associated with high-grade B cell malignancies. By the age of 6 months, seven of seven transgenic mice developed high-grade B cell neoplasms (seven of seven transgenic mice, 6 months old) compared with the wild-type controls, which were all healthy (11 of 11 wild-type mice). The transgenic mouse line not overexpressing miR155 was also normal.
Conclusion
Acute lymphoblastic leukemia and high-grade lymphoma are the most common of leukemias and lymphomas in children. Transgenic mice with overexpression of miR155 develop a lymphoproliferative disease resembling the human diseases, thus strongly suggesting that miR155 is directly implicated in the initiation and/or progression of these diseases. The disease is, for the most part, polyclonal, suggesting that only the overexpression of miR155 or additional few genetic changes is sufficient to induce malignancy. Because malignancies, for the most part, are monoclonal, this finding suggests that miR155 could be the downstream target of signal transduction pathways activated in cancer. This is direct evidence that overexpression of a miRNA results in the development of a neoplastic disease, highlighting their potential role in human malignancies. Interestingly, we observed overexpression of miR155 in solid tumors such as breast, lung, and colon cancer (in lung cancers, overexpression of miR155 was an indicator of bad prognosis; ref. 17). The Eμ-mmu-miR155 transgenic mouse will also be a useful tool to devise new therapeutic approaches to treat different forms of acute lymphoblastic leukemia or high-grade lymphomas in humans.
Materials and Methods
Eμ-mmu-miR155 Transgenic Mice.
A 318-bp fragment was amplified by PCR from the 129SvJ mouse genome (The Jackson Laboratory) containing the precursor sequence of the miR155 and cloned into the EcoRV and SalI sites of the pBSVE6BK (pEμ) plasmid, which had been previously used by our group for the development of chronic lymphocytic leukemia in Eμ-TCL1 transgenic mice (18), which contains the Eμ enhancer VH promoter for Ig heavy chains, alongside the 3′ UTR and the poly(A) of the human β-globin gene (Fig. 1a) The transgene was isolated by cutting the construct with BssHII and PvuI and injected into the male pronucleus of fertilized oocytes of pregnant FVB/N and C57BL/6 mice. Pups were screened for the presence of the transgene by Southern blot performed on tail-extracted DNA and digested with BamHI, using a probe designed in the Eμ enhancer sequence. Fifteen founders were identified (seven for C57BL/6, marked F1–7, and eight for the FVB/N strain, marked F8–15) and bred to age-matched wild-type mice (Fig. 1b). Transgenic hemizygous mice were born, studied, and compared with their wild-type counterparts. Mice were genotyped by PCR performed on tail-extracted DNA (data not shown).
Northern Blot Analysis of Transgenic Offspring.
Spleens were dissociated between two frosted slides, and the lysate was washed in PBS, depleted of red cells by hypotonic lysis with ammonium chloride (NH4Cl), centrifuged, and resuspended in PBS. Total RNA was extracted with TRIzol (GIBCO, Invitrogen), loaded and denatured on SDS/PAGE, and blotted on a Hybond N+ membrane (Amersham Pharmacia). The membrane was hybridized with a γ-32P radioactive probe represented by the antisense of the mature mmu-miR155 sequence, incubated overnight, washed, and exposed to a PhosphorImager screen (Molecular Dynamics). The image was processed by using a Typhoon image processing system (Amersham Biosciences) (Fig. 1c).
Somatic Measurements.
Mice were weighed after being killed, and the spleens were measured and weighed.
WBC and Smear Preparation.
Blood was drawn from retroorbital blood vessels, smeared on frosted slides, and Giemsa-stained; part of it was centrifuged, washed in PBS, and treated with ammonium chloride, then cells were counted with a cell-counter chamber.
Flow Cytometry Analysis.
Single-cell suspension of splenocytes and bone marrow cells was depleted of mature red blood cells by hypotonic lysis (0.165 M NH4Cl) and stained with the following conjugated antibodies: anti-B220-phycoerythrin, anti-IgM-FITC, anti-TCR-phycoerythrin cy5, anti-CD5-phycoerythrin, and anti-CD-43-FITC (all antibodies were from BD PharMingen). Flow cytometry was carried out on a Becton Dickinson FACSCalibur, and data were analyzed by using the Becton Dickinson FACS convert 1.0 for Mac software.
Histology and Immunohistochemistry.
Mice were necropsied, and spleens, femurs, and sternums were fixed in 10% buffered formalin, included in paraffin, and then cut at 4 μm. Sections were stained with H&E according to standard protocols. For the dewaxing step, sections were heated for 1 h at 55°C, followed by rehydration steps through a graded ethanol series and distilled water, immersed in PBS, and then treated with 0.1% trypsin solution in Tris buffer for 30 min at 37°C. Endogenous peroxidase was blocked with 10% normal serum. CD43, B220, and VpreB1 (CD179a) were used as primary antimouse antibody (BD PharMingen). Secondary antibodies and diaminobenzidine were added according to the manufacturer’s instruction.
Ig Heavy Chain Gene Rearrangements.
A probe was designed and amplified in the JH4 fragment of the Ig heavy chain region on the mouse genomic, using the following primers: forward, 5′-TGAAGGATCTGCCAGAACTGAA-3′, and reverse, 5′-TGCAATGCTCAGAAAACTCCAT-3′.
Spleens of the transgenic and wild-type mice were dissociated between frosted slides in PBS, treated with ammonium chloride for the erythrocyte lysis, centrifuged, and resuspended in PBS. DNA was extracted from the spleen white cells and digested with EcoRI, StuI, BglII, BamHI, and HindIII. Digested DNA was blotted on a Hybond N+ membrane, hybridized with the JH4 probe radioactively labeled with 32P, then exposed to a PhosphorImager screen, and processed by using a Typhoon scanner.
Microarray Analysis.
mRNA and miRNA gene transcriptional profiling.
Total RNA isolation was performed with the TRIzol method (Invitrogen), according to the manufacturer’s instructions.
miRNA expression profiling.
RNA labeling and hybridization on miRNA microarray chips were performed as described (19). Briefly, 5 μg of total RNA from each sample was biotin-labeled by reverse transcription using 5′ biotin end-labeled random octomer oligo primer. Hybridization of biotin-labeled cDNA was carried out on a miRNA microarray chip (Ohio State University, Ver. 2.0), which contains 800 miRNA probes, including 245 human and 200 mouse miRNA genes, in quadruplicate. Hybridization signals were detected by biotin binding of a streptavidin–Alexa647 conjugate b using Axon Scanner 4000B (Axon Instruments, Union City, CA). The images were quantified by genepix 6.0 software (Axon Instruments).
mRNA expression profiling.
GeneChip Mouse genome 430 2.0 arrays (Affymetrix), containing probe sets for >45,000 characterized genes and expressed sequence tags, were used. Sample labeling and processing, GeneChip hybridization, and scanning were performed according to Affymetrix protocols. Briefly, double-stranded cDNA was synthesized from total RNA with the SuperScript Choice System (Invitrogen), with a T7 RNA polymerase promoter site added to its 3′ end (Genset, La Jolla, CA). Biotinylated cRNAs were generated from cDNAs in vitro and amplified by using the BioArray T7 RNA polymerase labeling kit (Enzo Diagnostics). After purification of cRNAs by the RNeasy mini kit (Qiagen, Hilden, Germany), 20 μg of cRNA was fragmented at 94°C for 35 min. Approximately 12.5 μg of fragmented cRNA was used in a 250-μl hybridization mixture containing herring-sperm DNA (0.1 mg/ml; Promega), plus bacterial and phage cRNA controls (1.5 pM BioB, 5 pM BioC, 25 pM BioD, and 100 pM Cre) to serve as internal controls for hybridization efficiency. Aliquots (200 μl) of the mixture were hybridized to arrays for 18 h at 45°C in a GeneChip Hybridization Oven 640 (Affymetrix). Each array was washed and stained with streptavidin–phycoerythrin (Invitrogen) and amplified with biotinylated anti-streptavidin antibody (Vector Laboratories) on the GeneChip Fluidics Station 450 (Affymetrix). Arrays were scanned with the GeneArray G7 scanner (Affymetrix) to obtain image and signal intensities.
Cytogenetics.
Femur bone marrow was flushed with RPMI medium 1640/20% FBS and collected into 5 ml of RPMI medium 1640/20% FBS with heparin 1%. Cells were grown and assessed for chromosomal deletions, translocations, inversions, and number of metaphases.
Supplementary Material
Acknowledgments
We thank Xin-An Pu for technical help with the creation of the transgenic mouse and Nicole White, Bryan McElwain, and Rick Meissner for technical assistance with the flow cytometry analysis. This study was supported by a National Cancer Institute grant (to C.M.C.).
Abbreviations
- H&E
hematoxylin/eosin
- miRNA
microRNA
- WBC
white blood cell count.
Footnotes
Conflict of interest statement: No conflicts declared.
References
- 1.Lee R. C., Feinbaum R. L., Ambros V. Cell. 1993;75:843–854. doi: 10.1016/0092-8674(93)90529-y. [DOI] [PubMed] [Google Scholar]
- 2.Nairz K., Rottig C., Rintelen F., Zdobnov E., Moser M., Hafen E. Dev. Biol. 2006;291:314–324. doi: 10.1016/j.ydbio.2005.11.047. [DOI] [PubMed] [Google Scholar]
- 3.Chen J. F., Mandel E. M., Thomson M. J., Wu Q., Callis T. E., Hammond S. M., Conlon F. L., Wang D.-Z. Nat. Genet. 2006;38:228–233. doi: 10.1038/ng1725. [DOI] [PMC free article] [PubMed] [Google Scholar]
- 4.Naguibneva I., Ameyar-Zazoua M., Polesskaya A., Ait-Si-Ali S., Groisman R., Souidi M., Cuvellier S., Harel-Bellan A. Nat. Cell Biol. 2006;8:278–284. doi: 10.1038/ncb1373. [DOI] [PubMed] [Google Scholar]
- 5.Esau C., Davis S., Murray S. F., Yu X. X., Pandey S. K., Pear M., Watts L., Booten S. L., Graham M., McKay R., et al. Cell Metab. 2006;3:87–98. doi: 10.1016/j.cmet.2006.01.005. [DOI] [PubMed] [Google Scholar]
- 6.Gauthier B. R., Wollheim C. B. Nat. Med. 2006;12:36–38. doi: 10.1038/nm0106-36. [DOI] [PubMed] [Google Scholar]
- 7.Chen C. Z., Li L., Lodish H. F., Bartel D. P. Science. 2004;303:83–86. doi: 10.1126/science.1091903. [DOI] [PubMed] [Google Scholar]
- 8.Chen C. Z., Lodish H. F. Semin. Immunol. 2005;17:155–165. doi: 10.1016/j.smim.2005.01.001. [DOI] [PubMed] [Google Scholar]
- 9.Ramkissoon S. H., Mainwaring L. A., Ogasawara Y., Keyvanfar K., Philip McCoy J., Jr, Sloand E. M., Kajigaya S., Young N. S. Leuk. Res. 2006;30:643–647. doi: 10.1016/j.leukres.2005.09.001. [DOI] [PubMed] [Google Scholar]
- 10.Calin G. A., Dumitru C. D., Shimizu M., Bichi R., Zupo S., Noch E., Aldler H., Rattan S., Keating M., Rai K. Proc. Natl. Acad. Sci. USA. 2002;99:15524–15529. doi: 10.1073/pnas.242606799. [DOI] [PMC free article] [PubMed] [Google Scholar]
- 11.Calin G. A., Liu C. G., Sevignani C., Ferracin M., Felli N., Dumitru C. D., Shimizu M., Cimmino A., Zupo S., Dono M., et al. Proc. Natl. Acad. Sci. USA. 2004;101:11755–11760. doi: 10.1073/pnas.0404432101. [DOI] [PMC free article] [PubMed] [Google Scholar]
- 12.Calin G. A., Sevignani C., Dumitru C. D., Hyslop T., Noch E., Yendamuri S., Shimizu M., Rattan S., Bullrich F., Negrini M., et al. Proc. Natl. Acad. Sci. USA. 2004;101:2999–3004. doi: 10.1073/pnas.0307323101. [DOI] [PMC free article] [PubMed] [Google Scholar]
- 13.Eis P. S., Tam W., Sun L., Chadburn A., Li Z., Gomez M. F., Lund E., Dahlberg J. E. Proc. Natl. Acad. Sci. USA. 2005;102:3627–3632. doi: 10.1073/pnas.0500613102. [DOI] [PMC free article] [PubMed] [Google Scholar]
- 14.Kluiver J., Poppema S., de Jong D., Blokzijl T., Harms G., Jacobs S., Kroesen B. J., van den Berg A. J. Pathol. 2005;207:243–249. doi: 10.1002/path.1825. [DOI] [PubMed] [Google Scholar]
- 15.Kluiver J., Haralambieva E., de Jong D., Blokzijl T., Jacobs S., Kroesen B. J., Poppema S., van den Berg A. Genes Chromosomes Cancer. 2006;45:147–153. doi: 10.1002/gcc.20273. [DOI] [PubMed] [Google Scholar]
- 16.Monticelli S., Ansel K. M., Xiao C., Socci N. D., Krichevsky A. M., Thai T. H., Rajewsky N., Marks D. S., Sander C., Rajewsky K., et al. Genome Biol. 2005;6:R71.1–15. doi: 10.1186/gb-2005-6-8-r71. [DOI] [PMC free article] [PubMed] [Google Scholar]
- 17.Volinia S., Calin G. A., Liu C. G., Ambs S., Cimmino A., Petrocca F., Visone R., Iorio M., Roldo C., Ferracin M., et al. Proc. Natl. Acad. Sci. USA. 2006;103:2257–2261. doi: 10.1073/pnas.0510565103. [DOI] [PMC free article] [PubMed] [Google Scholar]
- 18.Bichi R., Shinton S. A., Martin E. S., Koval A., Calin G. A., Cesari R., Russo G., Hardy R. R., Croce C. M. Proc. Natl. Acad. Sci. USA. 2002;99:6955–6960. doi: 10.1073/pnas.102181599. [DOI] [PMC free article] [PubMed] [Google Scholar]
- 19.Liu C. G., Calin G. A., Meloon B., Gamliel N., Sevignani C., Ferracin M., Dumitru C. D., Shimizu M., Zupo S., Dono M., Alder H., Bullrich F., et al. Proc. Natl. Acad. Sci. USA. 2004;101:9740–9744. doi: 10.1073/pnas.0403293101. [DOI] [PMC free article] [PubMed] [Google Scholar]
Associated Data
This section collects any data citations, data availability statements, or supplementary materials included in this article.


