Abstract
DNA is partly denatured in vitro by applying a force that mechanically separates the two strands of the double helix. Sudden reduction of the imposed displacement triggers spontaneous reannealing of the molecule. The corresponding force signals are measured by optical trapping interferometry for backward steps of various amplitudes and base sequence intervals. The measured signals frequently show plateaus of varying duration at discrete values that are dependent on the base sequence. Additional measurements are performed with proteins bound to the double helix. When the opening fork encounters such a protein during mechanical unzipping, force increases until the protein is ejected. This ejection induces fast release of tension and fast unzipping. Comparing our different measurements, we find that both DNA unzipping and the relaxation of tension in DNA are faster than the formation of the double helix.
INTRODUCTION
The field of single molecule force measurements on nucleic acids has significantly grown over the last decade (for recent reviews, see Allemand et al., 2003; Bockelmann, 2004; Bustamante et al., 2003). In a first configuration, introduced in 1992 (Smith et al., 1992), a single DNA molecule was stretched from its opposite ends. This way, the elastic properties of double-stranded DNA (dsDNA) and single-stranded DNA (ssDNA) have been studied extensively, using optical tweezers (Smith et al., 1996; Wang et al., 1997), magnetic tweezers (Allemand et al., 1998; Strick et al., 1996), glass microneedles (Cluzel et al., 1996; Léger et al., 1999), or atomic-force microscopy (Clausen-Schaumann et al., 2000). It is also possible to separately grasp the two strands at one extremity of the double helix and to pull the molecule open by mechanical force. In this case, a sequence-dependent force has been measured with glass microneedles (Bockelmann et al., 1997, 1998; Essevaz-Roulet et al., 1997), optical tweezers (Bockelmann et al., 2002; Koch et al., 2002; Thomen et al., 2002), atomic-force microscopy (Rief et al., 1999), and magnetic beads (Danilowicz et al., 2003). Sequence-dependent signals have also been observed in recent stretching experiments on RNA (Harlepp et al., 2003; Liphardt et al., 2001; Onoa et al., 2003). The unzipping configuration can also be used to investigate DNA protein interactions. Binding of an enzyme to the dsDNA induces a peak in the force curve measured during unzipping, because it transiently blocks the opening fork (Koch et al., 2002; Koch and Wang, 2003; Thomen et al., 2000). The single molecule experiments are complemented by theoretical physics studies of the elastic properties of DNA (Bouchiat and Mézard, 1998; Lebrun and Lavery, 1996; Marko and Siggia, 1995; Montanari and Mézard, 2001), and the opening and closing of the double helix (Cocco et al., 2001, 2002; Gerland et al., 2001; Lubensky and Nelson, 2000, 2002, Thompson and Siggia, 1995; Viovy et al., 1994). The removal of DNA-bound proteins by DNA twisting has also been investigated theoretically (Sarkar and Marko, 2001).
The folding of polynucleotides has been subject to intense investigation over decades. In this field, the dynamics of the helix-coil transition of the DNA molecule recently received particular attention when two different optical techniques, fluorescence correlation spectroscopy and measurement of absorbance changes caused by laser-induced temperature jumps, have been conducted on synthetic DNA oligonucleotide duplexes (Altan-Bonnet et al., 2003; Ansari et al., 2001; Goddard et al., 2000; Kuznetsov et al., 2001).
In this article, we report time-resolved force measurements of the dynamics of the spontaneous refolding of a long λ-phage DNA molecule after mechanical unzipping. Subsequent to backward steps in the imposed displacement, force signals are measured with an optical trapping interferometer. This way the dynamics of the formation of the double helix is studied for different intervals in the base sequence. A series of measurements with 8-μm steps corresponds to repeatedly closing the same interval of ∼8000 bp of the DNA sequence and shows reproducible force signals. In contrast, force curves measured after steps of 0.5–4 μm frequently exhibit plateaus of varying duration at sequence-dependent force values. We complement the studies of the DNA closing dynamics by measurements that provide access to a dynamical process that involves the relaxation of tension in DNA and DNA unzipping. A single DNA molecule is unzipped with a protein specifically bound to the double helix. When the opening fork encounters the bound protein, force increases until the protein is ejected. This ejection induces a sudden release in tension and triggers unzipping. Comparing the different experimental results, we find that DNA unzipping and the relaxation of tension in DNA are both faster than DNA rezipping.
MATERIALS AND METHODS
Unzipping DNA and single molecule force measurement
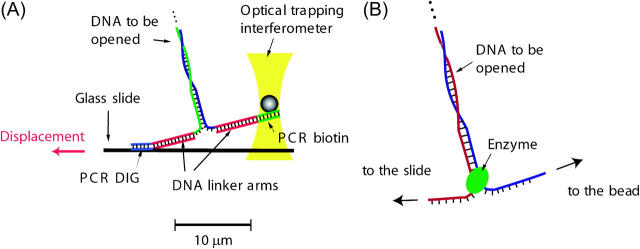
Our single molecule approach to study the opening and closing dynamics of a long DNA double helix is illustrated in Fig. 1. The measurements are performed in vitro, with a DNA construction anchored between a glass microscope slide and a silica bead. The bead is held in an optical trap and the slide is laterally displaced by a piezo translation stage. Force is derived from an interferometric measurement of the bead position in the trap. The trapping interferometer and its calibration, the experimental configuration, the preparation of the DNA molecular constructs, and the functionalization of slide and bead surfaces have been described elsewhere (Bockelmann et al., 2002).
FIGURE 1.
Schematic representation of the single molecule configurations used in this work. (A) Both strands of the DNA to be opened, the 48,502-basepair molecule of the λ-bacteriophage, are prolongated by DNA linker arms (7200 bp each) and DNA fragments obtained by polymerase chain reaction (PCR) that contain multiple digoxigenin (DIG) and biotin attachment sites. This way one strand of the double helix is attached to a streptavidin-coated silica bead (1 μm in diameter) and the other strand to an anti-DIG-coated glass slide. The slide is placed on an inverted microscope, and the bead is held a few microns above the glass slide in aqueous solution (1× PBS buffer at neutral pH) by a gradient optical trap. The double helix is mechanically opened (or unzipped) by translating the slide with a piezo stage, while keeping the position of the trap unchanged. In a first type of measurement, spontaneous refolding of the double-helical structure is triggered by a sudden backward displacement of the stage. In a second type of measurement the sudden event is not induced by an externally imposed displacement step but by a sudden ejection of an enzyme. In this case, illustrated in B, unzipping becomes blocked when the opening fork touches a protein specifically bound to the DNA to be opened. With displacement continuing, elastic energy builds up in the single-stranded parts and the linker arms of the construct until the protein is ejected. This ejection triggers strain relaxation and unzipping. The force signals are obtained by time-dependent interferometric measurement of the bead position in the optical trap.
Unzipping with an enzyme bound to the DNA molecule
We have chosen the EcoRV enzyme, a well-studied type-II endonuclease that specifically recognizes the base sequence GATATC. This sequence occurs several times in the DNA of λ-phage but is absent in the linker arms of our molecular construct. To delay enzymatic DNA cleavage, we use Ca2+ rather than Mg2+ ions. It is known that calcium ions allow for specific binding of EcoRV to its recognition site but reduce the cleavage rate by at least five orders of magnitude compared to standard incubation with Mg2+ ions (Vipond and Halford, 1995). Before the force measurement, we incubate an anti-digoxigenin-coated glass slide with the DNA construct and streptavidin-coated silica beads in 150 μl of Buffer 1 (50 mM Tris pH8, 100 mM NaCl, 0.1 mM EDTA, 100 μg/μl BSA, and 5 mM CaCl2). After selection of a correctly attached bead we introduce EcoRV enzymes: 0.2 μl of a commercial EcoRV solution (Pharmacia, Amersham Biosciences, Orsay, France) are 10-fold diluted in Buffer 2 (10 mM Tris pH 8, 50 mM KCl, 0.1 mM EDTA, 1 mM DTT, and 200 μg/μl BSA). We take 0.2 μl of this dilution, add 20 μl of Buffer 1, and directly inject this solution.
We systematically tried repeated go/return cycles, recording force as a function of time during opening and closing of the double helix. In these measurements, rupture of the molecular construct occurs quite frequently and is attributed to remaining EcoRV digestion of the λ-phage DNA to be opened. Protein-induced peaks have not been observed in closing, but upon reopening new peaks sometimes do appear. The different EcoRV recognition sites present in the λ-phage DNA molecule are only partially occupied, indicating that the enzyme concentration was not saturating in these measurements.
Data acquisition and time resolution
For the measurement of the force signal after a sudden return in imposed displacement, we perform data acquisition at a rate of 10,240 Hz. This gives a submillisecond time-resolution in the measured force and position. The piezo translation stage is operated in feedback with the position measurement; the settling time of the system is 70 ms for a 1-μm step. The measured time-dependence of the drop in force simply reflects this response of the displacement stage. In these refolding experiments, we observe no force signals belonging to a submillisecond timescale. Therefore, the raw data is time-averaged by calculating a sliding average over 50 data points, whenever noise reduction appears useful (specified in the figure captions). The influence of viscous drag on the bead is negligible, as can be seen by the absence of step-induced force signals when the tension on the molecular construct is released and the double helix is closed (Fig. 2, t > 19 s).
FIGURE 2.
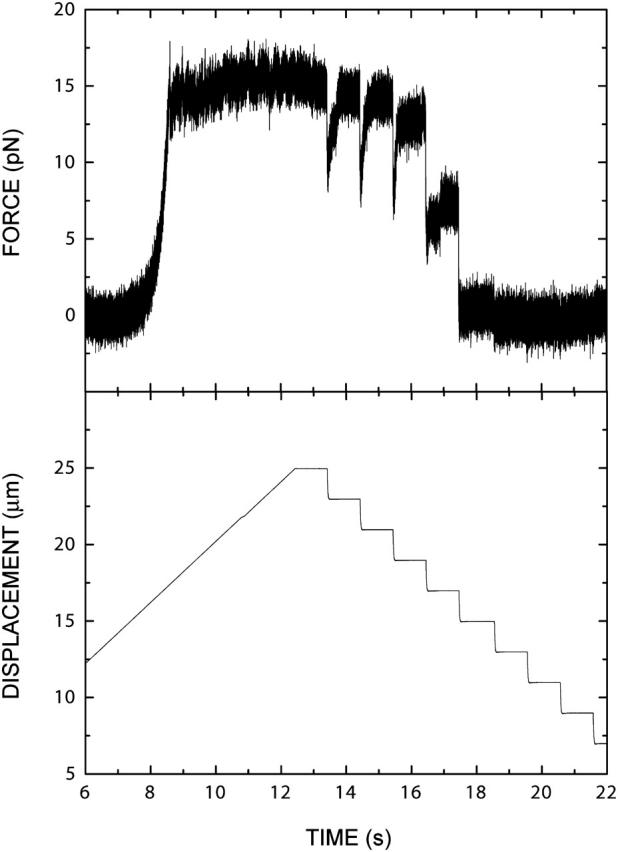
Processive opening and stepwise reclosing of a single DNA double helix. The lateral displacement of the translation stage (bottom) and the force (top) are measured as a function of time with an acquisition rate of 10,240 Hz.
EXPERIMENTAL RESULTS
The single molecule configurations used in this work are presented in Fig. 1. The measurements are performed in vitro, with a DNA construction anchored between a glass microscope slide and a silica bead. The bead is held in an optical trap and the slide is laterally displaced by a piezo translation stage. Force is derived from an interferometric measurement of the bead position in the trap.
As shown in Fig. 2, the measured force F (top) starts to rise sizably with increasing displacement (bottom), when the linker arms of the DNA construct are stretched to an amount close to their crystallographic length. At ∼10–15 pN the force ceases to increase, the regime of increasing elastic DNA deformation changes into a regime of mechanical unzipping where the two strands of the DNA molecule separate, and the opening fork progresses through the genomic sequence with ∼1000 bp/μm of additional displacement. In this unzipping regime (here roughly between 8 and 12 s) the force varies rapidly with a typical amplitude of 1–2 pN. This force variation is due to the different pairing and stacking energies of the DNA and thus reflects the base sequence of the molecule to be opened (Bockelmann et al., 1997; Essevaz-Roulet et al., 1997).
After opening ∼7500 bp at a velocity of 2 μm/s, displacement is stopped for a second, before we move the stage back by a sequence of 2-μm steps. Each of the first three backward steps induces the reclosing of ∼2000 bp. The signal measured after such a step consists of a drop in force of ∼5 pN followed by a recovery. The force recovery seems to be completed within the 1-s interval between successive steps. We attribute the force drop to the release in tension induced by the backward step and the reincrease to the spontaneous refolding of the double helix. After the fourth step, the force drops and reincreases but finally remains well below the level observed in the unzipping regime. This indicates that some opening of basepairs occurs even below 10 pN. Comparison to calculation indicates that the corresponding states involve only a few opened basepairs.
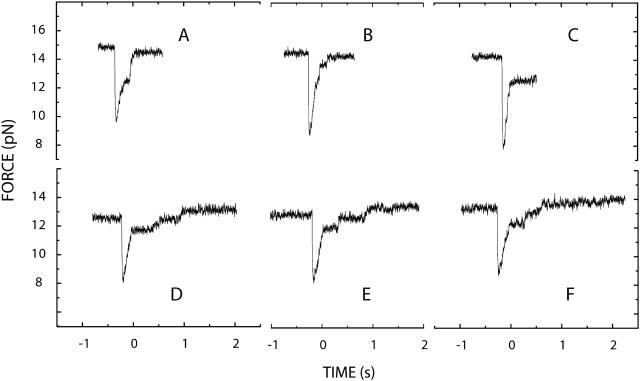
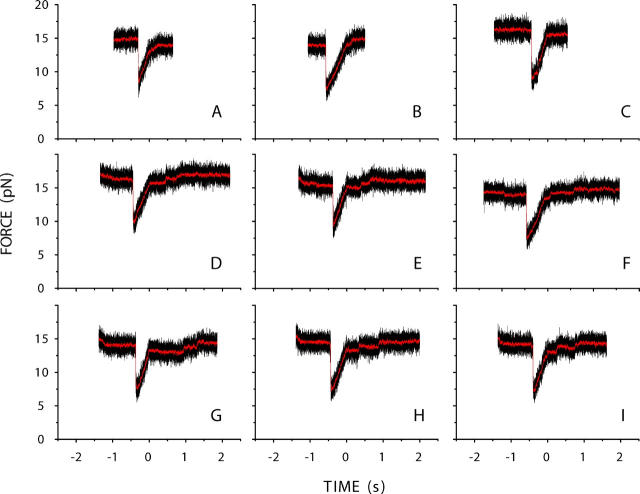
In Fig. 3 six force signals measured for 2-μm steps are presented. Traces A–C are the first three steps of Fig. 2. Refolding involves different base sequence intervals in this case. In contrast, traces D–F have been measured repeatedly on the same sequence interval, by opening and reclosing a molecular construct over the same displacement range. Series A–C shows more variability than series D–F. This is attributed to a sequence dependence of the refolding. Plateaus appear in the time evolution, indicative of transient delays in refolding. The fact that the force levels of these plateaus are reproducible in series D–F but not in A–C suggests that the observed delays involve formation of a sequence-dependent secondary structure. The duration of the delays varies, even within series D–F. In Fig. 4, we present similar results for 4-μm steps.
FIGURE 3.
Force signals measured after 2-μm steps. Series A–C has been measured by stepwise reclosing of a DNA molecule over different sequence intervals. Series D–F has been obtained by repeated opening and reclosing of a molecule over the same sequence interval. Several plateaus appear in the force signal during the time-dependent reincrease in force. In series A–C these plateaus appear at different force levels, whereas in the three measurements of the series D–F two plateaus of reproducible force level appear before the force reaches its final level. A sliding average of the raw data is presented.
FIGURE 4.
Force signals measured after 4-μm steps. Series A–C has been measured by stepwise reclosing of a DNA molecule over different sequence intervals. Series D–I has been obtained by repeated opening and reclosing of a molecule over the same sequence interval. For the series D–I two plateaus with force levels that are reproducible among the six measurements are observed before the force reaches its final level. The fact that the force levels of the plateaus are reproducible in series D–I, but not in series A–C, suggests that they are caused by a sequence-dependent effect. Raw data (black) and a sliding average (red) are presented.
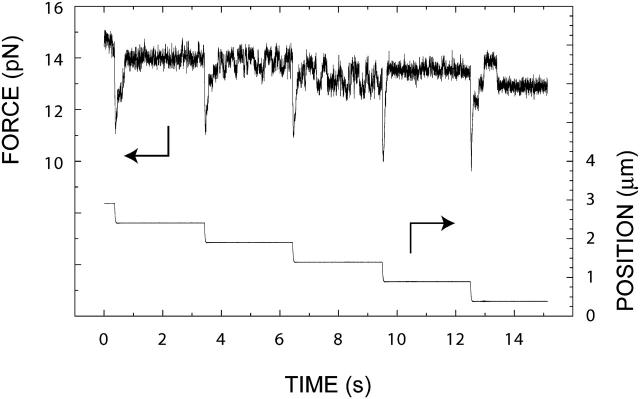
The sequence-dependent plateaus are related to the force-flipping observed close to thermal equilibrium in unzipping DNA (Bockelmann et al., 2002) and in opening RNA hairpin structures (Liphardt et al., 2001). This is illustrated in Fig. 5. A force signal corresponding to a series of 0.5-μm displacement steps is shown, corresponding to the refolding of successive base sequence intervals. After the first step, three folding intermediates (the second is more pronounced than the other two) are observed before the force stabilizes at ∼14 pN. After the second step, two intermediates are observed and at the final position, force flips between two levels. After the third step, similar flipping appears. After the fourth step, refolding proceeds without significant pausing toward a single final force value. After the fifth step, the measured force jumps between three discrete values. The first, low force value is attributed to a nonequilibrium state, accessed as a folding transient, whereas the second and third force values remain involved in force flipping at equilibrium.
FIGURE 5.
Reclosing a DNA molecule by a series of 0.5-μm steps. The lateral displacement of the translation stage (bottom) and the force (top) are measured as a function of time with an acquisition rate of 10,240 Hz. A sliding average of the raw data is presented.
The amplitude of the force drop and the characteristic time the DNA needs to complete refolding increase with step size (Fig. 6). We derive a folding time from the force signals by subtracting the delays caused by the plateaus. Plateaus are frequently observed for steps of 0.5, 1, 2, and 4 μm. We also performed a series of 12 steps of 8-μm size, repeatedly refolding the same interval of 8000 bp. The final state after refolding is the same for Fig. 3, D–F, Fig. 4, D–I, and this 8-μm series. Interestingly, for the 8-μm steps we reproducibly measure a signal without plateaus, close to the example shown in Fig. 6.
FIGURE 6.
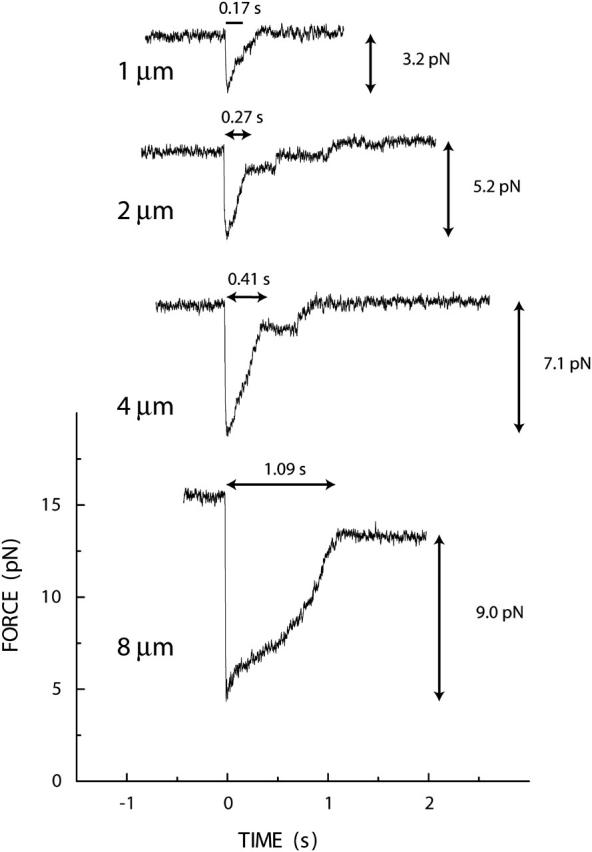
Force signals after steps of various sizes. The characteristic refolding time is obtained by extrapolating the initial phase of the force recovery to the final force level, to subtract the pausing intervals. A sliding average of the raw data is presented.
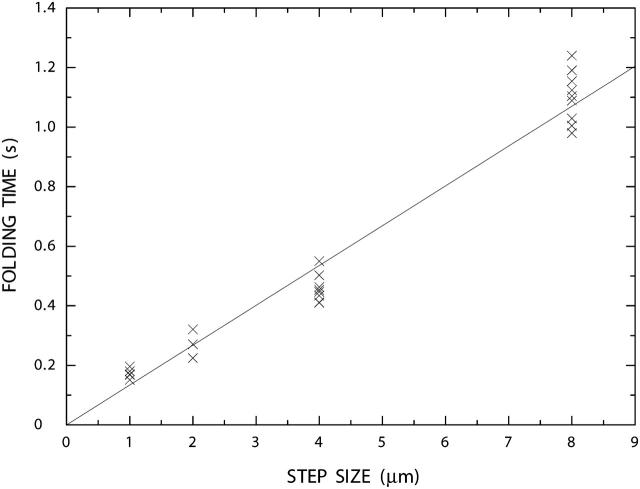
The analysis of 29 different backward steps indicates a linear dependence of the folding time on step size (Fig. 7). From a linear fit through the origin, we can estimate that, in our measurements and apart from pausing, the double helix refolds with an average rate of ∼7500 basepairs per second.
FIGURE 7.
Characteristic folding time of the double helix as a function of step size. A slope of b = 0.134 s/μm is obtained from a least-square fit (y = bx) of the folding times derived from the force signals measured after 29 different backward steps. As a backward displacement by 1 μm corresponds to the closing of ∼1000 bp in average, we obtain a folding rate of ∼7500 bp/s. The steps involve intervals of different DNA base sequences.
How does this closing dynamics compare to the characteristic time required to relax the stretched double- and single-stranded parts of the construct and how does it compare to the unzipping dynamics? The shape of the sudden decrease in force induced by a backward step in displacement is simply given by the measured time-dependence of the displacement, indicating that the relaxation of the stretched strands is clearly faster than the time-response of our piezo stage (see Materials and Methods). We also performed forward steps in displacement, the resulting force increase again simply reflecting the time-dependent motion of the translation stage. Because the settling time of the stage (∼70 ms for a 1-μm step) is shorter than the characteristic times observed in the DNA rezipping case, this already indicates that the relaxation of the stretched molecule and DNA unzipping are faster than the formation of the double-helical structure.
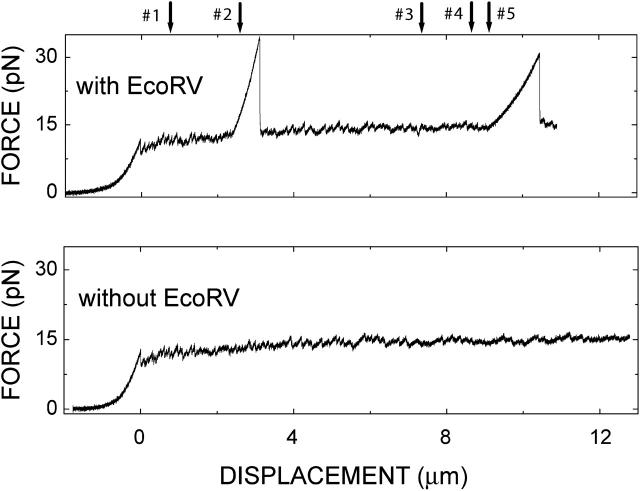
To create even shorter triggering events, we performed single molecule studies with EcoRV restriction endonucleases attached to the DNA in the unzipping configuration. In this case, the protein binding is used to transiently block the advancement of the opening fork during unzipping, as illustrated in Fig. 1 B. As shown by the comparison presented in Fig. 8, binding of the EcoRV enzyme induces sizeable triangular peaks that superpose to the force versus displacement curve measured without enzyme.
FIGURE 8.
Force versus displacement curve measured in unzipping DNA in the presence (top) and absence (bottom) of EcoRV enzymes. The five restriction sites present in this part of the λ-phage DNA are indicated; enzymes occupied sites 2 and 5 in the top curve. Displacement velocity was 0.5 μm/s.
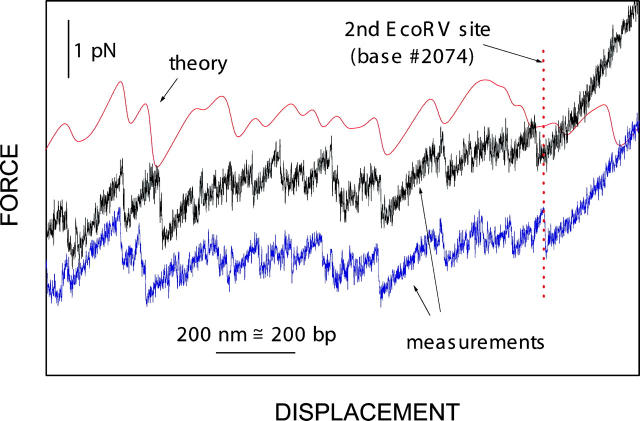
The position of the additional peaks corresponds to the EcoRV recognition sites. This is revealed by comparing the sequence-dependent force signal with calculations, as shown in Fig. 9. For the EcoRV enzyme specifically bound to the DNA to be opened, we observe an average peak height of ∼15 pN (see Appendix). The spatial extension of the peaks is not given by the size of the enzyme, but by the extension of the total system (bead displacement in the trap plus elasticities of double-stranded linker arms and single-stranded parts of the molecular construction) caused by the increase in force between the unzipping level and the level where protein ejection occurs.
FIGURE 9.
Detail of the force versus displacement curve in the vicinity of the second EcoRV recognition site. Two curves (bottom) measured with an enzyme bound to this second recognition site are presented together with a curve (top) calculated for DNA unzipping without bound enzyme under the assumption of local thermal equilibrium. The three curves are vertically displaced for clarity. The theoretical description is described elsewhere (Bockelmann et al., 2002). Although for the 500 nm/s displacement velocity used here the agreement between experiment and theory is worse than for slower displacement, we can still correlate the rough features in the force signal to the DNA base sequence. The dotted vertical line at the right of the figure indicates the displacement where the calculated number of opened basepairs is equal to 2074, i.e., where the opening fork is expected to become blocked by an enzyme specifically bound to this site. Indeed, at this displacement starts the additional enzyme-induced peak in the measured curve, which indicates that the blocking of the opening fork reproducibly occurs at the recognition sites of the enzyme.
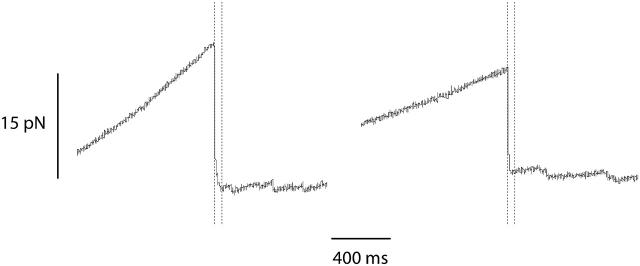
When the protein is removed the opening fork can suddenly advance, and the additional elastic energy accumulated during the rising part of the enzyme-induced sawtooth peak is used to separate the two strands of the DNA double helix. In Fig. 10, two force drops caused by protein ejection are shown in detail. Already 50 ms after the ejection event, a force signal characteristic to DNA unzipping close to local thermal equilibrium is recovered, i.e., a signal composed of a succession of sawtooth-like features. This suggests that no memory of the protein binding is left beyond this time delay.
FIGURE 10.
Detail of two force signals close to the moment of protein ejection. Two dotted vertical lines are superposed to each curve. The first line indicates the moment of protein ejection and the shift between the two lines corresponds to a time delay of 50 ms. Before the ejection event, a smooth gradual increase in force is observed, attributed to an increase in elastic tension induced by the continuing displacement that stretches the molecular construct when the opening fork is blocked by a bound protein. Ejection of this protein triggers sudden release in tension and a rapid advance of the opening fork. Soon afterwards (after ∼50 ms on the left graph, less on the right graph) a characteristic unzipping signal, consisting of a series of sawtooth features, is recovered.
The number of basepairs opened directly after protein ejection can be estimated from the size in displacement of the protein-induced peak. With 1-μm displacement corresponding to opening 1000 basepairs in average, we thus obtain 1000 bp and 1500 bp for the examples presented on the left and right of Fig. 10. The length of the triggering event, namely the duration of the protein ejection itself, can safely be neglected on the millisecond-timescale considered here. Our measurements thus provide an upper bound of the time needed for the relaxation of the DNA extension and the unzipping; even so, we cannot separate the two contributions. This upper bound in duration corresponds to a lower bound in the rate, and we find that in the present case both the relaxation in extension and the DNA unzipping proceed with effective rates exceeding 1000 bp/50 ms = 20,000 bp/s = 20 μm/s.
THEORETICAL DESCRIPTION
We have extended an earlier theoretical description to nonequilibrium, to describe the dynamics of DNA folding. The probability Pj(t) that the double helix exhibits j opened basepairs at instant t is described by a master equation limited to nearest-neighbors transitions,
 |
(1) |
We assume that the transition rates al, m are given by the expression
 |
(2) |
where τ is a relaxation time and Ej denotes the total energy of the system when j DNA basepairs are opened. The energy Ej is the sum of the sequence-dependent pairing and stacking energies of the double-helical part and the elastic contributions of molecular construct and optical trap. The value Ej is calculated in the frame of equilibrium statistical physics, as described elsewhere (Bockelmann et al., 2002). Eq. 2 is the simplest Ansatz that obeys detailed balance in the canonical ensemble.
Equation 1 is solved numerically using discrete time steps and taking the equilibrium distribution
 |
as initial condition. Examples for this equilibrium distribution are presented in Figs. 20 and 21 of Bockelmann et al. (2002). From the time-dependent distribution function, we calculate an average number of opened basepairs and an average force, according to
 |
(3) |
 |
(4) |
The forces Fj are obtained in the frame of equilibrium statistical mechanics (compare to Figs. 20 and 21 of Bockelmann et al., 2002).
In Fig. 11, theoretical results of the time dependences of  and
and  are presented, for step sizes of 8, 4, 2, 1, and 0.5 μm. We have assumed the same final state for all step sizes (the position of the displacement stage after the step is always given by x0 = 16.24 μm).
FIGURE 11.
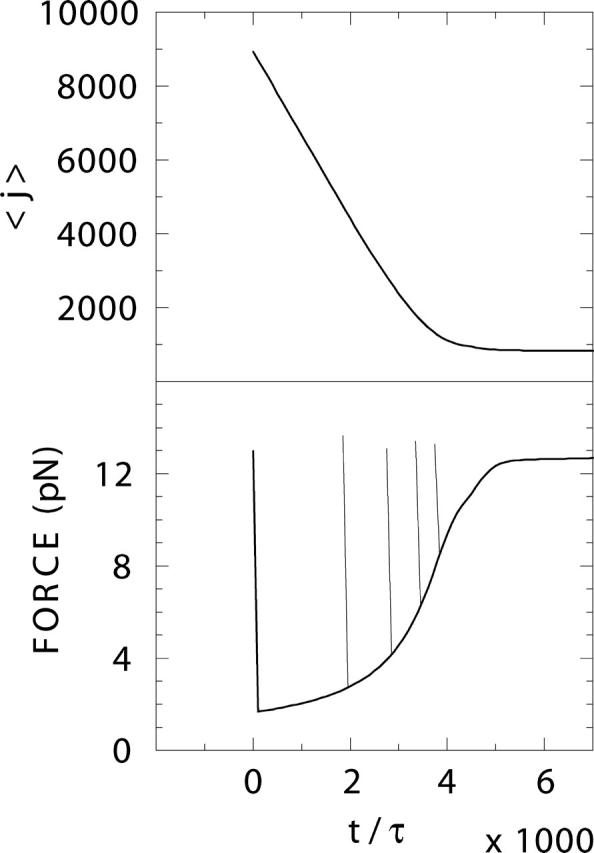
Time-dependence of average force (bottom) and average number of opened basepairs  (top), calculated with the master equation Eq. 1. A dimensionless time axis is presented; the parameter τ is a common time for opening and closing of one basepair. Displacement steps of 8, 4, 2, 1, or 0.5 μm are assumed to trigger refolding of the double helix. We systematically delayed the step with decreasing step size and thus obtain a common curve for the time dependence of the average force after the step (same for the time-dependence of
  ). The force corresponding to the initial state before the step (given by the top of the respective vertical lines) is different for the different steps, as a common final position of the stage after the step has been assumed.
DISCUSSION
From the series of measurements done after a sudden return in displacement, we estimated that the double helix refolds with an average rate of ∼7500 basepairs per second, if we do not account for delays induced by pausing observed in our measurements. This closing rate of 7500 bp/s corresponds to τ = 3 × 10⁻⁴ s. Closing times in the 10−4 s range have been obtained in fluorescence energy transfer (FRET) measurements of thermal fluctuations of DNA hairpins in solution (Goddard et al., 2000). Despite this agreement in order of magnitude we should note the differences between our force measurements and the FRET measurements. In our case the DNA and the opening/closing sequences are much longer and the molecule is attached and acted on by a time-dependent pulling force. The force measurements and the FRET measurements thus provide complementary information and a quantitative comparison of the results is not appropriate.
The dynamical measurements triggered by the ejection of bound EcoRV enzymes indicate that in our configuration both the relaxation in extension and the DNA unzipping proceed with an effective rate above 20,000 bp/s. This lower bound clearly exceeds the characteristic closing rate of 7500 bp/s and the comparison thus indicates that rezipping is the rate-limiting step for the force recovery after a sudden backward step in displacement.
The signals measured after a sudden return in displacement frequently show plateaus of varying duration at discrete values. The fact that the force levels of the plateaus are reproducible for returns over the same base sequence interval, whereas the levels differ for steps over different sequence intervals, shows that the plateaus are due to a sequence-dependent effect. We tentatively attribute them to a transient formation of secondary structure in the relaxed single strands or to a transient formation of bubbles (rotational constraints and friction could delay the elimination of such intermediates).
The experimental observation of sequence-dependent pausing is not born out by the calculation. It is not clear whether this is simply due to the fact that we calculate the time dependence of an average force, whereas each of the single molecule measurements corresponds to one particular realization from the statistical ensemble of possible refolding paths. From this point of view, the sequence-dependent pausing is related to the force flipping observed close to thermal equilibrium in unzipping DNA (Bockelmann et al., 2002) and in opening RNA hairpin structures (Liphardt et al., 2001). Force flips also do not show up in the calculations of the equilibrium average force and are attributed to transitions between different states involved in the time-averaging of the molecular system.
Qualitative agreement exists between the measured and the calculated force signals regarding the following points. The amplitude of the drop in force and the folding time decrease with decreasing step size. The curvature of the force versus time curve decreases continuously and changes sign from positive to negative during the refolding. The calculated time dependence of  (Fig.11, top) is roughly linear during almost the whole refolding process, in accordance with the linear increase of the measured folding time with step size (Fig. 7).
Despite these qualitative agreements, the calculated force signals do not reproduce the shape of the measured curves. It is not possible to fit the whole shape of the measured signal, since in the calculated curves the extension of the initial low force part is typically too long when the shape of the final increase in force fits to the measurement. The present theoretical description is thus insufficient to quantitatively account for the experimental observations. In particular, we have neglected possible sequence-dependence of the transition rates (all opening and closing transitions are described by one relaxation time), DNA structures that involve more than one opening fork (bubbles, hairpins, etc.), and effects associated with the rotation of the double-stranded part (like twist propagation and viscous friction; see Nelson, 1999; Thomen et al., 2002). We also assumed that the elastic response of DNA and the optical trap is fast compared to the opening/closing dynamics (use of the equilibrium energies Ej). These assumptions are made for the sake of simplicity, but otherwise are probably not all well justified with respect to the real experiment.
CONCLUDING REMARKS
The dynamics of the DNA helix-coil transition has been studied experimentally by single molecule force measurements. Measurements involving sudden returns in displacement and providing access to the dynamics after mechanical opening of the double helix are complemented by unzipping measurements with an enzyme specifically bound to the DNA to be opened. The comparison of the experiments shows that the relaxation in extension of our DNA construction is faster than rezipping. The extension corresponding to a force difference of ∼15 pN relaxes within 50 ms, whereas the rezipping of sequences of 1000–8000 basepairs takes between 150 ms and 1.2 s.
Driving the system out of equilibrium by a sudden return in displacement also allowed us to observe sequence-dependent plateaus and thus to reveal resonances that are not observed close to equilibrium. The corresponding time-evolution involves both equilibrium and nonequilibrium states; the time-dependent occupation of these states appears to be stochastic. The single molecule force measurement allows one to visualize the predominant states and transitions of the different individual folding pathways. This way, it can help to reveal part of the molecular dynamics, within the limits of the experimental resolution in space and time (here a few nanometers and a few milliseconds, respectively).
Acknowledgments
We thank Lucile Loiseau for assistance in the EcoRV measurements.
This work has been supported by the Centre Nationale de la Recherche Scientifique, the Ministère de l'Education Nationale de la Recherche et de la Technologie, and the Universities Paris VI and Paris VII.
APPENDIX: HEIGHT OF THE ENZYME-INDUCED PEAKS
Koch et al. (2002) and Koch and Wang (2003) performed unzipping measurements with BsoBI, XhoI, and EcoRI. They found for the three different DNA binding enzymes that the heights of the additional force peaks increase linearly with the logarithm of the loading rate. A logarithmic dependence of force on loading rate has been predicted theoretically for a regime of high loading rate, whereas for slow loading, bond strength is expected to increase only as a weak power of loading rate (Evans and Ritchie, 1997). In our measurements with EcoRV, we observed a broad distribution of peak heights, but could not simply attribute this variability to a dependence on loading rate. Employing displacement velocities between 0.5 and 5 μm/s, we measured peak heights between 10 and 30 pN, an interval that overlaps with the range reported by Koch et al. (2002) and Koch and Wang (2003) for BsoBI and loading rates below 50 pN/s. The loading rates corresponding to the two enzyme-induced peaks of Fig. 8 are 14 pN/s and 6 pN/s, respectively.
References
- Allemand, J. F., D. Bensimon, R. Lavery, and V. Croquette. 1998. Stretched and overwound DNA forms a Pauling-like structure with exposed bases. Proc. Natl. Acad. Sci. USA. 95:14152–14157. [DOI] [PMC free article] [PubMed] [Google Scholar]
- Allemand, J. F., D. Bensimon, and V. Croquette. 2003. Stretching DNA and RNA to probe their interaction with proteins. Curr. Opin. Struct. Biol. 13:266–274. [DOI] [PubMed] [Google Scholar]
- Altan-Bonnet, G., A. Libchaber, and O. Krichevsky. 2003. Bubble dynamics in double-stranded DNA. Phys. Rev. Lett. 90:138101. [DOI] [PubMed] [Google Scholar]
- Ansari, A., S. V. Kuznetsov, and Y. Shen. 2001. Configurational diffusion down a folding funnel describes the dynamics of DNA hairpins. Proc. Natl. Acad. Sci. USA. 98:7771–7776. [DOI] [PMC free article] [PubMed] [Google Scholar]
- Bockelmann, U., B. Essevaz-Roulet, and F. Heslot. 1997. Molecular stick-slip motion revealed by opening DNA with picoNewtons forces. Phys. Rev. Lett. 79:4489–4492. [Google Scholar]
- Bockelmann, U., B. Essevaz-Roulet, and F. Heslot. 1998. DNA strand separation studied by single molecule force measurement. Phys. Rev. E. 58:2386–2394. [Google Scholar]
- Bockelmann, U., Ph. Thomen, B. Essevaz-Roulet, V. Viasnoff, and F. Heslot. 2002. Unzipping DNA with optical tweezers: high sequence sensitivity and force flips. Biophys. J. 82:1537–1553. [DOI] [PMC free article] [PubMed] [Google Scholar]
- Bockelmann, U. 2004. Single molecule manipulation of nucleic acids. Curr. Opin. Struct. Biol. 14:368–373. [DOI] [PubMed] [Google Scholar]
- Bouchiat, C., and M. Mézard. 1998. Elasticity theory of a supercoiled DNA molecule. Phys. Rev. Lett. 80:1556–1559. [Google Scholar]
- Bustamante, C., Z. Bryant, and S. Smith. 2003. Ten years of tension: single molecule DNA mechanics. Nature. 421:423–427. [DOI] [PubMed] [Google Scholar]
- Clausen-Schaumann, H., M. Rief, C. Tolksdorf, and H. E. Gaub. 2000. Mechanical stability of single DNA molecules. Biophys. J. 78:1997–2007. [DOI] [PMC free article] [PubMed] [Google Scholar]
- Cluzel, P. H., A. Lebrun, C. Heller, R. Lavery, J.-L. Viovy, D. Chatenay, and F. Caron. 1996. DNA: an extensible molecule. Science. 271:792–794. [DOI] [PubMed] [Google Scholar]
- Cocco, S., R. Monasson, and J. F. Marko. 2001. Force and kinetic barriers to unzipping of the DNA double helix. Proc. Natl. Acad. Sci. USA. 98:8608–8613. [DOI] [PMC free article] [PubMed] [Google Scholar]
- Cocco, S., R. Monasson, and J. F. Marko. 2002. Unzipping dynamics of long DNAs. Phys. Rev. E. 66:051914-1–051914-11. [DOI] [PubMed] [Google Scholar]
- Danilowicz, C., V. W. Coljee, C. Bouzigues, D. Lubensky, D. R. Nelson, and M. Prentiss. 2003. DNA unzipped under a constant force exhibits multiple metastable intermediates. Proc. Natl. Acad. Sci. USA. 100:1694–1699. [DOI] [PMC free article] [PubMed] [Google Scholar]
- Essevaz-Roulet, B., U. Bockelmann, and F. Heslot. 1997. Mechanical separation of the complementary strands of DNA. Proc. Natl. Acad. Sci. USA. 94:11935–11940. [DOI] [PMC free article] [PubMed] [Google Scholar]
- Evans, E., and K. Ritchie. 1997. Dynamic strength of molecular adhesion bonds. Biophys. J. 72:1541–1555. [DOI] [PMC free article] [PubMed] [Google Scholar]
- Gerland, U., R. Bundschuh, and T. Hwa. 2001. Force-induced denaturation of RNA. Biophys. J. 81:1324–1332. [DOI] [PMC free article] [PubMed] [Google Scholar]
- Goddard, N. L., G. Bonnet, O. Krichevsky, and A. Libchaber. 2000. Sequence-dependent rigidity of single-stranded DNA. Phys. Rev. Lett. 85:2400–2403. [DOI] [PubMed] [Google Scholar]
- Harlepp, S., T. Marchal, J. Robert, J. F. Léger, A. Xayaphoummine, H. Isambert, and D. Chatenay. 2003. Probing complex RNA structures by mechanical force. Eur. Phys. J. E. 12:605–615. [DOI] [PubMed] [Google Scholar]
- Koch, S. J., A. Shundrovsky, B. C. Jantzen, and M. D. Wang. 2002. Probing protein-DNA interactions by unzipping a single DNA double helix. Biophys. J. 83:1098–1105. [DOI] [PMC free article] [PubMed] [Google Scholar]
- Koch, S. J., and M. D. Wang. 2003. Dynamic force spectroscopy of protein-DNA interactions by unzipping DNA. Phys. Rev. Lett. 91:028103. [DOI] [PubMed] [Google Scholar]
- Kuznetsov, S. V., Y. Shen, A. S. Benight and A. Ansari. 2001. A semiflexible polymer model applied to loop formation in DNA hairpins. Biophys. J. 81:2864–2875. [DOI] [PMC free article] [PubMed] [Google Scholar]
- Lebrun, A., and R. Lavery. 1996. Modelling extreme deformations of DNA. Nucleic Acids Res. 24:2260–2267. [DOI] [PMC free article] [PubMed] [Google Scholar]
- Léger, J. F., G. Romano, A. Sarkar, J. Robert, L. Bourdieu, D. Chatenay, and J. F. Marko. 1999. Structural transitions of a twisted and stretched DNA molecule. Phys. Rev. Lett. 83:1066–1069. [Google Scholar]
- Liphardt, J., B. Onoa, S. B. Smith, I. Tinoco, Jr., and C. Bustamante. 2001. Reversible unfolding of single RNA molecules by mechanical force. Science. 292:733–737. [DOI] [PubMed] [Google Scholar]
- Lubensky, D. K., and D. R. Nelson. 2000. Pulling pinned polymers and unzipping DNA. Phys. Rev. Lett. 85:1572–1575. [DOI] [PubMed] [Google Scholar]
- Lubensky, D. K., and D. R. Nelson. 2002. Single molecule statistics and the polynucleotide unzipping transition. Phys. Rev. E. 65:031917. [DOI] [PubMed] [Google Scholar]
- Marko, J. F., and E. Siggia. 1995. Stretching DNA. Macromolecules. 28:8759–8770. [Google Scholar]
- Montanari, A., and M. Mézard. 2001. Hairpin formation and elongation of biomolecules. Phys. Rev. Lett. 86:2178–2181. [DOI] [PubMed] [Google Scholar]
- Nelson, P. 1999. Transport of torsional stress in DNA. Proc. Natl. Acad. Sci. USA. 96:14342–14347. [DOI] [PMC free article] [PubMed] [Google Scholar]
- Onoa, B., S. Dumont, J. Liphardt, S. B. Smith, I. Tinoco, Jr., and C. Bustamante. 2003. Identifying kinetic barriers to mechanical unfolding of the T. thermophila ribozyme. Science. 299:1892–1895. [DOI] [PMC free article] [PubMed] [Google Scholar]
- Rief, M., H. Clausen-Schaumann, and H. E. Gaub. 1999. Sequence-dependent mechanics of single DNA molecules. Nat. Struct. Biol. 6:346–349. [DOI] [PubMed] [Google Scholar]
- Sarkar, A., and J. F. Marko. 2001. Removal of DNA-bound proteins by DNA twisting. Phys. Rev. E. 64:061909. [DOI] [PubMed] [Google Scholar]
- Smith, S. B., L. Finzi, and C. Bustamante. 1992. Direct mechanical measurements of the elasticity of single DNA molecules by using magnetic beads. Science. 258:1122–1126. [DOI] [PubMed] [Google Scholar]
- Smith, S. B., Y. Cui, and C. Bustamante. 1996. Overstretching B-DNA: the elastic response of individual double-stranded and single-stranded DNA molecules. Science. 271:795–799. [DOI] [PubMed] [Google Scholar]
- Strick, T. R., J. F. Allemand, D. Bensimon, A. Bensimon, and V. Croquette. 1996. The elasticity of a single supercoiled DNA molecule. Science. 271:1835–1837. [DOI] [PubMed] [Google Scholar]
- Thomen, P., L. Loiseau, U. Bockelmann, and F. Heslot. 2000. Detection of specific protein binding by mechanically opening DNA. Eur. Biophys. J. 29:256. [Google Scholar]
- Thomen, P., U. Bockelmann, and F. Heslot. 2002. Rotational drag on DNA: a single molecule experiment. Phys. Rev. Lett. 88:248102. [DOI] [PubMed] [Google Scholar]
- Thompson, R. E., and E. D. Siggia. 1995. Physical limits on the mechanical measurement of the secondary structure of biomolecules. Europhys. Lett. 31:335–340. [Google Scholar]
- Viovy, J.-L., Ch. Heller, F. Caron, Ph. Cluzel, and D. Chatenay. 1994. Sequencing of DNA by mechanical opening of the double helix: a theoretical evaluation. C.R. Acad. Sci. Paris. 317:795–800. [PubMed] [Google Scholar]
- Vipond, I. P., and S. E. Halford. 1995. Specific DNA recognition by EcoRV induced by calcium ions. Biochemistry. 34:1113–1119. [DOI] [PubMed] [Google Scholar]
- Wang, M. D., H. Yin, R. Landick, and J. Gelles. 1997. Stretching DNA with optical tweezers. Biophys. J. 72:1335–1346. [DOI] [PMC free article] [PubMed] [Google Scholar]


