

Abstract
The transcriptional regulator CueR is activated by the binding of CuI, AgI, or AuI to two cysteinates in a near‐linear fashion. The C‐terminal CCHHRAG sequence in Escherichia coli CueR present potential additional metal binding ligands and here we explore the effect of deleting this fragment on the binding of AgI to CueR. CD spectroscopic and ESI‐MS data indicate that the high AgI‐binding affinity of WT‐CueR is significantly reduced in Δ7C‐CueR.[111 Ag PAC spectroscopy demonstrates that the WT‐CueR metal site structure (AgS2) is conserved, but less populated in the truncated variant. Thus, the function of the C‐terminal fragment may be to stabilize the two‐coordinate metal site for cognate monovalent metal ions. In a broader perspective this is an example of residues beyond the second coordination sphere affecting metal site physicochemical properties while leaving the structure unperturbed.
Keywords: metalloproteins, metalloregulatory proteins, protein metal site structures, silver, thiolate coordination
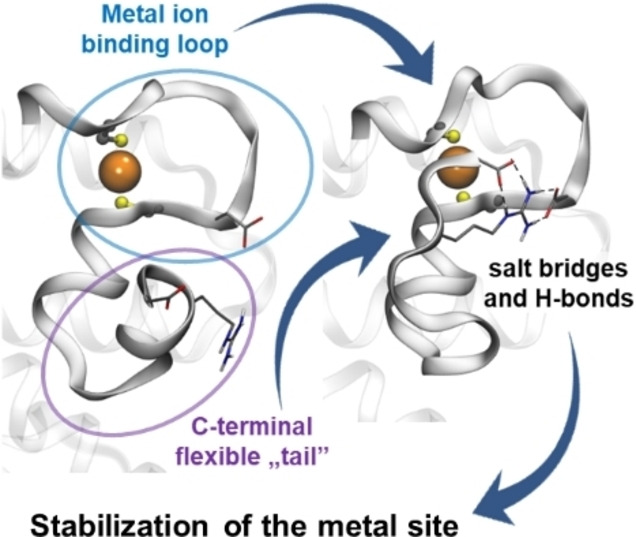
The C‐terminal “tail” of CueR does not influence the overall structure of the protein and the structure of the functional metal site but significantly affects the binding affinity for monovalent metal ions, despite being disordered and relatively remote, i. e. beyond the second coordination sphere of AgI coordinated at the functional metal binding loop.
Introduction
The CueR protein is a member of the MerR family of transcriptional activators.[ 1 , 2 , 3 ] CueR is the regulator of the bacterial cue copper‐resistance system and activates the expression of the CopA and CueO proteins in case of elevated intracellular copper concentration.[ 4 , 5 ] Even though CueR plays a role in the maintenance of copper homeostasis, AgI and AuI ions also activate the transcription of the copA and cueO genes.[ 1 , 6 , 7 ] Contrary to this, divalent transition metal ions, for example HgII, CdII, PbII and ZnII, do not induce the transcriptional response of CueR.[ 1 , 8 ]
The coordination of cognate metal ions (i. e. CuI, AgI and AuI) to CueR and the mechanism of the allosteric regulation are well understood from solution phase, cryo‐EM and crystallographic studies.[ 8 , 9 , 10 , 11 , 12 , 13 , 14 ] Any of these cognate metal ions coordinate to the Cys112 and Cys120 cysteine residues in an identical, linear fashion stabilizing the structure of the metal binding loop and a short helix.[ 8 , 10 ] Both the overall dimeric protein structure and the local metal ion environment is essentially the same in the CuI‐ and the AgI‐bound CueR forms, with the exception of longer metal sulfur distances for AgI. [8] The rearrangements of the structure of the C‐terminal residues starting from Cys112 and of the H‐bonding network lead to the docking of the short helix into a hydrophobic pocket which ultimately results in the formation of the activator conformation, as demonstrated for the AgI‐bound CueR. [10]
In our previous work with peptide models and the full length CueR protein we have shown that the metal binding loop of CueR is flexible enough to accommodate non‐cognate divalent metal ions, such as HgII and CdII, in different coordination geometries.[ 15 , 16 , 17 , 18 ] However, these non‐cognate metal ions may disorganize the structure of the metal binding region and thereby presumably hinder the function of the protein. [18] For instance, it was demonstrated that HgII ions can bind to CueR in a trigonal geometry recruiting a third thiolate ligand from the remaining two cysteines of the protein (Cys129 and/or Cys130) which are included in the CCHHRAG motif close to the C‐terminus. [15] As a consequence, the formation of the activator conformation may be sterically prevented and thus the transcriptional activation may not occur. [15] Based on these observations, we suggested that the well‐conserved CCHH motif, which was shown to be non‐essential for the activation of transcription,[ 2 , 9 ] has an important role in the selectivity of the protein. [15] It has also been proposed that the CCHH motif has a function in assisting the metal ion coordination to the metal binding loop. [9]
With the current work, we aimed to investigate the influence of the last seven C‐terminal amino acid residues on the metal site of AgI‐CueR, by comparing the WT‐protein with a variant truncated after G128 and thus lacking the last seven residues, ▵7C‐CueR (see Figures 1 and S1). We hypothesized that the physical and chemical properties of the AgI binding site would not be significantly affected by the deletion, given that ▵7C‐CueR is still functional. [7] However, this assumption was proved too simplistic, and only applied to the metal site structure, while the stability of the AgI‐CueR complex was substantially reduced for ▵7C‐CueR (vide infra).
Figure 1.
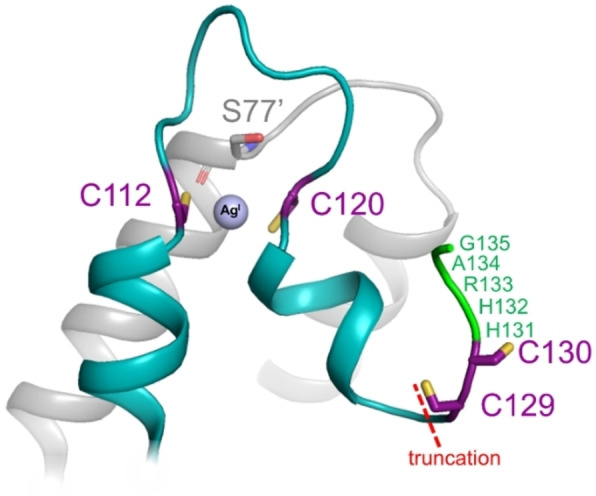
Structural models of the C‐terminal metal binding region of WT‐CueR and ▵7C‐CueR. One monomer of the protein homodimer is shown in cyan and the other in grey. Cysteine residues are shown in purple (with sulfur atoms in yellow). The structural model (including the C‐terminal fragment which is disordered in the crystal structure) was prepared in PyMOL on the basis of the AgI‐bound form of CueR (PDB: 1Q06). [8] The complete amino acid sequences of WT‐CueR and ▵7C‐CueR are included in the Supporting Information (Figure S1).
Results and Discussion
First, we applied CD spectroscopy to elucidate if deletion of the last seven amino acid residues affected the overall structure of the CueR protein. CD spectra for WT‐CueR and Δ7C‐CueR are highly similar, demonstrating that the overall secondary structure composition of CueR is not affected significantly by the deletion (see Figure 2A and B). With an aim to explore if the metal ion binding was perturbed by the deletion of the last seven amino acid residues we executed AgI ion titrations with both proteins monitored by ESI‐MS, CD‐ and UV‐spectroscopy. The ESI‐MS data indicate that up to one AgI per monomer (and no more) binds strongly to the WT‐CueR protein (see Figure 2C). Surprisingly, for the Δ7C‐CueR variant, excess of AgI is required to shift the Δ7C‐CueR+AgI⇌AgI‐Δ7C‐CueR equilibrium towards the formation of the AgI‐Δ7C‐CueR complex, implying that the affinity of the metal site for AgI is decreased considerably by the deletion (Figure 2D). Although not of essence to this work, the binding of CdII was also characterized by ESI‐MS (see Figure S2). The WT‐CueR binds up to 2 eq. of CdII, while Δ7C‐CueR accommodates only 1 eq. CdII (Figure S2), in analogy to the binding of HgII.1 This observation supports the notion that the C‐terminal fragment binds divalent metal ions, and possibly contributes to the selectivity of CueR against these. [15]
Figure 2.

Deletion of the seven C‐terminal residues significantly affects the stability of the AgI binding site of CueR, but the overall fold is conserved. Panels A–B: CD spectra of WT (A) and Δ7C‐CueR (B) at increasing AgI : protein monomer ratios. The upper figures are ellipticity traces at representative wavelength values selected near the maxima and minima of the CD curves. The solid lines in panel B represent the fit of data, see the text. c WT‐CueR=c Δ7C‐CueR=20 μM. Panels C–D: Deconvoluted ESI‐MS data for WT‐CueR (C), and Δ7C‐CueR (D) with increasing amounts of AgI. c WT‐CueR=c Δ7C‐CueR=20 μM.
In conformity with the ESI‐MS results, CD spectra recorded at increasing AgI‐protein monomer ratios also indicate a stronger AgI‐binding affinity of WT‐CueR. The coordination of AgI gives rise to a slight shift of the x‐intercept of the spectra and small increase of the CD‐intensities at all protein backbone bands (Figure 2) suggesting, in line with previous observations,[ 19 , 20 , 21 ] that metal ion binding induces only modest alterations in the secondary structure of the proteins. However, the observed changes are larger with WT‐CueR and level off at AgI:WT‐CueR=1 : 1 ratio while with the truncated variant intensities tend to increase even beyond 2 equiv. of AgI per ▵7C‐CueR protein monomer.
The assumed differences in the AgI‐binding of WT‐CueR and Δ7C‐CueR was also investigated by UV‐absorption spectroscopy (Figure S3). The UV absorbance of both proteins increases upon titration with AgI in the range of 220–280 nm. Previous studies, characterizing the AgI binding of various cysteine containing peptides and proteins, assigned UV‐bands appearing in this wavelength range to thiolate‐AgI LMCT transitions.[ 22 , 23 , 24 , 25 ] Accordingly, the observed absorbance increase reflects the coordination of cysteine thiolates of the CueR variants to AgI. However the absorbance of Δ7C‐CueR increases by less than that of the WT protein (Figure S3B) indicating the formation of fewer S−‐AgI bonds. In agreement with the observations by CD and ESI‐MS, this supports that the association of CueR and AgI is weakened by the deletion of the last seven amino acid residues.
In order to explore in more detail whether the CueR metal site structure and AgI affinity is changed by the deletion, we applied 111Ag perturbed angular correlation of γ‐rays (PAC) spectroscopy to the Δ7C‐CueR variant, and compared the results to 111Ag PAC spectroscopic data for the WT protein published recently. [18] 111Ag decays by β− emission to 111Cd, and a small fraction of the decay occurs via an excited state of the 111Cd nucleus (342 keV), by a γ‐γ cascade to the ground state of 111Cd [26] (Figure S4). In 111Ag PAC spectroscopy the nuclear quadrupole interactions (NQI) experienced by the daughter Cd nucleus in the intermediate state (I=5/2, 245 keV) are recorded. The decay gives rise to a change of element and oxidation state from AgI to CdII. Moreover, recoil kinetic energy, typically several hundreds of kJ/mol, is imparted on the Cd‐nucleus, due to the emission of the β− particle and the antineutrino. The change of element and oxidation state, and the recoil energy shifts the system out of equilibrium, and in the subsequent relaxation process CdII explores the local potential energy surface. Thus, the 111Ag PAC signal provides information on both the metal site structure and local rigidity/flexibility.[ 18 , 26 , 27 , 28 ]
111Ag PAC experiments were conducted in the frozen state at −196 °C to limit structural relaxation after the nuclear decay, as well as in liquid solution at 1 °C. At −196 °C the 111Ag PAC spectrum of WT‐CueR displays two NQIs [18] (Figure 3). One is a high frequency signal, NQI1, which reflects the original bisthiolato‐AgI coordination geometry having undergone minor relaxation upon the decay to CdII, presumably leading to an additional weak interaction with the carbonyl oxygen of Ser77. The other, NQI2, is a lower frequency signal, reflecting higher coordination number than 2.[ 18 , 29 ] The Δ7C‐CueR variant exhibits essentially the same high frequency signal, NQI1 (see Figure 3 and Table 1), demonstrating that this native AgI‐CueR metal site coordination geometry is the same as in the WT protein.
Figure 3.
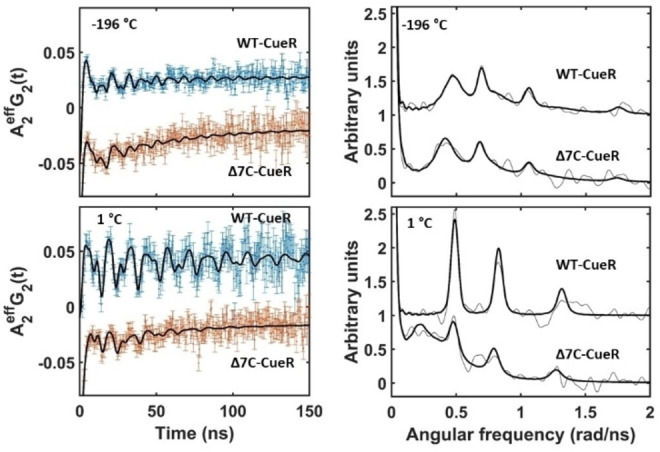
Metal site structure of WT‐ and Δ7C‐CueR probed by 111Ag PAC spectroscopy (spectra for WT‐CueR are from Ref. [18]). Measured and fitted A 2 G 2(t) (left) and Fourier transformed (right) data and fit for the WT‐ and Δ7C‐CueR proteins recorded at −196 and 1 °C, pH=8.0, c protein=11 μM, c AgI=5.5 μM, w/w%sucrose=55 %.
Table 1.
Parameters fitted to the 111Ag PAC‐data. The rotational correlation time was fixed to infinite for the experiments with a sample temperature of −196 °C.
|
CueR |
t [°C] |
ω 0 [rad/ns] |
η |
δ ×100 |
1/τ c [μs−1] |
λfast [μs−1] |
A ×100 |
χ r 2 |
|---|---|---|---|---|---|---|---|---|
|
WT[a] |
−196 |
0.555(2) 0.41(1) |
0.510(8) 0.39(4) |
2.5(6) 16(2) |
0(fix) 0(fix) |
22(9) |
−2.3(4) −7.4(1) −0.9(1) |
0.93 |
|
Δ7C |
−196 |
0.553(7) 0.36(1) |
0.49(2) 0.36(6) |
2.5(fix) 20(fix) |
0(fix) 0(fix) |
18(3) |
−1.3(3) −8(1) −3.5(2) |
0.92 |
|
WT[a] |
1 |
0.426(1) |
0.384(6) |
1.5(5) |
6(2) |
|
−6.3(5) |
0.90 |
|
Δ7C |
1 |
0.409(4) 0.18(2) |
0.42(2) 0.4(1) |
1.5(fix) 30(fix) |
24(3) 24(3) |
|
−3.7(5) −9(1) |
0.80 |
[a] The data for the WT protein are from Ref. [18].
The low frequency signal for Δ7C‐CueR appears by visual inspection similar to NQI2 observed for WT‐CueR, but it is in fact statistically significantly different. There are two possible interpretations of this difference: 1) The C‐terminal CCHH motif coordinates directly to the metal ion in the WT protein, or 2) the absence of the last seven amino acids leads to relaxation (upon the nuclear decay) to a slightly different coordination geometry than observed in WT‐CueR. It is unlikely that major movement of the protein backbone occurs at −196 °C, so if the daughter nucleus, CdII, coordinates to the CCHH motif, it indicates that such coordination is already present for AgI. In this interpretation the high and low frequency would therefore reflect an equilibrium between two structures where AgI is coordinated by Cys112 and Cys120 (NQI1) in one, and coordinated by an additional ligand from the CCHH motif (NQI2) in the other. This is not observed in the CuI‐CueR [8] and AgI‐CueR[ 8 , 10 ] crystal structures, nor is it observed for CuI by EXAFS and XANES. [9] Thus, the most likely interpretation is that the deletion of the seven C‐terminal amino acid residues perturbs the relaxation of the local structure following nuclear decay (to CdII), leading to a different low frequency signal than observed for the WT‐CueR protein. The line width of the low frequency signal is larger for Δ7C‐CueR than for WT‐CueR (and it was necessary to fix this parameter during the fit), which in itself reflects a larger flexibility at the metal site. Perhaps most importantly, the PAC data exhibit an exponentially decaying signal superimposed on the oscillating signals (see Figure 3 left part, and Table 1). This part of the signal attracts a significant fraction of the amplitude for Δ7C‐CueR, and it reflects dynamic changes of the CdII coordination geometry on the timescale of the PAC experiment (10–200 ns).
This exponentially decaying part of the signal at −196 °C may be attributed to free 111AgI in the frozen solution or bound to a small molecule such as the reducing agent TCEP, vide infra, or to 111AgI weakly associated with the protein, in agreement with the ESI‐MS and UV absorption data, vide supra. The dynamic character of this fraction of the signal is presumably caused by the daughter ion, CdII, jumping between a series of local minima on the potential energy surface after the decay, even at this low temperature (−196 °C). It cannot be excluded that a very small fraction of the 111Ag PAC signal from WT‐CueR also displays this exponentially decaying character, possibly originating from a small fraction (less than 10 %) of the CdII escaping the metal site due to high recoil energies.
At 1 °C, the 111Ag PAC spectrum of WT‐CueR is relatively simple, reflecting only one NQI which is very similar to the low frequency component observed at −196 °C [18] (Figure 3). Thus, under these conditions, the metal site relaxes to a well‐defined coordination geometry with a coordination number higher than 2 [18] within about 10 ns after the decay. Interestingly, the same signal is observed for the Δ7C‐CueR variant, but it only accounts for ∼29 % of the total signal amplitude, and a lower frequency signal with massive line broadening is also present. The fact that the signal observed for WT‐CueR is also detected for Δ7C‐CueR demonstrates that it cannot be attributed to the coordination of the CCHH motif. The very broad low frequency signal appearing for Δ7C‐CueR may imply the presence of multiple species, most likely with coordination numbers of 4 or higher, because the low frequency indicates more spherical charge distribution than is expected for 2‐ and 3‐coordinated structures. This fraction of the signal most likely reflects metal ions which are not (or unspecifically) bound to CueR, but possibly bound to TCEP, in excellent agreement with the ESI‐MS and CD data (see the discussion later), and with the 111Ag PAC data recorded at −196 °C. This further supports the interpretation that a significant fraction of 111Ag is not bound to the native bisthiolato‐metal site in the Δ7C‐CueR variant.
Thus, the ESI‐MS, CD, UV absorption and 111Ag PAC data taken together indicate that the overall protein structure and the metal site structure is conserved upon deletion of the last seven residues, but that the metal site affinity for AgI is decreased. The CD‐intensity vs. AgI : protein monomer concentration ratio profiles (Figure 2B), as well as the variation of the relative intensities of the signals of the Apo‐Δ7C‐CueR and Ag‐Δ7C‐CueR forms observed in the deconvoluted ESI‐MS spectra (Figure 2D) may allow a more quantitative characterization of the attenuated AgI‐binding affinity of the truncated CueR. The fact that the free and bound Δ7C‐CueR protein fraction is comparable at a 1 : 1 AgI : protein monomer concentration ratio under the conditions of the CD and ESI‐MS studies would indicate a magnitude of logK’∼5–6 for the stability of Ag‐Δ7C‐CueR (at pH 7.5), i. e. a K D’ value in the micromolar range. This would represent an unrealistically large difference from the conditional stability constant that can be estimated for the AgI binding of the wild type protein, based on the previously published in vitro profile of metal ion induced transcription of the copA gene where the free AgI concentration was buffered by CN− ions. [8] Combining the known protonation constant of HCN and the stability constant of the [Ag(CN)2]− complex [30] with data of the transcription profile the estimated conditional stability (at pH 8.0) for the AgI‐bound CueR is logK’ ∼19.7.
The seemingly uninterpretable difference between the stabilities of the AgI‐bound forms of WT‐CueR and Δ7C‐CueR made us assume that the studied systems are more complex and the processes taking place are not restricted to those between AgI and the proteins. Indeed, the reducing agent tris(2‐carboxyethyl)phosphine (TCEP), added to the samples to preserve the reduced form of the proteins, may potentially coordinate to AgI via the central soft phosphorous atom. Metal ion binding of TCEP has been characterized so far with a few divalent transition metal ions, [31] indicating a reasonably strong affinity towards e. g. CdII and PbII, but, to our knowledge, stability data are not available for AgI, yet. Thus we executed pH‐potentiometric and UV‐Vis titrations of TCEP in the presence and absence of AgI with a special focus on gaining stability data for the AgI‐TCEP complexes around neutral conditions (pH 7.5). The results of these studies (to be published later) allowed us to define a lower limit of the conditional stabilities (pH 7.5) of two types of species: the Ag(TCEP) monocomplex(es), logβ 1’=10.4 (AgI+TCEP⇌Ag(TCEP)) and the Ag(TCEP)2 bis‐complex(es), logβ 2’=16.7 (AgI+2 TCEP⇌Ag(TCEP)2). These stability values are large enough to indicate that TCEP, especially when used in excess over the protein, may actually participate in the AgI+Δ7C‐CueR⇌Ag‐Δ7C‐CueR equilibrium as a competing ligand while not affecting noticeably the interaction of the wild type protein because of the larger stability of the Ag‐WT‐CueR species.
The spectroscopic data (CD and ESI‐MS) obtained in the AgI‐titration of Δ7C‐CueR could be adequately quantitatively evaluated by considering formation constants for the AgI‐complexation processes of TCEP. As the next step, we fitted the AgI concentration dependent data series of CD intensities (from representative wavelength values depicted in Figure 2B) by the PSEQUAD PC software, [32] considering a simple model consisting of Ag‐Δ7C‐CueR, Ag(TCEP) and Ag(TCEP)2 with fixed stability constants for the latter two species. Indeed, it is only Ag(TCEP)2 that can actually form when TCEP is present in the many fold excess over AgI used in our CD (and ESI‐MS) titrations. The fit of data, represented by the solid lines over the experimental points in Figure 2B, resulted in a lower estimate of the stability of Ag‐Δ7C‐CueR, logK’=15.5. A similar data evaluation procedure by PSEQUAD was also carried out with the AgI concentration dependent series of ESI‐MS data by making the assumption that the relative intensities of the Apo‐Δ7C‐CueR (m/z=14470) and Ag‐Δ7C‐CueR (m/z=14577) related peaks (Figure 2D) represent, to a good approximation, the mole fractions of the free and metal ion bound forms of the protein. The fitting of these intensities by the model vide supra (see Figure S5 in the Supporting Information) resulted in a conditional stability, logK’=15.0 (pH 7.5), for Ag‐Δ7C‐CueR, which is rather similar to the value obtained by the evaluation of the CD titration data. An upper limit for the logK’ value for Ag‐Δ7C‐CueR was also estimated by the repeated fitting of the CD and ESI‐MS titration data using a modified stability for the Ag(TCEP)2 complex. Since the wild type CueR is saturated by AgI at 1 : 1 AgI: WT‐CueR ratio, we supposed that not more than 5 % of the bound WT‐CueR is displaced by TCEP under these conditions which is realized if logβ 2’=19.0 for Ag(TCEP)2. Using this value in the evaluation of the CD and ESI‐MS titration data of Δ7C‐CueR provided logK’=17.8 (CD) and 17.3 (ESI‐MS) for the Ag‐Δ7C‐CueR species. The mean of the established upper and lower stability estimates of Ag‐Δ7C‐CueR represent a ca. 2.1–4.5 logarithmic unit decrease relative to the AgI‐binding affinity of the wild type CueR, as a consequence of the deletion of the last seven amino acid residues. This corresponds to 12–26 kJ/mol difference in the free energy of AgI binding to WT‐CueR and Δ7C‐CueR.
A combination of the pieces of information, provided by the different types of spectroscopic techniques, implies that the C‐terminal CCHH motif of WT‐CueR does not coordinate directly to the native metal site but that other interactions, such as hydrogen bonding or salt bridges involving the last seven amino acid residues, stabilize the metal site. We next attempted to explore the structural basis for this stabilization of the metal site, exerted by the C‐terminal fragment by analysis of available structures. Unfortunately, these residues (CCHHRAG in E. coli) are disordered and not observed in any of the structures determined by X‐ray diffraction, except in the AgI‐CueR‐DNA complex (PDB code: 4WLW) where coordinates for Cys129 and Cys130 are provided. [10] An extensive hydrogen bonding network is present, including a hydrogen bond between the side chains of Cys130 and Glu124 (Figure 4A), potentially contributing to preorganization of the position of Cys120 in the native metal site. In order to further explore the interaction of the last seven residues with the metal ion binding loop, we carried out a molecular dynamics simulation, initially positioning the C‐terminal fragment without direct interaction with the preceding residues. At the end of the MD simulation, the C‐terminus of one of the monomers of the homodimer had established contacts with residues in the vicinity of the metal binding cysteines, while no such interactions were present for the other monomer (Figure 4B). This reflects the expected disorder of the C‐terminal fragment, but more importantly, it indicates the possible formation of a salt bridge between Asp119 and Arg133 as well as between Glu124 and Arg133, potentially stabilizing the metal site structure. These H‐bonding and electrostatic interactions may well account for the 12–26 kJ/mol difference in free energy of binding of AgI indicated above, assuming that the interactions are not present in the apo‐protein.
Figure 4.

Possible interactions of the metal ion binding loop (residues 112–120) with the seven C‐terminal amino acid residues. A: Structural data from the AgI‐CueR (activator) complex with DNA (PDB code 4WLW, in all other published structures the entire C‐terminal seven AA fragment is disordered). B: Backbone trace of the CuI‐CueR‐DNA complex with the last seven amino acid residues included (the last five AAs were added as an alpha‐helical extension, see Figure S6) at t=0 of an MD simulation, see the Supporting Movie. The structure at t=0 (transparent) is superimposed on the final (t=1 μs) structure (opaque) from the MD simulation (Supporting Movie), and the movement of the C‐terminus is indicated by the black arrow. C: At t=1 μs, in one of the two dimers, the C‐terminus has established contacts (between Arg133 and Asp119 and Glu124) with residues near the metal binding Cys120. D: Amino acid sequence alignment of CueR, CupR, GolS and HmrR from different bacteria. Cysteines, acidic (D/E) and basic (R/K) residues are highlighted in yellow, red and blue, respectively.
Structural information might also be inferred from sequence alignment of the monovalent metal ion responsive regulators from different bacteria (Figure 4C). Asp119 is conserved in all the proteins (numbering according to E. coli CueR), and there is a Glu/Asp at position 124 or 125 in most cases, as well as a positively charged residue (Lys/Arg) among the last seven C‐terminal residues. This implies that the salt bridge and H‐bonding network found in the MD simulation (Figure 4C), may be a general feature, by which the C‐terminal residues stabilize the metal biding site. HmrR from Rhizobium leguminosarum is an interesting exception to this rule, and has a partly truncated C‐terminus compared to the other proteins. Previous experiments have shown that the E.coli Δ7C‐CueR variant is still functional, activating transcription, although to a lesser extent than the WT‐CueR. [7] With this work we rationalize this observation in terms of structure and metal site stability, which, surprisingly, appears to be significantly decreased for Δ7C‐CueR. Moreover, we predict that HmrR from R. leguminosarum is less efficient in terms of transcriptional activation than the CueR from E. coli, and it would be interesting to explore if this protein exhibits decreased affinity for the cognate metal ions, as well as a decreased activity of the transcriptional activation. Finally, the deletion of the last 14 amino acid residues leads to a constitutive repressor, [10] i. e. it is well established that deletion of C‐terminal residues may affect the protein function.
In general, the conservation of metal site structure but change of local dynamics/flexibility points to a pitfall in pure structure based rational design of proteins. That is, it may be possible to design the local structure to what appears to be a protein with the desired properties, but if the local metal site stability or flexibility changes significantly, it is likely that the protein function is affected, and therefore the design effort may not lead to the anticipated result.
Conclusion
In summary, the overall structure of the CueR (E. coli) protein dimer is essentially unaffected by the deletion of the last seven amino acid residues, as demonstrated by CD spectroscopy. Similarly, the native AgI coordination geometry is also conserved in the Δ7C variant, as indicated by the high frequency PAC signal present in both the WT and Δ7C variants. However, the affinity of the CueR metal site for AgI is reduced, as reflected by the ESI‐MS, CD and 111Ag PAC data. That is, the C‐terminal fragment (CCHHRAG in WT‐CueR) appears to stabilize the functional metal site despite being relatively remote and despite exhibiting disorder in most structures determined by X‐ray diffraction.[ 8 , 10 ] Thus, although folding overall is conserved, the stability of the metal site is significantly affected by the deletion. These observations indicate that even if the metal site structure is (deceivingly) unperturbed within the first and second coordination sphere, the physical and chemical properties ‐ beyond structure ‐ may change significantly by relatively remote alterations of the amino acid sequence.
Experimental Section
Production of recombinant proteins: The E. coli cueR gene was generously provided by prof. Alfonso Mondragon (Northwestern University, Evanston, Illinois, USA). [6] The construction of the gene of C‐terminally truncated CueR protein is detailed in a previous work. [15] The proteins were expressed in E. coli BL21(DE3) and purified as detailed in previous works.[ 15 , 33 ] The quality of the purified proteins was analyzed by Tricine‐SDS‐PAGE, [34] mass spectrometry (MS), circular dichroism (CD) spectroscopy and electrophoretic mobility shift assay (EMSA). [33]
Native mass spectrometry: Mass spectrometric measurements were carried out on an LTQ‐Orbitrap Elite (Thermo Scientific) mass spectrometer coupled with a TriVersa NanoMate (Advion) chip‐based electrospray ion source. Spectra were evaluated with Xcalibur 2.2 and Xtract (Thermo Scientific) programs. The protein concentration was 20 μM in each individual sample which contained 0, 0.2, 0.5, 1.0, 2.0 (and 3.0) equivalents of AgClO4 and 0, 0.2, 0.5, 1.0, (1.5) and 2.0 equivalents of Cd(ClO4)2. The samples were buffered at pH=7.5 with a solution containing 10 mM ammonium bicarbonate/NH3 and 0.5 mM tris(2‐carboxyethyl)phosphine (TCEP).
CD spectroscopy: Circular dichroism spectra were recorded on a Jasco J‐815 spectropolarimeter and were also acquired at the CD1 beamline of the storage ring ASTRID at the Institute for Storage Ring Facilities (ISA), Aarhus University, Denmark.[ 35 , 36 ] Camphor‐sulfonic acid served as a calibration material for the instrument. All spectra were recorded applying a 1 nm step and a dwell time of 2 s, using quartz cells (SUPRASIL, Hellma GmbH, Germany) with a 0.2 mm optical length, in the wavelength range of 180–300 nm. The protein samples were buffered at pH 7.5 by a 20 mM Tris/HClO4 buffer containing 1 mM TCEP or a 10 mM ammonium bicarbonate/NH3 solution with 0.5 mM TCEP. Concentrations of the proteins were: c WT‐CueR=c Δ7C‐CueR=20 μM. CD spectra were baseline‐corrected by using the spectrum of water or buffer.
UV absorption spectroscopy: UV absorption spectra of WT‐CueR (c protein=12 μM) and of Δ7C‐CueR titrated with AgI ions were recorded with a Shimadzu UV2600 spectrophotometer in a wavelength range of 200–390 nm. The titration was carried out in a Hellma semi‐micro quartz cell with 10 mm optical path length. Samples were buffered at pH=7.5 with a solution containing 20 mM Tris/HClO4 and 0.4 mM TCEP. 5.5 μL aliquots (corresponding to 0.1 eq. AgI per CueR monomer) of a AgClO4 stock solution (c AgClO4=2.5×10⁻⁴ M) were added to the protein sample. From all the recorded spectra the spectrum of Tris buffer was subtracted as a baseline. The difference spectra were obtained by subtracting the spectra of the apo‐protein (ΔA=A Ag‐protein ‐ A apo‐protein) and the offset of the baseline (i. e. the absorbance measured at 400 nm).
111 Ag production: 2.54 mg of Pd powder enriched to 98.6 % in 110Pd (Oak Ridge National Lab, batch 214301) was enclosed in a quartz ampoule and irradiated for 4 days in the V4 beam tube of the high flux reactor of Institut Laue‐Langevin (Grenoble) [https://doi.org/10.1016/S0167‐8140(12)70279‐7] at a thermal neutron flux of 1.1×10¹⁵ n cm−2 s−1. The 111Pd produced by neutron capture decays rapidly (T 1/2=23 min) to 111Ag (T 1/2=7.45 d). The sample was shipped to Hevesy Laboratory (DTU Risø) and radiochemically separated as described previously. [37]
111 Ag PAC measurements: Measurements were carried out at the University of Copenhagen with a PAC instrument consisting of six BaF2 scintillation detectors. [38] During the measurements the temperature was maintained at 1 °C by a Peltier element or at −196 °C by liquid nitrogen. Samples were prepared by adding non‐radioactive AgClO4, Tris buffer and protein solution (stored in Tris (20 mM, pH=7.5) and TCEP (1 mM)) to the radioactive 111Ag, as described in our previous work. [18] The AgI : protein monomer ratio was set to 0.5 : 1. In order to decrease the rotational diffusion of the molecules 55 % w/w sucrose was added to the samples. As a final step, the pH of the samples was adjusted to 7.3 at room temperature, and thus the pH was 8.0 at 1 °C, due to the temperature dependence of Tris, which was used as a buffer at a final concentration of 11.3 mM.
PAC data evaluation: Evaluation of the PAC data was carried out using the Prelude32 and Winfit programs. 300 data points were used in the fitting procedures, except the first 5 points due to systematic errors experienced in these. Fourier transformation of the data and fits were carried out using a Keiser‐Bessel window with a window parameter equal to 6. The time resolution and time per channel values were 0.981 ns and 0.562 ns, respectively. For the Δ7C‐CueR variant at −196 °C, the linewidth (δ) was fixed (to the value observed for the WT‐protein) for the high frequency component because it appears with so little amplitude that δ could not be fitted reliably, and to 20 % for the low frequency component, because setting this parameter free leads to a total amplitude larger than the literature value for 111Ag (for a finite sample and detector size the total effective amplitude must be smaller than the literature value, due to angles between pairs of detectors effectively being averaged around the ideal values of 90 and 180 degrees). The difference in amplitude of the 111Ag‐WT‐CueR experiments at −196 °C and 1 °C is a consequence of a shorter sample detector distance used for the latter experiment. In some of the fits a component reflecting rapid dynamics was included, giving rise to a purely exponentially decaying PAC signal with decay constant λ fast. For a more comprehensive description of the PAC parameters, see ref. [26].
Molecular dynamics simulation: A MD simulation was undertaken to probe the dynamics of the CueR complex with a focus on elucidating the behavior of the last 7C‐terminal residues. To this end, the crystal structure of CueR with AgI complexed with DNA (PDB‐ID: 4WLW) [10] was modified in Maestro [39] to include the 5 last C‐terminal residues (HHRAG) missing in the crystal structure. The missing residues were modelled as a short alpha‐helical segment and attached C‐terminally to each protein chain in 4WLW (Figure S6) followed by local geometry relaxation. AgI was replaced with CuI and the coordination geometry was adjusted to give CuI‐S distances of 2.14 Å to agree with the crystal structure of the CuI form of CueR (PDB‐ID: 1q05). [8] A partial charge of +0.4 was assigned to CuI with the remaining charge of +0.6 distributed equally between the coordinating sulfurs. The CueR complex (Figure 4B, shaded) was solvated in a cubic box of TIP3P [40] waters, giving a 15 Å solvent buffer on the sides of the complex and charge neutralization was done using automatic placement of Na+. The MD simulation was run for 1 μs in Desmond [41] in the NPT ensemble (p=1 bar, T=300 K) using the OPLS3 force field for protein, DNA and ions. [42] VMD [43] was used to study the MD trajectory and for producing Figure 4 B,C. The constructed structure (including all amino acid residues of CueR) of the CuI‐CueR‐DNA complex at t=0 and at the end‐point of the MD simulation can be found in the Supporting Information.
Conflict of interest
The authors declare no conflict of interest.
1.
Supporting information
As a service to our authors and readers, this journal provides supporting information supplied by the authors. Such materials are peer reviewed and may be re‐organized for online delivery, but are not copy‐edited or typeset. Technical support issues arising from supporting information (other than missing files) should be addressed to the authors.
Supporting Information
Supporting Information
Acknowledgements
This work was supported by the Hungarian National Research, Development and Innovation Office (GINOP‐2.3.2‐15‐2016‐00038 and NKFIH K_16/120130) and COST Action CA15126 ARBRE MOBIEU. We thank the Single Cell Omics Advanced Core Facility staff of the HCEMM and Biological Research Center for help with their resources and their support. HCEMM has received funding from the EU's Horizon 2020 research and innovation program under grant agreement No. 739593. The authors wish to thank Daniel Szunyogh for his valuable assistance in the recording of 111Ag PAC spectra.
R. K. Balogh, B. Gyurcsik, M. Jensen, P. W. Thulstrup, U. Köster, N. J. Christensen, M. L. Jensen, É. Hunyadi-Gulyás, L. Hemmingsen, A. Jancsó, ChemBioChem 2022, 23, e202200290.
Contributor Information
Prof. Lars Hemmingsen, Email: lhe@chem.ku.dk.
Prof. Attila Jancsó, Email: jancso@chem.u-szeged.hu.
Data Availability Statement
The data that support the findings of this study are available from the corresponding author upon reasonable request.
References
- 1. Stoyanov J. V., Hobman J. L., Brown N. L., Mol. Microbiol. 2001, 39, 502–512. [DOI] [PubMed] [Google Scholar]
- 2. Hobman J. L., Wilkie J., Brown N. L., BioMetals 2005, 18, 429–436. [DOI] [PubMed] [Google Scholar]
- 3. Brown N. L., Stoyanov J. V., Kidd S. P., Hobman J. L., FEMS Microbiol. Rev. 2003, 27, 145–163. [DOI] [PubMed] [Google Scholar]
- 4. Kim E.-H., Nies D. H., McEvoy M. M., Rensing C., J. Bacteriol. 2011, 193, 2381–2387. [DOI] [PMC free article] [PubMed] [Google Scholar]
- 5. Rademacher C., Masepohl B., Microbiology 2012, 158, 2451–64. [DOI] [PubMed] [Google Scholar]
- 6. Outten F. W., Outten C. E., Hale J., O'Halloran T. V., J. Biol. Chem. 2000, 275, 31024–31029. [DOI] [PubMed] [Google Scholar]
- 7. Stoyanov J. V., Brown N. L., J. Biol. Chem. 2003, 278, 1407–1410. [DOI] [PubMed] [Google Scholar]
- 8. Changela A., Chen K., Xue Y., Holschen J., Outten C. E., O'Halloran T. V., Mondragón A., Science 2003, 301, 1383–1387. [DOI] [PubMed] [Google Scholar]
- 9. Chen K., Yuldasheva S., Penner-Hahn J. E., O'Halloran T. V., J. Am. Chem. Soc. 2003, 125, 12088–12089. [DOI] [PubMed] [Google Scholar]
- 10. Philips S. J., Canalizo-Hernandez M., Yildirim I., Schatz G. C., Mondragón A., O′Halloran T. V., Science 2015, 349, 877–881. [DOI] [PMC free article] [PubMed] [Google Scholar]
- 11. Fang C., Philips S. J., Wu X., Chen K., Shi J., Shen L., Xu J., Feng Y., O'Halloran T. V., Zhang Y., Nat. Chem. Biol. 2021, 17, 57–64. [DOI] [PMC free article] [PubMed] [Google Scholar]
- 12. Casto J., Mandato A., Hofmann L., Yakobov I., Ghosh S., Ruthstein S., Saxena S., Chem. Sci. 2022, 13, 1693–1697. [DOI] [PMC free article] [PubMed] [Google Scholar]
- 13. Shi W., Zhang B., Jiang Y., Liu C., Zhou W., Chen M., Yang Y., Hu Y., Liu B., iScience 2021, 24, 102449. [DOI] [PMC free article] [PubMed] [Google Scholar]
- 14. Yakobov I., Mandato A., Hofmann L., Singewald K., Shenberger Y., Gevorkyan-Airapetov L., Saxena S., Ruthstein S., Prot. Sci. 2022, 31, e4309. [DOI] [PMC free article] [PubMed] [Google Scholar]
- 15. Balogh R. K., Gyurcsik B., Hunyadi-Gulyás É., Schell J., Thulstrup P. W., Hemmingsen L., Jancsó A., Chem. Eur. J. 2019, 25, 15030–15035. [DOI] [PMC free article] [PubMed] [Google Scholar]
- 16. Szunyogh D., Gyurcsik B., Larsen F. H., Stachura M., Thulstrup P. W., Hemmingsen L., Jancso A., Dalton Trans. 2015, 44, 12576–12588. [DOI] [PubMed] [Google Scholar]
- 17. Szunyogh D., Szokolai H., Thulstrup P. W., Larsen F. H., Gyurcsik B., Christensen N. J., Stachura M., Hemmingsen L., Jancso A., Angew. Chem. Int. Ed. 2015, 54, 15756–15761; [DOI] [PubMed] [Google Scholar]; Angew. Chem. 2015, 127, 15982–15987. [Google Scholar]
- 18. Balogh R. K., Gyurcsik B., Jensen M., Thulstrup P. W., Köster U., Christensen N. J., Mørch F. J., Jensen M. L., Jancso A., Hemmingsen L., Chem. Eur. J. 2020, 26, 7451–7457. [DOI] [PMC free article] [PubMed] [Google Scholar]
- 19. Balogh R. K., Németh E., Jones N. C., Hoffmann S. V., Jancsó A., Gyurcsik B., Eur. Biophys. J. 2021, 50, 491–500. [DOI] [PubMed] [Google Scholar]
- 20. Sameach H., Narunsky A., Azoulay-Ginsburg S., Gevorkyan-Aiapetov L., Zehavi Y., Moskovitz Y., Juven-Gershon T., Ben-Tal N., Ruthstein S., Structure 2017, 25, 988–996. [DOI] [PubMed] [Google Scholar]
- 21. Schwartz R., Ruthstein S., Major D. T., J. Phys. Chem. B 2021, 125, 9417–9425. [DOI] [PubMed] [Google Scholar]
- 22. Zelazowski A. J., Stillman M. J., Inorg. Chem. 1992, 31, 3363–3370. [Google Scholar]
- 23. Stillman M. J., Presta A., Gui Z., Jiang D.-T., Met.-Based Drugs 1994, 1, 375–394. [DOI] [PMC free article] [PubMed] [Google Scholar]
- 24. Park G., Amaris Z. N., Eiken M. K., Baumgartner K. V., Johnston K. A., Williams M. A., Marckwordt J. G., Millstone J. E., Splan K. E., Wheeler K. E., Environ. Sci.-Nano 2019, 6, 2367–2378. [DOI] [PMC free article] [PubMed] [Google Scholar]
- 25. Kluska K., Veronesi G., Deniaud A., Hajdu B., Gyurcsik B., Bal W., Krężel A., Angew. Chem. Int. Ed. 2022, 61, e202116621. [DOI] [PMC free article] [PubMed] [Google Scholar]
- 26. Hemmingsen L., Sas K. N., Danielsen E., Chem. Rev. 2004, 104, 4027–4062. [DOI] [PubMed] [Google Scholar]
- 27. Hemmingsen L., Stachura M., Thulstrup P. W., Christensen N. J., Johnston K., Hyperfine Interact. 2010, 197, 255–267. [Google Scholar]
- 28. Jancso A., Correia J. G., Gottberg A., Schell J., Stachura M., Szunyogh D., Pallada S., Lupascu D. C., Kowalska M., Hemmingsen L., J. Phys. G Nucl. Part. Phys. 2017, 44, 064003. [Google Scholar]
- 29. Fromsejer R., Mikkelsen K. V., L, Hemmingsen , Phys. Chem. Chem. Phys. 2021, 23, 25689–25698. [DOI] [PubMed] [Google Scholar]
- 30.R. M. Smith, A. E. Martell, R. J. Motekaitis, NIST Standard Reference Database 46. Critically Selected Stability Constants of Metal Complexes Database, Version 8.0 for Windows. 2004. US National Institute of Standards and Technology, Standard Reference Data Program; Gaithersburg, MD 20899.
- 31. Kreżel A., Latajka R., Bujacz G. D., Bal W., Inorg. Chem. 2003, 42, 1994–2003. [DOI] [PubMed] [Google Scholar]
- 32.L. Zékány, I. Nagypál, G. Peintler, PSEQUAD for Chemical Equilibria, Technical Software Distributors, Baltimore, MD, 1991.
- 33. Balogh R. K., Gyurcsik B., Hunyadi-Gulyás É., Christensen H. E. M., Jancsó A., Protein Expression Purif. 2016, 123, 90–96. [DOI] [PubMed] [Google Scholar]
- 34. Schägger H., Nat. Protoc. 2006, 1, 16–22. [DOI] [PubMed] [Google Scholar]
- 35. Miles A. J., Hoffmann S. V., Tao Y., Janes R. W., Wallace B. A., Spectroscopy 2007, 21, 245–255. [Google Scholar]
- 36. Miles A. J., Janes R. W., Brown A., Clarke D. T., Sutherland J. C., Tao Y., Wallace B. A., Hoffmann S. V., J. Synchrotron Radiat. 2008, 15, 420–422. [DOI] [PubMed] [Google Scholar]
- 37. Bauer R., Danielsen E., Hemmingsen L., Bjerrum M. J., Hansson Ö., Singh K., J. Am. Chem. Soc. 1997, 119, 157–162. [Google Scholar]
- 38. Butz T., Saibene S., Fraenzke T., Weber M., Nucl. Instrum. Methods Phys. Res. Sect. A 1989, 284, 417–421. [Google Scholar]
- 39.Schrödinger Release 2020–2: Maestro, Schrödinger, LLC, New York, NY, 2020.
- 40. Jorgensen W. L., Chandrasekhar J., Madura J. D., Impey R. W., Klein M. L., J. Chem. Phys. 1983, 79, 926–935. [Google Scholar]
- 41.K. J. Bowers, E. Chow, H. Xu, R. O. Dror, M. P. Eastwood, B. A. Gregersen, J. L. Klepeis, I. Kolossvary, M. A. Moraes, F. D. Sacerdoti, J. K. Salmon, Y. Shan, D. E. Shaw, SC ′06: Proceedings of the 2006 ACM/IEEE Conference on Supercomputing, Tampa, FL, 2006. p. 43.
- 42. Harder E., Damm W., Maple J., Wu C., Reboul M., Xiang J. Y., Wang L., Lupyan D., Dahlgren M. K., Knight J. L., Kaus J. W., Cerutti D. S., Krilov G., Jorgensen W. L., Abel R., Friesner R. A., J. Chem. Theory Comput. 2016, 12, 281–296. [DOI] [PubMed] [Google Scholar]
- 43. Humphrey W., Dalke A., Schulten K., J. Mol. Graphics 1996, 14, 33–38. [DOI] [PubMed] [Google Scholar]
Associated Data
This section collects any data citations, data availability statements, or supplementary materials included in this article.
Supplementary Materials
As a service to our authors and readers, this journal provides supporting information supplied by the authors. Such materials are peer reviewed and may be re‐organized for online delivery, but are not copy‐edited or typeset. Technical support issues arising from supporting information (other than missing files) should be addressed to the authors.
Supporting Information
Supporting Information
Data Availability Statement
The data that support the findings of this study are available from the corresponding author upon reasonable request.