

Abstract
The reproductive division of labour is a hallmark of eusocial Hymenoptera. Females are either reproductive queens or non-reproductive workers. In ants, workers often display further task specialisation that is associated with variation in size and/or morphology. Because female polyphenism is typically under environmental control, it is thought epigenetic mechanisms (such as DNA methylation) play a central role since they mediate gene-by-environment interactions. Methylation of the growth-promoting gene epidermal growth factor receptor (egfr) was indeed shown to control worker size in a highly polymorphic ant. However, it remains unknown if egfr methylation could also regulate worker size in monomorphic species. By combining experimental pharmacology and molecular biology, we show that worker size is associated with egfr methylation in two monomorphic ants. Furthermore, we functionally demonstrate that EGFR signalling affects worker size. These results indicate that worker size regulation by egfr methylation has been mechanistically conserved in ants but remains unexploited in monomorphic species.
Subject terms: Epigenetics, Transcription, Development, Animal physiology
Introduction
Phenotypic plasticity occurs when a single genotype encodes multiple, diverse phenotypes1. Common in all living organisms, it is often highly adaptive. By altering their phenotypes in response to external cues, organisms can react to environmental changes, boosting survival and reproduction. Some of the most remarkable forms of phenotypic plasticity are found in social Hymenoptera (bees, wasps, and ants) where the same genotype can lead to morphologically, physiologically, and behaviourally distinct female castes: large, fertile queens that specialise in reproduction, and smaller, usually sterile workers that ensure colony maintenance2. Whether a female larva develops into a reproductive queen or a non-reproductive worker typically results from environmental (e.g., food quantity or quality) or social (e.g., queen and brood presence/absence) cues, which cause the baseline genome to express itself along different developmental lines3–5.
Unlike bees and wasps, numerous ant species exhibit a high degree of worker polymorphism, i.e. a colony’s workers can vary in size and/or morphology6,7. Worker size variation exists along a spectrum, ranging from monomorphism, where there are slight isometric differences, to dimorphism, where there are multiple, distinct worker subcastes that display marked, non-proportional differences in body features. Worker polymorphism has appeared repeatedly in Formicidae, suggesting that size-dependent division of labour in workers promotes colony fitness8–10.
Decades of research have been devoted to understanding the evolution and maintenance of worker polymorphism in ants. Yet, its genetic and developmental origins are only beginning to be deciphered. At the molecular level, body size is regulated by evolutionarily conserved growth-regulating pathways, such as the insulin/insulin-like growth factor signalling (IIS)11, target of rapamycin (TOR)12, and epidermal growth factor receptor (EGFR) signalling13. The pathways are triggered by dietary cues, causing cell-signalling cascades that promote cell growth, proliferation, and differentiation14. In insects, the result is the production of the growth-regulating hormones ecdysone15 and juvenile hormone (JH)11,13,16. However, it remains unknown how these pathways have become fine-tuned to generate worker size variation from the same genotype. Recently, it has been hypothesised that epigenetic mechanisms, such as DNA methylation, are at play because they mediate gene-by-environment interactions, translating environmental signals into long-lasting changes in gene expression without modifying the DNA itself17–19. Numerous studies have investigated whether DNA methylation influences queen-worker caste determination. In ants20,21 and the honey bee22,23, queens and workers have different DNA methylation patterns that are associated with differential gene expression and/or alternative splicing. In the honey bee, silencing the expression of the DNA-methyltransferase 3 gene, which is responsible for de novo DNA methylation, causes worker-destined larvae to become more queen-like24. However, multiple studies have failed to detect any caste-specific methylation signatures in ants25, wasps26, and honey bees27–29.
To our knowledge, a single study has explored how DNA methylation could affect worker size variation in social Hymenoptera. In the polymorphic ant Camponotus floridanus, which has highly variable sized workers, larval DNA methylation has been shown to regulate adult worker size. The growth-promoting gene epidermal growth factor receptor (egfr) is differentially methylated and expressed in larvae destined to become large workers (i.e., majors) versus small workers (i.e., minors)29. Furthermore, adult worker size can be changed by pharmacologically altering larval DNA methylation: when larvae undergo genome-wide hypomethylation, they grow into larger workers. In contrast, hypermethylated larvae develop into smaller workers. In this species, the methylation status of egfr generates most of the size variation within the worker caste30.
Here, we show that pharmacological alterations of egfr methylation is associated with worker size in two monomorphic ants belonging to distinct subfamilies, the Argentine ant Linepithema humile (subfamily Dolichoderinae) and the pharaoh ant Monomorium pharaonis (subfamily Myrmicinae) (Fig. 1), suggesting that worker size regulation by egfr methylation has been mechanistically conserved in the Formicidae.
Figure 1.

Worker size distributions for Linepithema humile and Monomorium pharaonis. The plots show the absolute frequencies of workers with different head widths. Both species exhibit a unimodal worker size distribution (i.e., workers are monomorphic). Images: L. humile: ©Phil Lester, used with permission; M. pharaonis: Зeмлepoйкин, CC BY-SA 4.0.
Results
We first confirmed that the worker caste in Linepithema humile and Monomorium pharaonis is monomorphic. Worker size distribution was based on measurements of adult workers sampled from the field or laboratory stock colonies, respectively (Fig. 1).
To address the role that DNA methylation plays in the regulation of worker size in monomorphic ants, we fed larvae with the pharmacological hypomethylating agent 5-Aza-2’-deoxycytidine (5-Aza-dC)31. In both L. humile and M. pharaonis, adult worker size was significantly greater for larvae given 5-Aza-dC versus the control solution (Fig. 2; Electronic Supplementary Table S2). Notably, 5-Aza-dC also altered the shape of the size distribution in both species; distribution appears skewed to large sizes as compared to the controls in L. humile, but to small worker size in M. pharaonis (Fig. 2; Electronic Supplementary Tables S2).
Figure 2.

Effect of 5-Aza-dC treatment on worker head width. Violin plots of (a) Linepithema humile and (b) Monomorium pharaonis callow head width. Workers were either sampled on the field (L. humile) or form laboratory colonies (M. pharaonis), or grew from experimental larvae given a control solution (1 M sucrose) or 5-Aza-dC during the first larval instar. Mean head width ± SD and sample size are indicated above each plot. The box’s midline indicates the median; the box’s lower and upper edges are the first and third quartiles, respectively. The whiskers reflect the extreme values. The shapes around the boxes are the kernel density distributions of the data. Differences in the letters above the violins indicate statistically significant differences in worker head width (Kruskal–Wallis test: p < 0.0001; Dunn’s post-hoc test with Bonferroni correction: p < 0.0001).
Since EGFR signalling plays a central role in controlling growth32 and egfr methylation regulates adult worker size in a polymorphic ant30, we then tested if treatment with 5-Aza-dC affected egfr methylation. In social Hymenoptera, DNA methylation mostly occurs in cytosine-phosphate-guanine dinucleotides (CpGs) of exons33,34. Because ants only grow during the larval development, we measured the methylation levels of several exonic CpGs of egfr at the prepupal stage, which marks the end of the larval development. For both species, egfr methylation was indeed affected by 5-Aza-dC; each CpG analysed was hypermethylated in the 5-Aza-dC versus the control prepupae (Fig. 3; Electronic Supplementary Table S4).
Figure 3.

Effect of 5-Aza-dC treatment on egfr methylation. Box plots of egfr CpG methylation levels for (a) Linepithema humile and (b) Monomorium pharaonis prepupae fed a control solution (1 M sucrose; in white) or 5-Aza-dC (in gray) when they were first-instar larvae. The CpGs are numbered from the beginning of the last exon for each species. Each box represents data for at least 8 samples; each sample was a pool of 10 prepupae. The box’s midline indicates the median; the box’s lower and upper edges are the first and third quartiles, respectively. The whiskers reflect the extreme values. Significant differences between the control and 5-Aza-dC-treated groups are indicated: *p < 0.05, **p < 0.01, ***p < 0.005 (Student’s t test or Mann–Whitney U test).
Comparison of the expression levels of egfr showed that it was significantly overexpressed in 5-Aza-dC-treated prepupae (mean fold change ± SD: L. humile—control = 1.18 ± 0.78, 5-Aza-dC = 9.88 ± 1.18, p < 0.01; M. pharaonis—control = 1.23 ± 0.78, 5-Aza-dC = 26.07 ± 11.59, p < 0.01; Fig. 4; Electronic Supplementary Table S5), showing that the pharmacological treatment affected egfr expression.
Figure 4.

Effect of 5-Aza-dC treatment on egfr and kr-h1 expression. Box plots of relative fold changes in (a,c) egfr and (b,d) kr-h1 expression for (a,b) Linepithema humile and (c,d) Monomorium pharaonis prepupae fed a control solution (1 M sucrose; in white) or 5-Aza-dC (in gray) when they were first-instar larvae. Each box represents data for 6 samples; each sample was a pool of 10 prepupae. The box’s midline indicates the median; the box’s lower and upper edges are the first and third quartiles, respectively. The whiskers reflect the extreme values. Significant differences between the control and 5-Aza-dC-treated groups are indicated: *p < 0.01 (Mann–Whitney U test).
EGFR signalling is known to regulate body size by affecting JH titers11, which in turn regulate the expression of the anti-metamorphic transcription factor krüppel-homolog 1 (kr-h1) in insects35,36. Therefore, we compared the expression of the JH-responsive gene kr-h1 between control versus 5-Aza-dC-treated prepupae. As for egfr, we found that 5-Aza-dC-treated prepupae overexpressed kr-h1 as compared to controls (L. humile: control = 1.13 ± 0.55, 5-Aza-dC = 4.12 ± 1.27, p < 0.01; M. pharaonis: control = 1.24 ± 0.81, 5-Aza-dC = 6.79 ± 2.01, p < 0.01; Fig. 4; Electronic Supplementary Table S5), which means JH titres were higher following 5-Aza-dC feeding.
To confirm the specific influence of EGFR signalling on worker size, we fed larvae with PD153035, a specific inhibitor of the EGFR protein (EGFRi) (see methods). As expected, treated larvae developed into significantly smaller adult workers than did the control larvae (L. humile only—Student’s t test: p < 0.0001; Fig. 5; Electronic Supplementary Table S6).
Figure 5.
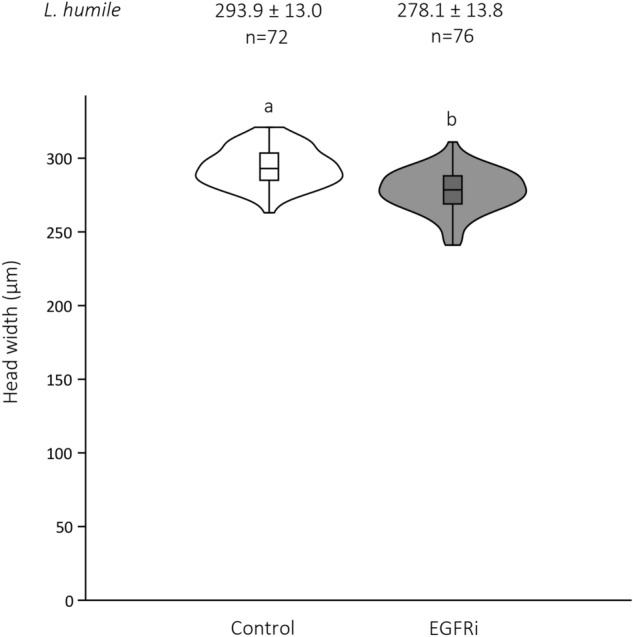
Effect of EGFRi treatment on worker head width. Violin plots of the head widths of Linepithema humile callows. Workers came out of two groups: larvae fed a control solution (1 M sucrose [diluted in DMSO]) versus larvae fed EGFRi (diluted in DMSO) during the first-instar stage. Mean head width ± SD and sample size are indicated above each plot. The box’s midline indicates the median; the box’s lower and upper edges are the first and third quartiles, respectively. The whiskers reflect the extreme values. The shapes around the boxes are the kernel density distributions of the data. Differences in the letters above the violins indicate statistically significant differences in worker head width (Student’s t test: p < 0.0001).
Thus, feeding larvae with the hypomethylating agent 5-Aza-dC increased levels of egfr methylation, egfr expression, and kr-h1 expression, which are known to be involved in size regulation30,32,35,36. Consistently, the treatment increased the adult size of workers in both species.
Discussion
These results show that worker size is associated with egfr methylation in two monomorphic ant species; they complement the previously established relationship between egfr methylation and worker size in a species with polymorphic workers30. We found that worker size could be pharmacologically increased in both L. humile and M. pharaonis by feeding larvae a hypomethylating agent, 5-Aza-dC. Although the size increase was relatively limited in magnitude, this result highlights that worker size is more plastic than observed under natural conditions. Prior research has noted the same trend in other ant species37–41. For instance, the ant genus Pheidole is dimorphic: workers are either small (minors) or large (majors). When late-instar Pheidole larvae were treated with JH, adult worker size dramatically increased and “super majors” emerged, a novel subcaste barely seen in nature39. It is intriguing that worker size plasticity does not appear to be fully exploited under normal ecological conditions. Indeed, polymorphic workers are thought to promote colony fitness by enhancing the division of labour6–8. Even in monomorphic ants, workers that vary slightly in size were found to display distinct behaviours40–43, suggesting that even limited size variation may be functionally adaptive. It could be that worker size plasticity is constrained under natural conditions because there is a trade-off between worker quantity and quality, where smaller, lower-quality workers are cheaper to create than larger, higher-quality workers9. This explanation fits with Argentine ant and pharaoh ant ecology. Both species are highly invasive, and their competitive dominance is largely mediated by worker abundance44,45. In the case of a trade-off, investing in larger workers could put colony fitness at risk.
When L. humile and M. pharaonis larvae were given 5-Aza-dC, egfr was hypermethylated at several CpGs in prepupae. It seems counterintuitive that a hypomethylating agent would lead to egfr hypermethylation. However, the effect of 5-Aza-dC on DNA methylation has been shown to be sequence-specific46. Previous research in social Hymenoptera has found that 5-Aza-dC can indeed cause local hypermethylation30,47–49. For instance, in C. floridanus, worker larvae fed 5-Aza-dC exhibited both genome-wide hypomethylation and local-level egfr hypermethylation30. A hypermethylating effect of 5-Aza-dC was also reported in plants50. This inverse relationship is thought to be mediated by crosstalk with other epigenetic mechanisms, such as histone post-translational modifications51 or non-coding RNAs52.
In both species, 5-Aza-dC feeding induced egfr overexpression. This result is consistent with the well-established positive relationship between egfr expression and growth53,54. The fact that worker size decreased in response to the EGFRi treatment confirms that EGFR signalling is directly involved in growth regulation in L. humile.
We found that the 5-Aza-dC treatment resulted in the overexpression of kr-h1 in L. humile and M. pharaonis, which also concurs with the growth-promoting effects of JH in ants. When JH is produced during specific periods of hormone sensitivity, larval moults replace metamorphic moults, lengthening larval development and ultimately boosting adult body size55. Here, we indeed observed that the 5-Aza-dC treatment slightly increased the duration of larval development in both species (see Electronic Supplementary Table S3). To achieve more pronounced developmental shifts, it may be necessary to use higher 5-Aza-dC concentrations or differently timed treatments. Furthermore, the tandem overexpression of egfr and kr-h1 supports the idea that EGFR signalling and JH production are positively correlated. However, because 5-Aza-dC likely affects the methylation of other genes as well, we cannot conclude that egfr overexpression was solely responsible for kr-h1 overexpression. For instance, the insulin/insulin-like growth factor signalling (IIS) pathway promotes JH production in social Hymenoptera5, and kr-h1 overexpression could result from IIS upregulation by 5-Aza-dC. That said, cross-activation occurs between EGFR and receptors of other growth-regulating pathways, which means that EGFR integrates signals prompted by multiple stimuli56,57. Therefore, the kr-h1 overexpression that we observed most likely resulted from crosstalk among several upregulated growth-promoting pathways, including the EGFR signalling system.
Taken together, our results indicate that egfr methylation and expression is consistently associated with worker body size in two monomorphic ants belonging to different subfamilies. Two important points must be stressed. First, we examined the effect of egfr methylation on worker size, not on caste determination. Indeed, queen-worker caste determination involves many phenotypic changes beyond body size. Thus, our work does not speak to caste determination. Second, although our study indicates that the association between egfr methylation and body size is conserved in ants, we did not demonstrate a direct causal relationship between egfr methylation and worker size. Notably, other genes may be participating as well. Further complementary work combining genome-wide DNA methylation analyses with emerging methylome editing technologies58 should make it possible to unequivocally establish causal links between DNA methylation and the diverse phenotypic traits underlying the ecological success of social Hymenoptera.
Methods
Sampling and rearing
Linepithema humile were collected in the field in Giens (southern France); Monomorium pharaonis were obtained from laboratory colonies reared at Copenhagen University (Department of Biology, Ecology, and Evolution). For both species, we set up large stock colonies that contained several dozens of queens, thousands of workers, and brood at all developmental stages. The colonies were maintained under laboratory conditions (L. humile: temperature = 25 ± 1 °C and relative humidity = ± 30%; M. pharaonis: temperature = 28 ± 1 °C and relative humidity = 50%; both: 12:12 light/dark cycle). Colonies were given sugar water ad libitum and received fresh cockroaches every other day.
Morphometric analyses
To quantify worker size variation, we measured worker head width (eyes excluded), an accurate proxy of worker size in ants59–61. All measurements were performed to the nearest 0.001 mm using a MZ6 stereomicroscope (Leica Microsystems, Wetzlar, Germany).
Pharmacological modification of DNA methylation
Larvae were individually fed 0.5 μl of 10 mM 5-Aza-dC (diluted in sucrose; Sigma-Aldrich, A3656), or 0.5 μl of 1 M sucrose (control solution). Then, 30 treatment or 30 control larvae were transferred into individual experimental nests containing 300 workers but no queens or brood. The experimental nests were checked every day, and emerging workers (i.e., callows) were removed and stored in 99% EtOH for later morphometric analysis. Since workers are completely sterile in both species, we were certain that the callows had developed from the experimental larvae.
The results revealed that the 5-Aza-dC treatment only significantly affected adult worker size when applied to the first-instar larvae (Supplementary Fig. S1; Electronic Supplementary Table S1). We therefore focused on first-instar larvae when repeating the 5-Aza-dC experiment for both species. Half of the larvae were left to develop into adults for the morphometric analyses. The other half were collected at the prepupal stage, flash frozen, and stored at −80 °C for subsequent methylation and gene expression analyses. The use of the prepupal stage for molecular analyses stems from the finding that 5-Aza-dC altered the developmental duration in both species studies. Therefore, by comparing control and 5-Aza-dC larvae at a specific developmental stage (prepupae), we ensured that the signal detected resulted from treatments (control vs 5-Aza-dC feeding), rather than from differences in developmental rates.
DNA methylation
The methylation of egfr was measured using direct bisulfite sequencing (dBS)62–64. We pooled ten individuals from each group to obtain enough biological material. Each pool was treated as a biological replicate.
We extracted genomic DNA using an SDS/proteinase K in-house protocol, which was followed by phenol–chloroform/chloroform washes and ethanol/sodium acetate precipitation. Genomic DNA fragmentation was assessed using agarose gel electrophoresis. Quantity and absorbance ratios were measured using a Qubit 2.0 fluorometer (Thermo Fisher Scientific) and a NanoDrop 1000 spectrophotometer (Thermo Fisher Scientific), respectively. Genomic DNA was treated with sodium bisulfite to convert unmethylated cytosines to uracils without affecting the methylated cytosines65. Bisulphite conversion was performed on 200-ng samples of genomic DNA using a Methylamp DNA Modification Kit (Epigentek, P-1001) in accordance with the manufacturer’s instructions.
We designed primers using MethPrimer v. 2.0 software66 with a view to amplifying a CpG-rich region in the last exon of egfr after bisulfite conversion. The sequence for egfr was obtained from the Hymenoptera Genome Database67. The PCR reactions consisted of 10 μl of 2× Multiplex Mastermix (Qiagen, 206143), 2 μl of 10 μM forward and reverse primers, 5 μl of ddH2O, and 1 μl of bisulphite-treated genomic DNA. Cycling conditions were as follows: 15 min at 95 °C; 35 cycles of 30 s at 94 °C, 90 s at 54 °C, and 90 s at 72 °C; and 10 min at 72 °C. Because bisulfite conversion reduces DNA complexity and therefore decreases PCR specificity, we extracted the target PCR products directly from agarose gels after carrying out overnight migration using a QIAquick Gel Extraction Kit (Qiagen, 28706).
We directly sequenced the gel-extracted PCR products using a 3730 DNA Analyser (Thermo Fisher Scientific) and a BigDye Terminator v. 3.1 Cycle Sequencing Kit (Thermo Fischer Scientific, 4337457). The sequencing reactions consisted of 2 μl of PCR products, 6 μl of ddH2O, 1 μl of BigDye, 2.1 μl of BigDye 5× buffer, and 0.2 μl of 10 μM forward primer. Each biological replicate was sequenced using technical triplicates. The methylation levels of each CpG were measured using CodonCode Aligner v. 9.0.1 software (CodonCode Corporation).
Gene expression
We measured egfr expression using reverse transcription quantitative real-time PCR (RT-qPCR). Total RNA was extracted using TRI Reagent (Thermo Fischer Scientific). RNA fragmentation, quantity, and absorbance ratios were assessed as described above. The relative expression of egfr and kr-h1 were quantified utilising the ΔΔCt method68 and rpl32 for normalisation69,70. The sequences were obtained from the Hymenoptera Genome Database65, and the primers were designed using NCBI primer BLAST software71.
Inhibition of the EGFR signalling pathway
First-instar larvae of L. humile were fed PD153035 (EMD Millipore, 234491), a compound that specifically inhibits EGFR tyrosine kinase activity, which is needed to activate the EGFR pathway, allowing downstream signalling, cell growth, and cell proliferation72. EGFRi has already been used successfully in another ant species30. The treatment larvae were given 0.5 μl of 10 μM EGFRi (diluted in 1 M sucrose and DMSO). The control larvae were given 1 M sucrose (diluted in DMSO). Each group’s larvae were then transferred into individual experimental nests. Callows were collected, and their body size was measured within a day of emergence.
Statistical analyses
We tested for data normality and heteroscedasticity using the Shapiro–Wilk test and Levene’s test, respectively. An appropriate statistical approach was then employed (parametric vs. non-parametric). All the statistical analyses were performed using Past4 software v. 4.1073.
Supplementary Information
Acknowledgements
We are grateful to J. J. Boomsma and R. S. Larsen for providing us M. pharaonis colonies, and to J. Pearce-Duvet for her language editing services.
Author contributions
T.R., C.G. and S.A. conceived the study; T.R. and S.A. collected biological samples on the field; T.R. carried out the experimental work and performed the data analyses; T.R. and S.A. drafted the manuscript. All authors gave final approval for the publication.
Funding
This work was supported by the Belgian Fonds de la Recherche Scientifique (FRS-FNRS) (grant no. T.0140.18 to S.A.; FRIA scholarship no. FC36257 to T.R) and by the Université Libre de Bruxelles (grant Actions Blanches to S.A.).
Data availability
All data generated or analysed during this study are included in this published article [and its supplementary information files].
Competing interests
The authors declare no competing interests.
Footnotes
Publisher's note
Springer Nature remains neutral with regard to jurisdictional claims in published maps and institutional affiliations.
Supplementary Information
The online version contains supplementary material available at 10.1038/s41598-022-25675-4.
References
- 1.Via S, et al. Adaptive phenotypic plasticity: Consensus and controversy. Trends Ecol. Evol. 1995;10:212–217. doi: 10.1016/S0169-5347(00)89061-8. [DOI] [PubMed] [Google Scholar]
- 2.Wilson EO. The Insects Societies. Harvard University Press; 1971. [Google Scholar]
- 3.Robinson GE, Fahrbach SE, Winston ML. Insect societies and the molecular biology of social behavior. BioEssays. 1997;19(12):1099–1108. doi: 10.1002/bies.950191209. [DOI] [PubMed] [Google Scholar]
- 4.Michener CD. The Bees of the World. Johns Hopkins University Press; 2007. [Google Scholar]
- 5.Corona M, Libbrecht R, Wheeler DE. Molecular mechanisms of phenotypic plasticity in social insects. Curr. Opin. Insect Sci. 2016;13:55–60. doi: 10.1016/j.cois.2015.12.003. [DOI] [PubMed] [Google Scholar]
- 6.Holldobler B, Wilson EO. The Ants. Harvard University Press; 1990. [Google Scholar]
- 7.Oster GF, Wilson EO. Caste and Ecology in the Social Insects. Princeton University Press; 1978. [PubMed] [Google Scholar]
- 8.Traniello JF. Foraging strategies of ants. Ann. Rev. Entomol. 1989;34(1):191–210. doi: 10.1146/annurev.en.34.010189.001203. [DOI] [Google Scholar]
- 9.Peeters C, Ito F. Wingless and dwarf workers underlie the ecological success of ants (Hymenoptera: Formicidae) Myrmecol. News. 2015;21:117–130. [Google Scholar]
- 10.La Richelière F, et al. Warm and arid regions of the world are hotspots of superorganism complexity. Proc. R. Soc. B. 2022;289(1968):20211899. doi: 10.1098/rspb.2021.1899. [DOI] [PMC free article] [PubMed] [Google Scholar]
- 11.Nijhout HF, McKenna KZ. The distinct roles of insulin signaling in polyphenic development. Curr. Opin. Insect Sci. 2018;25:58–64. doi: 10.1016/j.cois.2017.11.011. [DOI] [PubMed] [Google Scholar]
- 12.Koyama T, Mirth CK. Unravelling the diversity of mechanisms through which nutrition regulates body size in insects. Curr. Opin. Insect Sci. 2018;25:1–8. doi: 10.1016/j.cois.2017.11.002. [DOI] [PubMed] [Google Scholar]
- 13.Kamakura M. Royalactin induces queen differentiation in honeybees. Nature. 2011;473(7348):478–483. doi: 10.1038/nature10093. [DOI] [PubMed] [Google Scholar]
- 14.Hietakangas V, Cohen SM. Regulation of tissue growth through nutrient sensing. Ann. Rev. Genet. 2009;43:389–410. doi: 10.1146/annurev-genet-102108-134815. [DOI] [PubMed] [Google Scholar]
- 15.Cruz J, Martín D, Franch-Marro X. Egfr signaling is a major regulator of ecdysone biosynthesis in the Drosophila prothoracic gland. Curr. Biol. 2020;30(8):1547–1554. doi: 10.1016/j.cub.2020.01.092. [DOI] [PubMed] [Google Scholar]
- 16.Maestro JL, Cobo J, Bellés X. Target of rapamycin (TOR) mediates the transduction of nutritional signals into juvenile hormone production. J. Biol. Chem. 2009;284(9):5506–5513. doi: 10.1074/jbc.M807042200. [DOI] [PubMed] [Google Scholar]
- 17.Berger SL, Kouzarides T, Shiekhattar R, Shilatifard A. An operational definition of epigenetics. Genes Dev. 2009;23(7):781–783. doi: 10.1101/gad.1787609. [DOI] [PMC free article] [PubMed] [Google Scholar]
- 18.Bonasio R, Tu S, Reinberg D. Molecular signals of epigenetic states. Science. 2010;330:612–616. doi: 10.1126/science.1191078. [DOI] [PMC free article] [PubMed] [Google Scholar]
- 19.Maleszka R. Epigenetic integration of environmental and genomic signals in honey bees: The critical interplay of nutritional, brain and reproductive networks. Epigenetics. 2008;3:188–192. doi: 10.4161/epi.3.4.6697. [DOI] [PubMed] [Google Scholar]
- 20.Bonasio R, et al. Genome-wide and caste-specific DNA methylomes of the ants Camponotus floridanus and Harpegnathos saltator. Curr. Biol. 2012;22:1755–1764. doi: 10.1016/j.cub.2012.07.042. [DOI] [PMC free article] [PubMed] [Google Scholar]
- 21.Morandin C, Brendel VP, Sundström L, Helanterä H, Mikheyev AS. Changes in gene DNA methylation and expression networks accompany caste specialization and age-related physiological changes in a social insect. Mol. Ecol. 2019;28(8):1975–1993. doi: 10.1111/mec.15062. [DOI] [PubMed] [Google Scholar]
- 22.Lyko F, et al. The honey bee epigenomes: Differential methylation of brain DNA in queens and workers. PLoS Biol. 2010;8(11):e1000506. doi: 10.1371/journal.pbio.1000506. [DOI] [PMC free article] [PubMed] [Google Scholar]
- 23.Foret S, et al. DNA methylation dynamics, metabolic fluxes, gene splicing, and alternative phenotypes in honey bees. Proc. Natl. Acad. Sci. USA. 2012;109(13):4968–4973. doi: 10.1073/pnas.1202392109. [DOI] [PMC free article] [PubMed] [Google Scholar]
- 24.Kucharski R, Maleszka J, Foret S, Maleszka R. Nutritional control of reproductive status in honeybees via DNA methylation. Science. 2008;319(5871):1827–1830. doi: 10.1126/science.1153069. [DOI] [PubMed] [Google Scholar]
- 25.Libbrecht R, Oxley PR, Keller L, Kronauer DJC. Robust DNA methylation in the clonal raider ant brain. Curr. Biol. 2016;26(3):391–395. doi: 10.1016/j.cub.2015.12.040. [DOI] [PMC free article] [PubMed] [Google Scholar]
- 26.Patalano S, et al. Molecular signatures of plastic phenotypes in two eusocial insect species with simple societies. Proc. Natl. Acad. Sci. USA. 2015;112(45):13970–13975. doi: 10.1073/pnas.1515937112. [DOI] [PMC free article] [PubMed] [Google Scholar]
- 27.Harris KD, Lloyd JP, Domb K, Zilberman D, Zemach A. DNA methylation is maintained with high fidelity in the honey bee germline and exhibits global non-functional fluctuations during somatic development. Epigenet. Chromatin. 2019;12(1):1–18. doi: 10.1186/s13072-019-0307-4. [DOI] [PMC free article] [PubMed] [Google Scholar]
- 28.Cardoso-Júnior CA, et al. DNA methylation is not a driver of gene expression reprogramming in young honey bee workers. Mol. Ecol. 2021;30(19):4804–4818. doi: 10.1111/mec.16098. [DOI] [PubMed] [Google Scholar]
- 29.Oldroyd BP, Yagound B. The role of epigenetics, particularly DNA methylation, in the evolution of caste in insect societies. Philos. Trans. R. Soc. B. 2021;376(1826):20200115. doi: 10.1098/rstb.2020.0115. [DOI] [PMC free article] [PubMed] [Google Scholar]
- 30.Alvarado S, Rajakumar R, Abouheif E, Szyf M. Epigenetic variation in the Egfr gene generates quantitative variation in a complex trait in ants. Nat. Commun. 2015;6:6513. doi: 10.1038/ncomms7513. [DOI] [PubMed] [Google Scholar]
- 31.Jones PA, Taylor SM. Cellular differentiation, cytidine analogs and DNA methylation. Cell. 1980;20(1):85–93. doi: 10.1016/0092-8674(80)90237-8. [DOI] [PubMed] [Google Scholar]
- 32.Oda K, Matsuoka Y, Funahashi A, Kitano H. A comprehensive pathway map of epidermal growth factor receptor signaling. Mol. Syst. Biol. 2005;1(1):2005–2010. doi: 10.1038/msb4100014. [DOI] [PMC free article] [PubMed] [Google Scholar]
- 33.Zemach A, McDaniel IE, Silva P, Zilberman D. Genome-wide evolutionary analysis of eukaryotic DNA methylation. Science. 2010;328(5980):916–919. doi: 10.1126/science.1186366. [DOI] [PubMed] [Google Scholar]
- 34.Li-Byarlay H. The function of DNA methylation marks in social insects. Front. Ecol. Evol. 2016;4:57. doi: 10.3389/fevo.2016.00057. [DOI] [Google Scholar]
- 35.Minakuchi C, Zhou X, Riddiford LM. Krüppel homolog 1 (Kr-h1) mediates juvenile hormone action during metamorphosis of Drosophila melanogaster. Mech. Dev. 2008;125(1–2):91–105. doi: 10.1016/j.mod.2007.10.002. [DOI] [PMC free article] [PubMed] [Google Scholar]
- 36.Shpigler H, et al. The transcription factor Krüppel homolog 1 is linked to hormone mediated social organization in bees. BMC Evol. Biol. 2010;10(1):1–13. doi: 10.1186/1471-2148-10-120. [DOI] [PMC free article] [PubMed] [Google Scholar]
- 37.Cahan SH, Graves CJ, Brent CS. Intergenerational effect of juvenile hormone on offspring in Pogonomyrmex harvester ants. J. Comp. Physiol. B. 2011;181(8):991–999. doi: 10.1007/s00360-011-0587-x. [DOI] [PubMed] [Google Scholar]
- 38.Schmidt AM, Linksvayer TA, Boomsma JJ, Pedersen JS. Queen–worker caste ratio depends on colony size in the pharaoh ant (Monomorium pharaonis) Insectes Soc. 2011;58(2):139–144. doi: 10.1007/s00040-010-0126-x. [DOI] [Google Scholar]
- 39.Rajakumar R, et al. Ancestral developmental potential facilitates parallel evolution in ants. Science. 2012;335:79–82. doi: 10.1126/science.1211451. [DOI] [PubMed] [Google Scholar]
- 40.Herbers JM, Cunningham M. Social organization in Leptothorax longispinosus Mayr. Anim. Behav. 1983;31(3):759–771. doi: 10.1016/S0003-3472(83)80233-4. [DOI] [Google Scholar]
- 41.Westling JN, Harrington K, Bengston S, Dornhaus A. Morphological differences between extranidal and intranidal workers in the ant Temnothorax rugatulus, but no effect of body size on foraging distance. Insectes Soc. 2014;61(4):367–369. doi: 10.1007/s00040-014-0363-5. [DOI] [Google Scholar]
- 42.Grześ IM, Okrutniak M, Grzegorzek J. The size-dependent division of labour in monomorphic ant Lasius niger. Eur. J. Soil. Biol. 2016;77:1–3. doi: 10.1016/j.ejsobi.2016.08.006. [DOI] [Google Scholar]
- 43.Véle A, Modlinger R. Body size of wood ant workers affects their work division. Sociobiology. 2019;66(4):614–618. doi: 10.13102/sociobiology.v66i4.4596. [DOI] [Google Scholar]
- 44.Human KG, Gordon DM. Exploitation and interference competition between the invasive Argentine ant, Linepithema humile, and native ant species. Oecologia. 1996;105(3):405–412. doi: 10.1007/BF00328744. [DOI] [PubMed] [Google Scholar]
- 45.Wetterer JK. Worldwide spread of the pharaoh ant, Monomorium pharaonis (Hymenoptera: Formicidae) Myrmecol. News. 2010;13:115–129. [Google Scholar]
- 46.Seelan RS, Mukhopadhyay P, Pisano MM, Greene RM. Effects of 5-Aza-2′-deoxycytidine (decitabine) on gene expression. Drug Metab. Rev. 2018;50(2):193–207. doi: 10.1080/03602532.2018.1437446. [DOI] [PubMed] [Google Scholar]
- 47.Cook N, Parker DJ, Tauber E, Pannebakker BA, Shuker DM. Validating the demethylating effects of 5-aza-2′-deoxycytidine in insects requires a whole-genome approach: (A reply to Ellers et al.) Am. Nat. 2019;194(3):432–438. doi: 10.1086/704248. [DOI] [PubMed] [Google Scholar]
- 48.Pozo MI, et al. The effect of DNA methylation on bumblebee colony development. BMC Genom. 2021;22(1):1–11. doi: 10.1186/s12864-021-07371-1. [DOI] [PMC free article] [PubMed] [Google Scholar]
- 49.Amarasinghe HE, Clayton CI, Mallon EB. Methylation and worker reproduction in the bumble-bee (Bombus terrestris) Proc. R. Soc. B. 2014;281:20132502. doi: 10.1098/rspb.2013.2502. [DOI] [PMC free article] [PubMed] [Google Scholar]
- 50.Liu S, et al. The methylation inhibitor 5-Aza-2′-deoxycytidine induces genome-wide hypomethylation in rice. Rice. 2022;15(1):1–12. doi: 10.1186/s12284-021-00548-y. [DOI] [PMC free article] [PubMed] [Google Scholar]
- 51.Cedar H, Bergman Y. Linking DNA methylation and histone modification: Patterns and paradigms. Nat. Rev. Genet. 2009;10(5):295–304. doi: 10.1038/nrg2540. [DOI] [PubMed] [Google Scholar]
- 52.Csankovszki G, Nagy A, Jaenisch R. Synergism of Xist RNA, DNA methylation, and histone hypoacetylation in maintaining X chromosome inactivation. J. Cell Biol. 2001;153(4):773–784. doi: 10.1083/jcb.153.4.773. [DOI] [PMC free article] [PubMed] [Google Scholar]
- 53.Herbst RS. Review of epidermal growth factor receptor biology. Int. J. Radiat. Oncol. Biol. Phys. 2004;59(2):S21–S26. doi: 10.1016/j.ijrobp.2003.11.041. [DOI] [PubMed] [Google Scholar]
- 54.Dabour N, et al. Cricket body size is altered by systemic RNAi against insulin signaling components and epidermal growth factor receptor. Dev. Growth Differ. 2011;53(7):857–869. doi: 10.1111/j.1440-169X.2011.01291.x. [DOI] [PubMed] [Google Scholar]
- 55.Nijhout HF, Wheeler DE. Juvenile hormone and the physiological basis of insect polymorphisms. Q. Rev. Biol. 1982;57(2):109–133. doi: 10.1086/412671. [DOI] [Google Scholar]
- 56.Oliveira S, Schiffelers RM, Storm G, Henegouwen PMP, Roovers RC. Crosstalk between epidermal growth factor receptor-and insulin-like growth factor-1 receptor signaling: Implications for cancer therapy. Curr. Cancer Drug Targets. 2009;9(6):748–760. doi: 10.2174/156800909789271495. [DOI] [PubMed] [Google Scholar]
- 57.Berasain C, et al. Epidermal growth factor receptor (EGFR) crosstalks in liver cancer. Cancers. 2011;3(2):2444–2461. doi: 10.3390/cancers3022444. [DOI] [PMC free article] [PubMed] [Google Scholar]
- 58.Liu XS, et al. Editing DNA methylation in the mammalian genome. Cell. 2016;167(1):233–247. doi: 10.1016/j.cell.2016.08.056. [DOI] [PMC free article] [PubMed] [Google Scholar]
- 59.Porter SD. Fast, accurate method of measuring ant head widths. Ann. Entomol. Soc. Am. 1983;76(5):866–867. doi: 10.1093/aesa/76.5.866. [DOI] [Google Scholar]
- 60.Peeters C, Molet M, Lin CC, Billen J. Evolution of cheaper workers in ants: A comparative study of exoskeleton thickness. Biol. J. Linn. Soc. 2017;121(3):556–563. doi: 10.1093/biolinnean/blx011. [DOI] [Google Scholar]
- 61.Kaspari M, Weiser MD. The size–grain hypothesis and interspecific scaling in ants. Funct. Ecol. 1999;13(4):530–538. doi: 10.1046/j.1365-2435.1999.00343.x. [DOI] [Google Scholar]
- 62.Frommer M, et al. A genomic sequencing protocol that yields a positive display of 5-methylcytosine residues in individual DNA strands. Proc. Natl. Acad. Sci. USA. 1992;89(5):1827–1831. doi: 10.1073/pnas.89.5.1827. [DOI] [PMC free article] [PubMed] [Google Scholar]
- 63.Jiang M, et al. Rapid quantification of DNA methylation by measuring relative peak heights in direct bisulfite-PCR sequencing traces. Lab. Investig. 2010;90(2):282–290. doi: 10.1038/labinvest.2009.132. [DOI] [PubMed] [Google Scholar]
- 64.Parrish RR, Day JJ, Lubin FD. Direct bisulfite sequencing for examination of DNA methylation with gene and nucleotide resolution from brain tissues. Curr. Protoc. Neurosci. 2012;60(1):7–24. doi: 10.1002/0471142301.ns0724s60. [DOI] [PMC free article] [PubMed] [Google Scholar]
- 65.Hayatsu H, Wataya Y, Kai K, Iida S. Reaction of sodium bisulfite with uracil, cytosine, and their derivatives. Biochemistry. 1970;9(14):2858–2865. doi: 10.1021/bi00816a016. [DOI] [PubMed] [Google Scholar]
- 66.Li LC, Dahiya R. MethPrimer: Designing primers for methylation PCRs. Bioinformatics. 2002;18(11):1427–1431. doi: 10.1093/bioinformatics/18.11.1427. [DOI] [PubMed] [Google Scholar]
- 67.Elsik CG, et al. Hymenoptera genome database: Integrating genome annotations in HymenopteraMine. Nucleic Acids Res. 2006;44:D793–800. doi: 10.1093/nar/gkv1208. [DOI] [PMC free article] [PubMed] [Google Scholar]
- 68.Livak KJ, Schmittgen TD. Analysis of relative gene expression data using real-time quantitative PCR and the 2− ΔΔCT method. Methods. 2001;25(4):402–408. doi: 10.1006/meth.2001.1262. [DOI] [PubMed] [Google Scholar]
- 69.Gospocic J, et al. The neuropeptide corazonin controls social behavior and caste identity in ants. Cell. 2017;170(4):748–759. doi: 10.1016/j.cell.2017.07.014. [DOI] [PMC free article] [PubMed] [Google Scholar]
- 70.Sheng L, et al. Social reprogramming in ants induces longevity-associated glia remodeling. Sci. Adv. 2020;6(34):eaba9869. doi: 10.1126/sciadv.aba9869. [DOI] [PMC free article] [PubMed] [Google Scholar]
- 71.Ye J, et al. Primer-BLAST: A tool to design target-specific primers for polymerase chain reaction. BMC Bioinform. 2012;13(1):1–11. doi: 10.1186/1471-2105-13-S6-S1. [DOI] [PMC free article] [PubMed] [Google Scholar]
- 72.Fry DW, et al. A specific inhibitor of the epidermal growth factor receptor tyrosine kinase. Science. 1994;265(5175):1093–1095. doi: 10.1126/science.8066447. [DOI] [PubMed] [Google Scholar]
- 73.Hammer O, Harper DAT, Ryan PD. PAST: Paleonthological Statistics software package for education and data analysis. Palaeontol. Electron. 2001;4(1):1–9. [Google Scholar]
Associated Data
This section collects any data citations, data availability statements, or supplementary materials included in this article.
Supplementary Materials
Data Availability Statement
All data generated or analysed during this study are included in this published article [and its supplementary information files].