

Abstract
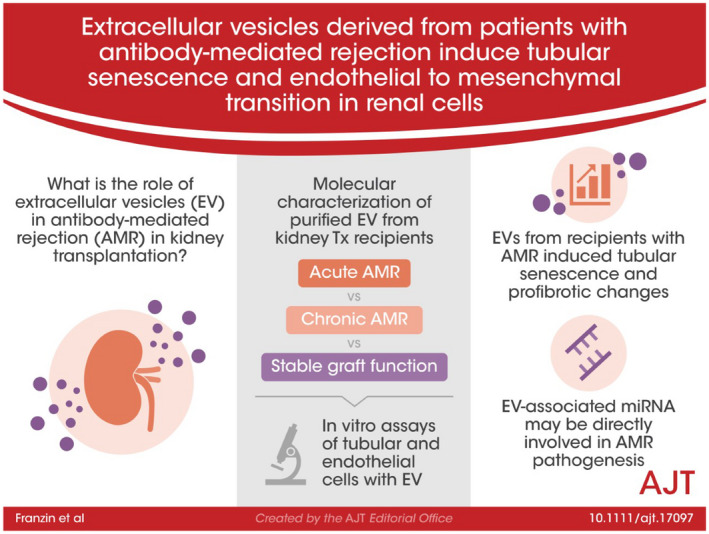
Extracellular vesicles (EV) are emerging mediators in several diseases. However, their role in the pathophysiology of antibody‐mediated allograft rejection (AMR) has been poorly investigated. Here, we investigated the role of EV isolated from AMR patients in inducing tubular senescence and endothelial to mesenchymal transition (EndMT) and analyzed their miRNA expression profile. By multiplex bead flow cytometry, we characterized the immunophenotype of plasma AMR‐derived EV and found a prevalent platelet and endothelial cell origin. In vitro, AMR‐derived EV induced tubular senescence by upregulating SA‐β Gal and CDKN1A mRNA. Furthermore, AMR‐derived EV induced EndMT. The occurrence of tubular senescence and EndMT was confirmed by analysis of renal biopsies from the same AMR patients. Moreover, AMR‐derived EV induced C3 gene upregulation and CFH downregulation in tubular epithelial cells, with C4d deposition on endothelial cells. Interestingly, RNase‐mediated digestion of EV cargo completely abrogated tubular senescence and EndMT. By microarray analysis, miR‐604, miR‐515‐3p, miR‐let‐7d‐5p, and miR‐590‐3p were significantly upregulated in EV from AMR group compared with transplant controls, whereas miR‐24‐3p and miR‐29a‐3p were downregulated. Therefore, EV‐associated miRNA could act as active player in AMR pathogenesis, unraveling potential mechanisms of accelerated graft senescence, complement activation and early fibrosis that might lead to new therapeutic intervention.
Keywords: antibody‐mediated allograft rejection, aging, cellular senescence, complement system, extracellular vesicles, miRNA
Plasma‐derived extracellular vesicles from kidney transplant patients with antibody‐mediated rejection induced endothelial‐to‐mesenchymal transition and senescence in tubular epithelial cells by modulating complement activation. Dieudé and Hébert comment on page 2131
Abbreviations
- AAMR
acute antibody‐mediated rejection
- AKI
acute kidney injury
- AMR
antibody‐mediated rejection
- CAMR
chronic antibody‐mediated rejection
- EndMT
endothelial to mesenchymal transition
- EV
extracellular vesicles
- SASP
senescence‐associated secretory phenotype
- TX Ctrl
control transplanted recipients
1. INTRODUCTION
Antibody‐mediated allograft rejection (AMR) represents the leading cause of graft failure in renal transplant patients. 1 , 2 Current methods for surveillance and diagnosis of AMR rely on donor specific antibodies detection. 3 However, early diagnostic approaches are lacking and mechanisms underlying acute and chronic AMR are still poorly understood.
Extracellular vesicles (EV) are membrane bound particles able to influence genome and proteome of target cells through the transfer of their biologically active cargo (i.e., DNA, miRNA, mRNA, proteins, or lipids). 4 Recent evidences shed a new light on the pivotal role of EV in several kidney diseases, such as acute kidney injury (AKI), diabetic nephropathy, renal cell carcinoma, or glomerulonephritis. 5 , 6 , 7 In the context of solid organ transplantation, EV genomic and proteomic profiling have been described as promising source of biomarkers, reducing the need of high invasive renal biopsy. 8 When compared with whole blood or kidney biopsies, high‐throughput analysis, EV showed important advantages. Firstly, the lipid bilayer of EV can protect nucleic acids from degradation and proteins from proteolytic cleavage during transiting into the extracellular environment. Secondly, circulating EV could be considered as the vehicle of damage signal, reflecting the state of inflammation of an organ or tissue.
From a molecular perspective, recent investigations support the concept that acute and chronic stress in transplantation (i.e., overwhelming immunological response, oxidative stress and DNA damage) can induce a premature renal aging 9 , 10 leading to the common histological features often observed in elderly patients. 11 , 12 , 13
The aim of our study was to investigate the effect of AMR plasma‐derived EV in vitro and to explore overall expression profile of EV‐associated miRNA profile in acute (AAMR), chronic (CAMR) rejection compared with stable graft function (TX Ctrl) recipients.
2. METHODS
2.1. Patient recruitment
Patients were recruited from Department of Translational Medicine, University of Eastern Piedmont, Novara and Department of Emergency and Organ Transplantation, University of Bari, Italy. All patients presented written informed consent for the use of this material for research purposes.
We enrolled 39 kidney transplant recipients who were transplanted between January 2009 and August 2016 in the two centers. Among these patients, 14 developed biopsy‐proven acute AMR (AAMR), 14 presented biopsy‐proven chronic AMR (CAMR) and 11 patients presented a stable graft function (TX Ctrl). In addition, as additional control, healthy volunteers collected‐EV were also used (n = 5).
AMR was diagnosed based on the Banff 2013 classification. One‐third of AMR patients showed positive glomerular and peritubular C4d staining. Median age of recipient was 48.8 years (range 26–60) for AAMR, 49 years (24–61) for CAMR and 61 years (36–75) for TX Ctrl group. AMR developed at median 12.5 months posttransplant, whereas CAMR developed at a median of 7 years after transplantation. Maintenance immunosuppression regimen encompassed calcineurin inhibitors (tacrolimus 95%, cyclosporine A 5%), mycophenolate mofetil as antiproliferative agent and corticosteroids (Table 1).
TABLE 1.
Demographical and clinical data of patients reporting antibody‐mediated rejection acute (AAMR) or chronic (CAMR) and stable graft patients (Tx Ctrl).
| Characteristic | AAMR recipients (n = 14) | CAMR recipients (n = 14) | Tx CTRL (n = 11) | |||
|---|---|---|---|---|---|---|
| Recipient age median (range) | 48.5 (26–60) | 49 (24–61) | 61 (39–75) | |||
| Sex (%) | ||||||
| Male | 64.29 | 78.57 | 81.82 | |||
| Female | 35.71 | 21.43 | 18.18 | |||
| Time from date of biopsy to date of Tx (months) | 12.56 | 93.14 | 35 | |||
| Cause of renal failure | IgA glomerulonephritis n = 8 | IgA glomerulonephritis n = 9 | IgA glomerulonephritis n = 4 | |||
| Membranous glomerulonephritis n = 2 | Membranous glomerulonephritis n = 4 | Membranous glomerulonephritis n = 1 | ||||
| Malformative nephropathy n = 1 | Adult polycystic kidney disease n = 1 | Unknown n = 6 | ||||
| Adult polycystic kidney disease n = 1 | ||||||
| Alport syndrome n = 1 | ||||||
| Renal carcinoma n = 1 | ||||||
| Immunosuppression regimen | Calcineurin inhibitors: | Calcineurin inhibitors: | Calcineurin inhibitors: | |||
| Cyclosporine A | 5% | Cyclosporine A | 5% | Cyclosporine A | 5% | |
| Tacrolimus: | 95% | Tacrolimus: | 95% | Tacrolimus: | 95% | |
| Antiproliferative agents | Antiproliferative agents | Antiproliferative agents | ||||
| Azathioprine | 0% | Azathioprine | 0% | Azathioprine | 0% | |
| MMF | 100% | MMF | 100% | MMF | 100% | |
| Corticosteroids | 90% | Corticosteroids | 90% | Corticosteroids | 90% | |
| Serum creatinine (at biopsy) | 2.94 ± 1.23 | 1.9 ± 0.48 | 2.15 ± 0.49 | |||
| Donor Specific Antibodies | 25% | 20% | 5% | |||
2.2. Characterization of EV
Plasma purified EV were characterized as previously described, 14 , 15 according to the criteria suggested by ISEV 2018 guideline. 4 For further details, see Supporting Information.
2.3. EV stimulation of renal tubular epithelial and endothelial cells
RPTEC (human renal proximal tubular epithelial cells) between 3 and 5 passages and human umbilical vein endothelial cells lines (HUVEC) (ATCC‐LGC Standards, Italy) were grown in RGEM medium (Lonza) and EndGro (Merck Millipore). Cells were exposed to AMR‐derived EV and TX Ctrl, healthy control EV at concentration of 5e+4 EV/ target cells for 24 and 48 h.
2.4. RNA extraction and qPCR analysis
Total RNA was isolated with RNeasy Mini Kit (Qiagen) according to the manufacturer's instructions and quantified by NanoDrop ND‐1000 Spectrophotometer (Thermo Fisher Scientific). Retrotranscription was performed using the iScript cDNA Synthesis Kit (Bio‐Rad). qPCR was performed with SsoAdvanced™ Universal SYBR® Green Supermix (Biorad) and the Light Cycler@96 (Roche). The relative amounts of mRNA were normalized to β‐actin mRNA as the housekeeping gene. Data were analyzed using the ΔΔCt method. 16 Primer sequences for these genes are given in Table S1.
2.5. FACS analysis
The immunophenotype of endothelial cells was analyzed by FACS analysis as already described. 17 See Supporting Information.
2.6. Immunohistochemistry and confocal laser scanning microscopy
Renal formalin fixed‐paraffin embedded biopsies of the same patients enrolled for EV isolation were processed as previously described 17 , 18 , 19 and are indicated in Supporting Information.
2.7. RNA extraction from EV and miRNA analysis
RNA extraction was performed from EV by miRNeasy mini kit (Qiagen, cat no. 217004). The EV′ total RNA quantification was assessed using NanoDrop 1000 and the Qubit 2.0. Fluorometer.
RNA samples were processed using the Agilent’s miRNA complete labeling and hybridization kit and hybridized on SurePrint human miRNA microarrays (protocol v.3.1.1 [G4170‐90011]).
The Agilent microarray data are Minimum Information About a Microarray Experiment (MIAME) compliant, and raw data are accessible through Experiment Array Express accession number E‐MTAB‐10447.
2.8. Microarray data analysis
Microarray data analysis was performed using Agilent Feature Extraction Software and Genespring software. The raw expression signals were log‐transformed, normalized, and filtered for microarray analysis according to the quantile corrected signal of all miRNAs with an intensity of 100, resulting in the selection of 327 miRNAs from the original collection of 1205 miRNAs. Using a moderate t‐test, miRNAs showing differential expression between various comparison groups were detected. Probe sets were sorted according to a significant p‐value and adjusted to account for multiple tests using the Benjamini‐Hochberg FDR method. We applied a filter with FDR of 0.05 and a fold change <2 to determine the features that were differentially expressed. PCA was carried out using tools from Genespring (Agilent Technologies).
2.9. miRNA target analysis
We used computational algorithms to identify the validated and predicted interactions between miRNA dataset and mRNA targets. The algorithms used were: TargetScan 5.2 (http://www.targetscan.org/), miRTarBase47 and DIANA TarBase v7.04 and miRBase 17.0 (http://microrna.sanger.ac.uk).
2.10. Statistical analysis
All results were analyzed using GraphPad Prism 5.0 (GraphPad software, Inc.) with the integrated tests: nonparametric Kruskal–Wallis test (or Mann‐Whitney U test) and the Dunn’s multiple comparison post hoc test. Significance was considered at p < .05. All in vitro results represented the means of at least three independent experiments.
3. RESULTS
3.1. Platelet and endothelial cells are the main source of plasma EV in patients with AMR
We first investigated the size and the concentration of EV with nanoparticle tracking analysis (NTA) by Nanosight. By Kruskal–Wallis test, we found a significant difference in the number of EV among the four groups analyzed. In particular, we found an increased number of EV in AAMR group compared with CAMR by multiple comparison test (p = .02, Dunn's post hoc test) (Figure 1A). Plasma purified EV showed a homogenous pattern of spheroid particles with a size ranging from 60 to 170 nm as seen by Nanosight analysis and then confirmed by transmission electron microscopy (Figure 1B,C).
FIGURE 1.
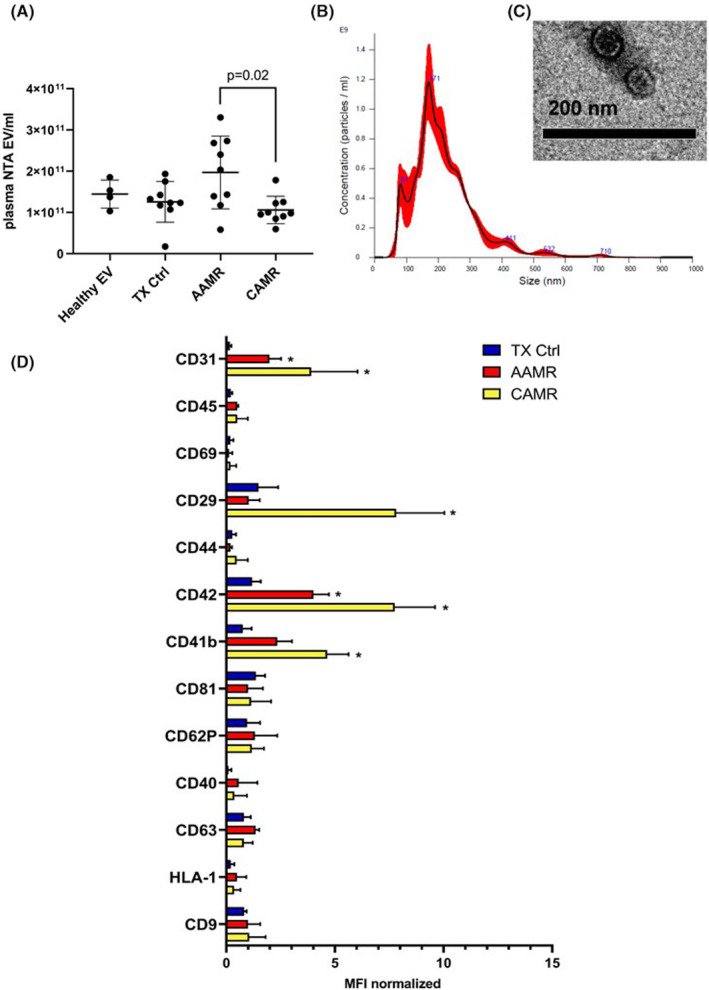
Characterization and quantization of AMR‐derived EV. (A) Quantization of EV isolated from plasma of AMR patients was assessed by nanoparticle tracking analysis (Nanosight™ technology, NTA EV/ml) after isolation by ultracentrifugation. Kruskal–Wallis test (p = .031) revealed a significant difference among all groups (Healthy EV n = 5, for TX Ctrl, AAMR and CAMR n = 9). Dunn’s multiple comparisons post hoc test confirmed a significant increase in the number of EV in the AAMR group compared with the CAMR (p = .02). (B) Size distribution of plasma EV by nanoparticle tracking analysis. (C) Representative transmission electron microscopy showing EV size of a TX Ctrl patient. (D) Multiplex bead‐based flow cytometry analysis was performed by MACsplex exosome capture beads containing a cocktail of 39 different markers. Experiments were performed with EV from four patients for TX Ctrl, AAMR, and CAMR groups, graph indicated values after normalization of the raw median fluorescence intensity (MFI). Raw MFI was subtracted with the MFI of the negative/blank control used in the same run experiment to avoid nonspecific signals. Values below the corresponding control were indicated as negative and were not showed. (TX CTRL, AAMR, and CAMR n = 4, data are expressed as mean ± SD; *p value < .05, Kruskal–Wallis test.) [Color figure can be viewed at wileyonlinelibrary.com]
Next, we evaluated EV phenotype by MACS multiplex bead‐based flow cytometry assay described recently. 20 , 21 Data analysis revealed that EV were positive for tetraspanins CD9, CD81, and CD63. Moreover, platelet markers (CD41b, CD42) and endothelial markers such as CD31 were increased in CAMR and AAMR compared with TX Ctrl. Extracellular vesicles adhesion molecules (CD29) was significantly augmented in CAMR. AMR‐EV were negative for epithelial makers as CD326 (epithelial cell adhesion molecule, EpCAM), mesenchymal markers (CD105). Moreover, EV exhibited low detectable expression of leukocyte (CD45) and antigen presenting cells markers (CD40, Figure 1D).
3.2. EV from AMR patients induced cellular senescence in RPTEC culture
To elucidate the role of EV on renal cells, we cultured tubular epithelial cells in the presence of AMR‐derived EV. Compared with untreated cells and to EV‐derived from healthy control, RPTEC exposed to AMR‐derived EV showed reduced proliferation (Figure 2A) without induction of early/late apoptosis or necrosis (Figure S1A). Next, we performed SA‐β‐gal staining in RPTEC to assess the occurrence of cellular senescence, defined as a state of stable growth arrest in the absence of apoptosis. Compared with untreated cells and to healthy control EV (Figure 2B), we found that acute and chronic AMR‐derived EV significantly induced cellular senescence as measured by the increased number of SA‐β‐gal‐positive cells (Figure 2B). Furthermore, we decided to evaluate the mRNA levels of cell cycle arrest markers as p21 together with well‐known anti‐aging factors such as Klotho. 19 , 22 , 23 Interestingly, in RPTEC exposed to AMR‐derived EV, we found a statistically significant augment of p21 waf1/cip1 (CDKN1A) and IL‐6 transcripts and a reduction in KL mRNA levels (Figure 2C–E). Taken together, these data suggest that AMR‐derived EV can induce the establishment of a senescence state in RPTEC, as observed by a stable cell cycle arrest without apoptosis and the positivity to the common senescent and Senescence‐Associated Secretory Phenotype (SASP) markers. 24 Based on the data obtained in cell culture, we then decided to evaluate whether the tubular senescence and parenchymal SASP occurred also in renal biopsies of the same patients with diagnosis of acute and chronic AMR (Figure 3). For that purpose, we stained for P16ink4a, a cell cycle inhibitor associated with senescence whose increased expression has been linked to the biological renal aging 9 and for IL‐6, one the most important SASP marker.
FIGURE 2.
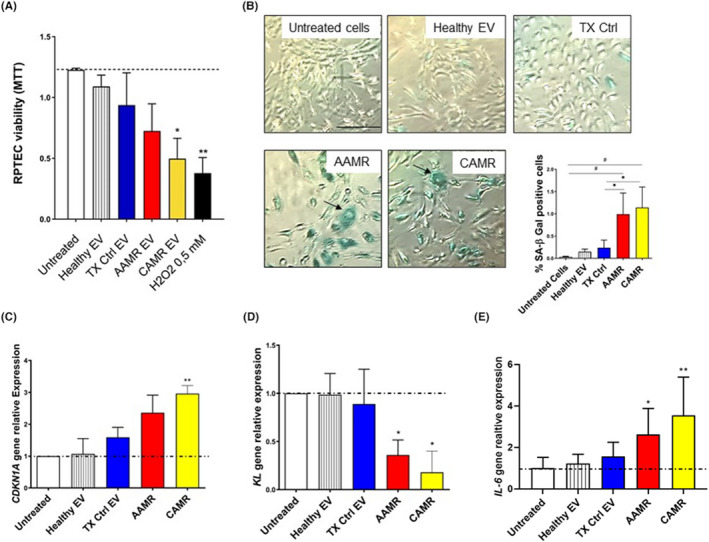
AMR‐derived EV induced cellular senescence in RPTEC culture. (A) RPTEC were plated in 96‐well plate, treated with EV purified from plasma of AMR patients (5e+4 EV/cells target for 24 h) and MTT assay was performed. Untreated cells (indicated as basal), cell exposed to healthy EV and to TX Ctrl patients were used as controls. H2O2 (0.5 mM) was used as positive control for cell viability reduction. Data represent the mean ± SD; n = 3, *p < .05, **p < .01, one‐way ANOVA nonparametric test. (B) SA‐β Gal staining in RPTEC treated with EV purified from AMR patients plasma in early passage RPTEC (5e+4 EV/cells target for 24 h). Increased SA‐β‐Gal+ cells were observed after AAMR and CAMR EV exposition. Compared with untreated cells and to healthy EV and TX Ctrl EV exposed cells, AAMR, and CAMR EV‐treated cells were positive to SA‐β Gal, appeared enlarged, with formation of larger and polynucleated cells (arrows and boxes). H2O2 (0.5–1 mM) exposed cells were used as positive control of senescence (not showed). Scale bar: 200 μm. The graph shows the quantification of SA‐β‐Gal+ cells. The ratio of cells positive for SA‐β‐gal activity was calculated in five not overlapping fields per condition (six‐well plate). Data are shown as mean ± SD of three independent experiments and the medians were analyzed by Kruskal–Wallis test (p < .05 between all groups) with an option for multiple comparisons (#p < .01 vs. untreated cells, *p < .05 vs. TX Ctrl). (C) Gene expression of p21 waf1/cip1 (CDKN1A), (D) KL and IL‐6 evaluated by qPCR in RPTEC exposed to EV for 24 h (5e+4 EV/cells target). Data were normalized to β‐actin housekeeping gene. Data are shown as mean ± SD of three independent experiments and the medians were analyzed by Mann–Whitney U test. *p < .05, **p < .01. H2O2 at 0.3–0.5 mM exposed cells were used as positive control of senescence.
FIGURE 3.
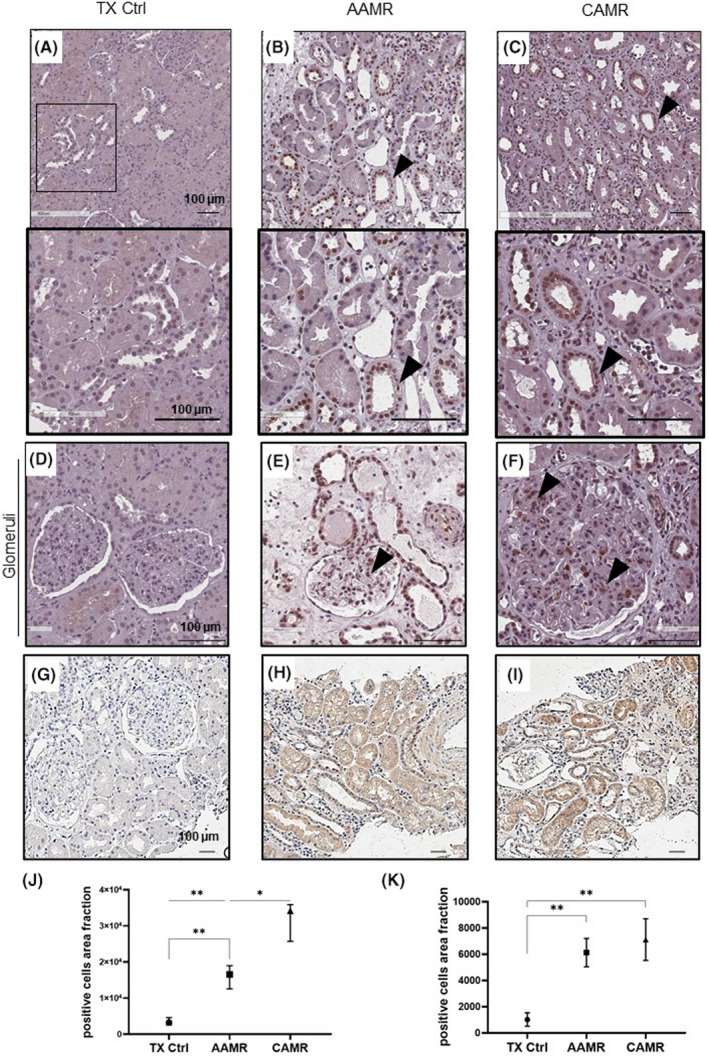
Increased p16INK4a expression in renal biopsies of AMR patients. Immunohistochemical stainings showing the p16INK4a expression in kidney biopsies at tubular (A–C) and glomerular level (D–F) and IL‐6 (G–I). IHC was performed on paraffin kidney sections. Arrows indicate positive tubular staining. Fields indicated by arrows in A–C, field indicated is enlarged at the bottom. Tubular and glomerular p16 expression in AAMR (B, E) and in CAMR (C, F) was increased compared with TX Ctrl biopsies (A, D). Scale bar as indicated (100 μm). (J) Graphical representation of p16INK4a and IL‐6 (K) expression level reported as the ratio of no. positive cells/500 μm2 in the different groups. Data are displayed as median plus interquartile range and were analyzed by Kruskal–Wallis test with an option for multiple comparison (Tukey’s multiple comparisons test) (n = 8,*p < .05, **p < .01).
We found that patients with AAMR and CAMR presented increased tissue expression of tubular nuclear senescence marker p16INK4a and IL‐6 compared with TX Ctrl biopsies. Importantly, also glomerular cells appeared positive to p16 staining particularly in CAMR group.
3.3. EV from AMR patients induced endothelial to mesenchymal transition (EndMT)
We then decide to evaluate the effect of AMR‐derived EV on endothelial cells. Firstly, MTT test revealed that the endothelial cell treated with AMR‐derived EV did not show reduced proliferation compared with untreated cells (Figure 4A). By FACS analysis, we found that AMR‐derived EV induced EndMT by decreasing significantly constitutive endothelial markers, such as CD31 and VE‐cadherin. Furthermore, we observed an increased level of fibroblast markers, such as Vimentin expression with the production of Collagen I (Figure 4B). Representative plots are shown in Figure S2. Taken together, these data indicated that AMR‐derived EV promoted EndMT.
FIGURE 4.
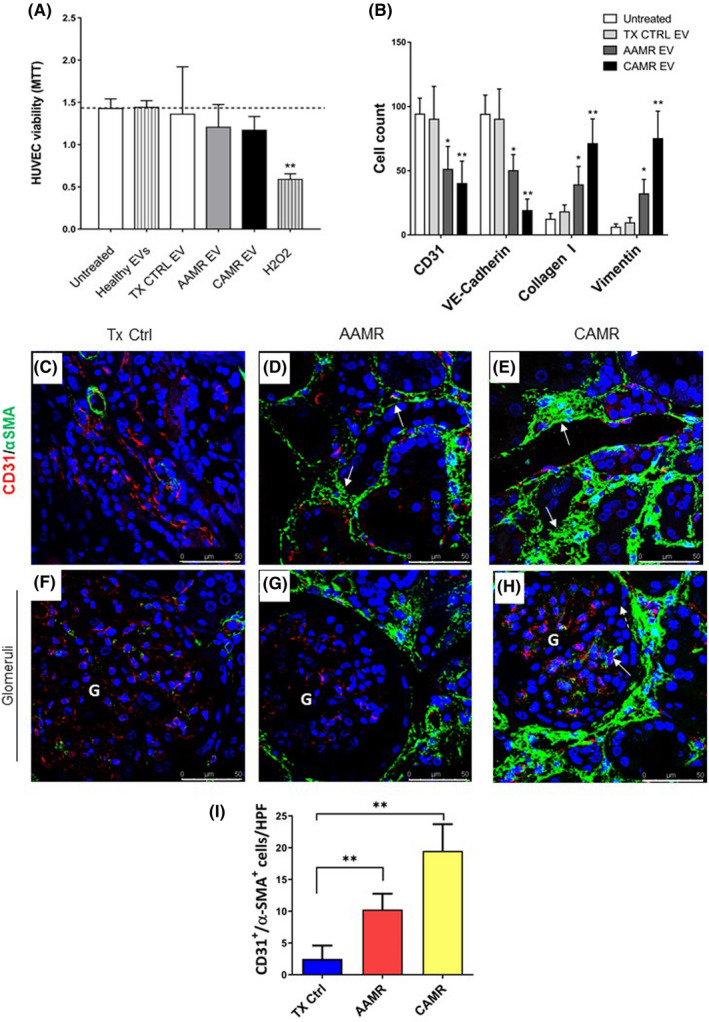
AMR patients‐derived EV induced EndMT in vitro, in vivo EndMT was observed in renal biopsies of the same patients. Primary endothelial cells (HUVEC) were incubated with healthy volunteers EV, control transplant patients EV, and AMR‐derived EV (5e+4 EV/cells target for 24 and 48 h). (A) MTT assay performed on HUVEC plated in 96‐well plate, treated with EV purified from plasma of AMR patients for 24 h. Untreated cells (indicated as basal), cell exposed to healthy control EV and H2O2 (up to 0.5 mM) were used as controls. Data represent the mean ± SD; n = 3. (B) Flow cytometry analysis showed a significant reduction of constitutive endothelial markers CD31 and VE‐cadherin and an increased expression of dysfunctional fibroblast‐like markers collagen I and vimentin after 48 h of treatment (representative plot are shown in Figure S2). Data are shown as median± interquartile range, *p value p < .05, **p value p < .01, Mann–Whitney test). (C–H) Analysis of EndMT on renal biopsies. Endothelial cells were double‐stained for the constitutive CD31 (green) and myofibroblast‐like α‐SMA marker (red) to investigate the occurrence of EndMT. (C) In control transplant biopsies, α‐SMA expression was limited to the wall of renal arteries and αSMA+ glomerular cells were barely detectable. (D) The tubule interstitium of acute and (E) chronic AMR biopsies showed an increased α‐SMA expression as indicated by white arrows. (H) In addition, strong and diffuse expression of α‐SMA was observed also in the glomerular capillaries of the biopsies with chronic AMR, lesser than in acute AMR (G). The fluorescent dye To‐pro 3 was used to counterstain nuclei (blue). (F–H) Glomeruli. (I) Quantitative analyses of CD31‐SMA double‐positive/high‐power (630×) fields (HPF) cells (were expressed as median ± interquartile range [IQR], n = 5). (p value as indicated, Mann–Whitney test). Magnification 630×
We then decided to investigate the possible occurrence of EndMT in renal biopsies of AMR patients (Figure 4C–H). Renal biopsies from TX Ctrl (Figure 4C) showed αSMA expression predominantly in smooth muscle cells (wall of renal arteries) and CD31 staining at level of interstitial peritubular capillaries. In the AAMR and CAMR renal tissues (Figure 4D,E, white arrows), interstitial cells upregulated αSMA together with an intense reduction in CD31 expression, indicating EndMT. The increase in αSMA associated with the decrease of CD31 occurred predominately in peritubular capillaries and arterioles and was more evident in CAMR compared with AAMR. (Figure 4I). Finally, we identified the presence of EndMT also at glomerular level where we found upregulated αSMA and co‐localization with CD31 (Figure 4H, white arrow).
3.4. EV from AMR patients induced complement activation in tubular and endothelial culture
Complement system is a well‐recognized player in AMR 25 , 26 ; for instance, CAMR biopsies exhibited higher C3 gene transcripts. 27 To elucidate the role of circulating EV in modulating complement, we assessed gene transcripts C3 and CFH in RPTEC. After stimulation for 24 h with AMR‐derived EV, we found a significant increase of C3 gene level in RPTEC (Figure 5A,B) and a decrease of CFH gene expression. A similar trend was observed in primary endothelial cell culture (data not showed). We then decided to study the role of EV in functional complement activation. For this purpose, we cultured primary endothelial cells in serum‐free media in the presence of AMR‐derived EV. Cell culture supernatants were collected after 24 h and loaded in a complement enzyme immunoassay for the functional determination of classical, lectin, and alternative pathways activation (Figure 5C). Compared with untreated cells and TX Ctrl, culture media derived from endothelial cells exposed to AAMR and CAMR‐derived EV activated classical and lectin pathways (Figure 5C). Next, we evaluated the deposition of C4d in endothelial cells. Interestingly, immunofluorescence analysis revealed strong C4d deposits in AAMR and CAMR conditions (Figure 5D,E).
FIGURE 5.
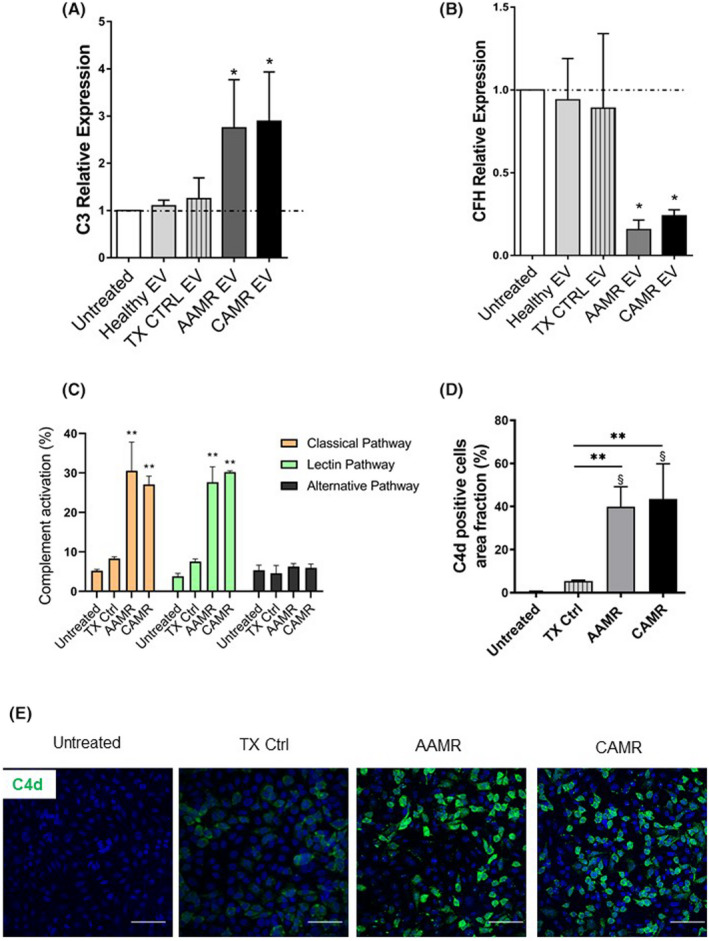
Complement activation in tubular and endothelial cells culture after AMR‐derived EV exposition. (A, B) C3 and CFH gene transcript level in RPTEC after AMR‐derived EV stimulation (5e+4 EV/cells target for 24 h). Gene expression was assessed by qPCR and compared with normal untreated RPTEC cultured for 24 h. LPS, IFNγ and H2O2 exposed cells were used as positive control of C3 complement increase (not showed). Gene expression levels were normalized to the housekeeping gene β‐actin. Data are displayed as means ± SD, n = 5, one‐way ANOVA, *p < .05. (C) Primary human endothelial cells were cultured in serum‐free media, then exposed to EV 5e+4 EV/cells target for 24 h. (C) Complement activation in cells culture, supernatants were assessed by complement functional assay with a protocol adapted for cell culture, data are displayed as mean ± SD of percentage of complement activation compared with a positive control, medians were compared with a Mann–Whitney U test **p < .01, n = 5 per group. (D, E) Immunofluorescence analysis for C4d complement fragment. Endothelial cell grown in serum‐free conditions were exposed to AMR‐derived EV for 24 h (5e+4 EV/cells target) then labeled by immunofluorescence for C4d. Scale bar: 50 μm. Magnification, 630×. (D) Data are shown as mean ± SD and were analyzed by one‐way ANOVA test (n = 3 per group), *p < .01 versus TX Ctrl group, §p < .001 versus untreated cells.
3.5. miRNA characterization from AMR‐derived EV
We used microarray analysis to compare the miRNA profiles of EV isolated from AAMR and CAMR comparing with TX Control patients (Figure 6). By microarray miRNA profiling, we detected 42 miRNA downregulated and 34 miRNA upregulated (Table 2) with FDR <0.05 and Fold change >2 (Figure 6A). The principal component analysis showed that these 76 miRNAs were able to distinguish ABMR‐derived EV from TX control EV (Figure 6B). We then searched whether differences in EV‐miRNAs content were present between AAMR and CAMR patients. We found nine miRNAs differentially expressed in the two AMR groups whose eight downregulated and only one upregulated in AAMR compared with CAMR (Table 3 and Figure 6C). Interestingly, these miRNAs were able to distinguish AAMR‐derived EV from CAMR EV by PCA (Figure 6D).
FIGURE 6.
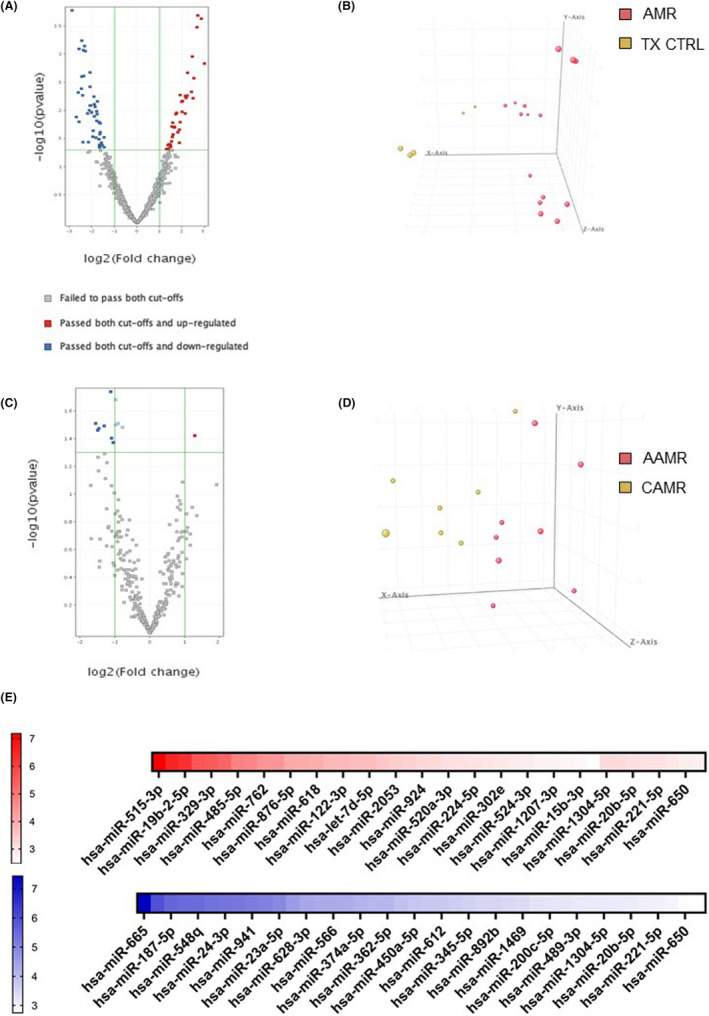
Analysis of miRNAs differentially expressed in plasma EV from patients with AMR compared to TX Control patients. (A) Volcano plot shows the relationship between fold change and statistical significance. The red and blue points in the plot represent the differentially expressed mRNAs with statistical significance. 34 miRNAs were upregulated (red points) and 42 miRNA were downregulated (blue points) in AMR patients compared with TX Control with FDR <0.05 and Fold change >2. (B) Principal component analysis (PCA) built on all expressed miRNAs among the three groups. Principal component analysis showing 76 miRNAs able to distinguish AMR‐derived EVs from EV derived from TX Ctrl. Analysis of miRNAs differentially expressed in plasma EV from patients with AAMR compared with CAMR. (C) Volcano plot showing 1 miRNA upregulated and 8 miRNAs downregulated in EV from AAMR compared with CAMR. (D) Principal component analysis showing the 9 miRNAs able to distinguish AAMR‐derived MVs from EV derived from CAMR. (E) The heatmap of the differentially expressed miRNAs in the AMR group (AAMR and CAMR) versus TX Ctrl group displayed according to fold‐changes value. The red indicated higher miRNA expression level in AMR‐derived EV compared with TX Ctrl, whereas the blue showed lower miRNA expression level. Fold change and p value details are indicated in Table 2 (n = 8 for each group).
TABLE 2.
Fold change and p value of differentially expressed miRNAs in the AMR group (AAMR and CAMR) versus TX Ctrl group displayed according fold‐changes value. [Color table can be viewed at wileyonlinelibrary.com]
| miRNA | p value | Type of regulation | FC (abs) ([ABMR] vs. [TX ctrl]) |
|---|---|---|---|
| hsa‐miR‐515‐3p | .000231032 | Up | 7.1829104 |
| hsa‐miR‐613 | .00020372 | Up | 6.5069966 |
| hsa‐miR‐19b‐2‐5p | .000327536 | Up | 6.3115873 |
| hsa‐miR‐1470 | .005988951 | Up | 5.602683 |
| hsa‐miR‐329‐3p | .001084423 | Up | 5.4909964 |
| hsa‐miR‐520g‐3p | .004616148 | Up | 5.314596 |
| hsa‐miR‐485‐5p | .002111625 | Up | 4.746104 |
| hsa‐miR‐182‐5p | .005424898 | Up | 4.689974 |
| hsa‐miR‐762 | .011246364 | Up | 4.417236 |
| hsa‐miR‐604 | .005480804 | Up | 4.39079 |
| hsa‐miR‐876‐5p | .006755393 | Up | 4.024569 |
| hsa‐miR‐330‐5p | .01050784 | Up | 4.0186687 |
| hsa‐miR‐618 | .006916957 | Up | 3.9541354 |
| hsa‐miR‐504‐5p | .01596405 | Up | 3.7634454 |
| hsa‐miR‐122‐3p | .005297408 | Up | 3.763288 |
| hsa‐miR‐27b‐3p | .021932283 | Up | 3.6821675 |
| hsa‐let‐7d‐5p | .03728327 | Up | 3.6744018 |
| hsa‐miR‐96‐3p | .024133574 | Up | 3.4917197 |
| hsa‐miR‐2053 | .01091803 | Up | 3.381615 |
| hsa‐miR‐518a‐3p | .011575868 | Up | 3.312046 |
| hsa‐miR‐924 | .01954987 | Up | 3.173741 |
| hsa‐miR‐615‐3p | .019990016 | Up | 3.1378903 |
| hsa‐miR‐520a‐3p | .026489267 | Up | 3.0356672 |
| hsa‐miR‐7‐2‐3p | .016340833 | Up | 2.9995658 |
| hsa‐miR‐224‐5p | .029457007 | Up | 2.9695976 |
| hsa‐miR‐302a‐5p | .019094761 | Up | 2.9312422 |
| hsa‐miR‐302e | .035594154 | Up | 2.8882592 |
| hsa‐miR‐30d‐5p | .044051122 | Up | 2.826196 |
| hsa‐miR‐524‐3p | .040416576 | Up | 2.7849436 |
| hsa‐miR‐2113 | .041143194 | Up | 2.6930864 |
| hsa‐miR‐1207‐3p | .03985014 | Up | 2.6801581 |
| hsa‐miR‐935 | .047119707 | Up | 2.6354783 |
| hsa‐miR‐15b‐3p | .041045405 | Up | 2.5954452 |
| hsa‐miR‐374b‐3p | .04837202 | Up | 2.4694357 |
| hsa‐miR‐665 | .000163911 | Down | 7.4328017 |
| hsa‐miR‐33a‐5p | .000800563 | Down | 5.940329 |
| hsa‐miR‐187‐5p | .004084985 | Down | 5.553976 |
| hsa‐miR‐500a‐5p | .000570207 | Down | 5.4789815 |
| hsa‐miR‐548q | .002482388 | Down | 5.45685 |
| hsa‐miR‐101‐3p | .005373681 | Down | 5.33553 |
| hsa‐miR‐24‐3p | .036215696 | Down | 5.2734694 |
| hsa‐miR‐7‐1‐3p | .000843328 | Down | 5.235151 |
| hsa‐miR‐941 | .002429962 | Down | 5.127467 |
| hsa‐miR‐198 | .000709711 | Down | 5.058566 |
| hsa‐miR‐23a‐5p | .000879938 | Down | 4.909253 |
| hsa‐miR‐1208 | .01128544 | Down | 4.5670714 |
| hsa‐miR‐628‐3p | .009809131 | Down | 4.347662 |
| hsa‐miR‐153‐3p | .003773427 | Down | 4.2727685 |
| hsa‐miR‐566 | .008081804 | Down | 4.2644567 |
| hsa‐miR‐181c‐5p | .0021057 | Down | 4.2475104 |
| hsa‐miR‐374a‐5p | .008069614 | Down | 4.1372747 |
| hsa‐miR‐1226‐5p | .010832398 | Down | 4.0668645 |
| hsa‐miR‐362‐5p | .010658938 | Down | 4.0623984 |
| hsa‐miR‐27a‐3p | .022574209 | Down | 3.8788292 |
| hsa‐miR‐450a‐5p | .005614921 | Down | 3.7752542 |
| hsa‐miR‐1183 | .012564858 | Down | 3.7415555 |
| hsa‐miR‐612 | .007675583 | Down | 3.7364385 |
| hsa‐miR‐583 | .008537401 | Down | 3.6363204 |
| hsa‐miR‐345‐5p | .030444378 | Down | 3.5527856 |
| hsa‐miR‐129‐5p | .010209671 | Down | 3.4723613 |
| hsa‐miR‐892b | .01506753 | Down | 3.462885 |
| hsa‐miR‐516a‐5p | .011553774 | Down | 3.4159129 |
| hsa‐miR‐1469 | .006867504 | Down | 3.382768 |
| hsa‐miR‐1289 | .016001152 | Down | 3.228435 |
| hsa‐miR‐200c‐5p | .03231347 | Down | 3.2009394 |
| hsa‐miR‐573 | .040677994 | Down | 3.1773596 |
| hsa‐miR‐489‐3p | .026190298 | Down | 3.1373172 |
| hsa‐miR‐29a‐3p | .04505775 | Down | 3.1284726 |
| hsa‐miR‐1304‐5p | .01689237 | Down | 3.1228726 |
| hsa‐miR‐525‐5p | .024324922 | Down | 3.1080406 |
| hsa‐miR‐20b‐5p | .040294994 | Down | 3.0671146 |
| hsa‐miR‐340‐5p | .037424956 | Down | 3.0119717 |
| hsa‐miR‐221‐5p | .039695513 | Down | 2.9911106 |
| hsa‐miR‐132‐3p | .041248452 | Down | 2.9115572 |
| hsa‐miR‐650 | .029810114 | Down | 2.7526343 |
| hsa‐miR‐601 | .044837527 | Down | 2.7435393 |
Note: Red indicates a higher miRNA expression level in AMR‐derived EV compared to TX Ctrl, whereas the blue shows a lower miRNA expression level.
TABLE 3.
Fold change and p value of differentially expressed miRNAs in the AAMR versus CAMR group displayed according fold‐changes value. [Color table can be viewed at wileyonlinelibrary.com]
| miRNA | p value ([AAMR] vs. [CAMR]) | Type of regulation | FC (abs) ([AAMR] vs. [CAMR]) |
|---|---|---|---|
| hsa‐miR‐590‐3p | .03 | Up | 2.4417171 |
| hsa‐miR‐1263 | .04 | Down | 2.9411678 |
| hsa‐miR‐192‐5p | .05 | Down | 2.827694 |
| hsa‐miR‐342‐5p | .04 | Down | 2.7434256 |
| hsa‐let‐7g‐3p | .04 | Down | 2.4806325 |
| hsa‐miR‐515‐3p | .03 | Down | 2.4635694 |
| hsa‐miR‐500a‐5p | .03 | Down | 2.1735005 |
| hsa‐miR‐199b‐5p | .04 | Down | 2.1345708 |
| hsa‐miR‐1184 | .03 | Down | 2.0780954 |
Note: Red indicates a higher miRNA expression level in AAMR‐derived EV compared to CAMR‐derived EV, whereas the blue shows a lower miRNA expression level.
We investigated the possible target genes of identified miRNAs (Tables 2 and 3). miRNA candidates were picked according to their expression, their fold change, the p value, and prediction score. Several targets were associated with CDKN1A and CDKN2A genes regulation as miR‐24‐3p, miR‐let‐7d‐5p, miR‐101‐3p, mir‐345‐5p, miR‐20‐5p, and miR‐132‐3p. Since our group has previously demonstrated that premature senescence and EndMT represent central mechanisms involved in the progression of chronic graft deterioration after renal transplantation, 18 , 19 , 28 , 29 we selected miRNA that specifically target senescence‐associated genes as CDKN1A, CDKN2A, together with early fibrosis genes as Collagen I, TGFB, and complement‐related genes. Using different databases (TargetScan, miRDB, miRTarBase, and DIANA TarBase) and filtering for the prediction target score, we identified and validated two miRNA downregulated in AMR‐derived EV versus TX Ctrl: mir‐24‐3p that targets CDKN1A, CDKN1B, TGFB, CDK6, and CFP (Properdin: Position 18–24 of CFP 3' UTR, 7mer‐8m with 98 context score percentile rank); mir‐29a‐3p which modulates COL1A1, COL1A2, COL3A1, and COL4A1 pro‐fibrotic genes (Figure 7A,B). Furthermore, even if not yet validated, we also found the downregulation of miR‐101‐3p which was associated with Klotho (KL), CDKN1A, and C3 gene regulation (Table 2, Fold change 5.34, p = .053).
FIGURE 7.
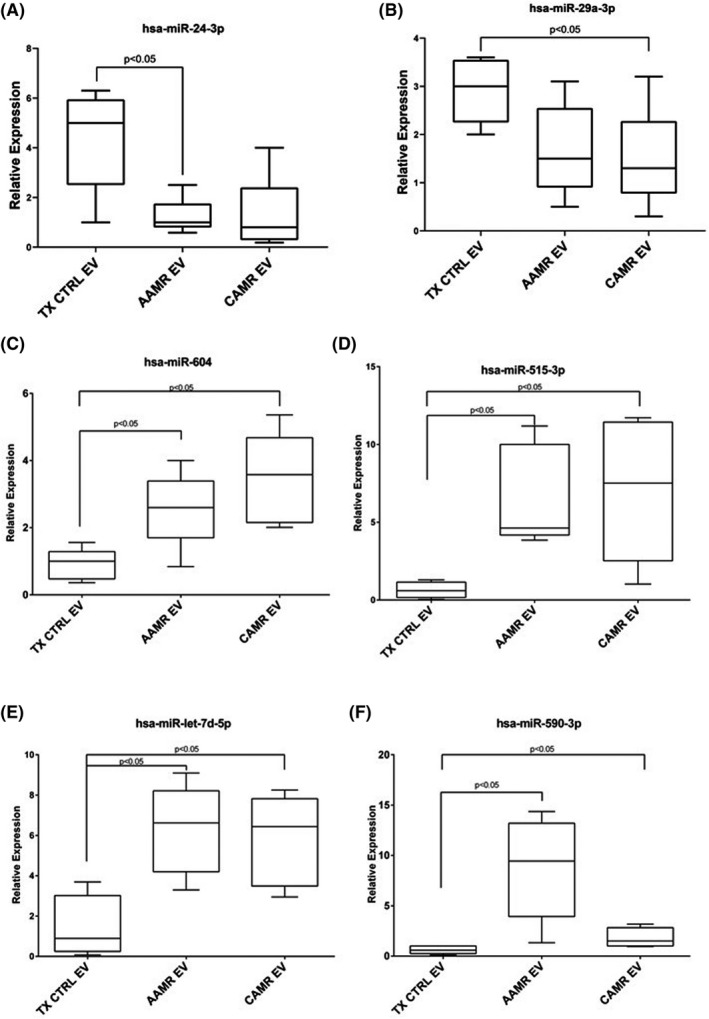
miRNA validation by qPCR. miRNA validation in EV from AAMR, CAMR, and TX Ctrl patients. Box plots representing the miRNAs that were upregulated or downregulated in AAMR and CAMR compared with TX CTRL group. Center lines show the medians; box limits indicate the 25th and 75th percentiles as determined by R software, whiskers extend from each quartile to the minimum or maximum. One‐way ANOVA, nonparametric test. Tukey test was used to correct for multiple comparisons using statistical hypothesis testing (n = 8 for each group).
Four miRNAs were upregulated: miR‐604, miR‐590‐3p, miR‐let‐7d‐5p, and miR‐515‐3p. In particular, miR‐604, miR‐590‐3p were found to interact with canonical conserved 8mer and 7mer sites that fit the seed region of each miRNA at 3'‐UTR of CD59, CFD, CFHR4, and CFH complement components. Whereas miR‐let‐7d‐5p and miR‐515‐3p target CDKN1A, H2AFX, (associated to senescence and DNA damage response) and COL1A1, COL1A2, and TGFBR1/2 genes (associated to fibrosis). We validate their expression by qPCR, confirming the microarray data (Figure 7C–F). Regarding miR‐590‐3p, by microarray data, it was upregulated in AAMR‐EV compared with CAMR EV and displayed the same trend in qPCR analysis. However, no statistical significance was reached (Figure 7F).
4. RNAse digestion of EV revert the tubular senescence, reduced the C3 gene expression level and EndMT in vitro
Finally, we reasoned that the effect induced by EV could be regulated by a putative horizontal transfer of RNAs. Thus, we investigate whether the degradation RNA contained as cargo inside EV could interfere with processes of senescence and EndMT. Given their significant ability to induce senescence and EndMT, a pull of CAMR‐derived EV was treated with RNase A at 1U/ml with saponin. 30 Interestingly, the RNase pretreatment significantly reduced EV‐induced tubular senescence, as observed by decreased positivity at SA‐β Gal staining (Figure 8A,B). Furthermore, RNase reduced C3 gene expression increase (Figure 8C) and reverted the EndMT (Figure 8D). In particular, flow cytometry analysis showed a significant abrogation of EndMT as observed by conserved expression of constitutive endothelial markers CD31, VE‐cadherin and the lack of increased expression of dysfunctional fibroblast‐like markers collagen I and vimentin after 48 h of treatment (Figure 8D).
FIGURE 8.
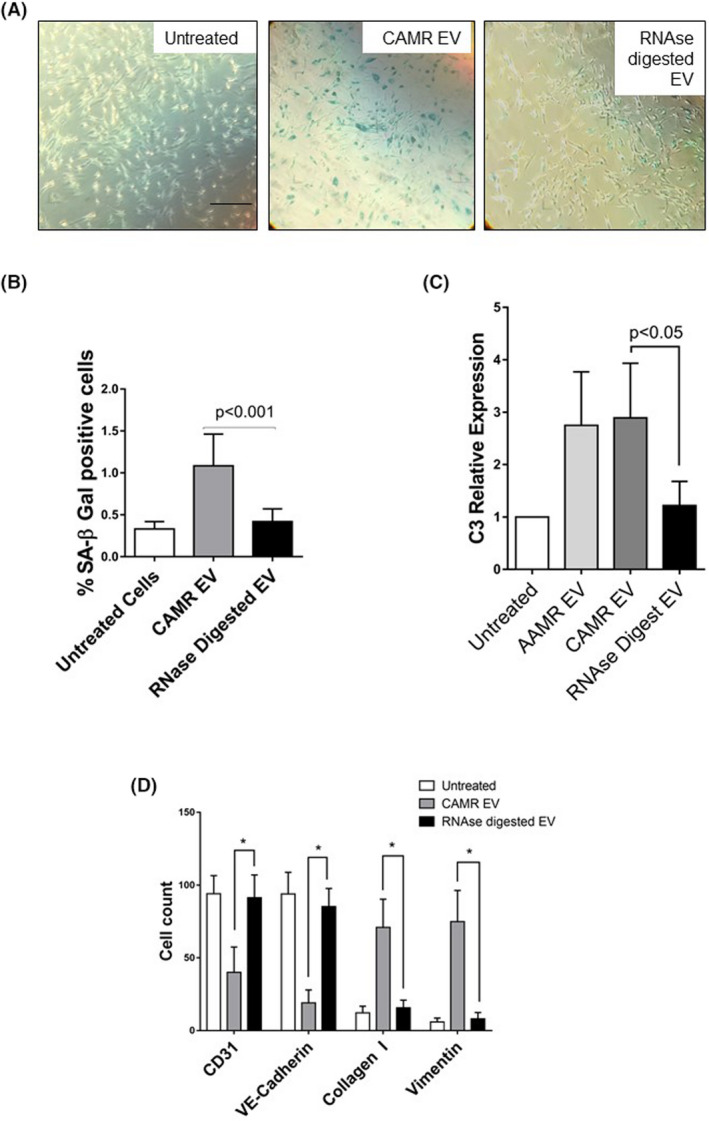
RNA digestion of AMR‐derived EV is sufficient to inhibit tubular senescence, C3 gene transcript increase and EndMT. A pull of CAMR‐derived EV was treated with RNase A at 1U/ml and saponin. Pretreatment with RNase A significantly reduced CAMR EV‐induced senescence, as observed by SA‐β GAL staining, reduced the C3 gene increased level and reverted EndMT. (A) SA‐β Gal staining in RPTEC treated with a pull of EV purified from CAMR patients plasma (5e+4 EV/cells target for 24 h). Increased SA‐β‐gal+ cells were observed after CAMR EV treatment. Compared with CAMR‐derived EV, the RNase‐digested EV‐treated cells were barely positive to SA‐β Gal. H2O2 (0.5–1 mM )‐exposed cells were used as positive control of senescence (not shown). Scale bar: 200 μm. (B) Quantification of SA‐β‐Gal+ cells. The ratio of cells positive for SA‐β‐gal activity was calculated by in five not overlapping fields per condition (six‐well plate). The results are presented as the mean ± SD of three independent experiments. p value as indicated. (C) C3 gene transcript level in RPTEC after CAMR‐derived EV untreated/treated with RNase (5e+4 EV/cells target for 24 h). Gene expression was assessed by qPCR and compared with normal untreated RPTEC cultured for 24 h. Gene expression levels were normalized to the housekeeping gene β‐actin. Data are shown as means ± SD, n = 3, p value as indicated, one‐way ANOVA nonparametric. (D) Flow cytometry analysis showed a significant abrogation of EndMT as observed by conserved expression of constitutive endothelial markers CD31 and VE‐cadherin and the lack of increased expression of dysfunctional fibroblast‐like markers collagen I and vimentin after 48 h of treatment. Results are means ± SD, n = 3, *p < .05.
5. DISCUSSION
In this study, we demonstrated that patients with AMR have circulating EV characterized by pro‐inflammatory, pro‐aging and pro‐fibrotic effects on tubular and endothelial cells. In addition, we demonstrated that AMR‐derived‐EV are characterized by a different miRNA profile compared with EV isolated from stable graft function patients and that this RNA‐based cargo is pivotal to induce their pathogenic effect.
EV are membrane bound particle, continuously released by different cell types that reflect the state of cell of origin. Their plasma level can be significantly altered in several renal diseases. 31 , 32 In the AMR patients, EV increase correlated with severity of rejection, response to treatment 33 and the occurrence of cardiovascular complications. 34 , 35 , 36 Consistent with all these results, we found that the level of EV appeared significantly higher in AAMR patients compared with TX Ctrl, suggesting an ongoing active process possible correlated with endothelial damage and thrombosis. Using a multiplexing approach, we demonstrated that AMR‐derived EV originated from platelets and endothelial cells. Furthermore, these vesicles were positive for adhesion molecules, leukocyte and antigen presenting cell markers, suggesting also a potential source from dendritic cells, thus a role for EV in the modulation of antigen presentation to T lymphocytes. 37
Recently, a large plethora of studies depicted the cargo of EV purified from urine and blood. 38 , 39 Based on their content, EV could be able to directly reflect deterioration of renal function 40 or to predict the occurrence of rejection. 39 , 41 , 42 Here, to better elucidate their biological role, we investigated the direct effect of AMR‐derived EV on tubular and endothelial cells. We found that AMR‐derived EV induced tubular senescence that represents a state of irreversible growth arrest characterized by the increased level of cyclin‐dependent kinase inhibitor (i.e., p16Ink4a and p21). 43 Effectively, p16Ink4a level has been associated with senescence‐related renal disease. 9 , 44 , 45 , 46 Our results are in line with previous findings showing higher level in late (>3 months) episodes compared with early episodes. 47 In accordance, compared with AAMR‐EV, EV from CAMR patients were characterized by a stronger capacity to induce senescence. That results are in agreement with findings from Zhang Hao et al. 42 that detected gp130 mRNA, a central receptor of IL6, a SASP mediator, 48 , 49 in circulating EV from AMR patients; furthermore, activation of IL‐6 amplifier was recently assessed in urinary exosomes of CAMR patients. 50
The AMR pathophysiology is profoundly characterized by endothelial injury. 2 , 51 Intriguingly, after vascular injury, EV can also trigger an acceleration of graft rejection. 52 , 53 In our experiments, EndMT occurred in AMR patients and was more evident in CAMR group compared with AAMR. These results are in line with previous findings showing increased expression of mesenchymal proteins (as vimentin) at level of peritubular capillaries that diagnose AMR and predict long‐term graft dysfunction. 54 During the development of AMR, complement activation is widely considered a central contributor to graft injury and strongly associated to poorer survival. 51 , 55 , 56 , 57
C4d deposition has been considered for a long time a reliable footprint marker of active AMR 25 even though cases of C4d‐negative AMR have currently emerged. 58 In the course of AMR, increased number of plasma C4d‐positive endothelial‐derived EV were detected and associated with severity and response to treatment. 33 , 59 Similar results were provided also in chronic kidney disease (CKD) patients 32 where C3‐positive EV were released in the circulation from platelet and monocytes. Next, leucocytes‐derived EV can bind C1q and activate classical pathway, leading to C4 and C3 deposition. 60 , 61 In our study, we found that AMR‐derived EV can activate the classical and lectin pathway in supernatants of endothelial cells leading to C4d deposition also in absence of serum. The importance of C3 complement component in EV was underlined by Braun et al. 62 that analyzed the proteomic profile of urinary EV from living donors and recipients after kidney transplantation. 63 Similarly, we found that AMR‐derived EV could exacerbate local and extrahepatic complement production by tubular cells. 64 , 65
Here, we demonstrated that AMR‐derived EV were able to induce C3 gene upregulation and CFH decrease. In addition to activator functions, EV could also take part in regulation of complement system by evading complement attack through C5b‐9 removal from their surface. 25 , 66 Likewise, we found that AMR‐derived EV were positive for C5b‐9 when compared with controls (Figure S1B).
In the last decade, miRNAs emerged as pivotal mediators in acute and chronic AMR proposing their potential value as noninvasive biomarkers. 67 In this study, we provided the miRNA profile of AMR‐derived EV and described the involvement of miR‐24‐3p, miR‐29b‐3p in the regulation of tubular senescence and EndMT possibly through the modulation of CDKN1A, CDKN2A, TGFβ, and collagen‐related genes. miR‐24‐3p is highly upregulated at renal level during ischemia/reperfusion injury, predominately by endothelial cells. 68 , 69 , 70
Members of the miR‐29 family are critically involved in renal fibrosis by targeting the 3′ UTR of collagen genes. 71 , 72 , 73 Thus, it has been suggested that their modulation is a potential antifibrotic therapy and AKI biomarker. 74
Next, we confirmed increased level of miR‐604 in AAMR and CAMR‐derived EV. The validated target genes of miR‐604 included both senescence markers as Lims1 (LIM and senescent cell antigen‐like‐containing domain protein 1), cell cycle control proteins (as CDC42 and Tumor protein p73), and complement regulators as CD59, CFD, and CFHR4. Regarding miR‐515‐3p, it has been shown to directly regulate vimentin and matrix metalloproteinase‐3 (MMP3) expression by binding to the coding sequence and 3′UTR region in the process of Epithelial–to‐Mesenchymal Transition associated with metastatic esophageal cell carcinoma. 75
Furthermore, miR‐590‐3p plays a key role in cellular aging, cancer, 76 AKI, 77 correlated with severity of IgA nephropathy 78 and targeted genes associated with inflammasome (NLRP1/IL‐1β) and renal oxidative stress (NOX4). 79 This target was upregulated in AAMR group compared with CAMR and even if no statistical significance was reached, it could represent a potential marker for differential diagnosis.
We acknowledge that the present study has a limited number of patients enrolled. However, we were able to perform EV isolation and characterization according to the guidelines of MISEV 2018. 4 In addition, our cohort was homogeneous for recipient and donor age, immunosuppressive therapies, and primary cause of nephropathy. Furthermore, as other limitation, in this initial study, we performed a whole RNAse treatment digestion instead of a specific miRNA inhibition to establish the potential role of EV‐associated RNAs in AMR complications and their yet underestimated effect on renal graft cells. Additional studies are required to identify the exact correlation of EV‐miRNA on tubular senescence and EndMT. Our data describe that EV play a pivotal role in the inflammatory, aging, and pro‐fibrotic kidney response. Extensive studies are necessary to validate our in vitro findings and to assess the utility of EV molecular profile to predict onset of renal rejection.
In conclusion, our data describe that EV play a pivotal role in the inflammatory, aging, and pro‐fibrotic kidney response during the development of AMR through their miRNA content. These data open a new window of opportunity for potential therapeutic targets worthy of further research.
DISCLOSURE
The authors of this manuscript have no conflicts of interest to disclose as described by the American Journal of Transplantation.
Supporting information
Figure S1:
Figure S2:
Figure S3:
Data S1
ACKNOWLEDGMENTS
The authors thank Chiara Divella, Claudia Curci, and Angela Picerno for excellent technical assistance. Open Access Funding provided by Universita degli Studi di Milano within the CRUI‐CARE Agreement.
Franzin R, Stasi A, Sallustio F, et al. Extracellular vesicles derived from patients with antibody‐mediated rejection induce tubular senescence and endothelial to mesenchymal transition in renal cells. Am J Transplant. 2022;22:2139‐2157. doi: 10.1111/ajt.17097
Funding information
This study was supported by University of Bari “Aldo Moro” and the Italian Ministry of Health (Giovani Ricercatori 2011‐2012, GR‐2011‐02351027, granted to GC; Fondo Sociale Europeo, Azione I.2 “Attrazione e Mobilità Internazionale dei Ricercatori”‐AIM‐1810057‐activity 2 granted to AS).
Contributor Information
Rossana Franzin, Email: rossana.franzin@uniba.it.
Loreto Gesualdo, Email: loreto.gesualdo@uniba.it.
Giuseppe Castellano, Email: giuseppe.castellano@unimi.it.
DATA AVAILABILITY STATEMENT
The data that support the findings of this study are available from the corresponding author upon reasonable request.
REFERENCES
- 1. Montgomery RA, Loupy A, Segev DL. Antibody‐mediated rejection: new approaches in prevention and management. Am J Transplant. 2018;18(Suppl 3):3‐17. doi: 10.1111/ajt.14584 [DOI] [PubMed] [Google Scholar]
- 2. Sis B, Jhangri GS, Bunnag S, Allanach K, Kaplan B, Halloran PF. Endothelial gene expression in kidney transplants with alloantibody indicates antibody‐mediated damage despite lack of C4d staining. Am J Transplant. 2009;9(10):2312‐2323. doi: 10.1111/j.1600-6143.2009.02761.x [DOI] [PubMed] [Google Scholar]
- 3. Schinstock CA, Cosio F, Cheungpasitporn W, et al. The value of protocol biopsies to identify patients with de novo donor‐specific antibody at high risk for allograft loss. Am J Transplant. 2017;17(6):1574‐1584. doi: 10.1111/ajt.14161 [DOI] [PMC free article] [PubMed] [Google Scholar]
- 4. Théry C, Witwer KW, Aikawa E, et al. Minimal information for studies of extracellular vesicles 2018 (MISEV2018): a position statement of the International Society for Extracellular Vesicles and update of the MISEV2014 guidelines. J Extracell Vesicles. 2018;7(1):1535750. doi: 10.1080/20013078.2018.1535750 [DOI] [PMC free article] [PubMed] [Google Scholar]
- 5. Lu Y, Liu D, Feng Q, Liu Z. Diabetic nephropathy: perspective on extracellular vesicles. Front Immunol. 2020;11:943. doi: 10.3389/fimmu.2020.00943 [DOI] [PMC free article] [PubMed] [Google Scholar]
- 6. Grange C, Brossa A, Bussolati B. Extracellular vesicles and carried miRNAs in the progression of renal cell carcinoma. Int J Mol Sci. 2019;20(8):1832. doi: 10.3390/ijms20081832 [DOI] [PMC free article] [PubMed] [Google Scholar]
- 7. Li X‐Q, Lerman LO, Meng Y. Potential role of extracellular vesicles in the pathophysiology of glomerular diseases. Clin Sci (Lond). 2020;134(20):2741‐2754. doi: 10.1042/CS20200766 [DOI] [PubMed] [Google Scholar]
- 8. Vallabhajosyula P, Korutla L, Habertheuer A, et al. Tissue‐specific exosome biomarkers for noninvasively monitoring immunologic rejection of transplanted tissue. J Clin Invest. 2017;127(4):1375‐1391. doi: 10.1172/JCI87993 [DOI] [PMC free article] [PubMed] [Google Scholar]
- 9. Melk A, Schmidt BMW, Vongwiwatana A, Rayner DC, Halloran PF. Increased expression of senescence‐associated cell cycle inhibitor p16INK4a in deteriorating renal transplants and diseased native kidney. Am J Transplant. 2005;5(6):1375‐1382. doi: 10.1111/j.1600-6143.2005.00846.x [DOI] [PubMed] [Google Scholar]
- 10. Sturmlechner I, Durik M, Sieben CJ, Baker DJ, van Deursen JM. Cellular senescence in renal ageing and disease. Nat Rev Nephrol. 2017;13(2):77‐89. doi: 10.1038/nrneph.2016.183 [DOI] [PubMed] [Google Scholar]
- 11. Braun H, Schmidt BMW, Raiss M, et al. Cellular senescence limits regenerative capacity and allograft survival. J Am Soc Nephrol. 2012;23(9):1467‐1473. doi: 10.1681/ASN.2011100967 [DOI] [PMC free article] [PubMed] [Google Scholar]
- 12. Delanaye P, Jager KJ, Bokenkamp A, et al. CKD: a call for an age‐adapted definition. J Am Soc Nephrol. 2019;30(10):1785–1805. doi: 10.1681/ASN.2019030238 [DOI] [PMC free article] [PubMed] [Google Scholar]
- 13. Infante B, Franzin R, Madio D, et al. Molecular mechanisms of AKI in the elderly: from animal models to therapeutic intervention. J Clin Med. 2020;9(8):2574. doi: 10.3390/jcm9082574 [DOI] [PMC free article] [PubMed] [Google Scholar]
- 14. Kholia S, Herrera Sanchez MB, Cedrino M, et al. Mesenchymal stem cell derived extracellular vesicles ameliorate kidney injury in aristolochic acid nephropathy. Front Cell Dev Biol. 2020;8:188. doi: 10.3389/fcell.2020.00188 [DOI] [PMC free article] [PubMed] [Google Scholar]
- 15. Bruno S, Pasquino C, Herrera Sanchez MB, et al. HLSC‐derived extracellular vesicles attenuate liver fibrosis and inflammation in a murine model of non‐alcoholic steatohepatitis. Mol Ther. 2020;28(2):479‐489. doi: 10.1016/j.ymthe.2019.10.016 [DOI] [PMC free article] [PubMed] [Google Scholar]
- 16. Livak KJ, Schmittgen TD. Analysis of relative gene expression data using real‐time quantitative PCR and the 2(‐Delta Delta C(T)) Method. Methods. 2001;25(4):402‐408. doi: 10.1006/meth.2001.1262 [DOI] [PubMed] [Google Scholar]
- 17. Sallustio F, Stasi A, Curci C, et al. Renal progenitor cells revert LPS‐induced endothelial‐to‐mesenchymal transition by secreting CXCL6, SAA4, and BPIFA2 antiseptic peptides. FASEB J. 2019;33(10):10753‐10766. doi: 10.1096/fj.201900351R [DOI] [PubMed] [Google Scholar]
- 18. Curci C, Castellano G, Stasi A, et al. Endothelial‐to‐mesenchymal transition and renal fibrosis in ischaemia/reperfusion injury are mediated by complement anaphylatoxins and Akt pathway. Nephrol Dial Transplant. 2014;29(4):799–808. doi: 10.1093/ndt/gft516 [DOI] [PubMed] [Google Scholar]
- 19. Castellano G, Franzin R, Sallustio F, et al. Complement component C5a induces aberrant epigenetic modifications in renal tubular epithelial cells accelerating senescence by Wnt4/betacatenin signaling after ischemia/reperfusion injury. Aging (Albany NY). 2019;11(13):4382‐4406. doi: 10.18632/aging.102059 [DOI] [PMC free article] [PubMed] [Google Scholar]
- 20. Koliha N, Wiencek Y, Heider U, et al. A novel multiplex bead‐based platform highlights the diversity of extracellular vesicles. J Extracell Vesicles. 2016;5:29975. doi: 10.3402/jev.v5.29975 [DOI] [PMC free article] [PubMed] [Google Scholar]
- 21. Wiklander OPB, Bostancioglu RB, Welsh JA, et al. Systematic methodological evaluation of a multiplex bead‐based flow cytometry assay for detection of extracellular vesicle surface signatures. Front Immunol. 2018;9:1326. doi: 10.3389/fimmu.2018.01326 [DOI] [PMC free article] [PubMed] [Google Scholar]
- 22. Kuro‐O M. The Klotho proteins in health and disease. Nat Rev Nephrol. 2019;15(1):27‐44. doi: 10.1038/s41581-018-0078-3 [DOI] [PubMed] [Google Scholar]
- 23. Kuro‐o M, Matsumura Y, Aizawa H, et al. Mutation of the mouse klotho gene leads to a syndrome resembling ageing. Nature. 1997;390(6655):45‐51. doi: 10.1038/36285 [DOI] [PubMed] [Google Scholar]
- 24. Franzin R, Stasi A, Ranieri E, et al. Targeting premature renal aging: from molecular mechanisms of cellular senescence to senolytic trials. Front Pharmacol. 2021;12:630419. doi: 10.3389/fphar.2021.630419 [DOI] [PMC free article] [PubMed] [Google Scholar]
- 25. Stites E, Le Quintrec M, Thurman JM. The complement system and antibody‐mediated transplant rejection. J Immunol. 2015;195(12):5525‐5531. doi: 10.4049/jimmunol.1501686 [DOI] [PMC free article] [PubMed] [Google Scholar]
- 26. Biglarnia A‐R, Huber‐Lang M, Mohlin C, Ekdahl KN, Nilsson B. The multifaceted role of complement in kidney transplantation. Nat Rev Nephrol. 2018;14(12):767‐781. doi: 10.1038/s41581-018-0071-x [DOI] [PubMed] [Google Scholar]
- 27. Cernoch M, Hruba P, Kollar M, et al. Intrarenal complement system transcripts in chronic antibody‐mediated rejection and recurrent IgA nephropathy in kidney transplantation. Front Immunol. 2018;9:2310. doi: 10.3389/fimmu.2018.02310 [DOI] [PMC free article] [PubMed] [Google Scholar]
- 28. Castellano G, Intini A, Stasi A, et al. Complement modulation of anti‐aging factor klotho in ischemia/reperfusion injury and delayed graft function. Am J Transplant. 2016;16(1):325‐333. doi: 10.1111/ajt.13415 [DOI] [PubMed] [Google Scholar]
- 29. Castellano G, Franzin R, Stasi A, et al. Complement activation during ischemia/reperfusion injury induces pericyte‐to‐myofibroblast transdifferentiation regulating peritubular capillary lumen reduction through pERK signaling. Front Immunol. 2018;9:1002. doi: 10.3389/fimmu.2018.01002 [DOI] [PMC free article] [PubMed] [Google Scholar]
- 30. Balducci E, Leroyer AS, Lacroix R, et al. Extracellular vesicles from T cells overexpress miR‐146b‐5p in HIV‐1 infection and repress endothelial activation. Sci Rep. 2019;9(1):10299. doi: 10.1038/s41598-019-44743-w [DOI] [PMC free article] [PubMed] [Google Scholar]
- 31. Camussi G, Cantaluppi V, Deregibus MC, Gatti E, Tetta C. Role of microvesicles in acute kidney injury. Contrib Nephrol. 2011;174:191‐199. doi: 10.1159/000329397 [DOI] [PubMed] [Google Scholar]
- 32. Jalal D, Renner B, Laskowski J, et al. Endothelial microparticles and systemic complement activation in patients with chronic kidney disease. J Am Heart Assoc. 2018;7(14):e007818. doi: 10.1161/JAHA.117.007818 [DOI] [PMC free article] [PubMed] [Google Scholar]
- 33. Tower CM, Reyes M, Nelson K, et al. Plasma C4d+ endothelial microvesicles increase in acute antibody‐mediated rejection. Transplantation. 2017;101(9):2235‐2243. doi: 10.1097/TP.0000000000001572 [DOI] [PubMed] [Google Scholar]
- 34. Qamri Z, Pelletier R, Foster J, et al. Early posttransplant changes in circulating endothelial microparticles in patients with kidney transplantation. Transpl Immunol. 2014;31(2):60‐64. doi: 10.1016/j.trim.2014.06.006 [DOI] [PMC free article] [PubMed] [Google Scholar]
- 35. Al‐Massarani G, Vacher‐Coponat H, Paul P, et al. Kidney transplantation decreases the level and procoagulant activity of circulating microparticles. Am J Transplant. 2009;9(3):550‐557. doi: 10.1111/j.1600-6143.2008.02532.x [DOI] [PubMed] [Google Scholar]
- 36. Meehan SM, Limsrichamrern S, Manaligod JR, et al. Platelets and capillary injury in acute humoral rejection of renal allografts. Hum Pathol. 2003;34(6):533‐540. doi: 10.1016/s0046-8177(03)00189-8 [DOI] [PubMed] [Google Scholar]
- 37. Dieudé M, Bell C, Turgeon J, et al. The 20S proteasome core, active within apoptotic exosome‐like vesicles, induces autoantibody production and accelerates rejection. Sci Transl Med. 2015;7(318):318ra200. doi: 10.1126/scitranslmed.aac9816 [DOI] [PubMed] [Google Scholar]
- 38. Sigdel TK, Ng YW, Lee S, et al. Perturbations in the urinary exosome in transplant rejection. Front Med. 2014;1:57. doi: 10.3389/fmed.2014.00057 [DOI] [PMC free article] [PubMed] [Google Scholar]
- 39. Peake PW, Pianta TJ, Succar L, et al. A comparison of the ability of levels of urinary biomarker proteins and exosomal mRNA to predict outcomes after renal transplantation. PLoS One. 2014;9(2):e98644. doi: 10.1371/journal.pone.0098644 [DOI] [PMC free article] [PubMed] [Google Scholar]
- 40. Merchant ML, Rood IM, Deegens JKJ, Klein JB. Isolation and characterization of urinary extracellular vesicles: implications for biomarker discovery. Nat Rev Nephrol. 2017;7(12):731–749. doi: 10.1038/nrneph.2017.148 [DOI] [PMC free article] [PubMed] [Google Scholar]
- 41. Park J, Lin H‐Y, Assaker JP, et al. Integrated kidney exosome analysis for the detection of kidney transplant rejection. ACS Nano. 2017;11(11):11041‐11046. doi: 10.1021/acsnano.7b05083 [DOI] [PMC free article] [PubMed] [Google Scholar]
- 42. Zhang H, Huang E, Kahwaji J, et al. Plasma exosomes from HLA‐sensitized kidney transplant recipients contain mRNA Transcripts which predict development of antibody‐mediated rejection. Transplantation. 2017;101(10):2419‐2428. doi: 10.1097/TP.0000000000001834 [DOI] [PubMed] [Google Scholar]
- 43. Baker DJ, Wijshake T, Tchkonia T, et al. Clearance of p16Ink4a‐positive senescent cells delays ageing‐associated disorders. Nature. 2011;479(7372):232‐236. doi: 10.1038/nature10600 [DOI] [PMC free article] [PubMed] [Google Scholar]
- 44. Sofue T, Kushida Y, Ozaki T, et al. Tubular cell senescence in the donated kidney predicts allograft function, but not donor remnant kidney function, in living donor kidney transplantation. Am J Nephrol. 2018;47(1):8‐17. doi: 10.1159/000485845 [DOI] [PubMed] [Google Scholar]
- 45. Sis B, Tasanarong A, Khoshjou F, Dadras F, Solez K, Halloran PF. Accelerated expression of senescence associated cell cycle inhibitor p16INK4A in kidneys with glomerular disease. Kidney Int. 2007;71(3):218‐226. doi: 10.1038/sj.ki.5002039 [DOI] [PubMed] [Google Scholar]
- 46. van Vliet T, Varela‐Eirin M, Wang B, et al. Physiological hypoxia restrains the senescence‐associated secretory phenotype via AMPK‐mediated mTOR suppression. Mol Cell. 2021;81(9):2041‐2052.e6. doi: 10.1016/j.molcel.2021.03.018 [DOI] [PubMed] [Google Scholar]
- 47. Arvizu‐Hernández M, Morales‐Buenrostro LE, Vilatoba‐Chapa M, et al. Time of occurrence of kidney acute antibody‐mediated allograft rejection/acute cellular rejection and cell senescence: implications for function outcome. Transplant Proc. 2010;42(7):2486‐2492. doi: 10.1016/j.transproceed.2010.04.068 [DOI] [PubMed] [Google Scholar]
- 48. Kojima H, Kunimoto H, Inoue T, Nakajima K. The STAT3‐IGFBP5 axis is critical for IL‐6/gp130‐induced premature senescence in human fibroblasts. Cell Cycle. 2012;11(4):730‐739. doi: 10.4161/cc.11.4.19172 [DOI] [PubMed] [Google Scholar]
- 49. Kojima H, Inoue T, Kunimoto H, Nakajima K. IL‐6‐STAT3 signaling and premature senescence. JAK‐STAT. 2013;2(4):e25763. doi: 10.4161/jkst.25763 [DOI] [PMC free article] [PubMed] [Google Scholar]
- 50. Takada Y, Kamimura D, Jiang J‐J, et al. Increased urinary exosomal SYT17 levels in chronic active antibody‐mediated rejection after kidney transplantation via the IL‐6 amplifier. Int Immunol. 2020;32(10):653‐662. doi: 10.1093/intimm/dxaa032 [DOI] [PubMed] [Google Scholar]
- 51. Jordan SC, Choi J, Kahwaji J, Vo A. Complement inhibition for prevention and treatment of antibody‐mediated rejection in renal allograft recipients. Transplant Proc. 2016;48(3):806‐808. doi: 10.1016/j.transproceed.2015.11.028 [DOI] [PubMed] [Google Scholar]
- 52. Basile DP, Bonventre JV, Mehta R, et al. Progression after AKI: understanding maladaptive repair processes to predict and identify therapeutic treatments. J Am Soc Nephrol. 2016;27(3):687‐697. doi: 10.1681/ASN.2015030309 [DOI] [PMC free article] [PubMed] [Google Scholar]
- 53. Dieudé M, Turgeon J, Karakeussian Rimbaud A, et al. Extracellular vesicles derived from injured vascular tissue promote the formation of tertiary lymphoid structures in vascular allografts. Am J Transplant Off J Am Soc Transplant Am Soc Transpl Surg. 2020;20(3):726‐738. doi: 10.1111/ajt.15707 [DOI] [PMC free article] [PubMed] [Google Scholar]
- 54. Xu‐Dubois Y‐C, Peltier J, Brocheriou I, et al. Markers of endothelial‐to‐mesenchymal transition: evidence for antibody‐endothelium interaction during antibody‐mediated rejection in kidney recipients. J Am Soc Nephrol. 2016;27(1):324‐332. doi: 10.1681/ASN.2014070679 [DOI] [PMC free article] [PubMed] [Google Scholar]
- 55. Goutaudier V, Perrochia H, Mucha S, et al. C5b9 deposition in glomerular capillaries is associated with poor kidney allograft survival in antibody‐mediated rejection. Front Immunol. 2019;10:235. doi: 10.3389/fimmu.2019.00235 [DOI] [PMC free article] [PubMed] [Google Scholar]
- 56. Loupy A, Lefaucheur C, Vernerey D, et al. Complement‐binding anti‐HLA antibodies and kidney‐allograft survival. N Engl J Med. 2013;369(13):1215‐1226. doi: 10.1056/NEJMoa1302506 [DOI] [PubMed] [Google Scholar]
- 57. Sicard A, Ducreux S, Rabeyrin M, et al. Detection of C3d‐binding donor‐specific anti‐HLA antibodies at diagnosis of humoral rejection predicts renal graft loss. J Am Soc Nephrol. 2015;26(2):457‐467. doi: 10.1681/ASN.2013101144 [DOI] [PMC free article] [PubMed] [Google Scholar]
- 58. Orandi BJ, Alachkar N, Kraus ES, et al. Presentation and outcomes of C4d‐negative antibody‐mediated rejection after kidney transplantation. Am J Transplant. 2016;16(1):213‐220. doi: 10.1111/ajt.13434 [DOI] [PMC free article] [PubMed] [Google Scholar]
- 59. Karasu E, Eisenhardt SU, Harant J, Huber‐Lang M. Extracellular vesicles: packages sent with complement. Front Immunol. 2018;9:721. doi: 10.3389/fimmu.2018.00721 [DOI] [PMC free article] [PubMed] [Google Scholar]
- 60. Stein JM, Luzio JP. Ectocytosis caused by sublytic autologous complement attack on human neutrophils. The sorting of endogenous plasma‐membrane proteins and lipids into shed vesicles. Biochem J. 1991;274(Pt 2):381‐386. doi: 10.1042/bj2740381 [DOI] [PMC free article] [PubMed] [Google Scholar]
- 61. Morgan BP, Dankert JR, Esser AF. Recovery of human neutrophils from complement attack: removal of the membrane attack complex by endocytosis and exocytosis. J Immunol. 1987;138(1):246‐253. [PubMed] [Google Scholar]
- 62. Braun F, Rinschen M, Buchner D, et al. The proteomic landscape of small urinary extracellular vesicles during kidney transplantation. J Extracell Vesicles. 2020;10(1):e12026. doi: 10.1002/jev2.12026 [DOI] [PMC free article] [PubMed] [Google Scholar]
- 63. Nauser CL, Farrar CA, Sacks SH. Complement recognition pathways in renal transplantation. J Am Soc Nephrol. 2017;28(9):2571‐2578. doi: 10.1681/ASN.2017010079 [DOI] [PMC free article] [PubMed] [Google Scholar]
- 64. Tang S, Zhou W, Sheerin NS, Vaughan RW, Sacks SH. Contribution of renal secreted complement C3 to the circulating pool in humans. J Immunol. 1999;162(7):4336‐4341. [PubMed] [Google Scholar]
- 65. Renner B, Ferreira VP, Cortes C, et al. Binding of factor H to tubular epithelial cells limits interstitial complement activation in ischemic injury. Kidney Int. 2011;80(2):165‐173. doi: 10.1038/ki.2011.115 [DOI] [PMC free article] [PubMed] [Google Scholar]
- 66. Stites E, Renner B, Laskowski J, et al. Complement fragments are biomarkers of antibody‐mediated endothelial injury. Mol Immunol. 2020;118:142‐152. doi: 10.1016/j.molimm.2019.12.011 [DOI] [PMC free article] [PubMed] [Google Scholar]
- 67. Matz M, Heinrich F, Lorkowski C, et al. MicroRNA regulation in blood cells of renal transplanted patients with interstitial fibrosis/tubular atrophy and antibody‐mediated rejection. PLoS One. 2018;13(8):e0201925. doi: 10.1371/journal.pone.0201925 [DOI] [PMC free article] [PubMed] [Google Scholar]
- 68. Lorenzen JM, Kaucsar T, Schauerte C, et al. MicroRNA‐24 antagonism prevents renal ischemia reperfusion injury. J Am Soc Nephrol. 2014;25(12):2717‐2729. doi: 10.1681/ASN.2013121329 [DOI] [PMC free article] [PubMed] [Google Scholar]
- 69. Tingle SJ, Sewpaul A, Bates L, et al. Dual MicroRNA blockade increases expression of antioxidant protective proteins: implications for ischemia‐reperfusion injury. Transplantation. 2020;104(9):1853‐1861. doi: 10.1097/TP.0000000000003215 [DOI] [PubMed] [Google Scholar]
- 70. Fiedler J, Jazbutyte V, Kirchmaier BC, et al. MicroRNA‐24 regulates vascularity after myocardial infarction. Circulation. 2011;124(6):720‐730. doi: 10.1161/CIRCULATIONAHA.111.039008 [DOI] [PubMed] [Google Scholar]
- 71. Castoldi G, di Gioia C, Giollo F, et al. Different regulation of miR‐29a‐3p in glomeruli and tubules in an experimental model of angiotensin II‐dependent hypertension: potential role in renal fibrosis. Clin Exp Pharmacol Physiol. 2016;43(3):335‐342. doi: 10.1111/1440-1681.12532 [DOI] [PubMed] [Google Scholar]
- 72. Qin W, Chung ACK, Huang XR, et al. TGF‐β/Smad3 signaling promotes renal fibrosis by inhibiting miR‐29. J Am Soc Nephrol. 2011;22(8):1462‐1474. doi: 10.1681/ASN.2010121308 [DOI] [PMC free article] [PubMed] [Google Scholar]
- 73. Wang B, Komers R, Carew R, et al. Suppression of microRNA‐29 expression by TGF‐β1 promotes collagen expression and renal fibrosis. J Am Soc Nephrol. 2012;23(2):252‐265. doi: 10.1681/ASN.2011010055 [DOI] [PMC free article] [PubMed] [Google Scholar]
- 74. Aguado‐Fraile E, Ramos E, Conde E, et al. A Pilot study identifying a set of microRNAs as precise diagnostic biomarkers of acute kidney injury. PLoS One. 2015;10(6):e0127175. doi: 10.1371/journal.pone.0127175 [DOI] [PMC free article] [PubMed] [Google Scholar]
- 75. Hu H‐F, Xu WW, Zhang W‐X, et al. Identification of miR‐515‐3p and its targets, vimentin and MMP3, as a key regulatory mechanism in esophageal cancer metastasis: functional and clinical significance. Signal Transduct Target Ther. 2020;5(1):271. doi: 10.1038/s41392-020-00275-8 [DOI] [PMC free article] [PubMed] [Google Scholar]
- 76. Zheng G‐D, Xu Z‐Y, Hu C, et al. Exosomal miR‐590‐5p in serum as a biomarker for the diagnosis and prognosis of gastric cancer. Front Mol Biosci. 2021;8:636566. doi: 10.3389/fmolb.2021.636566 [DOI] [PMC free article] [PubMed] [Google Scholar]
- 77. Ma J, Li Y‐T, Zhang S‐X, Fu S‐Z, Ye X‐Z. MiR‐590‐3p attenuates acute kidney injury by inhibiting tumor necrosis factor receptor‐associated factor 6 in septic mice. Inflammation. 2019;42(2):637‐649. doi: 10.1007/s10753-018-0921-5 [DOI] [PubMed] [Google Scholar]
- 78. Zhai Y, Qi Y, Long X, et al. Elevated hsa‐miR‐590‐3p expression down‐regulates HMGB2 expression and contributes to the severity of IgA nephropathy. J Cell Mol Med. 2019;23(11):7299‐7309. doi: 10.1111/jcmm.14582 [DOI] [PMC free article] [PubMed] [Google Scholar]
- 79. Gu C, Draga D, Zhou C, et al. miR‐590‐3p inhibits pyroptosis in diabetic retinopathy by targeting NLRP1 and inactivating the NOX4 signaling pathway. Invest Ophthalmol Vis Sci. 2019;60(13):4215‐4223. doi: 10.1167/iovs.19-27825 [DOI] [PubMed] [Google Scholar]
Associated Data
This section collects any data citations, data availability statements, or supplementary materials included in this article.
Supplementary Materials
Figure S1:
Figure S2:
Figure S3:
Data S1
Data Availability Statement
The data that support the findings of this study are available from the corresponding author upon reasonable request.