

Abstract
Slowing or reversing biological ageing would have major implications for mitigating disease risk and maintaining vitality1. While an increasing number of interventions show promise for rejuvenation2, the effectiveness on disparate cell types across the body and the molecular pathways susceptible to rejuvenation remain largely unexplored. We performed single-cell RNA-sequencing on 20 organs to reveal cell type specific responses to young or aged blood in heterochronic parabiosis. Adipose mesenchymal stromal cells, hematopoietic stem cells, and hepatocytes are among those cell types that are especially responsive. On the pathway level, young blood invokes novel gene sets in addition to reversing established ageing patterns, with the global rescue of genes encoding electron transport chain subunits pinpointing a prominent role of mitochondrial function in parabiosis-mediated rejuvenation. Intriguingly, we observed an almost universal loss of gene expression with age that is largely mimicked by parabiosis: aged blood reduces global gene expression, and young blood restores it in select cell types. Altogether, these data lay the groundwork for a systemic understanding of the interplay between blood-borne factors and cellular integrity.
Recent transcriptomic studies of major organs and cell types across the lifespan of the mouse (Tabula Muris Senis) uncovered both global and tissue/cell type-specific ageing signatures throughout the body3–5 providing a first glimpse at how ageing differentially impacts interconnected organs. But it remains unknown how, or if, the growing number of rejuvenation paradigms affect these global ageing pathways at a cellular level. Heterochronic parabiosis, in which a young and aged mouse share a common circulation, or systemic infusions of young blood are methods of rejuvenation with broad beneficial effects including on cognition, muscle strength, and bone repair in mice6; young blood also reversed the DNA-methylation age in multiple organs in rats7. Several circulatory proteins have been determined to mediate at least some of the observed effects1,8–11 but the consequences of parabiosis on distinct organs and cells are incompletely understood.
Here we attempt to address this question by performing Smart-seq2-based scRNA-seq of C57BL6/JN male mice following 5 weeks of heterochronic parabiosis, when mice had reached 4 and 19 months of age (equivalent to humans aged around 25 and 65 years). Targeted cell populations were captured via flow cytometry into microtiter plates from 20 organs: bladder, brain, brown adipose tissue (BAT, interscapular depot), diaphragm, gonadal adipose tissue (GAT, inguinal depot), heart, kidney, large intestine, limb muscle, liver, lung, marrow, mesenteric adipose tissue (MAT), pancreas, skin (epidermis), spleen, subcutaneous adipose tissue (SCAT, posterior depot), thymus, tongue, and trachea as detailed for each tissue and cell type (Fig. 1a–b, Extended Data Fig. 1, 2; Supplementary Table 1–3; Supplemental Figure Packet 1). By integrating single-cell ageing data from the simultaneously collected Tabula Muris Senis (Extended Data Fig. 1a), we were able to match cell type annotations per tissue and compare parabiosis-mediated rejuvenation (REJ) and accelerated ageing (ACC) to normal ageing (AGE). While mice from this parabiosis experiment and Tabula Muris Senis originate from the same cohort and were mapped to the same reference with the same parameters, the frozen cells were processed at different times. We therefore performed batch correction to account for technical artifacts (Extended Data Fig. 1j,k). Raw data is available from the Gene Expression Omnibus and a public AWS S3 bucket, gene-cell counts and metadata is available on Figshare, and the entire annotated dataset is available and accessible online via an interactive browser of the (see ‘Data availability’).
Fig. 1. Cell type-specific differential gene expression.
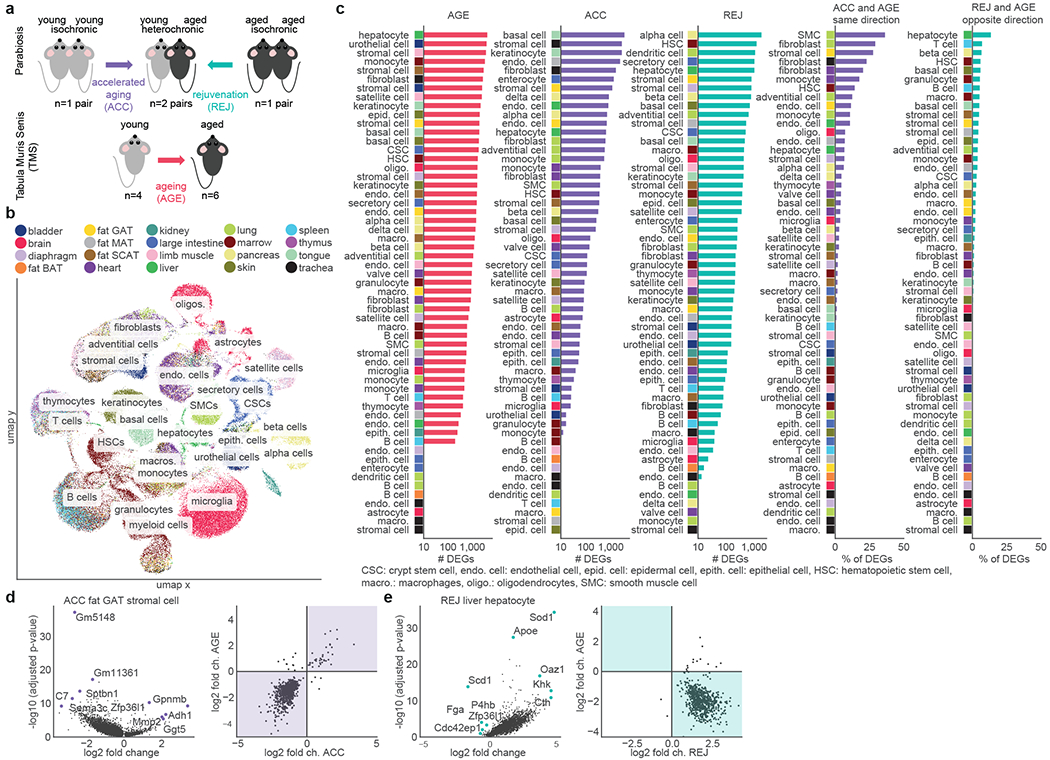
a, Experimental outline. Single cell transcriptomic data were collected from the indicated mice and tissues, see Methods. b, Uniform manifold approximation and projection visualization of the entire dataset. Cells are colored by tissue origin, see Methods ‘Data extraction’-‘Global UMAP visualization’. c, Cell types ranked by the percent/number of differentially expressed genes (DEGs) as indicated above each column (Wilcoxon–Mann–Whitney test with two-sided, adj. p-value<0.05, eff size>0.6), see Methods ‘Differential gene expression’ and ‘Analysis of the overlap of differentially expressed gene sets’. d-e, Differential gene expression results of ACC in fat GAT stromal cells (d), and REJ in liver hepatocytes (e). Volcano plots (left) show top DEGs. Comparisons of log2-fold changes (right) show changes with parabiosis on the x-axis and with normal ageing on the y-axis. Areas where ACC and AGE change in the same direction as well as where REJ and AGE change in the opposite direction are highlighted.
Cell type-specific responses
To determine which cell types are susceptible to accelerated ageing or rejuvenation during parabiosis (Fig. 1a) we analyzed differential gene expression (DGE) in 49 cell types for ACC (isochronic young vs. heterochronic young) and 51 cell types for REJ (isochronic aged vs. heterochronic aged) from a total of 20 tissues and 122,280 cells. We detect differentially expressed genes (DEGs; adj. p-value<0.05, eff. size>0.6) in nearly all cell types ranging from 10s to 1,000s of genes (Fig. 1c, Supplemental Figure Packet 2, Supplementary Tables 4, 5) with ageing exerting the strongest phenotype both in terms of the number of DEGs and their magnitude of change (Extended Data Fig. 3a–d). Aged blood more closely recapitulates the effects of normal aging than young blood does reversing it, although, generally, parabiosis induces many genes not affected by aging across most cell types (Fig. 1c). The number of DEGs were not significantly affected by differences in cell number (Extended Data Fig. 3e,f) or biological replicate number (Extended Data Fig. 4a) and differences between groups in percent mitochondrial genes, ribosomal genes, and ERCCs are not evident (Extended Data Fig. 1f–i, Extended Data Fig. 2e–h). Permuting the experimental groups within each cell type resulted in no DEGs (adj. p<0.05; eff. size>0.1). Finally, downsampling to 50 cells per biological group revealed stable DEG rankings (Extended Data Fig. 4b), as does iteratively increasing the stringency of adjusted p-value and AUC (Extended Data Fig. 4c), and sequencing saturation analysis uncovered no biases between experiments or conditions (Extended Data Fig. 1l).
At a cell type level, hepatocytes not only show the most DEGs with normal aging and a strong response to aged blood (Fig. 1c), but young blood causes an equally prominent increase in gene expression (Fig. 1e) and causes the largest reversal of age-related gene expression changes of any cell type (Fig. 1c, e, Supplementary Table 5). The high perfusion rate of the liver may explain this exceptional responsiveness of hepatocytes and, befittingly, they were one of the first cell types described to undergo rejuvenation during parabiosis12. On the other hand, endothelial cells (ECs) which are in immediate contact with blood, show discrete, tissue specific transcriptional susceptibility to young or aged blood and are more affected in MAT and GAT, for example, than in muscle (Fig. 1c). Another cell type, mesenchymal stromal cells (MSCs), display large numbers of DEGs in fat tissues, with GAT MSCs undergoing some of the largest gene expression changes of any cell type in response to parabiosis and 28% DEGs in the same direction as AGE (Fig. 1c,d, Supplementary Table 4). These findings may relate to the fact that visceral adipose tissues undergo some of the earliest and most dramatic transcriptomic changes with age4, and that the expansion and inflammation of visceral fat is especially detrimental.
Immune cell accumulation across diverse organs is a fundamental feature of ageing 4,13. We observed that tissue-resident immune cells of both the lymphoid and myeloid lineages are transcriptionally changed by parabiosis, as are their marrow-resident precursors, hematopoietic stem cells (HSCs; Fig. 1c), perhaps indicating a tight-knit relationship between ageing of the immune system and changes in blood composition. HSCs undergo appreciable age- and parabiosis-related gene expression changes, including enrichment for genes related to mRNA splicing (Extended Data Fig. 5b) consistent with studies of heterochronic transplantation of marrow or HSCs in mice14–17. Moreover, aged HSCs were found to induce circulating cyclophilin A, encoded by Ppia18, a gene ranked among the top DEGs across cell types exposed to aged blood (Extended Data Fig. 5a).
We find aged blood induces many cell type-specific changes akin to ageing, as can be seen by the large proportion of overlapping DEGs for many cell types (Fig. 1c, Extended Data Fig. 3g–j), while rejuvenation is a more concerted process: ageing DEGs rescued by rejuvenation are highly enriched for mitochondrial electron transport chain genes for many cell types (Extended Data Fig. 5c). We note that REJ and AGE also frequently share the same direction of gene expression change possibly pointing to repair and compensatory changes induced by aging and amplified with parabiosis.
As well, there are numerous instances where accelerated ageing and rejuvenation have little to no overlap with ageing DEGs (Fig. 1c). The reason for these discordant results is currently unknown, but it could be that ageing of these cells is influenced more by other factors, masking subtler effects caused by an altered systemic circulation. Overall, these data indicate that nearly all cell types are amenable to reformation via changes to blood composition, even those not directly exposed to blood. Furthermore, we find that ageing of certain cell types - for example HSCs which give rise to circulating and tissue-resident immune cells - is heavily influenced by the systemic milieu.
Gene specific responses
One way to assess the effects of parabiosis is to study the top genes in young mice exposed to aged blood that mirror normal ageing, and genes changing with ageing that are reversed by young blood (Fig. 2a, Extended Data Fig. 5a, Supplementary Tables 4, 5). Most conspicuously, across a range of cell types and tissues, young blood reverses the loss of expression in normal ageing of genes encoding electron transport chain subunits like Cox6c, Cox7c, Ndufa1, Ndufa3, Atp5k, and Uqcr11, (Fig. 2a, Extended Data Fig. 5d). Oxidative phosphorylation and the electron transport chain are the top enriched pathways (Extended Data Fig. 5c), with REJ reversing the expression loss of ageing in genes encoding each of the five complexes (Extended Data Fig. 6a). In fact, the top downregulated DEG across all cell types in ACC is Leucyl-tRNA synthetase (Lars2), which functions in the translation of mitochondrial encoded genes, and several cell types upregulate Lars2 in REJ (Fig. 2a). Interestingly, RNAi of lrs-2 in C. elegans was shown to greatly extend lifespan19. These single-cell ageing data are consistent with independent bulk organ RNA-seq data across the lifespan and of liver and adipose tissue from an independent cohort, but reveal cell type specific phenotypes missed previously (Extended Data Fig 6b,c), and they support a key role for mitochondrial dysfunction in ageing1,4.
Fig. 2. Young blood reverses mitochondrial & global gene expression loss.
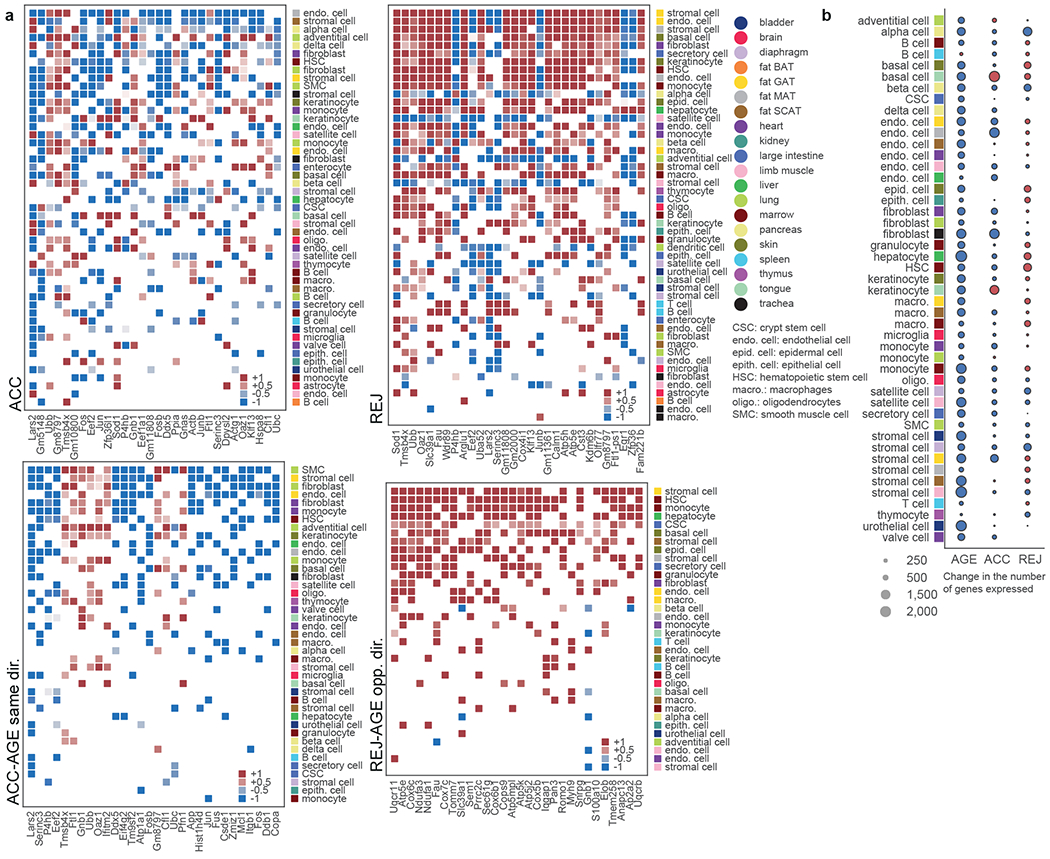
a, Most frequent DEGs shared across multiple cell types (Wilcoxon–Mann–Whitney test with two-sided adj. p-value<0.05, eff. size>0.6) and their log2-fold changes indicated for ACC (top left) and REJ (top right). DEGs shared with AGE are indicated at the bottom where: DEGs changing in the same direction with AGE and ACC (bottom left) and DEGs changing in the opposite direction with AGE and REJ (bottom right) are shown separately. b, Change of the mean number of genes expressed with AGE, ACC and REJ in case of each cell type, see Methods ‘Analysis of changes in the number of genes expressed’.
Modulation of mitochondrial gene expression is but one part of a more global response to differentially aged blood: not only is gene expression loss with age evident in nearly every cell type20, but this is mimicked by accelerated ageing and reversed in select cell types by rejuvenation (Fig. 2b, Extended Data Fig. 7a–f, Supplementary Tables 6–8). These findings support a fundamental role for transcriptional regulation itself in ageing and rejuvenation.
Structured responses
To investigate biological responses during parabiosis in an unbiased way, we identified gene expression pathways in response to ageing and parabiosis for each cell type. While ACC produced responses mostly consistent, but weaker, than ageing, REJ activated pathways related to cellular respiration very strongly, suggesting enhanced metabolic activity in heterochronic aged parabionts (Fig. 3a, b). Intriguingly, ATP synthesis coupled electron transport is the second highest enriched pathway in ACC as well, indicating that mitochondrial function in young cells may also be influenced by external factors (Extended Data Fig. 8a,b). Microglia and HSCs display the most similar overall transcriptional responses to ageing and aged blood (Fig. 3c). The presence of mitochondrial electron transport pathways common to these two groups is notable, as such genes commonly arise and overlap between ageing and rejuvenation (Extended Data Fig. 8c; Supplemental Figure Packet 3). Although aged blood may contribute to age-related decline in some cell populations, young blood can induce mitochondrial genes in cell types in which age-related decline is not especially strong, like pancreatic beta cells (Extended Data Fig. 8d), supporting the notion that young blood may indeed broadly enhance mitochondrial function.
Fig. 3. Structured responses to parabiosis.
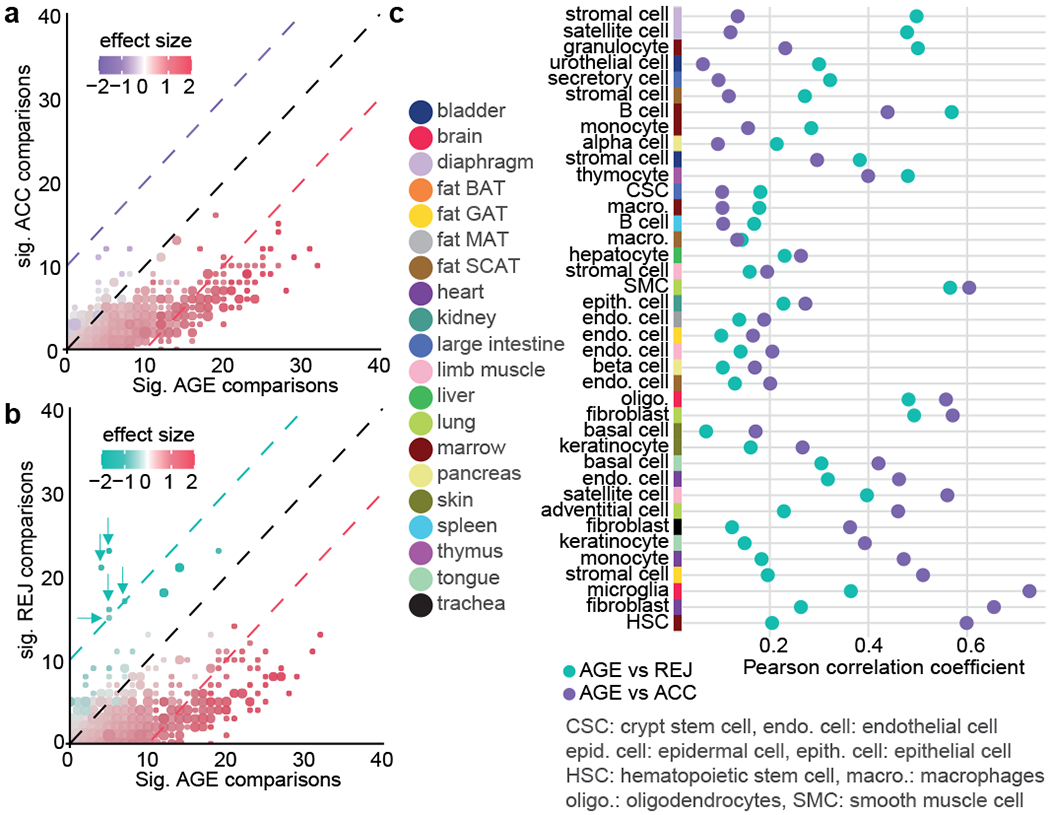
a, Scatter plot showing the number of cell types where pathways are significantly affected in ACC (y-axis) and AGE (x-axis). Pathways affected in the same number of comparisons on the x-axis and y-axis are grouped together, dot sizes show the size of the groups, see Methods ‘Pathway analysis’. b, Same as for a, comparing significantly affected pathways in REJ and AGE. Mitochondria related pathways in REJ are highlighted by arrows. c, Pearson correlation coefficient for each tissue and cell type comparing pathway profiles between indicated groups.
There are also cell types for which rejuvenation is highly correlated with ageing, exemplified by the stem cell and stem cell-like populations of satellite cells and MSCs from the diaphragm (ρ=0.50 and 0.48). Intriguingly, the same cell type, present in different organs, often shows highly divergent responses to AGE, ACC, and REJ, suggesting a more prominent role of the cellular environment over circulating factors.
Coordinated cellular responses
To assess overarching effects of ageing we computed the pairwise cosine similarity between each cell type based on their AGE differentially expressed gene sets. In other words, high similarity will be assigned to two cell types that express similar sets of ageing DEGs. We then first visualize the results by plotting the corresponding histogram of similarity scores for all pairwise comparisons (Fig. 4a). After repeating this analysis for ACC and REJ, it is evident that while the highest similarities are observed for AGE, the transcriptomic signatures of REJ show considerable conservation between cell types. Such commonalities are absent in ACC, consistent with divergent pathways arising for top ACC DEGs (Extended Data Fig. 8b). To determine which groups of cell types are responsible for the ageing similarity signature, we plotted the closest connection for each cell type (Fig. 4, Extended Data Fig. 9a–c). Remarkably, ageing instigates coordinated transcriptomic changes with high similarity within some tissues, most notably pancreas and skin, yet clearly distinct signatures between tissues overall, suggesting that local pro-ageing factors or programs may govern ageing of these tissues. Equally exciting, we discovered that cell types, such as endothelial cells, MSCs, and immune cells share transcriptional programs of ageing across vastly different and distant tissues, possibly reflecting cell intrinsic transcriptional programs of ageing. Indeed, for mesenchymal stromal cells across four adipose tissues and two skeletal muscle types, the loss of collagen gene expression forms a core network (Extended Data Fig. 9 d, f). It is particularly intriguing that collagen, the main component of the extracellular matrix and produced largely by fibroblasts and stromal cells, has core functions not only in scarring and fibrosis but in tissue regeneration and maintenance in general. Age-related loss, or indeed gain, of collagen content in different tissues is known to impair homeostatic function, as is extensive collagen cross linking21. In the context of immune cells, it has been speculated that infiltration of these cells may lead to “spreading” of ageing in invaded tissues through secreted factors4,22. Future studies may explore the basis of cellular “hubs” which are transcriptionally related to many cell types - e.g. monocytes of marrow, ECs of SCAT - while other cell types are less connected.
Fig. 4. Coordinated, organism-wide cellular responses to ageing and parabiosis.
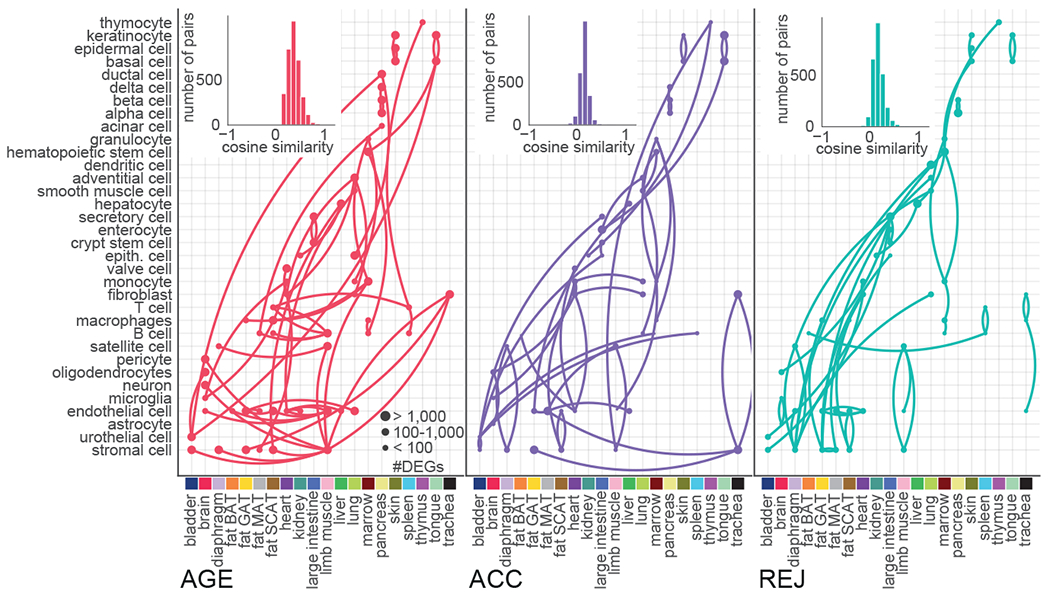
Histograms shown of pairwise cosine similarities that are calculated between each cell type based on the cell type specific DGE signatures of AGE, ACC, and REJ, see Methods ‘Ageing and rejuvenation similarity analysis’. Each cell type is connected to its most similar cell type. Cell types of the same tissue are listed vertically, while similar cell types with different tissue of origin are listed horizontally.
A similar analysis of parabiosis shows that an aged circulation mimics, in part, the tissue and cell type specific transcriptional similarities, but they are overall less pronounced, and many disappear (Fig. 4). Intriguingly, while skin and marrow maintain solid tissue-wide cellular transcriptomes following exposure to young blood – albeit different from those observed with ageing – many new transcriptional similarities emerge across cell types and tissues. Most notably, REJ triggers similar transcriptional signatures across highly divergent cell types. For example, the mitochondrial electron transport gene node emerges once again as a core rejuvenation network, and is especially strong between MSCs (GAT, MAT), hepatocytes, basal and epidermal cells from skin, and HSCs and macrophages from marrow (Extended Data Fig. 9e, g).
Discussion
Our dataset provides a first systematic look into the transcriptomic effects of heterochronic parabiosis at single-cell resolution across the entire organism. Continuous exposure to differentially aged blood alters the transcriptomic landscape across cell types, and we discovered that particular cell types - namely MSCs, HSCs, and hepatocytes - are especially susceptible to gene expression changes. While the effects of aged blood tend to accelerate normal ageing changes, young blood both reverses age-related profiles and initiates novel pathways. And while the reversal of aging through young blood may be easier to grasp, it will be equally interesting to explore the molecular and functional as well as therapeutic implications of those novel pathways. Systemic rejuvenation of genes encoding components of the electron transport chain is especially striking, as is the reversal of global gene expression loss with age. Together, these findings reveal the molecular details of how ageing and parabiosis trigger highly complex global responses across the organism, some of which are tissue-specific and some cell type-specific, likely reflecting a sophisticated combination of cellular, local, and systemic transcriptional cues. These newly discovered transcriptional programs shared between cell types in response to the three chronogenic environments suggest possible avenues for therapeutic interventions, although it remains possible that cell types not included in the study respond differently. Finally, heterochronic parabiosis represents only one rejuvenation paradigm, and organism-wide analysis of other interventions, such as was recently conducted for caloric restriction in rats13, may help uncover complimentary treatments able to comprehensively target ageing hallmarks throughout the body.
Methods
Experimental procedures
Parabiosis and organ collection
3-month-old and 18-month-old male C57BL/6JN mice were shipped from the National Institute on Ageing colony at Charles River (housed at 19–23 °C) to the Veterinary Medical Unit (VMU; housed at 20–24 °C, humidity ranged from 30-70%)) at the VA Palo Alto (VA). At both locations, mice were housed on a 12 h/12 h light/dark cycle and provided with food and water ad libitum. The diet at Charles River was NIH-31, and at the VA VMU was Teklad 2918. Littermates were not recorded or tracked, and mice were housed at the VA VMU for no longer than 2 weeks before surgery.
Parabiosis via the peritoneal method was accomplished by suturing together the peritoneum of adjacent flanks, forming a continuous peritoneal cavity. To promote coordinated movement, adjacent knee joints and elbow joints were joined with nylon monofilament sutures. Skin was joined with surgical autoclips. All procedures were conducted with aseptic conditions on heating pads, with mice under continuous isoflurane anesthesia. To prevent infection, limit pain, and promote hydration, mice were injected with Baytril (5 ug/g), Buprenorphine, and 0.9% (w/v) sodium chloride, as described previously6,23. Pairs remained together for 5 weeks prior to organ collection.
After anaesthetization with 2.5% v/v Avertin at 8:00, mice were weighed, shaved, and blood was drawn via cardiac puncture before transcardial perfusion with 20 ml PBS. Mesenteric adipose tissue was then immediately collected to avoid exposure to the liver and pancreas perfusate, which negatively affects cell sorting. Isolating viable single cells from both the pancreas and the liver of the same mouse was not possible; therefore only one was collected from each mouse. Whole organs were then dissected in the following order: large intestine, spleen, thymus, trachea, tongue, brain, heart, lung, kidney, gonadal adipose tissue, bladder, diaphragm, limb muscle (tibialis anterior), skin (dorsal), subcutaneous adipose tissue (inguinal pad), brown adipose tissue (interscapular pad), aorta and bone marrow (spine and limb bones). Organ collection concluded by 10:00. After single-cell dissociation as described below, cell suspensions were used for FACS of individual cells into 384-well plates. All animal care and procedures were carried out in accordance with institutional guidelines approved by the VA Palo Alto Committee on Animal Research.
Sample size, randomization and blinding
No sample size choice was performed before the study. Blinding was not performed: the authors were aware of all data and metadata-related variables during the entire course of the study.
Tissue dissociation and sample preparation
All tissues were processed as previously described5.
Single-cell methods
All protocols used in this study are described in detail elsewhere3,5. These include: preparation of lysis plates; FACS sorting; cDNA synthesis using the Smart-seq2 protocol24,25; library preparation using an in-house version of Tn526,27; library pooling and quality control; and sequencing. For further details please refer to https://www.protocols.io/view/smartseq2-for-htp-generation-of-facs-sorted-single-2uwgexe.
Computational methods
Data extraction
Sequences from the NovaSeq were de-multiplexed using bcl2fastq version 2.20. Reads were aligned with Gencode v.M19 annotations using STAR version 2.5.2b with parameters TK. Gene counts were produced using HTSEQ version 0.6.1p1 with default parameters, except ‘stranded’ was set to ‘false’, and ‘mode’ was set to ‘intersection-nonempty’. We merged these data with scRNA-seq profiles of cells from young (3-month-old males) and aged (combined 18-month-old & 24-month-old males) mice from the Tabula Muris Senis Smart-seq2 data4,5. All subsequent data processing and analysis is conducted on this merged dataset. Note that we chose to merge the 18- and 24-month-old data from Tabula Muris Senis in order to bolster the low cell counts of 18-month-olds alone and improve the robustness of downstream analyses.
Quality control
We applied standard filtering rules following the guideline of Luecken et al.28. We discarded cells with (1) fewer than 500 genes or (2) less than total 5,000 reads or (3) more than 30% ERCC reads or (4) more than 10% mitochondrial reads or (5) more than 10% ribosomal reads. Counts were then CPM scaled and log-normalized for downstream analysis. Saturation analysis was performed with the scanpy.pp.downsample_counts function of the Scanpy package. Analysis was implemented in Python (3.8.3) with the Scanpy29 (1.6.0) package.
Data integration and clustering
We merged the data from Tabula Muris Senis and the parabionts and grouped the data based on tissue of origin. The top 5,000 highly variable genes (HVGs) were selected and 20 principal components (PCA) were calculated within each tissue. The number of principal components were identified with the elbow method. We then used the BBKNN batch correction algorithm30 to integrate data from Tabula Muris Senis and the parabionts. BBKNN calculates a batch corrected neighborhood graph from the imputed principal components. We set the individual mouse ids as batch labels and hence not only corrected for data, but potential mouse specific batch effects. Given the large number of mice in total, we set to query one neighbor per batch.
We then used the batch corrected, tissue specific neighborhood graphs to run Leiden clustering31 and to calculate UMAP embeddings32 within each tissue. To infer the quality of batch correction, we calculated entropy batch mixing on the batch corrected neighborhood graphs. Furthermore, we calculated average LISI scores33 from the UMAP embeddings. In order to show potential changes within these metrics due to batch correction, we calculated tissue specific neighborhood graphs without any batch correction and repeated the subsequent analysis steps on these neighborhood graphs. Note that for every downstream analysis we used then the batch corrected tissue specific results. All analysis steps except for calculating batch entropy mixing and LISI scores were run in Python (3.8.3) by using the Scanpy29 (1.6.0) package, BBKNN30 (1.3.6), and umap-learn32 (0.3.1). The batch entropy mixing calculation was implemented with Numpy (1.18.1), Pandas (1.1.1), and Scikit-learn34 (0.22.1). LISI scores were calculated with the LISI R package33.
Cell type annotation
We used the cell type annotations of Tabula Muris Senis to annotate cells from the parabionts. Since Tabula Muris Senis includes some highly specific annotations first we joined some of these to achieve more robust results. These merging rules can be found in Supplementary Table 1 where we list for each cell type label from Tabula Muris Senis the corresponding label we used. Then, we utilized the tissue specific, batch corrected neighborhood graphs containing one neighbor per mouse for each cell, and labeled each cell from the parabiosis experiment based on its network neighborhood with majority voting. We calculated the most frequent cell type among the cell’s neighbors from Tabula Muris Senis and used this to annotate the cell. Analysis was implemented in Python (3.8.3), with Numpy (1.18.1), Pandas (1.1.1), Scanpy (1.6.0), and Scikit-learn (0.22.1) packages.
Global UMAP visualization
Once each cell was annotated, solely for visualization purposes we rerun the HVG, PCA, batch correction, UMAP calculation steps by using the whole, log-CPM normalized dataset. These results are not used in any of the downstream analyses but provided in order to present an overview of the entire dataset.
Differential gene expression
We systematically analyzed parabiosis signatures across 3 comparisons (AGE: Y-A, ACC: IY-HY, REJ: IA-HA) within each identified cell type of each tissue with at least 50 cells per control and treatment groups. We conducted single-cell differential gene expression for the 3 comparisons within each cell type separately. Specifically, we computed standard log2-fold changes as well as the non-parametric unpaired Wilcoxon–Mann–Whitney test35 for each gene. Two-sided p-values were corrected with Benjamini-Hochberg procedure36 (FDR=0.05) per cell type and comparison. Finally, we identified genes differentially expressed with effect size>0.6 and adjusted p-value<0.05. Note that filtering for effect size is especially important since single-cell data often contains large sample sizes with thousands of cells per condition and effect size cutoffs are not sensitive to sample size. We discarded genes used for QC filtering (Rb* and Mt-*) from the DGE analysis since these may be biased by the QC process. In order to investigate the effect of downsampling on the differential gene expression analysis, we used the scanpy.pp.subsample method of scanpy and sampled 50 cells per condition. We then repeated all the steps of differential gene expression on the subsampled data. Analysis was implemented in Python (3.8.3) with the Numpy (1.18.1), Pandas (1.1.1), and Scanpy (1.6.0) packages.
Analysis of the overlap of differentially expressed gene sets
We investigated the potential overlap of AGE DEGs and parabiosis (ACC and REJ) DEGs. First, within each cell type we calculated the contingency table of up- and downregulated genes with AGE and ACC. These 3x3 tables (a gene may be upregulated, not changing, or downregulated) include the union of all DEGs of AGE and ACC. We considered genes then “consistent” if they changed in the same direction with AGE and ACC and calculated the fraction of these out of the total number of DEGs defined as the union of AGE and ACC DEGs. Similarly, we defined genes changing in the opposite direction with AGE and ACC “inconsistent”. We ran chi-square tests to validate the significance of the overlaps and performed Fisher’s exact test for post hoc analysis to investigate the significance of consistent and inconsistent overlaps. We conducted a similar analysis between AGE and REJ except for defining genes that changed in the opposite direction with AGE and REJ “consistent” and genes that changed in the same direction with AGE and REJ “inconsistent”. Analysis was implemented in Python (3.8.3) with Numpy (1.18.1), Pandas (1.1.1), and Scipy (1.5.1).
Analysis of changes in the number of genes expressed
For each cell the number of genes expressed were calculated as the number of genes with at least one count. We grouped the data then by cell type, tissue, and condition (Y, A, IY, HY, IA, HA) and calculated the mean number of genes expressed per group. We then computed changes in the mean number of genes expressed of each cell type within each cell type across AGE (Y-A), ACC (IY-HY) and REJ (IA-HA). Additionally, we asked if changes across these comparisons are general and hence not cell type specific. We performed regression analyses with Linear Mixed Effects models separately for AGE, ACC, and REJ. We sampled 50 cells equally per cell type from both control (AGE: Y, ACC: IY, REJ: IA) and treatment (AGE: A, ACC: HY, REJ: HA) groups. Next we ran a Linear Mixed Effects model where we set the number of genes expressed as a dependent variable, mouse replicate as random effect, and finally the cell type, sequencing depth, and group (control or treatment) attributes as independent variables. Finally, we investigated the potential effect of transcriptional noise. We grouped the data by condition (Y, A, IY, HY, IA, HA) and cell type and calculated cell-cell variability and overdispersion37,38. Analysis was implemented in Python (3.8.3). with Numpy (1.18.1), Pandas (1.1.1), and statsmodels (0.12.0).
Pathway analysis
Gene set enrichment analysis (GSEA) was performed using GeneTrail 339 based on the expressed genes and sorted such that the most significantly upregulated genes were at the beginning of the list and the most significantly downregulated ones at the end, using the categories of Gene Ontology40 Biological Process. P-values were adjusted for multiple testing using the Benjamini-Hochberg procedure36. Pathways that were significantly enriched or depleted were counted as being significantly affected. Results were analyzed with the programming language R (4.0.2). To generate the enrichment heatmaps the 30 most enriched categories of each comparison were extracted. The rows were clustered with Ward’s clustering criterion and Euclidean distance. Pathways were determined to be related to mitochondria by ensuring that at least 25% of the genes associated with the corresponding pathway were present in MitoCarta 3.041. The heatmaps were plotted with the ComplexHeatmap42 (2.4.2) R package. The scatter plot comparing the number of significantly affected cell types and tissues by AGE, REJ or ACC pathways was plotted with ggplot243 (3.3.2). The effect size was determined by computing the difference between the log10 transformed enrichment P-values of the corresponding pathway (AGE and parabiosis, ACC or REJ). The effect size of multiple pathways was defined as the average effect size of all single pathways. For visualization purposes, to control outliers, the effect sizes were clipped between −2.5 and 2.5. To determine the most differently affected pathways per comparison, we filtered similar terms using the GOSemSim R package (2.14.0) according to the Jiang measure with a cutoff at a similarity of 0.7. We computed for every setup comparison the per tissue and cell type similarity of the determined enrichment P-values on the negative log10 transformed values by using Pearson’s correlation coefficient.
Ageing and rejuvenation similarity analysis
We base these analyses on the differential gene expression results. We define similarities between cell types for the 3 comparisons (AGE, ACC, REJ) separately. First, for a specific comparison we select genes that are differentially expressed with eff size>0.6, adjusted p-value<0.05 per cell type. Next, we take the vectors indicating the log2-fold changes across these genes per cell type. We compute the cosine similarities of those vectors and hence calculate pairwise similarities between the cell types. We present the structure of these similarity networks in our results. Analysis was implemented in Python (3.8.3) with Gseapy (0.10.1), Networkx44 (2.5.0), Numpy (1.18.1), Pandas (1.1.1), Scanpy (1.6.0), Scikit-learn (0.22.1), and Seaborn (0.11.0) packages.
STRING network analysis
For each set of DEGs of interest, we queried the STRING database45 for links with >0.9 confidence.
Bulk RNA-seq validation experiments
Tissue samples were collected and processed as previously described2. Following library preparation, 180 samples were sequenced on a single lane on a NovaSeq 6000 machine configured at 150bp paired-end. Raw sequencing files were demultiplexed using Illumina bcl2fastq. Unfiltered FASTQ files were then processed using the RNA-seq pipeline (3.0) of the nf-core project46. In brief, the pipeline consists of quality-control analysis, adapter trimming, read mapping and filtering using STAR47, post-alignment sorting and filtering, transcription quantification with RSEM48, and further quality-control statistics. As associated reference the mouse genome GRCm38 along with GENCODE vM19 genomic feature release was used. Raw transcript and gene abundances per-sample were loaded with the tximport package49 (1.18.0) in the statistical programming language R (4.0.5). Samples with less than 5 million reads per samples were removed from further analysis. Imported counts of valid samples were then processed with DESeq250 (1.30.1) for read count normalization based on sample sequencing depth and effective gene lengths and differential expression analysis at standard parameters but alpha level set to 0.05. Resulting log-scaled fold-changes were shrunken using the standard ‘normal’ approach. To map Ensembl gene IDs to gene names we used the corresponding mapping as specified in the GENCODE vM19 annotation file. For reading and writing of data files and tables we used the R packages data.table (1.14.0), openxlsx (4.2.3) and readr (1.4.0).
Extended Data
Extended Data Fig. 1. Outline of data analyses and tissue specific data overview.
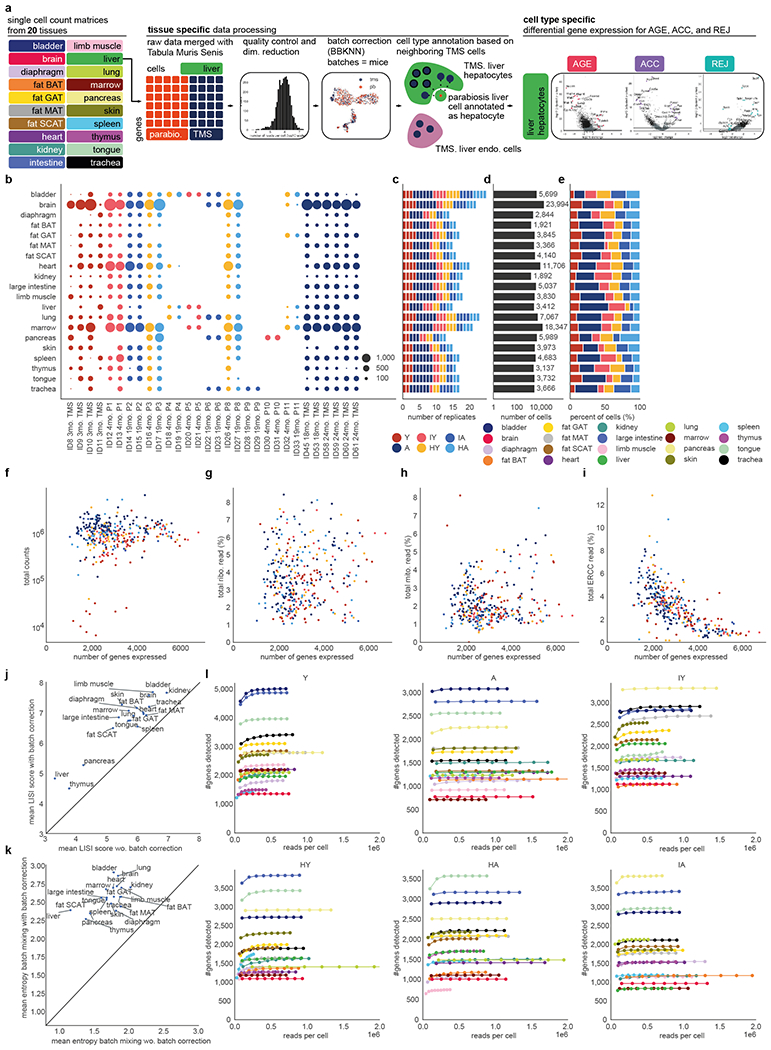
a, Outline of computational analyses. Single-cell count data are processed per tissue, see Methods ‘Quality control’-’Cell type annotation’. Differential gene expression is then conducted per cell type and comparison (AGE, ACC, REJ) within each tissue, see Methods ‘Differential gene expression’. All of the next panels present data after quality control. b, Number of cells per tissue and replicate. Replicates are colored by their condition. c, Number of replicates per tissue. Replicates are colored by their condition. d, Total number of cells per tissue. e, Fraction of cells within each condition per tissue. f-i, For each experimental condition within each tissue: total read counts (f), the percent of reads mapped to ribosomal genes (g), mitochondrial genes (h), and ERCC spike-ins (i) plotted against the mean number of genes expressed. j, Average LISI scores of mouse replicates calculated over the batch corrected tissue specific UMAP embeddings plotted against the mean LISI scores of tissue specific UMAP embeddings calculated from neighborhood graphs without batch correction. k, Mean entropy batch mixing of mouse replicates calculated over the tissue specific batch-corrected neighborhood graph plotted against the mean entropy batch mixing calculated from neighborhood graphs without batch correction. l, Result of saturation analyses shown per condition (Y, A, IY, HY, IA, HA). Downsampling was carried out per condition within each tissue separately. Results indicate the number of detected genes as the function of the downsampled total counts.
Extended Data Fig. 2. Cell type specific data overview.
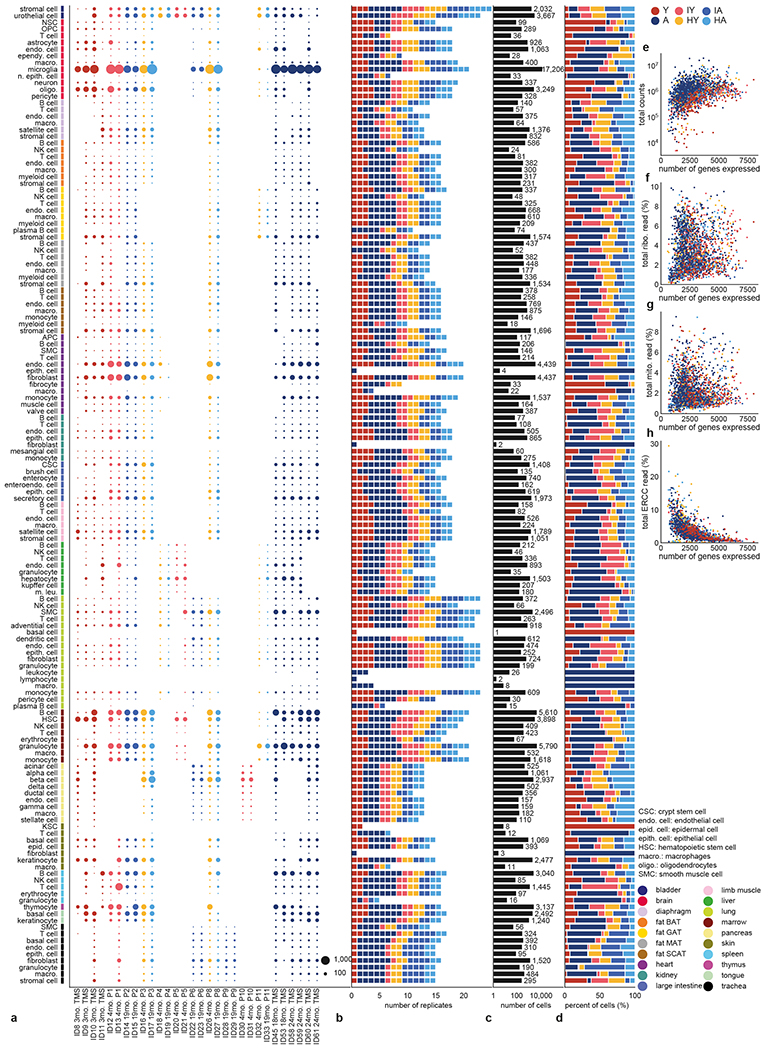
All panels present data after quality control. a, Number of cells per cell type and replicate. Replicates are colored by their condition. b, Number of replicates per cell type. Replicates are colored by their condition. c, Total number of cells per cell type. d, Fraction of cells within each condition per cell type. e-h, For each experimental condition within each cell type, total read counts (e), the percent of reads mapped to ribosomal genes (f), mitochondrial genes (g), and ERCC spike-ins (h) plotted against the mean number of genes expressed.
Extended Data Fig. 3. Validation of differential gene expression analysis.
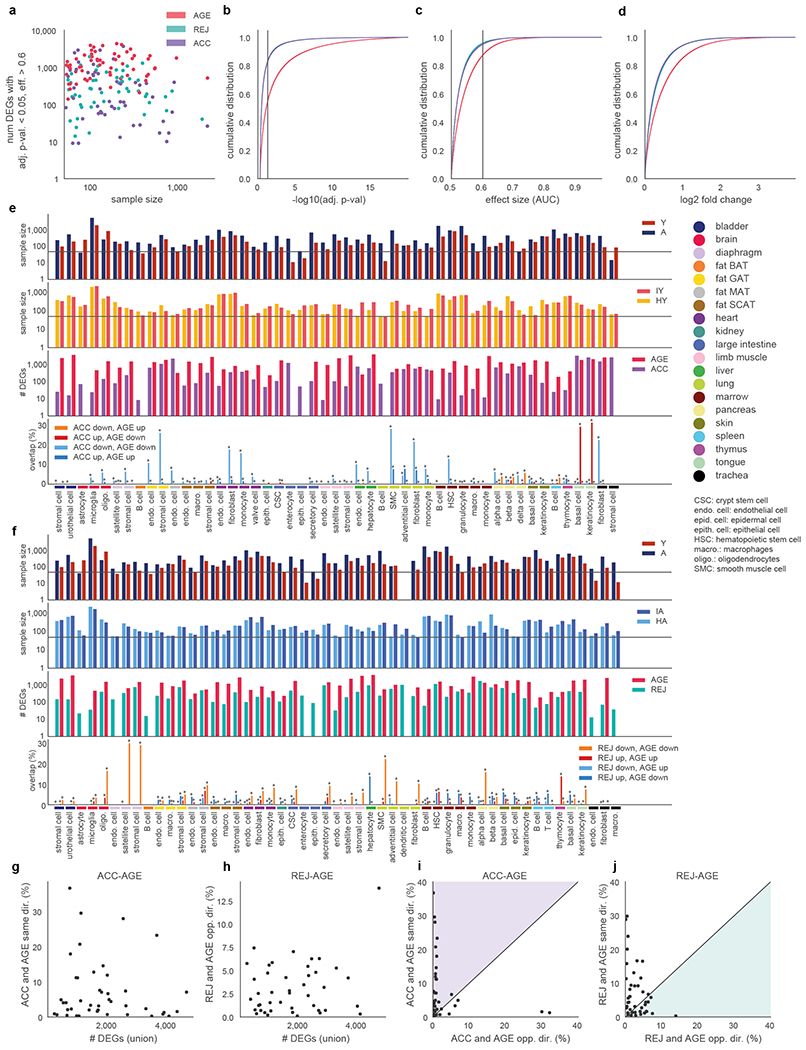
a, Number of DEGs plotted against the total number of cells within the control and treatment groups. Each dot represents a DGE comparison of a cell type. b-d, Cumulative distributions of the calculated effect size (b), −log10(adj. p-value) (c) and log2 fold change values (d). Distributions are shown separately for ACC, REJ and AGE DGE. Vertical lines indicate the cutoffs applied throughout the study. e, Summary of ACC DGE results. Each cell type that has at least 50 cells in IY and HY is studied in the context of ACC and hence shown. From top to bottom: control and treatment sample sizes indicated separately for AGE and ACC, the number of genes differentially expressed in AGE and ACC, overlaps between AGE and ACC. Overlaps are normalized by the number of DEGs in the union of ACC and AGE DEGs. f, Summary of REJ DGE results. Each cell type that has at least 50 cells in IA and HA is studied in the context of REJ and hence shown. From top to bottom: control and treatment sample sizes indicated separately for AGE and REJ, the number of genes differentially expressed in AGE and REJ, overlaps between AGE and REJ. Overlaps are normalized by the number of DEGs in the union of REJ and AGE DEGs. g, Percent of DEGs that change in the same direction with AGE and ACC are plotted against the total number of DEGs within AGE and ACC for each comparison. Percentages are based on the union of DEGs as defined in (e) h, Percent of DEGs that change in the opposite direction with AGE and REJ are plotted against the total number of DEGs within AGE and REJ for each comparison. Percentages are based on the union of DEGs as defined in (f). i, Fraction of DEGs changing in the same direction with AGE and ACC plotted against the fraction of DEGs changing in the opposite direction with AGE and ACC. Each dot represents a cell type of the study. Colored area indicates where more DEGs change in the same direction than in the opposite direction. j, Fraction of DEGs changing in the same direction with AGE and REJ plotted against the fraction of DEGs changing in the opposite direction with AGE and REJ. Each dot represents a cell type of the study. Colored area indicates where more DEGs change in the opposite direction than in the same direction.
Extended Data Fig. 4. Validation of differential gene expression analysis.
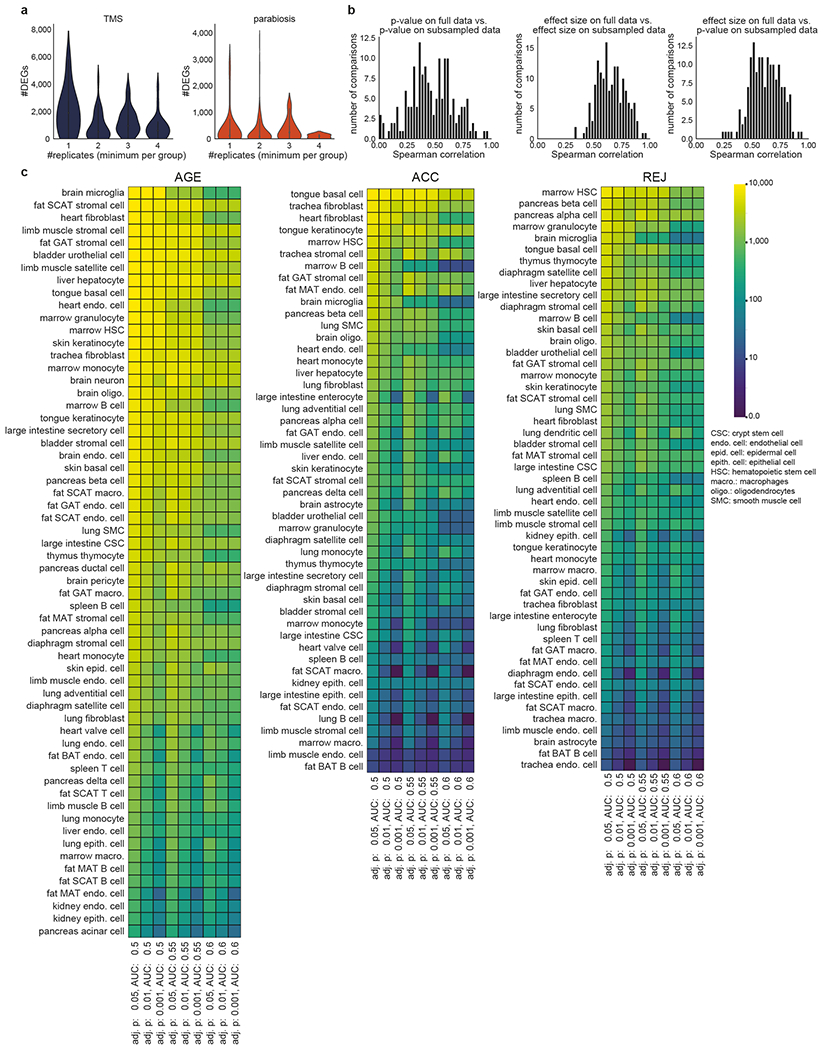
a, Violin plots showing the number of differentially expressed genes as the function of the number of replicates per comparison. The number of replicates are defined as the minimum number of replicates within the control and treatment groups. Results are shown separately for TMS (left) and parabiosis (right). b, Comparison of differential gene expression results with and without subsampling in case of each cell type specific comparison. Spearman correlation values indicate (dis)similarities between: p-values derived from the original and subsampled data (left), effect sizes calculated from the original and subsampled data (middle), and effect sizes calculated on the original data and p-values derived from the subsampled datasets. c, Number of DEGs identified at different p-value and effect size cutoffs per comparison in AGE (left), ACC (middle), and REJ (right).
Extended Data Fig. 5. Differential gene expression results.
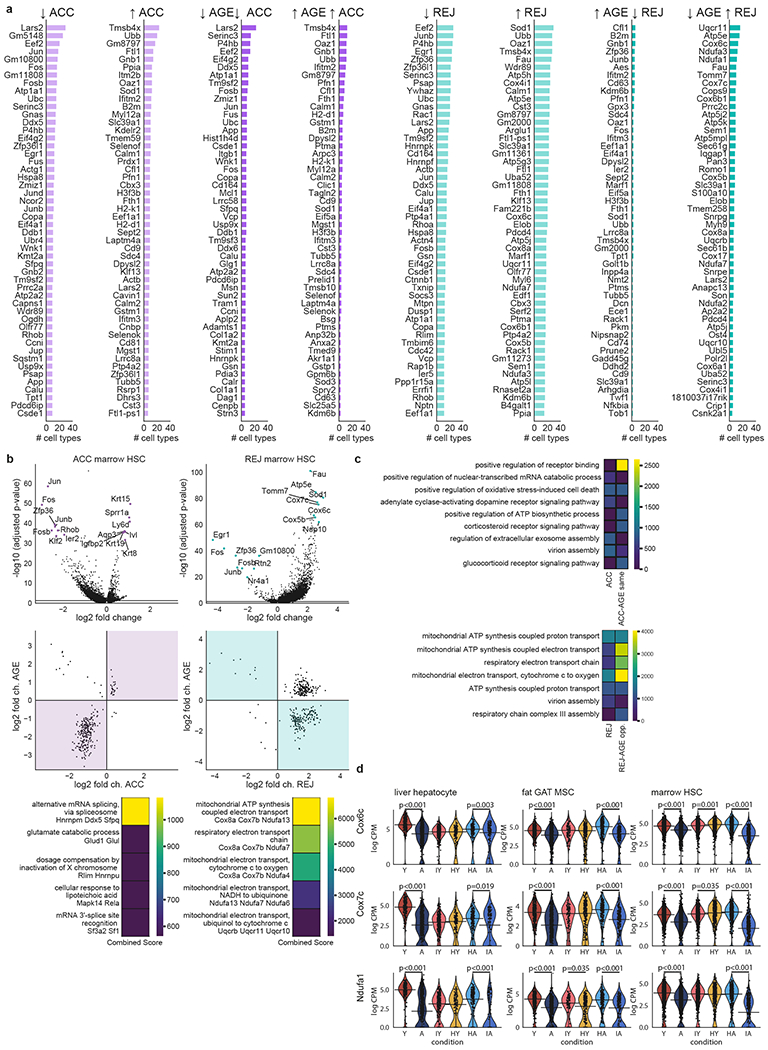
a, Top list of the 50 most frequent DEGs identified for ACC and REJ. Results are shown separately for up and downregulation. Columns with darker bars indicate top lists where only changes consistent with AGE are shown. These include genes changing in the same direction with ACC and AGE, as well as genes changing in the opposite direction with REJ and AGE. b, DGE results for marrow HSCs for ACC (left) and for REJ (right). from top to bottom: volcano plots (top) show top DEGs. Comparisons of log2-fold changes (middle) show changes with parabiosis on the x-axis and with normal ageing on the y-axis. DEGs with adj. p-value<0.05, eff. size>0.6 are shown. Areas where ACC and AGE change in the same direction as well as where REJ and AGE change in the opposite direction are highlighted. Top pathways (GO Biological Process) with highest ‘Combined scores’ defined as in Enrichr51 are shown at the bottom. c, Most enriched pathways (GO Biological Process) among the 100 most frequent DEGs shared across multiple cell types. Results shown for ACC and ACC-AGE same direction (top), and REJ and REJ-AGE opposite direction (bottom). Combined scores are defined as in Enrichr51. d, Gene expression violin plots for liver hepatocytes, GAT MSCs and marrow HSCs of select genes encoding proteins of the electron transport chain. Significance values show the adj. p-values of the Wilcoxon–Mann–Whitney test (two-sided) based differential gene expression, see Methods: ‘Differential gene expression’.
Extended Data Fig. 6. Analyses of genes associated with the 5 OXPHOS complexes.
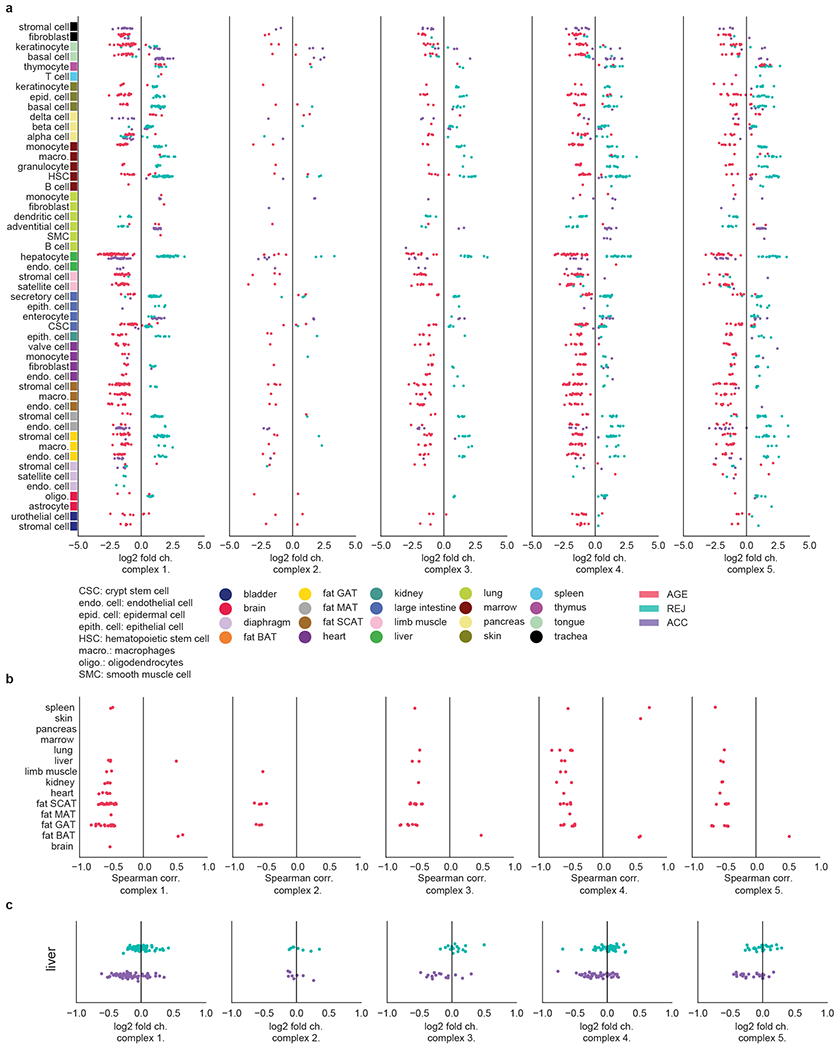
a, Log2-fold changes with AGE, ACC and REJ of genes associated with the 5 OXPHOS complexes. Changes with adj. p-val.<0.05 and eff. size>0.6 are shown. Each column corresponds to one complex and the three separate colors distinguish between AGE, ACC and REJ. b, Spearman correlation of gene expression values with age in case of genes associated with the 5 OXPHOS complexes in the Tabula Muris Senis bulk dataset. Data has been analyzed as in2. Correlation values with adj. p-value <0.05 are shown. c, Log2-fold changes with ACC and REJ of genes associated with the 5 OXPHOS complexes in the bulk parabiosis dataset.
Extended Data Fig. 7. Analysis of transcriptional noise.
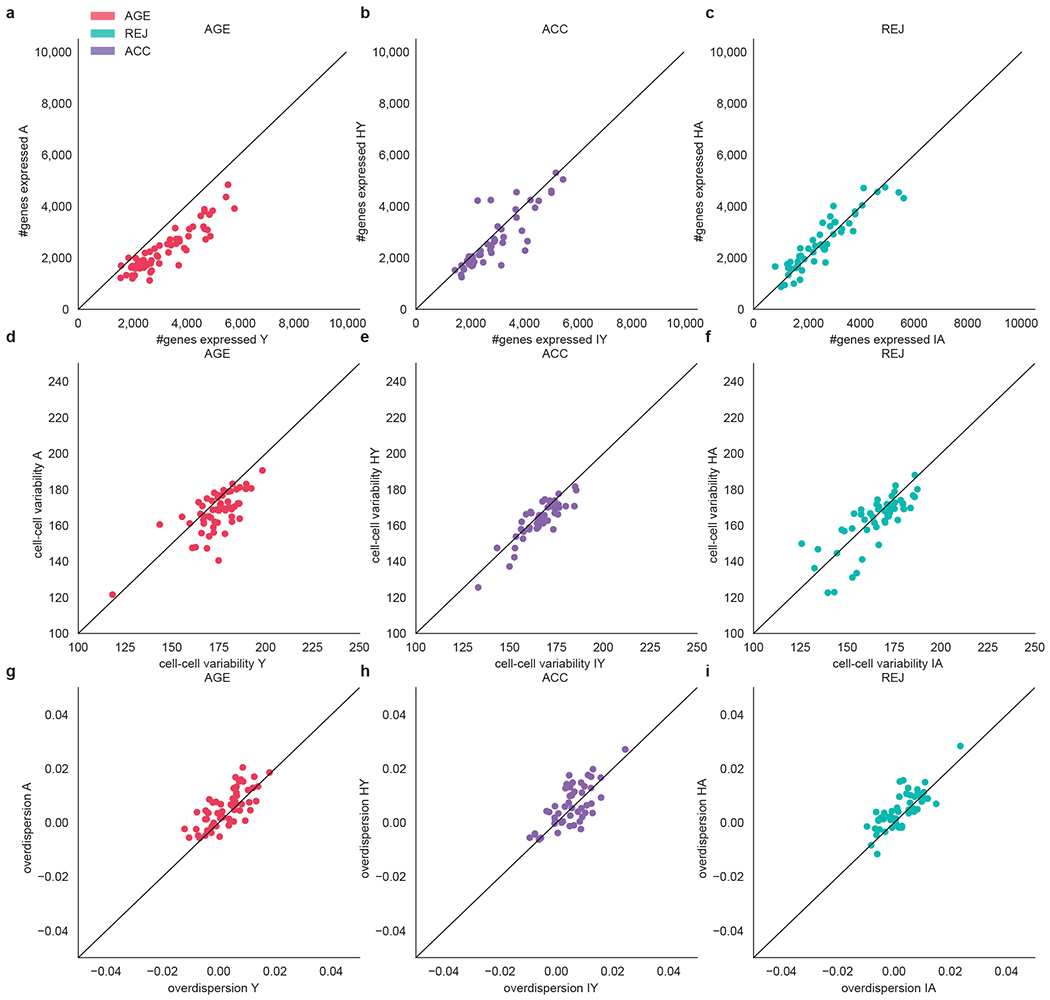
a-c, Mean number of genes expressed within each cell type, x and y axes indicate Y and A (a), IY and HY (b) and IA and HA (c), each dot represents a cell type. d-f, Cell-cell variability within each cell type in Y and A (d), IY and HY (e) and IA and HA (f), each dot represents a cell type. g-i, Overdispersion within each cell type in Y and A (g), IY and HY (h) and IA and HA (i), each dot represents a cell type.
Extended Data Fig. 8. Pathway analysis.
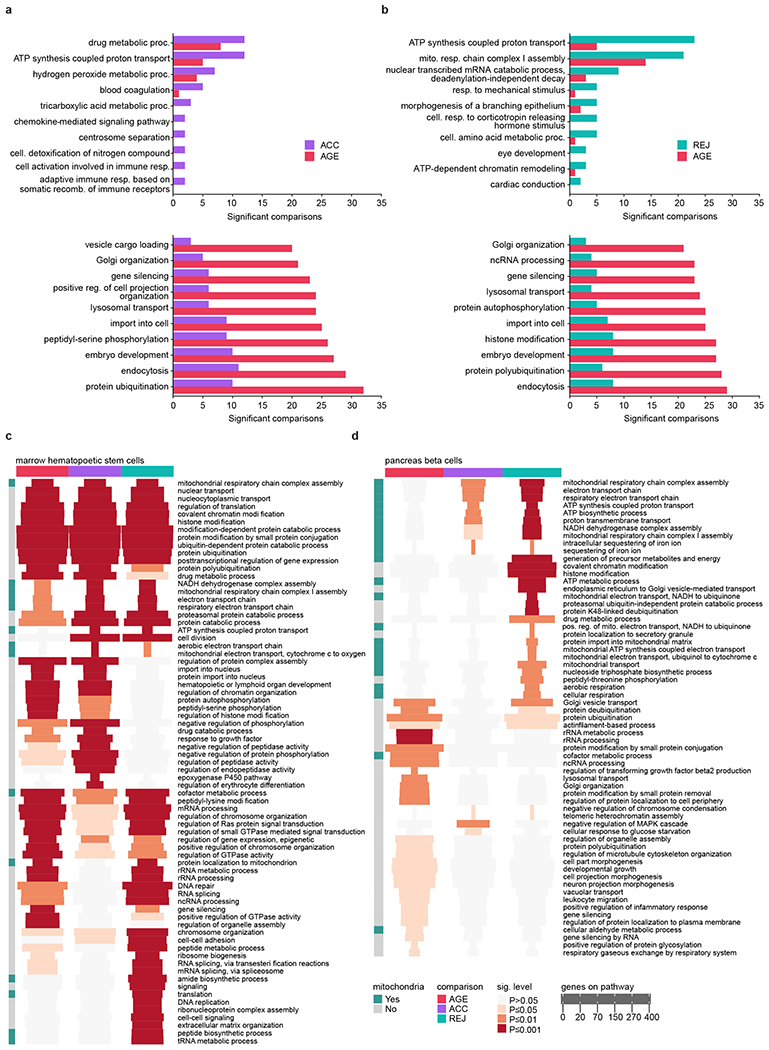
a, Top 10 most differently affected pathways over all ACC tissues and cell types (top, largest difference at the top) and top 10 most differently affected pathways over all AGE (bottom, largest difference at the bottom) tissues and cell types. b, Same as for a, comparing REJ and AGE pathways. c, Heatmap showing the top 30 most strongly affected pathways in AGE, ACC and REJ in hematopoietic stem cells (HSCs) of the marrow. Pathways related to mitochondria are highlighted in green on the left. Each entry of the heatmap shows the significance level and the number of genes associated with the pathway. d, Same as for c, showing the top 30 most strongly affected pathways for beta cells of the pancreas.
Extended Data Fig. 9. Ageing and rejuvenation similarity analysis.
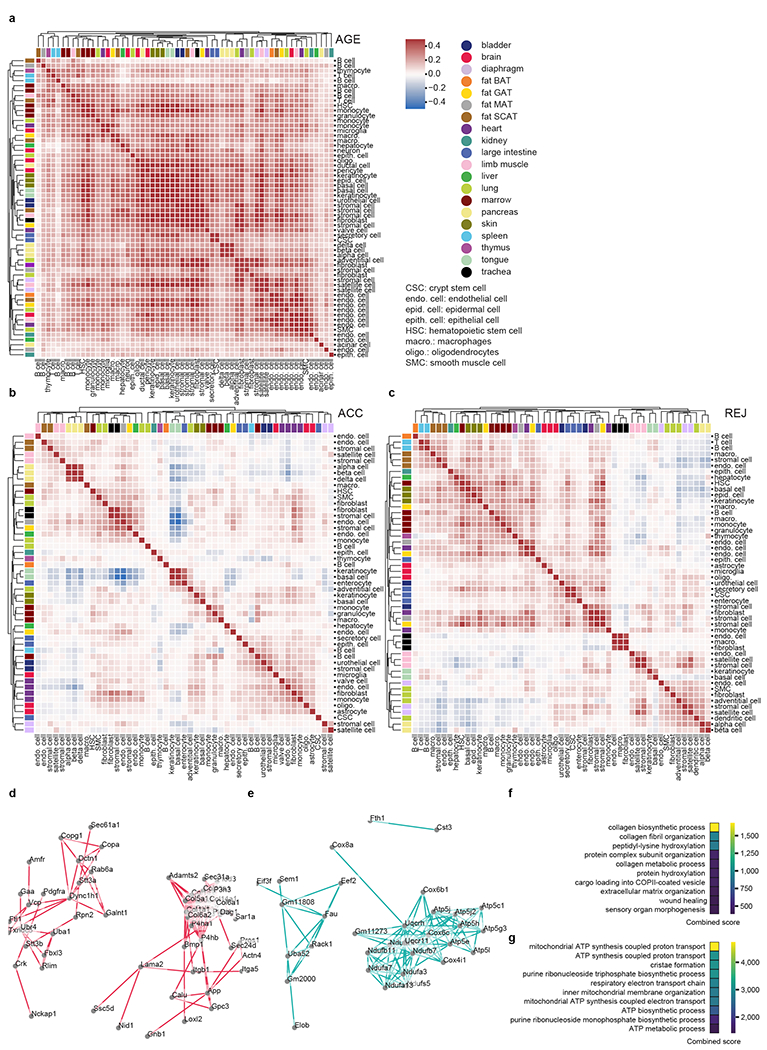
a-c, AGE (a), ACC (b), and REJ (c) DGE based cosine similarity matrices of the cell types studied, see Methods section ‘Ageing and rejuvenation similarity analysis’. All matrices are clustered with complete link hierarchical clustering. d, Force-directed network visualization of the STRING links between DEGs common to MSCs from GAT, MAT, SCAT, bladder, limb muscle, and diaphragm. e, Force-directed network visualization of the STRING links between DEGs common to MSCs (GAT and MAT), hepatocytes, basal and epidermal cells (skin), and HSCs and macrophages (marrow). All links with >0.9 STRING confidence score (scale from 0-1) are queried and shown. f-g Most enriched pathways (GO Biological Process) among the nodes of the networks shown in (d-e), combined scores are defined as in Enrichr51.
Supplementary Material
Acknowledgements
We thank the members of the Wyss-Coray laboratory and the Chan Zuckerberg Biohub for feedback and support. Funding for library preparation, sequencing, and AWS time was provided by the Chan Zuckerberg Biohub. Additional funding includes the Department of Veterans Affairs (BX004599 to T.W.-C.), the National Institute on Aging (R01-AG045034 and DP1-AG053015 to T.W.-C.), the NOMIS Foundation (T.W.-C.), The Glenn Foundation for Medical Research (T.W.-C.), and the Wu Tsai Neurosciences Institute (T.W.-C.). This work was supported by the National Institute of Aging and the National Institutes of Health under award number P30AG059307.
The Tabula Muris Consortium
Nicole Almanzar8, Jane Antony9, Ankit S. Baghel9, Isaac Bakerman9,10,11, Ishita Bansal9, Ben A. Barres12, Philip A. Beachy7,9,13,14,15, Daniela Berdnik1, Biter Bilen1, Douglas Brownfield13, Corey Cain16, Charles K. F. Chan17, Michelle B. Chen5, Michael F. Clarke9, Stephanie D. Conley3, Spyros Darmanis3✉, Aaron Demers3, Kubilay Demir9,14, Antoine de Morree1,18, Tessa Divita3, Haley du Bois4, Hamid Ebadi3, F. Hernán Espinoza13, Matt Fish9,14,15, Qiang Gan1, Benson M. George9, Astrid Gillich13, Rafael Gòmez-Sjöberg3, Foad Green3, Geraldine Genetiano3, Xueying Gu15, Gunsagar S. Gulati9, Oliver Hahn1, Michael Seamus Haney1, Yan Hang15, Lincoln Harris3, Mu He19, Shayan Hosseinzadeh3, Albin Huang1, Kerwyn Casey Huang3,5,20, Tal Iram1, Taichi Isobe9, Feather Ives3, Robert C. Jones3, Kevin S. Kao9, Jim Karkanias3, Guruswamy Karnam21, Andreas Keller1,2, Aaron M. Kershner9, Nathalie Khoury1, Seung K. Kim15,22, Bernhard M. Kiss9,23, William Kong9, Mark A. Krasnow13,14, Maya E. Kumar24,25, Christin S. Kuo8, Jonathan Lam15, Davis P. Lee1, Song E. Lee1, Benoit Lehallier1, Olivia Leventhal4, Guang Li11,26, Qingyun Li12, Ling Liu1, Annie Lo3, Wan-Jin Lu9,13, Maria F. Lugo-Fagundo1, Anoop Manjunath9, Andrew P. May3, Ashley Maynard3, Aaron McGeever3, Marina McKay3, M. Windy McNerney27,28, Bryan Merrill20, Ross J. Metzger29,30, Marco Mignardi5, Dullei Min8, Ahmad N. Nabhan13, Norma F. Neff3, Katharine M. Ng13, Patricia K. Nguyen9,10,11, Joseph Noh9, Roel Nusse13,14,15, Róbert Pálovics1, Rasika Patkar21, Weng Chuan Peng15,31, Lolita Penland3, Angela Oliveira Pisco3, Katherine Pollard32, Robert Puccinelli3, Zhen Qi9, Stephen R. Quake3,5 ✉, Thomas A. Rando1,4,6, Eric J. Rulifson15, Nicholas Schaum1, Joe M. Segal21, Shaheen S. Sikandar9, Rahul Sinha9,33,34,35, Rene V. Sit3, Justin Sonnenburg3,20, Daniel Staehli1, Krzysztof Szade9,36, Michelle Tan3, Weilun Tan3, Cristina Tato3, Krissie Tellez15, Laughing Bear Torrez Dulgeroff9, Kyle J. Travaglini13, Carolina Tropini20,37,38,39, Margaret Tsui21, Lucas Waldburger3, Bruce M. Wang21, Linda J. van Weele9, Kenneth Weinberg8, Irving L. Weissman9,33,34,35, Michael N. Wosczyna1, Sean M. Wu8,10,11,14, Tony Wyss-Coray1,6,7 ✉, Jinyi Xiang9, Soso Xue5, Kevin A. Yamauchi3, Andrew C. Yang1,5, Lakshmi P. Yerra1, Justin Youngyunpipatkul3, Brian Yu3, Fabio Zanini5, Macy E. Zardeneta1,6, Alexander Zee3, Chunyu Zhao3, Fan Zhang29,30, Hui Zhang1, Martin Jinye Zhang40,41, Lu Zhou12 & James Zou3,40,42
8Department of Pediatrics, Pulmonary Medicine, Stanford University School of Medicine, Stanford, CA, USA.
9Institute for Stem Cell Biology and Regenerative Medicine, Stanford University School of Medicine, Stanford, CA, USA.
10Stanford Cardiovascular Institute, Stanford University School of Medicine, Stanford, CA, USA.
11Division of Cardiovascular Medicine, Department of Medicine, Stanford University School of Medicine, Stanford, CA, USA.
12Department of Neurobiology, Stanford University School of Medicine, Stanford, CA, USA.
13Department of Biochemistry, Stanford University School of Medicine, Stanford, CA, USA.
14Maternal & Child Health Research Institute, Stanford University School of Medicine, Stanford, CA, USA.
15Department of Developmental Biology, Stanford University School of Medicine, Stanford, CA, USA.
16F1ow Cytometry Core, Veterans Administration Palo Alto Healthcare System, Palo Alto, CA, USA.
17Department of Surgery, Division of Plastic and Reconstructive Surgery, Stanford University, Stanford, CA, USA.
18Department of Biomedicine, Aarhus University, Aarhus, Denmark.
19Department of Physiology, University of California, San Francisco, CA, USA.
20Department of Microbiology & Immunology, Stanford University School of Medicine, Stanford, CA, USA.
21Department of Medicine and Liver Center, University of California San Francisco, San Francisco, CA,USA.
22Department of Medicine and Stanford Diabetes Research Center, Stanford University, Stanford, CA, USA.
23Department of Urology, Stanford University School of Medicine, Stanford, CA, USA.
24Sean N. Parker Center for Asthma and Allergy Research, Stanford University School of Medicine, Stanford, CA, USA.
25Department of Medicine, Division of Pulmonary and Critical Care, Stanford University School of Medicine, Stanford, CA, USA.
26Department of Developmental Biology, University of Pittsburgh School of Medicine, Pittsburgh, PA, USA.
27Mental Illness Research Education and Clinical Center, Veterans Administration Palo Alto Healthcare System, Palo Alto, CA, USA.
28Department of Psychiatry, Stanford University School of Medicine, Stanford, CA, USA.
29Vera Moulton Wall Center for Pulmonary and Vascular Disease, Stanford University School of Medicine, Stanford, CA, USA.
30Department of Pediatrics, Division of Cardiology, Stanford University School of Medicine, Stanford, CA, USA.
31Princess Máxima Center for Pediatric Oncology, Utrecht, The Netherlands.
32Department of Epidemiology and Biostatistics, University of California, San Francisco, CA, USA.
33Department of Pathology, Stanford University School of Medicine, Stanford, CA, USA.
34Ludwig Center for Cancer Stem Cell Research and Medicine, Stanford University School of Medicine, Stanford, CA, USA.
35Stanford Cancer Institute, Stanford University School of Medicine, Stanford, CA, USA.
36Department of Medical Biotechnology, Faculty of Biochemistry, Biophysics and Biotechnology, Jagiellonian University, Krakow, Poland.
37School of Biomedical Engineering, University of British Columbia, Vancouver, British Columbia, Canada.
38Department of Microbiology and Immunology, University of British Columbia, Vancouver, British Columbia, Canada.
39Humans and the Microbiome Program, Canadian Institute for Advanced Research, Toronto, Ontario, Canada.
40Department of Electrical Engineering, Stanford University, Palo Alto, CA, USA.
41Department of Epidemiology, Harvard T.H. Chan School of Public Health, Boston, MA, USA.
42Department of Biomedical Data Science, Stanford University, Palo Alto, CA, USA.
✉ e-mail: spyros.darmanis@czbiohub.org; steve@quake-lab.org; twc@stanford.edu
Footnotes
Code Availability
Code used for downstream analyses of the raw count matrices is available at GitHub: https://github.com/rpalovics/parabiosis/releases/tag/0.1.0 (DPI: 10.5281/zenodo.5762659)
Competing interests
The authors declare no competing financial interests. Readers are welcome to comment on the online version of the paper.
Supplementary Information is available in the online version of the paper.
Reviewer Information Nature thanks the anonymous reviewers for their contributions to the peer review of this work.
Data Availability
The dataset can be explored interactively at: https://ccb-web.cs.uni-saarland.de/parabiosis/.
Gene counts and metadata are available on Figshare: https://figshare.com/projects/Molecular_hallmarks_of_heterochronic_parabiosis_at_single_cell_resolution/127628.
Raw sequencing data is available in GEO under accession code GSE132042 and via the following public AWS S3 bucket: https://registry.opendata.aws/tabula-muris-senis/.
The versions of the noted databases used are available at the following URLs:
STRING database: https://version-11-0.string-db.org/,
MitoCarta 3.0: https://www.broadinstitute.org/files/shared/metabolism/mitocarta/mouse.mitocarta3.0.html.
GENCODE vM19: https://www.gencodegenes.org/mouse/release_M19.html.
References
- 1.López-Otín C, Blasco MA, Partridge L, Serrano M & Kroemer G The hallmarks of aging. Cell 153, 1194 (2013). [DOI] [PMC free article] [PubMed] [Google Scholar]
- 2.Mahmoudi S, Xu L, & Brunet A Turning back time with emerging rejuvenation strategies. Nature cell biology, 21(1), 32–43 (2019). [DOI] [PMC free article] [PubMed] [Google Scholar]
- 3.Schaum N et al. Single-cell transcriptomics of 20 mouse organs creates a Tabula Muris. Nature 562, 367–372 (2018). [DOI] [PMC free article] [PubMed] [Google Scholar]
- 4.Schaum N et al. Ageing hallmarks exhibit organ-specific temporal signatures. Nature (2020). doi: 10.1038/s41586-020-2499-y [DOI] [PMC free article] [PubMed] [Google Scholar]
- 5.Almanzar N et al. A single-cell transcriptomic atlas characterizes ageing tissues in the mouse. Nature 583, 590–595 (2020). [DOI] [PMC free article] [PubMed] [Google Scholar]
- 6.Castellano JM, Kirby ED & Wyss-Coray T Blood-borne revitalization of the aged brain. JAMA Neurol. 72, 1191–1194 (2015). [DOI] [PMC free article] [PubMed] [Google Scholar]
- 7.Horvath S et al. Reversing age: dual species measurement of epigenetic age with a single clock. bioRxiv 2020.05.07.082917 (2020). doi: 10.1101/2020.05.07.082917 [DOI] [Google Scholar]
- 8.Villeda SA et al. The ageing systemic milieu negatively regulates neurogenesis and cognitive function. Nature 477, 90–96 (2011). [DOI] [PMC free article] [PubMed] [Google Scholar]
- 9.Katsimpardi L et al. Vascular and neurogenic rejuvenation of the aging mouse brain by young systemic factors. Science (80- ). 344, 630–634 (2014). [DOI] [PMC free article] [PubMed] [Google Scholar]
- 10.Smith LK et al. β2-microglobulin is a systemic pro-aging factor that impairs cognitive function and neurogenesis. Nat. Med 21, 932–937 (2015). [DOI] [PMC free article] [PubMed] [Google Scholar]
- 11.Khrimian L et al. Gpr158 mediates osteocalcin’s regulation of cognition. J. Exp. Med 214, 2859–2873 (2017). [DOI] [PMC free article] [PubMed] [Google Scholar]
- 12.Conboy IM et al. Rejuvenation of aged progenitor cells by exposure to a young systemic environment. Nature 433, 760–764 (2005). [DOI] [PubMed] [Google Scholar]
- 13.Ma S et al. Caloric Restriction Reprograms the Single-Cell Transcriptional Landscape of Rattus Norvegicus Aging. Cell 180, 984–1001.e22 (2020). [DOI] [PubMed] [Google Scholar]
- 14.Das MM et al. Young bone marrow transplantation preserves learning and memory in old mice. Commun. Biol 2, 1–10 (2019). [DOI] [PMC free article] [PubMed] [Google Scholar]
- 15.Baht GS et al. Exposure to a youthful circulaton rejuvenates bone repair through modulation of β-catenin. Nat. Commun 6, 1–10 (2015). [DOI] [PMC free article] [PubMed] [Google Scholar]
- 16.Kovina MV, Zuev VA, Kagarlitskiy GO & Khodarovich YM Effect on lifespan of high yield non-myeloablating transplantation of bone marrow from young to old mice. Front. Genet 4, (2013). [DOI] [PMC free article] [PubMed] [Google Scholar]
- 17.Wang C-H et al. Bone Marrow Rejuvenation Accelerates Re-Endothelialization and Attenuates Intimal Hyperplasia After Vascular Injury in Aging Mice. Circ. J 77, 3045–3053 (2013). [DOI] [PubMed] [Google Scholar]
- 18.Smith LK et al. The aged hematopoietic system promotes hippocampal-dependent cognitive decline. Aging Cell 19, (2020). [DOI] [PMC free article] [PubMed] [Google Scholar]
- 19.Lee SS et al. A systematic RNAi screen identifies a critical role for mitochondria in C. elegans longevity. Nat. Genet 33, 40–48 (2003). [DOI] [PubMed] [Google Scholar]
- 20.Zhang MJ, Pisco AO, Darmanis S & Zou J Mouse Aging Cell Atlas Analysis Reveals Global and Cell Type Specific Aging Signatures Revision 1. Elife 10, 1–19 (2021). [DOI] [PMC free article] [PubMed] [Google Scholar]
- 21.Kular JK, Basu S & Sharma RI The extracellular matrix: Structure, composition, age-related differences, tools for analysis and applications for tissue engineering. J. Tissue Eng 5, (2014). [DOI] [PMC free article] [PubMed] [Google Scholar]
- 22.Pinti M et al. Aging of the immune system: Focus on inflammation and vaccination. European Journal of Immunology 46, 2286–2301 (2016). [DOI] [PMC free article] [PubMed] [Google Scholar]
Methods References
- 23.Villeda SA et al. Young blood reverses age-related impairments in cognitive function and synaptic plasticity in mice. Nat. Med 20, 659–663 (2014). [DOI] [PMC free article] [PubMed] [Google Scholar]
- 24.Picelli S et al. Full-length RNA-seq from single cells using Smart-seq2. Nat. Protoc 9, 171–181 (2014). [DOI] [PubMed] [Google Scholar]
- 25.Darmanis S et al. A survey of human brain transcriptome diversity at the single cell level. Proc. Natl. Acad. Sci. U. S. A 112, 7285–7290 (2015). [DOI] [PMC free article] [PubMed] [Google Scholar]
- 26.Picelli S et al. Tn5 transposase and tagmentation procedures for massively scaled sequencing projects. Genome Res. 24, 2033–2040 (2014). [DOI] [PMC free article] [PubMed] [Google Scholar]
- 27.Hennig BP et al. Large-scale low-cost NGS library preparation using a robust Tn5 purification and tagmentation protocol. G3 Genes, Genomes, Genet. 8, 79–89 (2018). [DOI] [PMC free article] [PubMed] [Google Scholar]
- 28.Luecken MD & Theis FJ Current best practices in single-cell RNA-seq analysis: a tutorial. Mol. Syst. Biol 15, (2019). [DOI] [PMC free article] [PubMed] [Google Scholar]
- 29.Wolf FA, Angerer P & Theis FJ SCANPY: large-scale single-cell gene expression data analysis. Genome Biol. 19, (2018). [DOI] [PMC free article] [PubMed] [Google Scholar]
- 30.Polański K, Young MD, Miao Z, Meyer KB, Teichmann SA, & Park JE (2020). BBKNN: fast batch alignment of single cell transcriptomes. Bioinformatics, 36(3), 964–965. [DOI] [PMC free article] [PubMed] [Google Scholar]
- 31.Traag VA, Waltman L, & Van Eck NJ From Louvain to Leiden: guaranteeing well-connected communities. Scientific reports, 9(1), 1–12. (2019). [DOI] [PMC free article] [PubMed] [Google Scholar]
- 32.McInnes L, Healy J & Melville J UMAP: Uniform Manifold Approximation and Projection for Dimension Reduction. (2018). [Google Scholar]
- 33.Korsunsky I, et al. (2019). Fast, sensitive and accurate integration of single-cell data with Harmony. Nature methods, 16(12), 1289–1296. [DOI] [PMC free article] [PubMed] [Google Scholar]
- 34.Pedregosa F et al. Scikit-learn: Machine Learning in Python. J. of Machine Learn. Res 12, 2825–2830 (2011). [Google Scholar]
- 35.Mann HB & Whitney DR On a Test of Whether one of Two Random Variables is Stochastically Larger than the Other. Ann. Math. Stat 18, 50–60 (1947). [Google Scholar]
- 36.Benjamini Y & Hochberg Y Controlling the False Discovery Rate: A Practical and Powerful Approach to Multiple Testing. J. R. Stat. Soc. Ser. B 57, 289–300 (1995). [Google Scholar]
- 37.Enge M, Arda HE, Mignardi M, Beausang J, Bottino R, Kim SK, & Quake SR (2017). Single-cell analysis of human pancreas reveals transcriptional signatures of aging and somatic mutation patterns. Cell, 171(2), 321–330. [DOI] [PMC free article] [PubMed] [Google Scholar]
- 38.Kimmel JC, Penland L, Rubinstein ND, Hendrickson DG, Kelley DR, & Rosenthal AZ (2019). Murine single-cell RNA-seq reveals cell-identity-and tissue-specific trajectories of aging. Genome research, 29(12), 2088–2103. [DOI] [PMC free article] [PubMed] [Google Scholar]
- 39.Gerstner N et al. GeneTrail 3: advanced high-throughput enrichment analysis. Nucleic Acids Res. 48, W515–W520 (2020). [DOI] [PMC free article] [PubMed] [Google Scholar]
- 40.Carbon S et al. The Gene Ontology Resource: 20 years and still GOing strong. Nucleic Acids Res. 47, D330–D338 (2019). [DOI] [PMC free article] [PubMed] [Google Scholar]
- 41.Rath S et al. MitoCarta3.0: An updated mitochondrial proteome now with sub-organelle localization and pathway annotations. Nucleic Acids Res. 49, D1541–D1547 (2021). [DOI] [PMC free article] [PubMed] [Google Scholar]
- 42.Gu Z, Eils R & Schlesner M Complex heatmaps reveal patterns and correlations in multidimensional genomic data. Bioinformatics 32, 2847–2849 (2016) [DOI] [PubMed] [Google Scholar]
- 43.Wickham H ggplot2. Wiley Interdiscip. Rev. Comput. Stat 3, 180–185 (2011). [Google Scholar]
- 44.Hagberg A, Swart P & Chult S, D. Exploring network structure, dynamics, and function using networkx. (2008). Available at: https://www.osti.gov/servlets/purl/960616. [Google Scholar]
- 45.Szklarczyk D, Gable AL, Lyon D, Junge A, Wyder S, Huerta-Cepas J, … & Mering CV (2019). STRING v11: protein–protein association networks with increased coverage, supporting functional discovery in genome-wide experimental datasets. Nucleic acids research, 47(D1), D607–D613. [DOI] [PMC free article] [PubMed] [Google Scholar]
- 46.Ewels PA et al. The nf-core framework for community-curated bioinformatics pipelines. Nat. Biotechnol 38, 276–278 (2020). [DOI] [PubMed] [Google Scholar]
- 47.Dobin A et al. STAR: ultrafast universal RNA-seq aligner. Bioinformatics 29, 15–21 (2013). [DOI] [PMC free article] [PubMed] [Google Scholar]
- 48.Li B & Dewey CN RSEM: accurate transcript quantification from RNA-Seq data with or without a reference genome. BMC Bioinformatics 12, 323 (2011). [DOI] [PMC free article] [PubMed] [Google Scholar]
- 49.Soneson C, Love MI & Robinson MD Differential analyses for RNA-seq: transcript-level estimates improve gene-level inferences [version 1; peer review: 2 approved]. F1000Research 4, (2015). [DOI] [PMC free article] [PubMed] [Google Scholar]
- 50.Love MI, Huber W & Anders S Moderated estimation of fold change and dispersion for RNA-seq data with DESeq2. Genome Biol. 15, 550 (2014). [DOI] [PMC free article] [PubMed] [Google Scholar]
- 51.Chen EY, Tan CM, Kou Y, Duan Q, Wang Z, Meirelles GV, … & Ma’ayan A (2013). Enrichr: interactive and collaborative HTML5 gene list enrichment analysis tool. BMC bioinformatics, 14(1), 1–14. [DOI] [PMC free article] [PubMed] [Google Scholar]
Associated Data
This section collects any data citations, data availability statements, or supplementary materials included in this article.
Supplementary Materials
Data Availability Statement
The dataset can be explored interactively at: https://ccb-web.cs.uni-saarland.de/parabiosis/.
Gene counts and metadata are available on Figshare: https://figshare.com/projects/Molecular_hallmarks_of_heterochronic_parabiosis_at_single_cell_resolution/127628.
Raw sequencing data is available in GEO under accession code GSE132042 and via the following public AWS S3 bucket: https://registry.opendata.aws/tabula-muris-senis/.
The versions of the noted databases used are available at the following URLs:
STRING database: https://version-11-0.string-db.org/,
MitoCarta 3.0: https://www.broadinstitute.org/files/shared/metabolism/mitocarta/mouse.mitocarta3.0.html.
GENCODE vM19: https://www.gencodegenes.org/mouse/release_M19.html.