

Abstract
There has been a rapid development in genome sequencing, including high-throughput next generation sequencing (NGS) technologies, automation in biological experiments, new bioinformatics tools and utilization of high-performance computing and cloud computing. ChIP-based NGS technologies, e.g. ChIP-seq and ChIP-exo, are widely used to detect the binding sites of DNA-interacting proteins in the genome and help us to have a deeper mechanistic understanding of genomic regulation. As sequencing data is generated at an unprecedented pace from the ChIP-based NGS pipelines, there is an urgent need for a metadata management system. To meet this need, we developed the Platform for Eukaryotic Genomic Regulation (PEGR), a web service platform that logs metadata for samples and sequencing experiments, manages the data processing workflows, and provides reporting and visualization. PEGR links together people, samples, protocols, DNA sequencers and bioinformatics computation. With the help of PEGR, scientists can have a more integrated understanding of the sequencing data and better understand the scientific mechanisms of genomic regulation. In this paper, we present the architecture and the major functionalities of PEGR. We also share our experience in developing this application and discuss the future directions.
Keywords: next generation sequencing pipeline, science gateway, web application
1. INTRODUCTION
There has been a rapid development in genome sequencing in the past decades. Next generation sequencing (NGS) technologies perform massively parallel sequencing and facilitate high throughput, low cost sequencing [4, 6, 9]. Automation, e.g. robotic sample processing, has improved the efficiencies in biological experiments. In addition, new bioinformatics tools and the utilization of high-performance computing (HPC) and cloud computing has taken bioinformatics to the next level [17]. Big datasets are generated at an unprecedented pace and there is a rapid data explosion in bioinformatics [8], which presents a challenge for data management. Without efficient tools to parse and organize this data, it will be increasingly difficult to transform big data into scientific insights.
Chromatin immunoprecipitation (ChIP) is a long-standing method for detecting the binding sites of DNA-interacting proteins in the genome [3, 16]. It covalently traps proteins at their physiological locations in vivo and informs us as to which proteins bind near specific genes. By combining ChIP with deep sequencing, ChIP-based NGS technologies, e.g. ChIP-seq [2, 5] and ChIP-exo [10–12], have dramatically improved genome coverage and resolution. They are widely used to characterize the precise positional and structural organization of many proteins within regulatory complexes, including those in normal and diseased cell types and in normal and relevant unhealthy environments. With the help of ChIP-based NGS technologies, we are able to have a deeper mechanistic understanding of genomic regulation.
A ChIP-based NGS pipeline starts with a wet-bench experiment which comprises many steps, e.g. cross-linking protein to DNA, shearing DNA strands by sonication, immunoprecipitation, purifying DNA and sequencing. Once the raw data is generated from the sequencer, it will go through a series of analysis steps. These steps include, but are not limited to: 1) mapping sequenced reads to the genome; 2) finding “peaks”, or regions of high signal that represent protein-DNA binding events; and 3) discovering DNA sequence motif patterns that are enriched at peak locations. Note that as a fast-developing technology, ChIP-based NGS pipelines have many distinct and important variations in both the wet-bench protocols and the analysis methods, despite the commonly shared steps.
Therefore, it is critically important to track all aspects of the sequencing pipeline, from wet-bench records, such as sample type, growth environment, antibody and protocols, to analysis tools and parameters. However, there are no available platforms that manage the entire sequencing pipeline, from wet-bench experiment to computational analysis. Most of the existing laboratory information management systems (LIMS) focus on inventory management and sample tracking, and have limited capability on data analysis and interfacing with external clients [14]. On the other hand, although there are many workflow systems that provide a means to manage multi-step analysis [1], they do not integrate tightly with wet-bench experiments and it’s difficult to compare samples directly in the workflow systems. As NGS technologies evolve towards higher throughput and lower cost, sequencing data is generated at an unprecedented pace. And it’s becoming cumbersome to digest the big data sets without an efficient management platform.
Therefore, we developed the Platform for Eukaryotic Genomic Regulation (PEGR), a web service platform that manages ChIP-based NGS pipelines. PEGR logs sample metadata and sequencing experiment details, manages the data processing workflows, and provides reporting and visualization (see Fig. 1). PEGR links together people, samples, protocols, sequencers and bioinformatics computation. With the help of PEGR, scientists can have a more integrated understanding of the sequencing data and better understand the scientific mechanism in genomic regulation. In this paper, we present the architecture and the major functionalities of PEGR. We also share our experience in developing this web application and future directions.
Figure 1:
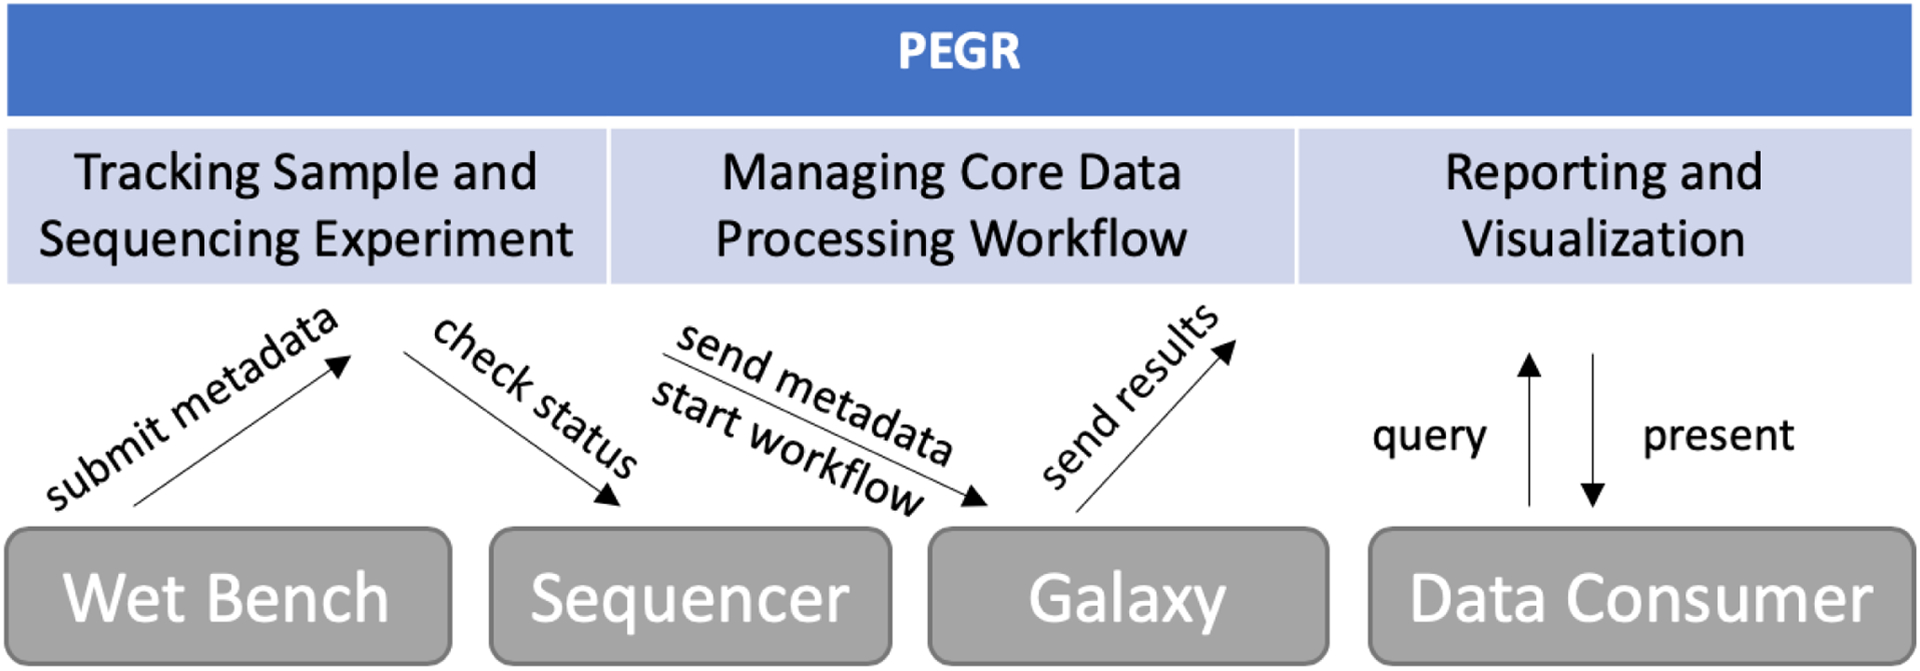
PEGR is a metadata management platform for ChIP-based NGS pipelines. It tracks the sample information and sequencing experiment, manages the data processing workflow, and provides reporting and visualization.
2. ARCHITECTURE
PEGR is built on Grails, a high productivity web application framework for JVM. Grails follows the “coding by convention” paradigm, and provides mechanisms such as injection, templating and scaffolding, which makes the development much more efficient. The architecture of PEGR follows the Model-View-Controller (MVC) pattern [15]. The model layer contains 75 domain classes that are mapped to the database. Here we chose MariaDB to host PEGR’s database. The database is a relational database that contains normalized tables for various information, including sample details (e.g. strain, antibody, target and growth media), sequencing protocol, bioinformatics analysis, users and projects. Data in the database are queried and persisted through Grails’ object relational mapping (GORM). During development, the database schema often needs to be updated to meet stakeholder’s requirements, e.g. adding or removing a table or a column. In this situation, we follow the code-first approach, that is, we first change the involved domain classes, run Grails database migration plugin, and the database will be automatically updated. This will guarantee synchronization between the codes and the database schema.
The controllers generate responses to clients’ requests. For HTML requests, the controllers will delegate them to the views where data will be presented. Inside views, PEGR heavily utilizes JavaScript, Bootstrap library and AJAX to improve user experience. It adopts the responsive web design and provides consistent data presentation across desktops, tablets and mobile devices. In addition, REST-compliant (RESTful) APIs are made available that allow external applications to query data from and send data to PEGR. In response to an API request, the controllers will render the data in JSON format. Note that the business logic in the controller can become complicated. For example, it may involve nontrivial data manipulation and decision making. In such cases, it will push the business logic to a separate layer, called “service”, leaving the controllers relatively light weighted. The separation of models, controllers, views and services confines different logic concerns to their own layer and makes it possible to reuse shared components. This enables the application to be easily developed, tested, and maintained.
2.1. Tracking wet-bench experiments
In tracking the wet-bench experiment, PEGR logs information on samples, protocols, equipments, and other materials used in the experiment. There are two ways for users to submit the information to PEGR. The first way is to utilize a sample submission form, which is a csv or excel file where each column relates to one piece of information and each row represents one sample. Once the user has filled in and submitted the form, PEGR will transform the flat data in the spreadsheet to the normalized tables in the database.
The sample submission form is easy to adopt and works well under small scales. However, with the increasingly higher throughput of modern sequencing technologies, e.g. hundreds of samples can be processed at a single sequencing run, the sample submission form becomes cumbersome and error prone. PEGR provides a more robust way to track the wet-bench experiment by leveraging the ZXing barcode scanner [7] available on Android devices. The barcode scanner can be activated directly from a webpage in PEGR and have the result returned to the webpage via a callback URL. Thus, materials received by the lab that already have an attached barcode can be scanned from the Android devices and the appropriate meta-information be recorded at the same time. Purchased reagents and client samples with no existing barcode can be assigned a new barcode generated by PEGR (see Fig. 2). At each step, the technician reviews the protocol and then scans the barcoded samples and related items. Each event is specified in a protocol written in a standardized format. Inventoried Protocol ID, Reagent ID, Equipment ID, Tech ID, date, etc. are tracked by barcode. Thus, the exact “instance” of each scanned item is linked to each sample as metadata. Note that PEGR allows multiple samples to be attached to a single protocol. So when technicians process multiple samples in a batch, they only need to enter the related information once. This allows for better efficiency and helps avoid human errors. The barcode tracking functionality is currently in beta testing.
Figure 2:
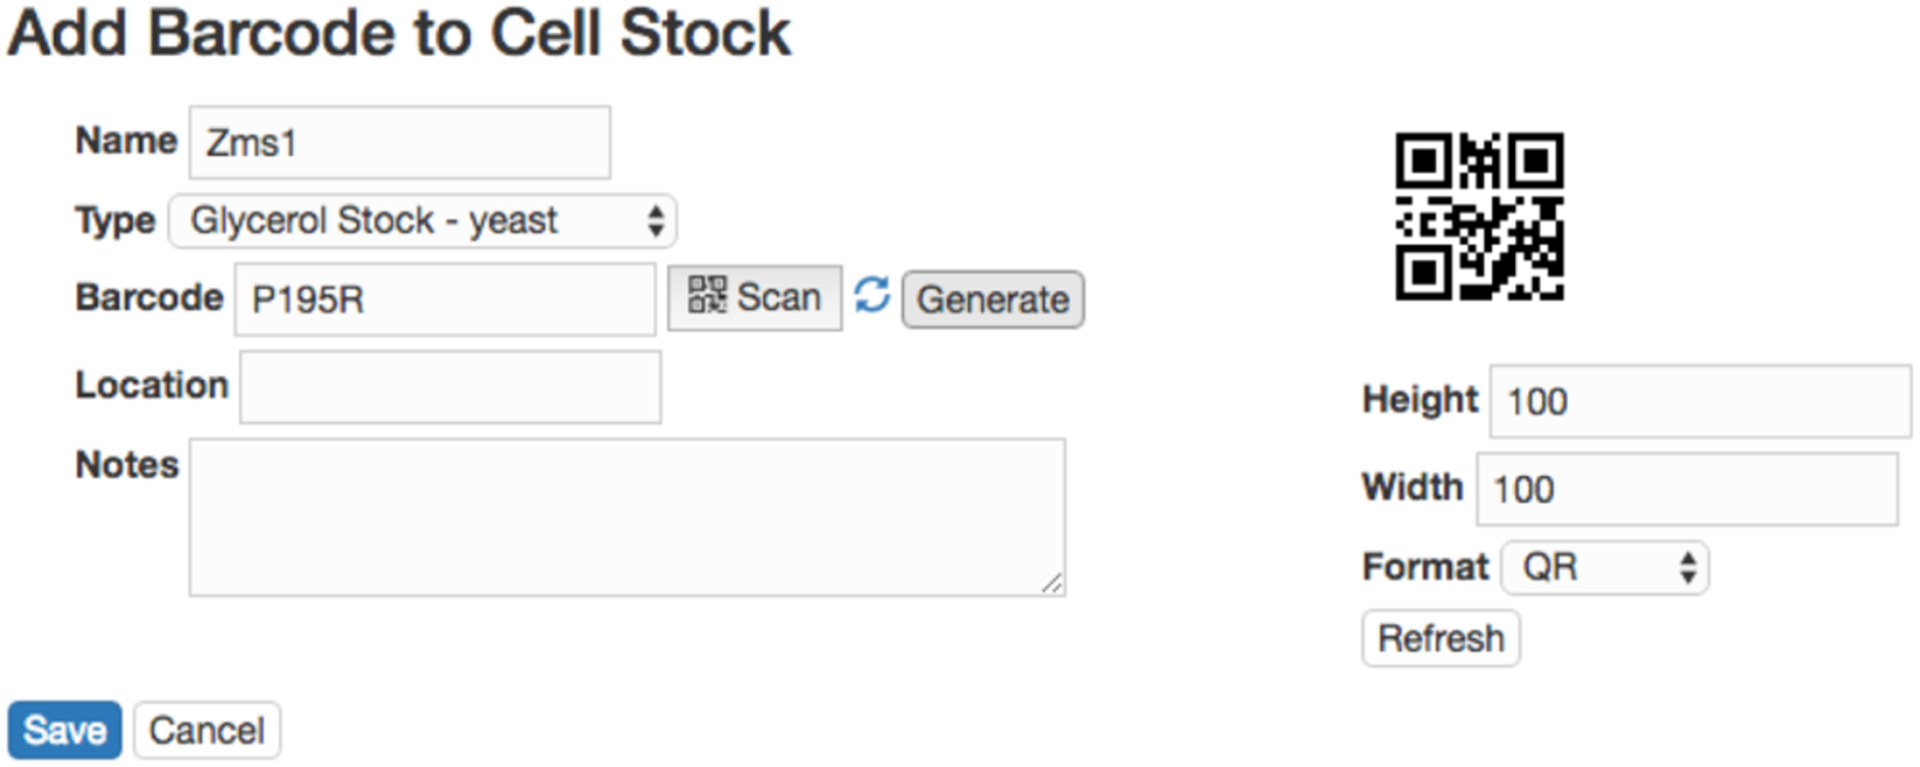
Tracking a wet-bench experiment via barcode. If the item already has an attached barcode, the barcode can be scanned in directly with a specified item type; otherwise, PEGR can generate a new barcode for the item.
Fig. 3 is the PEGR webpage that shows sample details, including cell source, antibody, target, protocol and other information. The blue barcode symbol in the header line links to the barcode and location information of the sample. To edit sample information, users with the proper authorization can follow the edit button in each section. In addition, PEGR has a widget to edit a batch of samples in a sequencing run. Autocompletion and field validation are provided on both the single sample edit page and the batch edit page.
Figure 3:
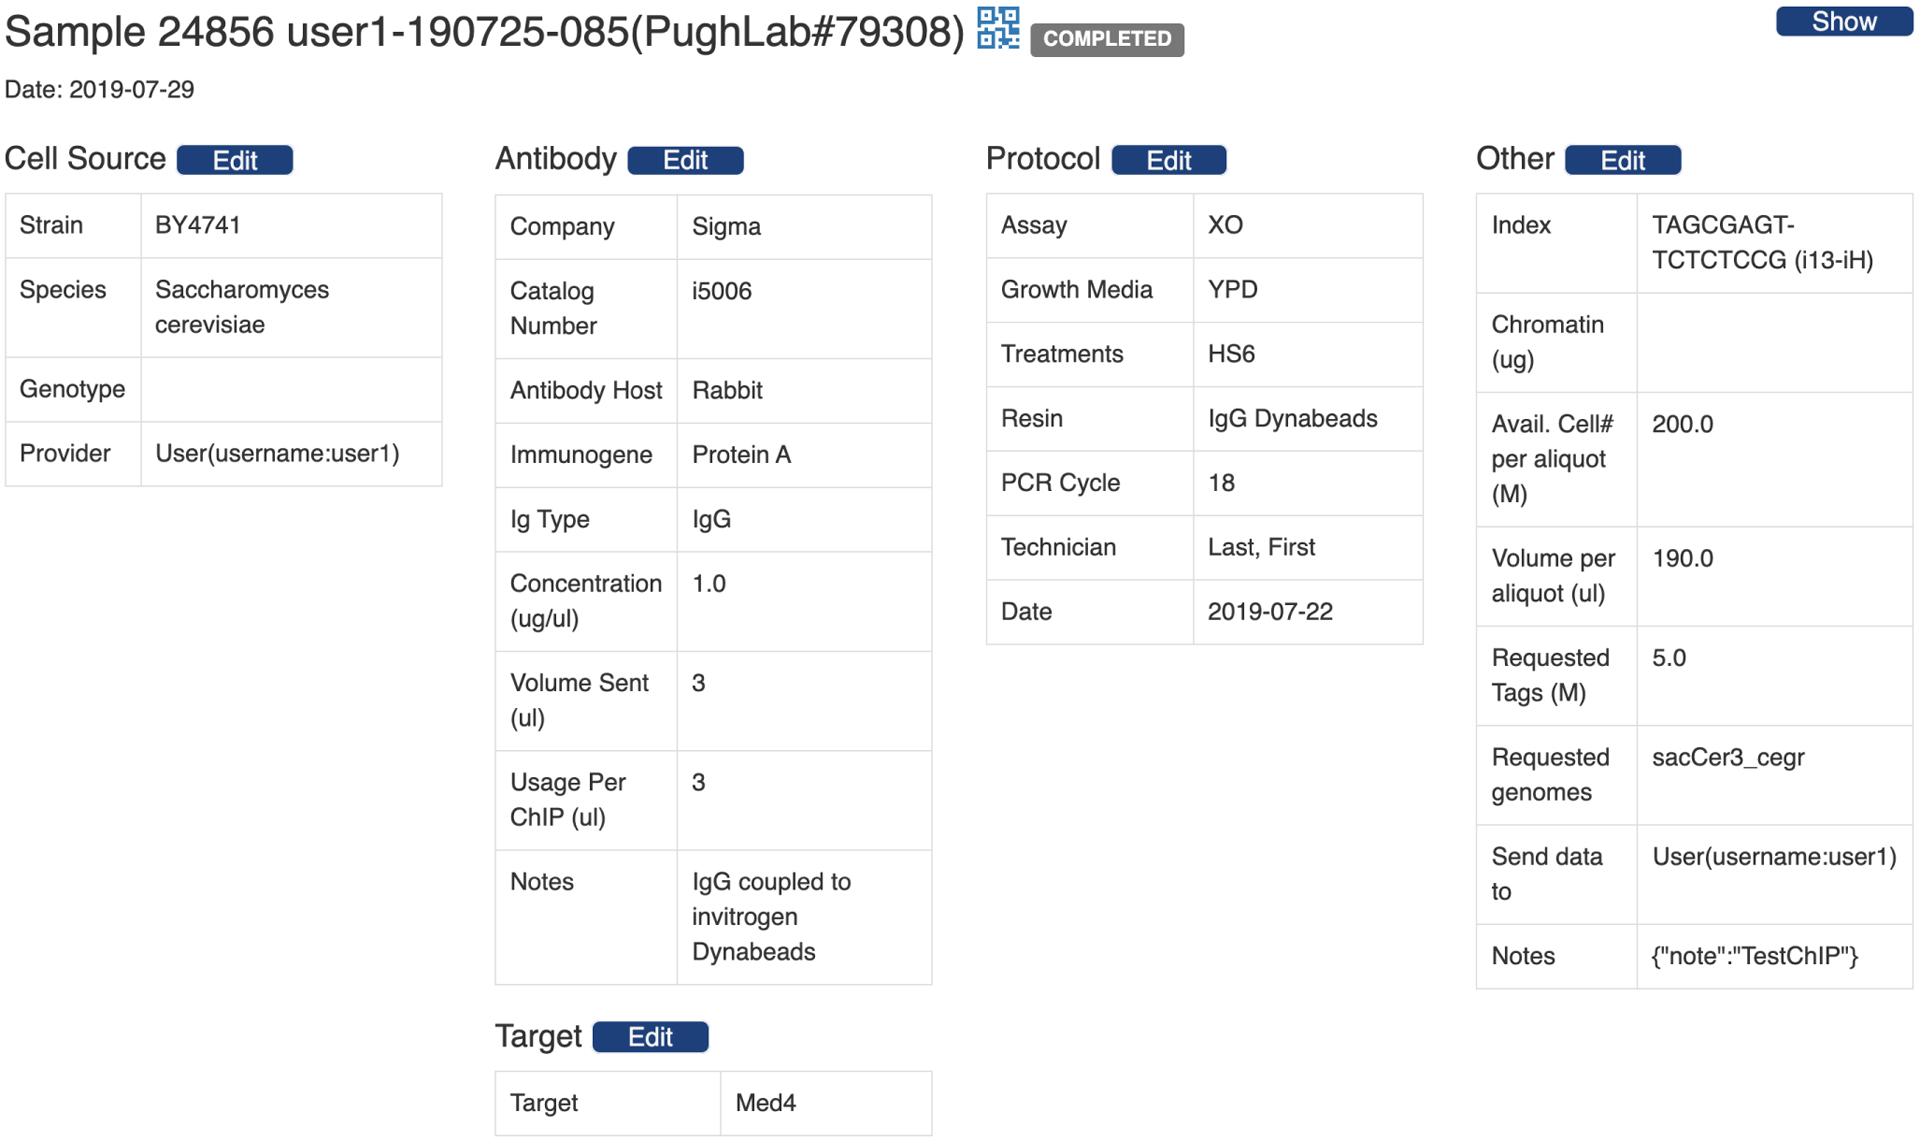
PEGR webpage that shows sample details, including cell source, antibody, target, protocol and other information.
Users can also upload images to track the quality of the samples and sequencing pools. For example, the uploaded gel electrophoretic images of ChIP input and completed libraries can help the biologists to ensure that chromatin fragmentation and library construction was properly achieved.
2.2. Data processing
Once all the information has been recorded in PEGR, a sequencing run will be started. As the sequencing run proceeds, the sequencer will generate and deposit data to a designated repository. A cron job is set up in PEGR to probe the sequencer repository every 15 minutes and check whether the data for the new sequencing run has become available and whether the sequencing run has completed. Once it detects the completion of the sequencing run, it will match the sequencing output data with the information stored in PEGR, and initiate the data processing pipeline. Specifically, PEGR is able to create a set of files that contain the sequencing run information, e.g. the sequencing run ID, the path to the raw sequencing data repository, sample ID, the library index attached to a sample (a way to biologically identify each sample in a sequencing run), and the reference genomes to align the samples to. Note that more than one reference genomes can be provided so that each sample can have multiple alignment results.
The files are then picked up by Galaxy, a workflow management tool [1] that wraps the core data processing pipeline. The core data processing workflow comprises a series of analysis steps, including raw data transformation, sequence alignment against reference genomes, peak-calling, and motif discovery. Since PEGR is charged with hosting all the metadata and final reporting, the output data needs to be communicated back to PEGR from Galaxy. Thus, we developed a RESTful API in PEGR to accept POST requests that contain the output data generated from the data processing workflow. Each API call corresponds to a single analysis step in the workflow. When an analysis step finishes, its output data will be posted to PEGR immediately. The benefits of sending results immediately instead of gathering all the results at the end of the workflow in a batch include that (1) we can track the status of the workflow run at real-time and (2) in the event that an analysis step failed, we could resume the workflow from the break point.
The data sent through the API needs to be constructed in a JSON format and the fields accepted are listed in Table 1. The field “userEmail” identifies the author of the analysis, and is also used to authenticate the user in combination with the API key. The fields “runId” and “sampleId” are used to match the analysis to the sequencing run and the sample already stored in PEGR, and “genome” is the reference genome that the sample is aligned to in this analysis. The analysis step is labeled by “stepId” and “workflow” that it belongs to. In addition, since there could be multiple workflow runs on the same sample and each analysis step sends its results separately, we need the field “historyId” to connect all the analysis steps in a single workflow run. The software and its version used in the step is recorded in the field “tool”. In bioinformatics, many of the tools achieve the same functionality. Therefore, we also record “toolCategory” to facilitate reporting and future comparison. The “parameter” field is formatted as a dictionary with the parameter name being the key. The storage of all the parameters, along with the software and version used, helps with reproducibility and potential extension in the future. The output of the steps ranges from simple statistics (e.g. a number) to large datasets. The former is sent in the “statistics” field. As for the large datasets, the path to the dataset file and the file type are sent in the “datasets” field. Both “statistics” and “datasets” are formatted as a list of dictionaries.
Table 1:
Fields in the PEGR API that accepts analysis results
| Field | Format |
|---|---|
| userEmail | String |
| runId | Long |
| sampleId | Long |
| genome | String |
| workflow | String |
| stepId | String |
| toolCategory | String |
| tool | String |
| parameters | {“parameterName”: “parameterValue”} |
| statistics | [{“statisticsName”: “statisticsValue”}] |
| datasets | [{“type”: “String”, “id”: “String”, “uri”: “String”}] |
| historyId | String |
| historyUrl | String |
| alignmentId | Long |
| note | String |
Note that this API can accept POST requests not only from Galaxy, but also from other external clients that have a valid API key. In fact, there could be various downstream analysis following the core data processing workflow. And results from those downstream analysis can be posted to PEGR through the same API and linked to its upstream alignment using the field “alignmentId”. The client may also send a “note” to PEGR, such as warning or error messages.
PEGR implements a realtime workflow tracking and quality control dashboard (see Fig. 4A). Fig. 4B zooms in on the workflow tracking panel. As the output data from each analysis step returns to PEGR individually, the status of the workflow is updated in realtime. The status of each analysis step is represented by a square. If the output returns successfully and passes the preliminary validation, the square will be colored in green. The output that has one or more error messages are colored in red and clicking on the square will render the detailed error messages. API calls with permission denied are colored in orange, and analysis steps with missing datasets are labeled in blue. The analysis steps that have not returned output will remain in grey. If all squares become green, it indicates that the entire workflow has completed successfully. Note that data processing workflows may vary for different sample types and they may include different sets of analysis steps. To accommodate different workflows, PEGR defines a configuration for each workflow that lists all the analysis steps to be tracked. And the workflow tracking panel will be rendered according to this configuration.
Figure 4:
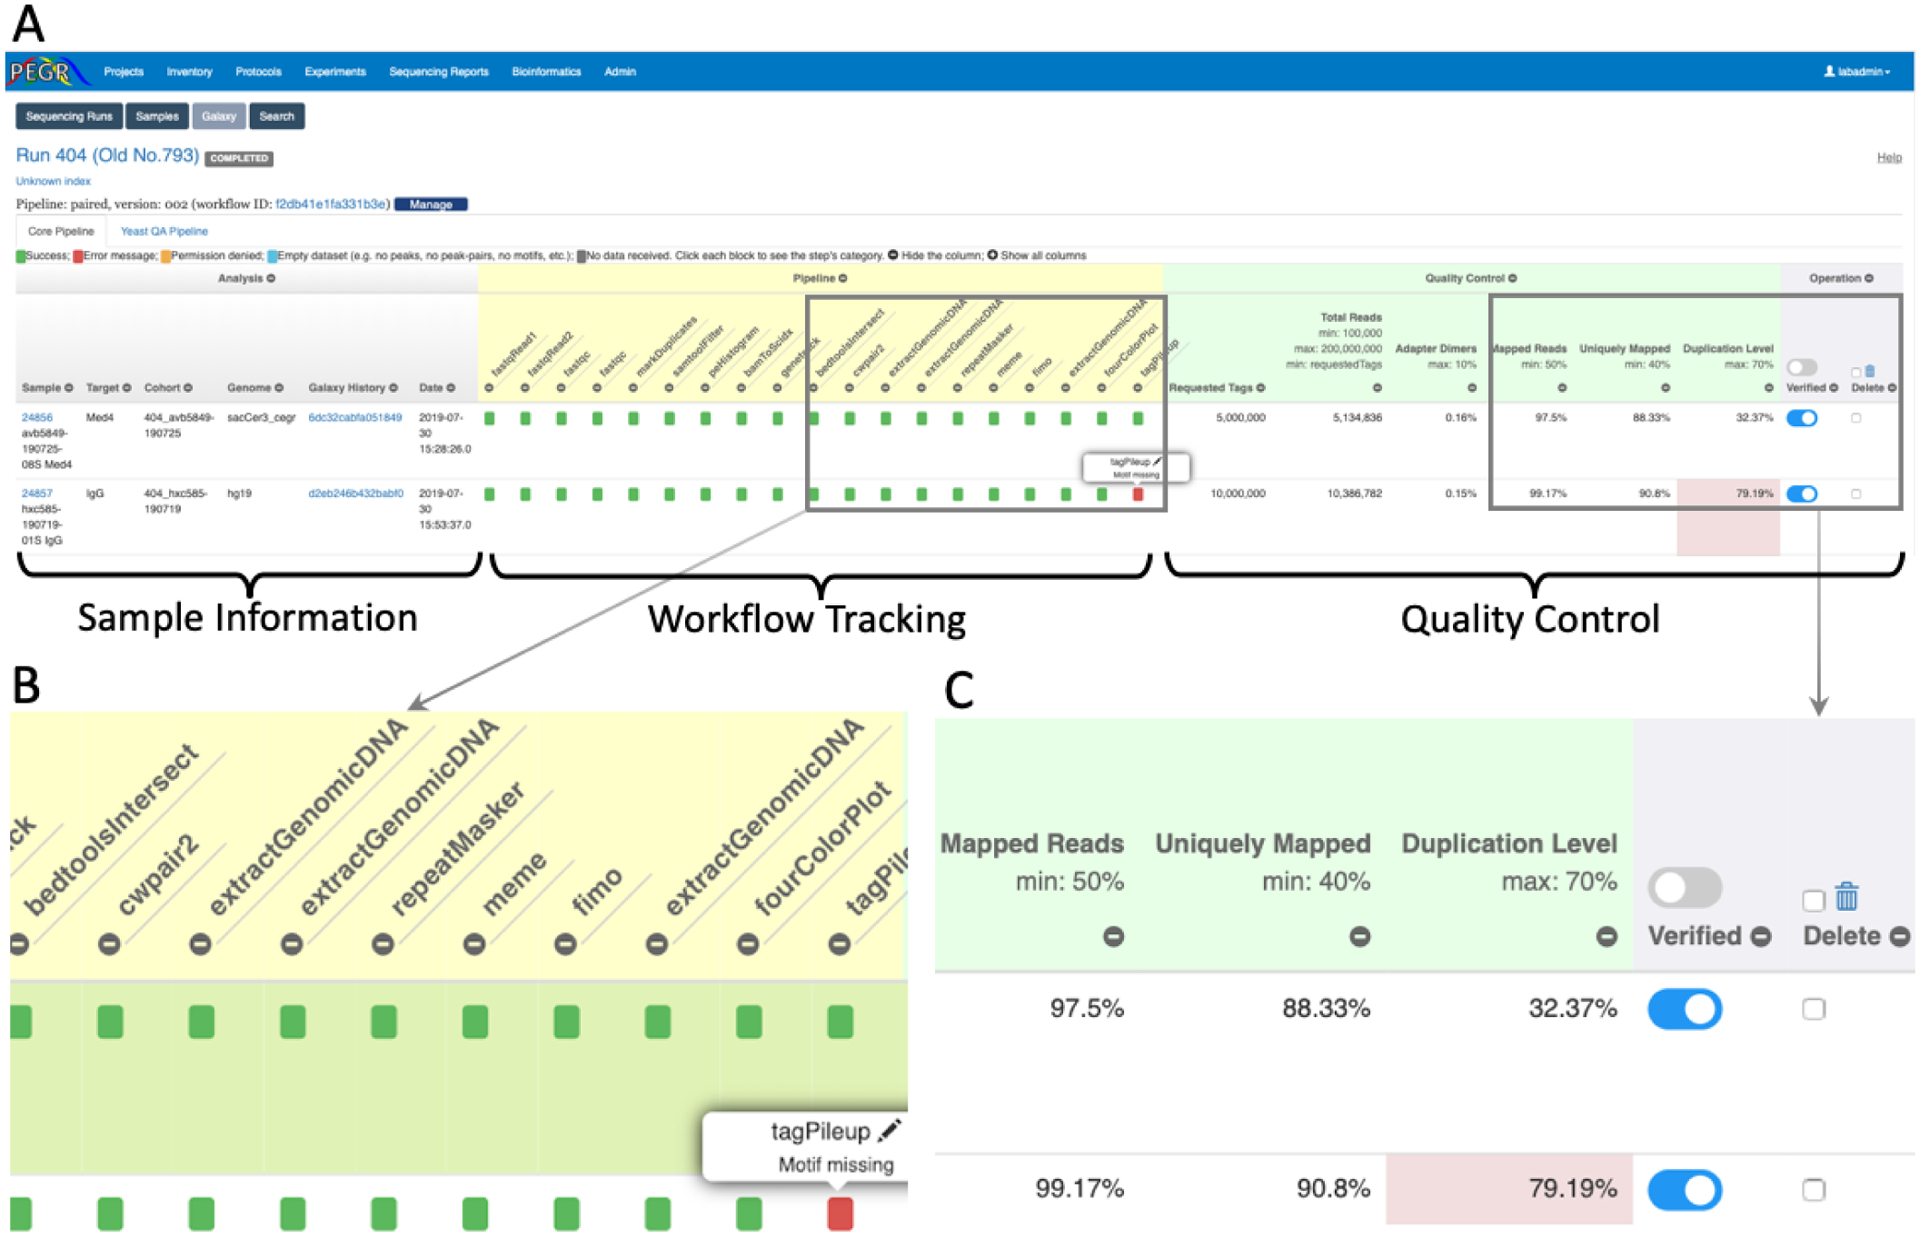
Realtime workflow tracking and quality control dashboard in PEGR. (A) dashboard overview; (B) zoomed-in version of the workflow tracking panel; (C) zoomed-in version of the quality control panel.
Fig. 4C zooms in the quality control panel. It lists the number of requested tags and the major statistics of the sequencing results, including total reads, adapter dimers, mapped reads, uniquely mapped reads and duplication level. The acceptable range of each field is indicated at the header and fields that have values outside the acceptable ranges are colored in red. The combination of the statistics gives users an overview of the quality of the sequencing experiment. After reviewing the statistics, authorized users can indicate if the sample has passed the quality control check and been “verified”. If the statistics indicates that the sequencing result is incorrect, the user can “delete” the sample directly on this page.
The workflow tracking and quality control dashboard can become quite wide as there are so many columns. To enhance user experience, a JavaScript was developed to let the users hide unwanted columns by clicking the “−” sign on the header. The users are then able to scan through and compare the data easily thanks to the compact view. The columns can be restored by clicking the “+” sign at the top.
2.3. Reporting and visualization
PEGR also hosts a reporting and visualization dashboard. Samples in a sequencing run are grouped into cohorts based on the projects the samples belong to, and an analysis report is automatically created for each cohort (see Fig. 5). The analysis report contains five major sections (see Fig. 6 and Fig. 7). The first section provides the cohort overview, including project description, people related to the project, and sonication and gel images. The second section lists the sample metadata, including the strain, target, antibody, mutation, growth media and treatments. The FastQC reports describing the quality of the DNA sequencing results are also attached to each sample. Clicking on each sample’s ID will take the user to the sample page where the user can find more detailed information about the sample along with the fastq files and BAM files. The third section reports the mapping statistics from sequence alignment, including the counts and percentages of total reads, mapped reads, uniquely mapped reads, and de-duplicated reads. The number of adapter dimers, average insertion size (PE) and genome coverage are also reported. The following section reports peak-finding statistics for the selected genome partitions, including the number of peaks and peak-pairs. The final section describes motif-finding results, including graphical MEME motifs (and links to TOMTOM) and strand-separated tag pile ups around the MEME motif are visualized interactively using JavaScript. The reporting platform also provides a print friendly version and a downloadable excel version.
Figure 5:
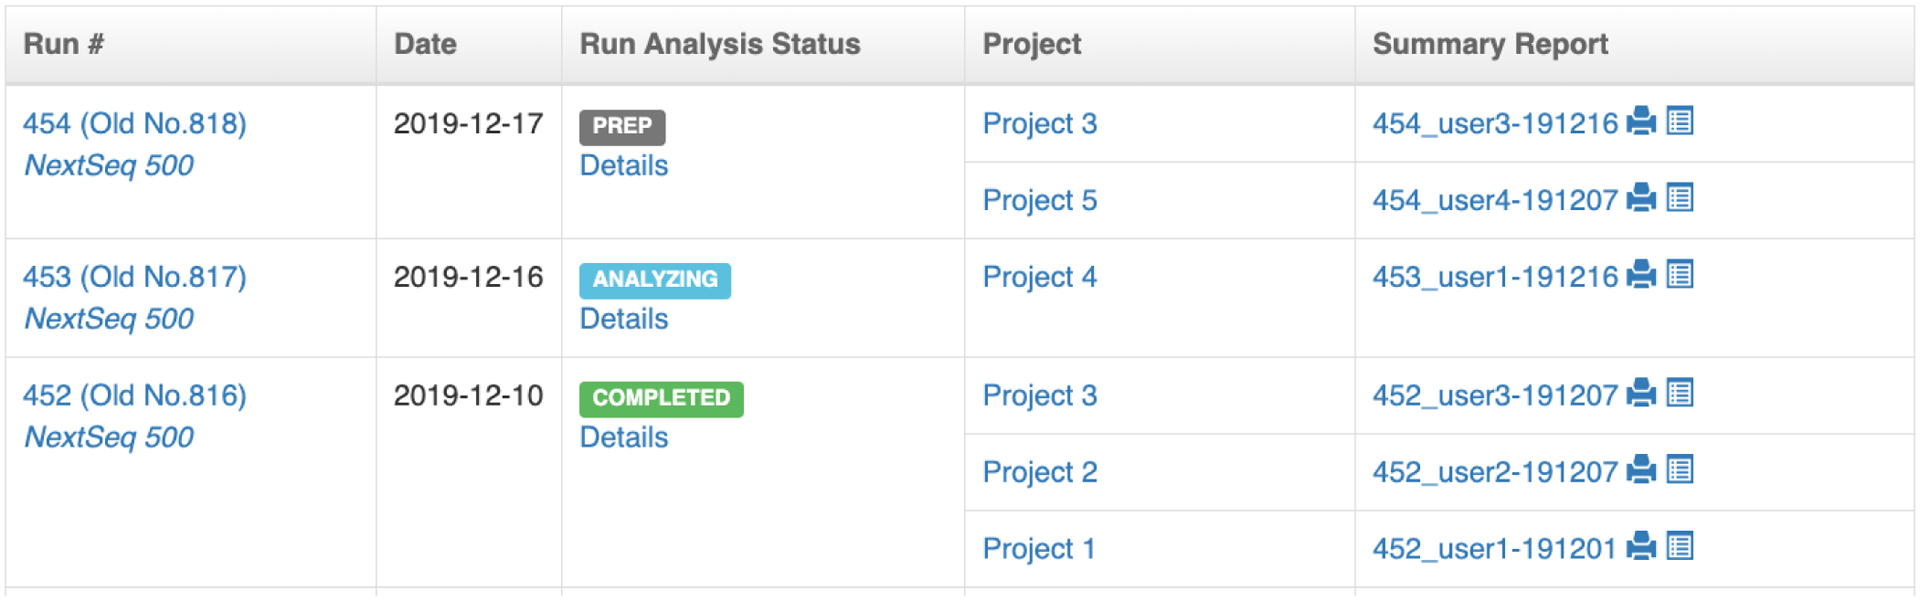
PEGR webpage showing the list of sequencing runs. Samples in a sequencing run are grouped into cohorts based on the projects the samples belong to, and an analysis report is automatically created for each cohort.
Figure 6:
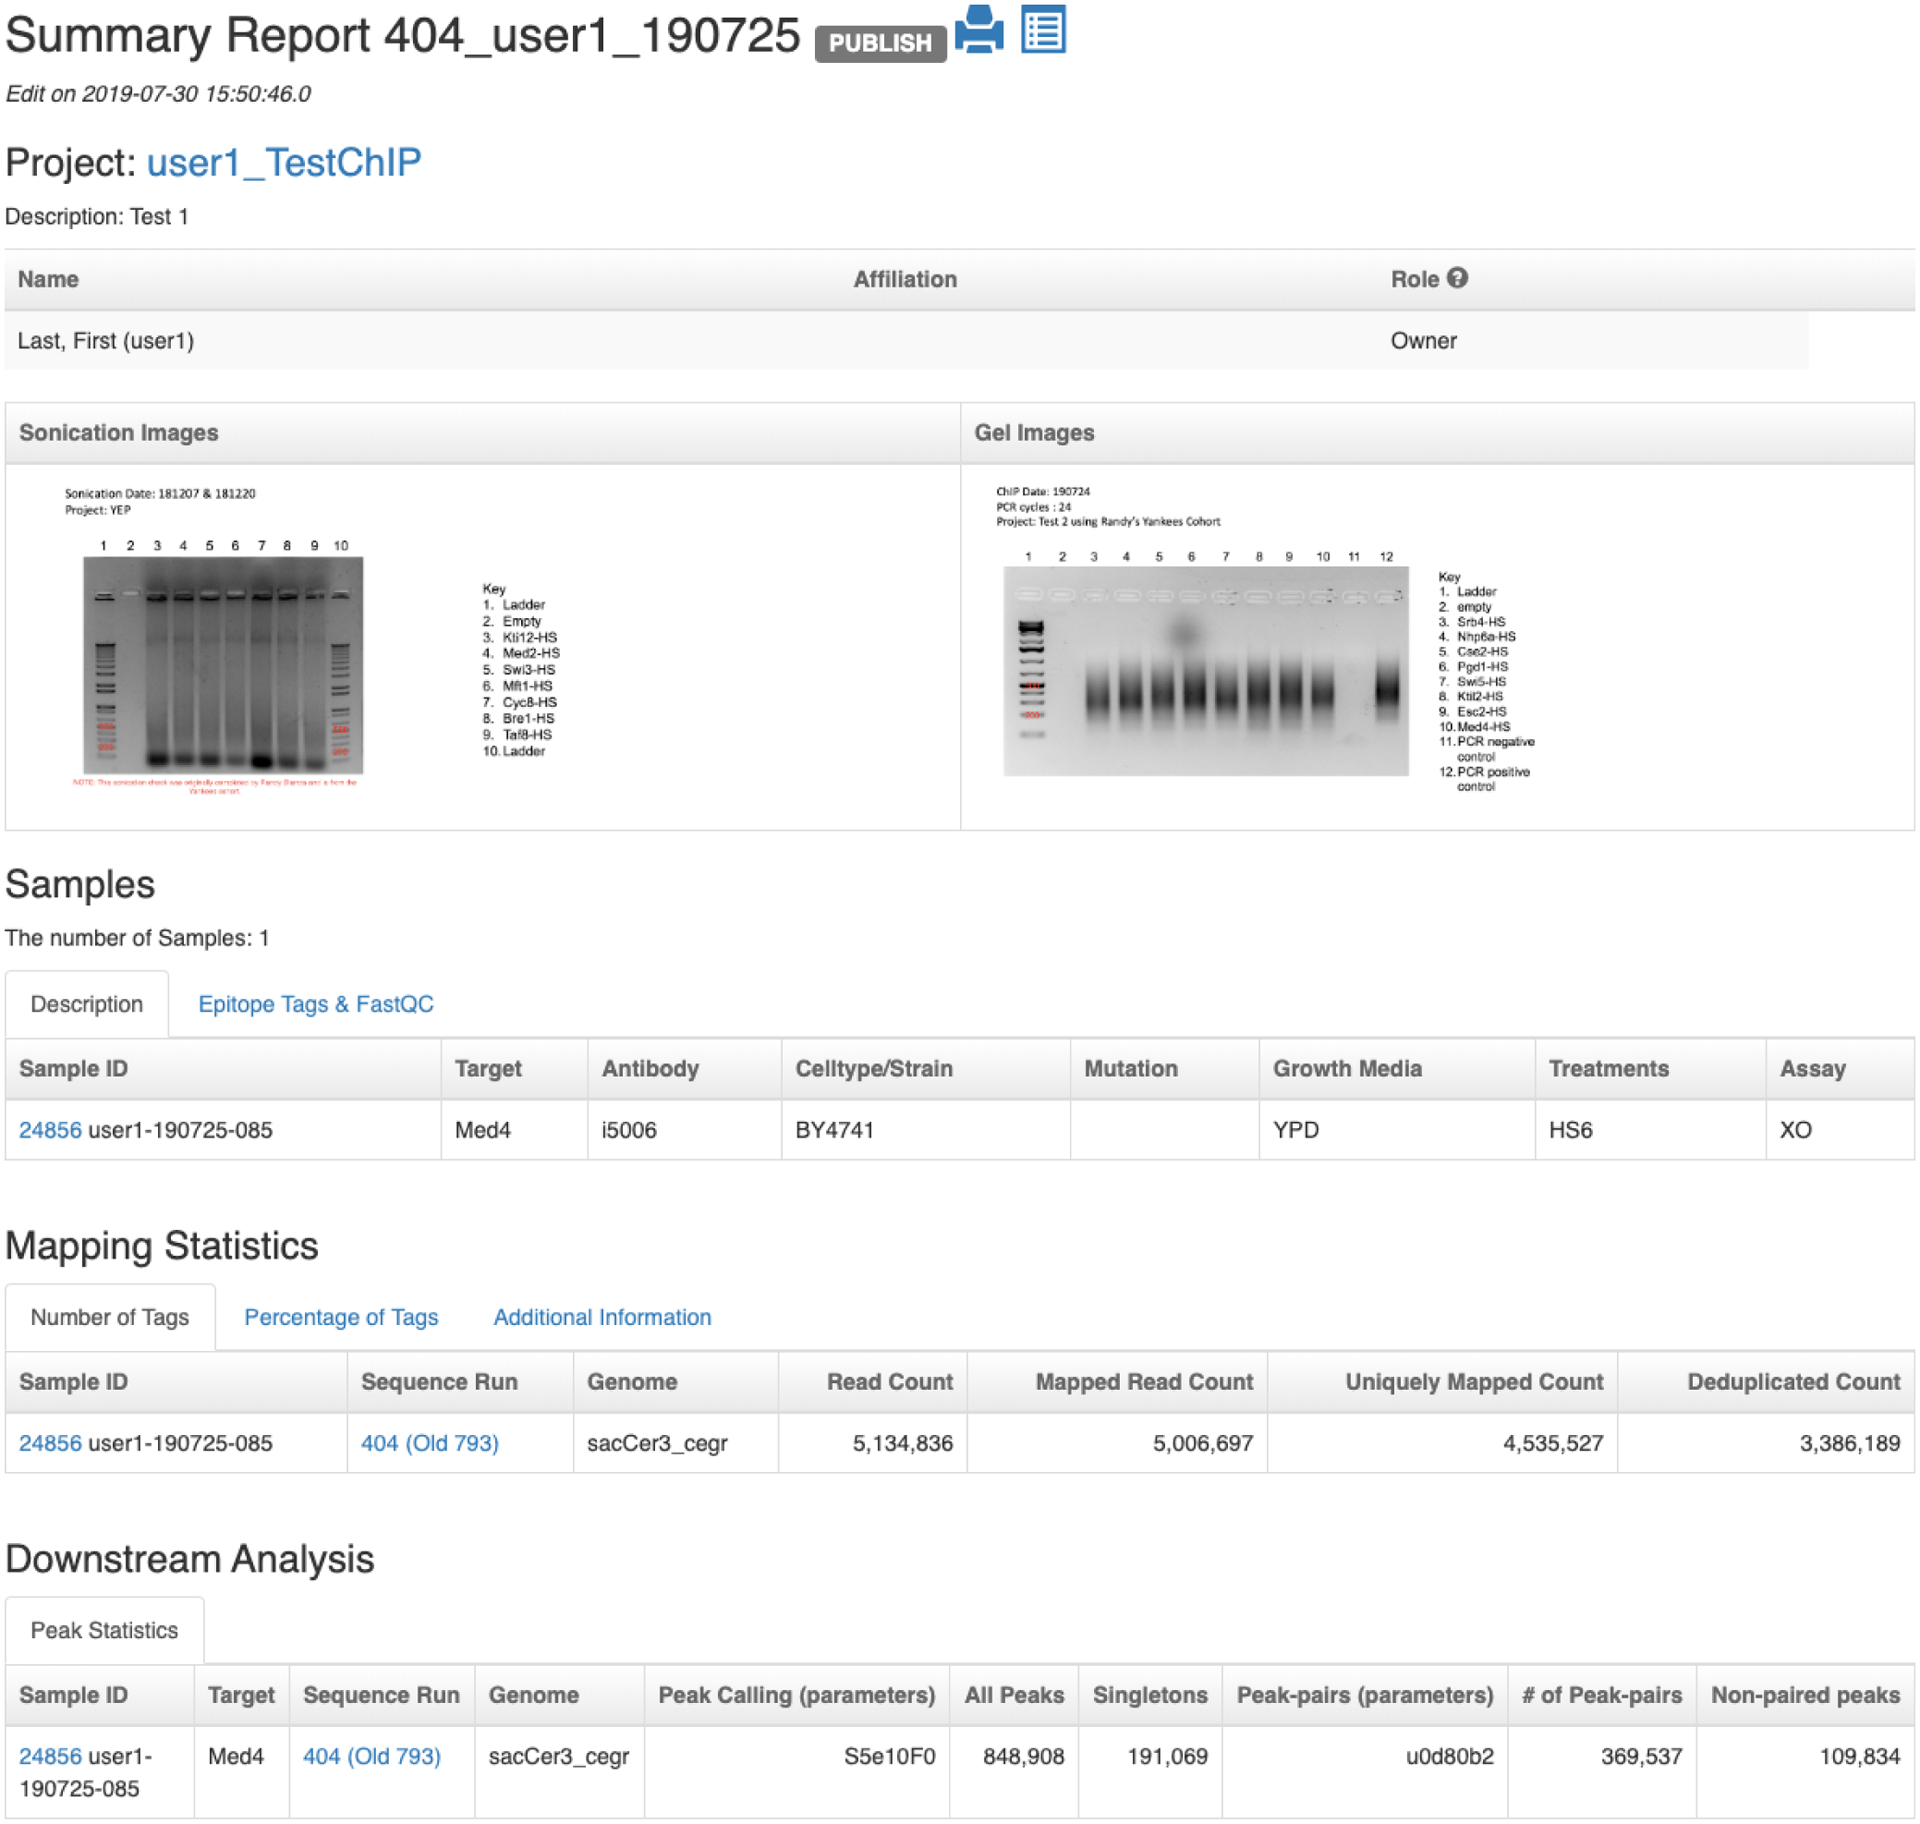
Reporting dashboard on PEGR – Part I: cohort overview, sample metadata, mapping statistics and peak statistics from downstream analysis.
Figure 7:
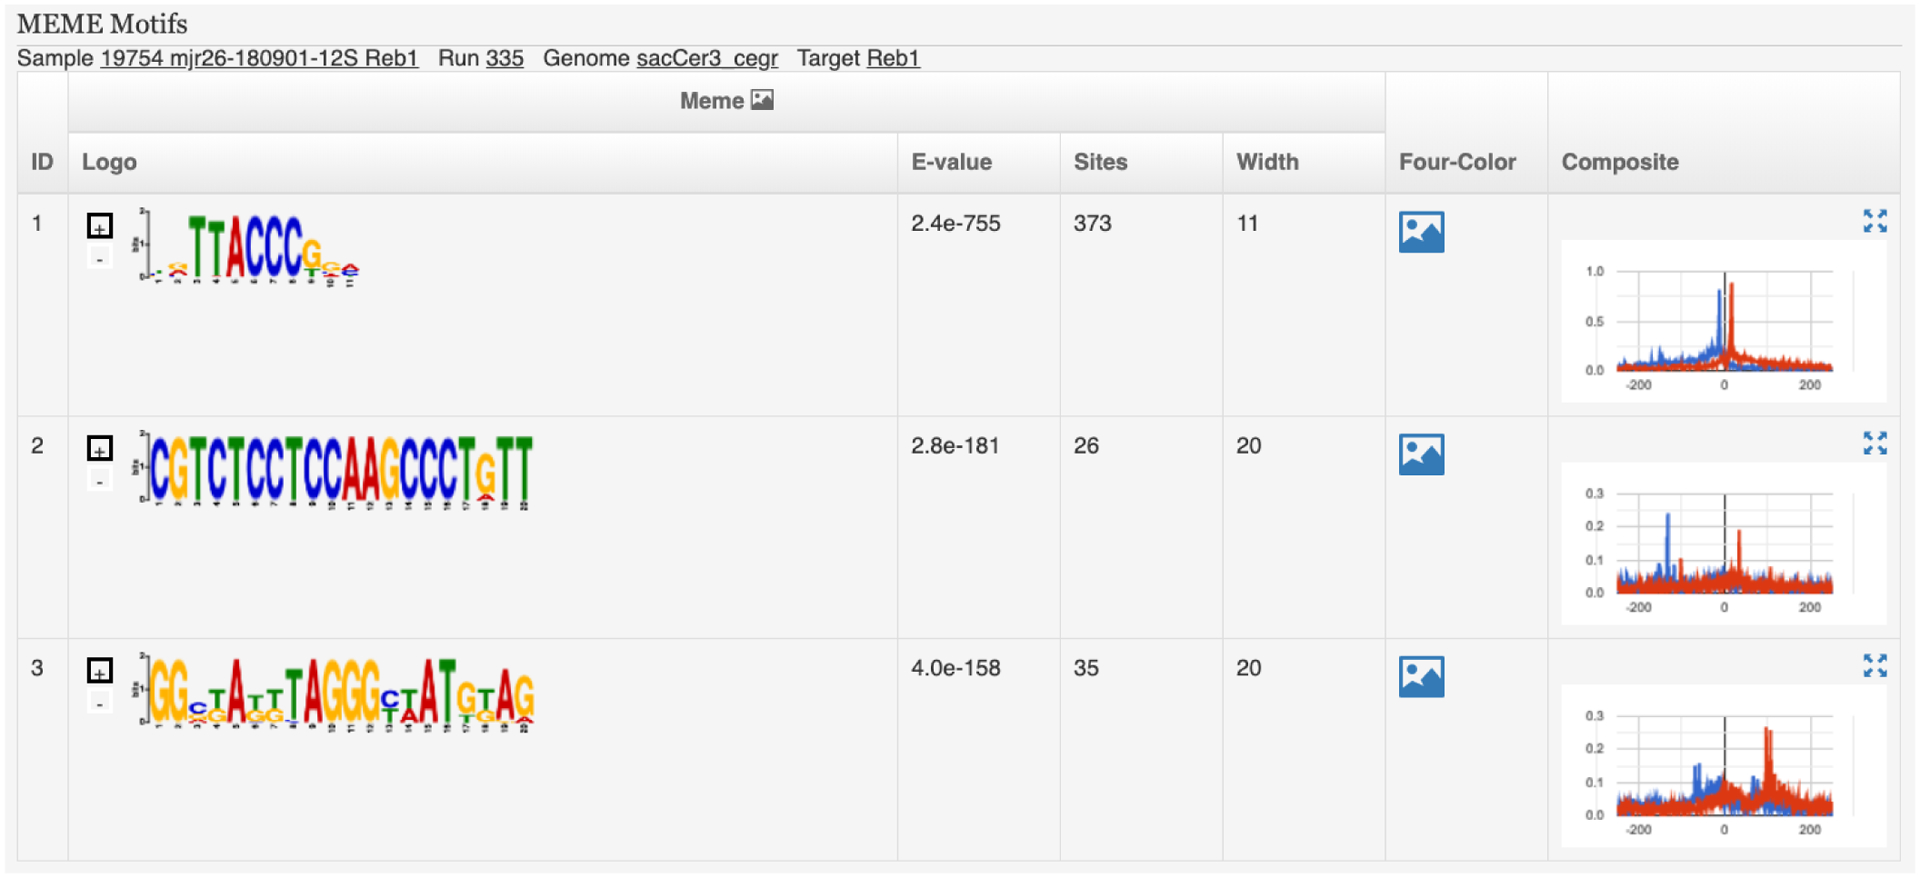
Reporting dashboard on PEGR – Part II: visualization of MEME motifs.
In addition to the cohort view, the users can create a customized report that contains samples of particular interest by querying the PEGR database based on features such as strain, antibody and target. The ability to visualize and compare samples of interest within the same frame helps users to better understand comprehensive genome-wide binding of factors and helps distinguish signal versus noise when visualizing the results.
Furthermore, PEGR provides a RESTful API for users to query and download the sequencing data and analysis results. Similar to the web interface, users can query samples based on sample ID, strain, antibody, target or run ID, and PEGR will return the qualified samples along with their major statistics and the links to the sequencing datasets such as the BAM files. The multiple ways that PEGR provides for reporting and visualization make it easy to share and further utilize the sequencing data.
3. AUTHENTICATION AND AUTHORIZATION
PEGR leverages Spring Security [13] to control the access to the application. Spring Security is a framework that provides authentication, authorization and other security features for enterprise applications. For authentication, PEGR uses four mechanisms: “daoAuthenticationProvider”, “preAuthenticatedAuthenticationProvider”, “anonymousAuthenticationProvider” and “rememberMeAuthenticationProvider”. Through the “daoAuthenticationProvider”, users can login to PEGR using their registered username and password. The “preAuthenticatedAuthenticationProvider” is configured to work with the university’s Identity and Access Management system (Cosign single sign on with integration to Two-Factor Authentication) so that users can be authenticated through their university account without creating additional password with PEGR. The “anonymousAuthenticationProvider” denies access to the application from unauthorized users except for the login page; and the “rememberMeAuthenticationProvider” stores the login information in a cookie and allows for automatic login for an extended period.
PEGR implements Role Based Access Control and assigns a role group to each user. The role group defines the url level access to the application. For example, users who belong to the “Admin” role group can access all the url’s, including those for setting configuration, data curation, and user and role group management. On the other hand, users in the “Bioinformatician” or “Technician” role group have limited access, e.g. they are not allowed to access the system configuration part where the url follows the pattern “/admin/**”.
In addition, more granular access controls are defined for each project and sample. For example, users can be added to a project with different roles, e.g. “owner”, “participant” or “guest”. While all users linked to the project can view the project summary and all the samples in the project, only the owners of the project have the ability to edit the information. This is implemented through interceptors, which apply certain logics across a group of controller actions. Here, the interceptors are executed before the related controller actions are invoked and check whether the user has the appropriate role in the project.
4. DEVELOPMENT, TESTING AND DEPLOYMENT
The software stack used in the development of PEGR includes Open-JDK 1.8.0_212, Groovy 2.4.17, Grails 3.3.10 and MariaDB 10.4.6. The development process follows the agile methodology. In each development sprint which normally spans 2–4 weeks, the software developers discuss with lab members about their experience in using PEGR and practical needs. Together they prioritize the list of tasks. Developers pick several tasks with top priority and make iterative and incremental deliveries. The other tasks are back-logged for follow-up sprints. To guarantee the quality of the software application, automated unit testing and integration testing are used during code development, and functional testing is done on the staging machine before PEGR is deployed to production.
PEGR has been in use at the Center for Eukaryotic Genomic Regulation (CEGR) at the Pennsylvania State University since 2016. It stores and organizes the meta-information for 383 sequencing runs spanning 22,713 unique samples from various sequencing platforms including ABI SOLID, Illumina GA, HiSeq 2000, NextSeq 500, and NextSeq 550.
5. DISCUSSION AND FUTURE WORK
PEGR is a management platform for ChIP-based NGS pipelines. It links people, samples, protocols, sequencers and bioinformatics computation together, and facilitates the research on the mechanisms of genomic regulation. One of the primary challenges of scientific exploration is the complexity and variability of different projects across organization. In order to tackle this challenge, we developed PEGR to provide a flexible system that maintains scientific rigor. For example, through the RESTful API, analysis results can be accepted from any client. And the workflow tracking dashboard is configurable for each version of the data processing workflow. A future direction is to expand the flexibility of PEGR so that it is compatible with other types of sequencing pipelines and has a wider adoption in the NGS community.
Another direction is to improve the barcode tracking system. Although it provides better traceability and scalability, the barcode tracking system has not gained much traction from the lab users. Additional user interface development is needed to ensure that the system brings minimum intrusion to the workflow and enforces standardization of sample preparation and processing.
Supplementary Material
CCS CONCEPTS.
• Information systems → Web applications; Decision support systems; Information integration; Computing platforms; • Applied computing → Life and medical sciences; • Software and its engineering → Software creation and management.
ACKNOWLEDsGMENTS
This work was supported by the US National Institutes of Health (NIH) grant R01ES013768 and the Institute for Computational and Data Sciences (ICDS) at the Pennsylvania State University. The authors thank Prashant Kuntala, Ali Nematbakhsh, Abeer Almutairy, Hedgie Jo, and Pierce Chafflin for their helpful discussions and contributions to this project. Computations for this research were performed on the Pennsylvania State University’s Institute for Computational and Data Sciences Advanced CyberInfrastructure (ICDS-ACI).
REFERENCES
- [1].Afgan Enis, Baker Dannon, Batut Bérénice, van den Beek Marius, Bouvier Dave, Čech Martin, Chilton John, Clements Dave, Coraor Nate, Grüning Björn A, Guerler Aysam, Hillman-Jackson Jennifer, Hiltemann Saskia, Jalili Vahid, Rasche Helena, Soranzo Nicola, Goecks Jeremy, Taylor James, Nekrutenko Anton, and Blankenberg Daniel. 2018. The Galaxy platform for accessible, reproducible and collaborative biomedical analyses: 2018 update. Nucleic Acids Research 46, W1 (2018), W537–W544. https://doi.org/10.1093/nar/gky379 arXiv:http://oup.prod.sis.lan/nar/article-pdf/46/W1/W537/25110642/gky379.pdf [DOI] [PMC free article] [PubMed] [Google Scholar]
- [2].Albert Istvan, Mavrich Travis N., Tomsho Lynn P., Qi Ji, Zanton Sara J., Schuster Stephan C., and Pugh B. Franklin. 2007. Translational and rotational settings of H2A.Z nucleosomes across the Saccharomyces cerevisiae genome. Nature 446 (2007), 572–576. [DOI] [PubMed] [Google Scholar]
- [3].Gilmour DS and Lis JT. 1984. Detecting protein-DNA interactions in vivo: distribution of RNA polymerase on specific bacterial genes. Proc. Natl Acad. Sci 81 (1984), 4275–4279. [DOI] [PMC free article] [PubMed] [Google Scholar]
- [4].Grada Ayman and Weinbrecht Kate. 2013. Next-Generation Sequencing: Methodology and Application. Journal of Investigative Dermatology 133, 8 (2013), 1–4. 10.1038/jid.2013.248 [DOI] [PubMed] [Google Scholar]
- [5].Johnson David S., Mortazavi Ali, Myers Richard M., and Wold Barbara. 2007. Genome-wide mapping of in vivo protein-DNA interactions. Science 316 (2007), 1497–1502. [DOI] [PubMed] [Google Scholar]
- [6].Lai William K. M. and Pugh B. Franklin. 2017. Understanding nucleosome dynamics and their links to gene expression and DNA replication. Nature Reviews Molecular Cell Biology 18 (2017), 548 EP–. 10.1038/nrm.2017.47 Review Article. [DOI] [PMC free article] [PubMed] [Google Scholar]
- [7].Owen Sean, Switkin Daniel, and Team ZXing. 2019. Barcode Scanner. https://play.google.com/store/apps/details?id=com.google.zxing.client.android. Retrieved: 2020-01-27.
- [8].Papageorgiou Louis, Eleni Picasi, Raftopoulou Sofia, Mantaiou Meropi, Megalooikonomou Vasileios, and Vlachakis Dimitrios. 2018. Genomic big data hitting the storage bottleneck. EMBnet.journal 24, 0 (2018), 910. 10.14806/ej.24.0.910 [DOI] [PMC free article] [PubMed] [Google Scholar]
- [9].Reuter Jason A, Spacek Damek V, and Snyder Michael P. 2015. High-throughput sequencing technologies. Molecular cell 58 (2015), 586–97. Issue 4. 10.1016/j.molcel.2015.05.004 [DOI] [PMC free article] [PubMed] [Google Scholar]
- [10].Rhee Ho Sung and Pugh B. Franklin. 2012. Comprehensive genome-wide protein-DNA interactions detected at single-nucleotide resolution. Cell 147, 6 (2012), 1408–1419. 10.1016/j.cell.2011.11.013 [DOI] [PMC free article] [PubMed] [Google Scholar]
- [11].Rhee Ho Sung and Pugh B. Franklin. 2012. Genome-wide structure and organization of eukaryotic pre-initiation complexes. Nature 483, 7389 (2012), 295–301. 10.1038/nature10799 [DOI] [PMC free article] [PubMed] [Google Scholar]
- [12].Rossi Matthew J. and Lai William K. M.. 2018. Simplified ChIP-exo assays. Nature Communications 9 (2018), 2842. 10.1038/s41467-018-05265-7 [DOI] [PMC free article] [PubMed] [Google Scholar]
- [13].Scarioni Carlo. 2013. Pro Spring Security (1st. ed.). Apress, New York, NY. [Google Scholar]
- [14].Skobelev DO, Zaytseva TM, Kozlov AD, Perepelitsa VL, and Makarova AS. 2011. Laboratory information management systems in the work of the analytic laboratory. Measurement Techniques 53, 10 (01 Jan 2011), 1182–1189. 10.1007/s11018-011-9638-7 [DOI] [Google Scholar]
- [15].Smith Glen and Ledbrook Peter. 2014. Grails in Action (2nd. ed.). Manning, Shelter Island, NY. [Google Scholar]
- [16].Solomon MJ and Varshavsky A. 1985. Formaldehyde-mediated DNA-protein crosslinking: a probe for in vivo chromatin structures. Proc. Natl Acad. Sci 82 (1985), 6470–6474. [DOI] [PMC free article] [PubMed] [Google Scholar]
- [17].Wang Xinkun. 2016. Next-Generation Sequencing Data Analysis. CRC Press, Boca Raton, FL. [Google Scholar]
Associated Data
This section collects any data citations, data availability statements, or supplementary materials included in this article.