Abstract
A noninvasive, real-time detection technology was validated for qualitative and quantitative antimicrobial treatment applications. The lux gene cluster of Photorhabdus luminescens was introduced into an Escherichia coli clinical isolate, EC14, on a multicopy plasmid. This bioluminescent reporter bacterium was used to study antimicrobial effects in vitro and in vivo, using the neutropenic-mouse thigh model of infection. Bioluminescence was monitored and measured in vitro and in vivo with an intensified charge-coupled device (ICCD) camera system, and these results were compared to viable-cell determinations made using conventional plate counting methods. Statistical analysis demonstrated that in the presence or absence of antimicrobial agents (ceftazidime, tetracycline, or ciprofloxacin), a strong correlation existed between bioluminescence levels and viable cell counts in vitro and in vivo. Evaluation of antimicrobial agents in vivo could be reliably performed with either method, as each was a sound indicator of therapeutic success. Dose-dependent responses could also be detected in the neutropenic-mouse thigh model by using either bioluminescence or viable-cell counts as a marker. In addition, the ICCD technology was examined for the benefits of repeatedly monitoring the same animal during treatment studies. The ability to repeatedly measure the same animals reduced variability within the treatment experiments and allowed equal or greater confidence in determining treatment efficacy. This technology could reduce the number of animals used during such studies and has applications for the evaluation of test compounds during drug discovery.
Real-time monitoring of antimicrobial effects in vitro and within animal model test systems could enhance our basic understanding of the action of antibiotics and facilitate unique studies of disease in vivo. The development of such technology has been described elsewhere (3, 6, 7, 8, 9), with applications in the field of microbiology that include examination of gene expression, real-time study of infectious processes, and evaluation of novel therapeutic agents during drug discovery.
Antimicrobial testing both in vitro and in vivo has traditionally involved the addition of a given inhibitor during study, followed by plate dilution procedures to quantify viable cells in the determination of antibiotic efficacy (5). Recently various bioluminescent and fluorescent reporter systems have been used to provide a rapid means of assessing bacterial viability following exposure to antimicrobial agents (1, 4, 7, 8, 9, 12, 14, 23). Studies involving bioluminescent detection collect and measure light produced by bacterial expression of various luciferase genes from either insects or bacteria (1, 6, 7, 8, 9, 12, 14). A bacterium-based bioluminescence system, such as the one described from Photorhabdus luminescens (11), is attractive because the genes coding for both the bacterial luciferase and substrate biosynthesis enzymes can be expressed within bacterial hosts. Insect-based bioluminescence systems instead require the addition of an exogenous substrate. Moreover, recent studies using this bacterial system have indicated a strong correlation in vitro between cell density and bioluminescence (11), as well as viable-cell counts and bioluminescence (20). The biochemical basis of the bacterial-bioluminescence system has been described and characterized in the literature (15, 16, 17, 18).
Studies of the infectious process and antimicrobial efficacy in vivo have typically involved introduction of the infectious agent, antibiotic treatment, and eventual quantitation of the bacteria ex vivo from various sites within the host animal. Ideally, studies allowing noninvasive monitoring of the bacterial infection in vivo, using a bioluminescent reporter system, would permit assessment of the disease process and allow monitoring of the same animal throughout the duration of study. Such an approach might provide more information during infection studies, imparting more statistical power while using fewer animals. Recently, Contag et al. (6) reported the development of a method capable of detecting and monitoring bioluminescent bacteria within a living host by using an intensified charge-coupled device (ICCD) camera. By monitoring bioluminescence within live animals, these researchers were able to compare the virulence of three strains of Salmonella enterica serovar Typhimurium, which carried the lux genes of P. luminescens on a multicopy plasmid. In addition, orally infected animals treated with the antibiotic ciprofloxacin were shown to have reduced bioluminescence over the abdominal area. Confirmations of these observations by quantitative bacterial determination and statistical analysis were not performed.
In the current study, bioluminescence was conferred on an Escherichia coli clinical isolate by providing the P. luminescens lux genes on a highly stable, multicopy plasmid. This bioluminescent E. coli strain was used to validate the utility of the ICCD camera technology for both qualitative and quantitative applications of bacterial detection in vitro and in vivo within the neutropenic-mouse thigh model of infection. Statistical analysis demonstrated a high correlation between the number of viable cells and the level of bioluminescence. Antimicrobial efficacies of ceftazidime, tetracycline, and ciprofloxacin were evaluated both in vitro and in vivo, with statistical analysis revealing that either bioluminescence or traditional plate counting methods could be used as an indicator of therapeutic success.
MATERIALS AND METHODS
Bacterial strain.
The clinical E. coli urinary tract infection isolate EC14 (26) was used for both in vitro and in vivo studies. E. coli was propagated at 35°C on Luria agar or in Luria broth (Difco Laboratories, Detroit, Mich.) on a rotary shaker at 200 rpm. When required, the growth medium was supplemented with ampicillin at a concentration of 100 μg/ml. Ceftazidime was supplied by Eli Lilly & Co. (Indianapolis, Ind.), while all other antibiotics tested were purchased from Sigma Chemical Co. (St. Louis, Mo.).
DNA methods.
Restriction enzymes, calf intestinal alkaline phosphatase, and T4 DNA ligase were purchased from Gibco/BRL (Gaithersburg, Md.), and used according to the supplier's specifications. Plasmid DNA was prepared using the Wizard Plus Minipreps DNA Purification System (Promega, Madison, Wis.). Genes coding for bacterial luciferase (from P. luminescens strain Hm [previously Xenorhabdus luminescens]) and its substrate enzymes were subcloned on a 6.9-kb EcoRI fragment from pCGLS1 (11) into pUC18 to generate pCGLS1.UC. This subclone contains luxCDABE and the native promoter region. pCGLS1.UC was introduced into EC14 through electroporation. Electrocompetent EC14 cells were prepared following the method of Binotto et al. (2) and electroporated using a Bio-Rad (Richmond, Calif.) electroporation unit. Differential plating experiments on Luria agar alone and Luria agar supplemented with ampicillin (100 μg/ml) were performed in vitro and in vivo to confirm plasmid stability throughout the studies.
Bioluminescence measurements.
Light emission from the in vitro susceptibility studies was collected and measured using both a 96-well microtiter plate luminometer (model ML3000; Dynatech Laboratories Inc., Chantilly, Va.) and an imaging system provided by Xenogen Corp. (Alameda, Calif.). This imaging system is based on an ICCD camera (model C2400-32; Hamamatsu, Hamamatsu City, Japan) fitted with a 50-mm f1.2 Nikon lens (Nikon, Tokyo, Japan). When necessary, the Nikon lens was fitted with Tiffen ND 0.9 filters (Tiffen Manufacturing Corp., New York, N.Y.). Serial dilutions of cells were made to allow comparisons between bioluminescence and viable cell counts. Real-time photon collection and imaging of bacterial infections in vivo were achieved using the ICCD camera as described below. Spatial reference images, referred to as grayscale images, were collected in dim light prior to the collection of photons in complete darkness. Photon emission was measured using 1- and 3-min integration times for in vitro and in vivo studies, respectively. The bioluminescent images were displayed as pseudocolor images, with variations in color representing light intensity at a given location. In this study, red represented the most intense light emission, while blue corresponded to the weakest light signal. Overlaying the pseudocolor image onto the grayscale image creates a final image that spatially illustrates the distribution and intensity of bioluminescent bacteria within the animal. An Argus 20 image processor (Hamamatsu) was used to process all collected images, which were subsequently transferred to a Power Macintosh G3. Camera control, image analysis, and signal intensity measurements were performed using LivingImage version 2.0 software (Xenogen Corp.).
In vitro susceptibility studies.
The microtiter broth dilution method of the National Committee for Clinical Laboratory Standards (19) was used to determine the minimum inhibitory concentration (MIC) and minimum bactericidal concentration (MBC) of ceftazidime, chloramphenicol, tetracycline, ciprofloxacin, gentamicin, kanamycin, and tobramycin for EC14 and EC14(pCGLS1.UC). A twofold dilution series of each antibiotic was prepared in Mueller-Hinton II broth (MHII; Difco Laboratories, Detroit, Mich.), yielding a concentration range from 128 to 0.125 μg/ml. Overnight bacterial cultures were diluted and added to each well to give a final concentration of 5 × 10⁵ CFU/ml. Microtiter plates were incubated overnight at 35°C. The MICs were determined as the lowest antibiotic concentration that completely inhibited visible growth, as determined by optical density readings at 540 nm (Microplate autoreader; Bio-tek Instruments, Winooski, Vt.) or luminescence measured with the ICCD camera. Following MIC determination, 5 μl from each well was inoculated onto MHII agar plates and incubated overnight at 35°C. The MBC was determined as the lowest antibiotic concentration yielding ≥99.9% killing of bacteria in the final inoculum, as determined by visual growth assessment or luminescence.
For in vitro growth and luminescence studies, overnight EC14 and EC14(pCGLS1.UC) cultures were diluted 1:100 in fresh Luria broth and grown to mid-logarithmic phase at 35°C on a rotary shaker. These mid-logarithmic-phase cells were subcultured with a 1:100 dilution in fresh Luria broth and grown for 7 h. At 0 h and every hour thereafter, aliquots of cells were removed from the actively growing culture, and dilutions were made for viable cell counting and luminescence measurements using both the luminometer and ICCD camera.
Animal model and antimicrobial therapies.
The neutropenic-mouse thigh model of infection was used as previously described by Craig et al. (10), following approved animal care protocols. Female ICR/Swiss mice, 6 to 8 weeks old and weighing 19 to 21 g (Harlan Sprague Dawley Inc., Indianapolis, Ind.), were rendered neutropenic by intraperitoneal (IP) administration of cyclophosphamide (Sigma) at days −4 (dosage, 150 mg/kg) and −1 (dosage, 100 mg/kg). Mice were anesthetized using 4% isoflurane in O2 (Abbott Laboratories, North Chicago, Ill.), and thigh infections were initiated by injecting 105 log phase EC14 or EC14(pCGLS1.UC) cells into each thigh. Antibiotic therapies (ceftazidime, tetracycline, or ciprofloxacin) were given IP at 1 and 5 h postinfection. A separate group of animals served as untreated infection controls. Two animals per group were sacrificed at the time of injection (0 h) and every 2 h thereafter. In some cases, four animals were sacrificed at the last time point in the study. Thighs were removed and homogenized (Polytron tissue homogenizer; Brinkman Instruments Inc., Westbury, N.Y.) in 9 ml of 0.9% saline. Serial 10-fold dilutions of the homogenate were made, and 10-μl aliquots of each dilution were plated on Luria agar plates (Difco Laboratories) for viable cell determinations (CFU per thigh).
Real-time monitoring of bacterial infections in vivo.
At the time of infection (0 h) and every 2 h thereafter (to 12 h), photon counts (PCs) were taken of each thigh using the ICCD. For each time point two mice were placed on a specimen-positioning device to ensure reproducible thigh placement inside a dark collection chamber. Studies were previously performed to optimize collection parameters of the ICCD system and are described by Iversen et al. (P. W. Iversen, H. L. Rocchetta, J. W. Foley, C. J. Boylan, and T. P. Parr, Jr., unpublished data). Data from that study prompted us to choose imaging standards as follows: lens to sample distance of 40 cm, two animals per image, photons collected from the ventral side, full thigh extension within the positioning device, and a 3-min signal accumulation time. During signal collection, mice were maintained under isoflurane anesthesia using a nose cone delivery system.
Microbiological assay of ceftazidime in mouse plasma.
Ceftazidime was administered to mice at a single dose of 50 mg/kg IP. Heparinized blood samples were collected from each of three mice at the following time points: 0.083, 0.25, 0.5, 0.75, 1, 1.5, 2, 3, and 4 h postinoculation. Whole blood was centrifugated, and plasma was separated and frozen at −70°C until assayed. Ceftazidime concentrations in the plasma were determined by microbiological assay using Morganella morganii MX361 (R. M. Echols, Albany Medical College, Albany, N.Y.) as the indicator organism. Following overnight growth at 35°C on MHII agar, a 0.5 McFarland suspension of M. morganii MX361 was prepared and diluted 1:1,000 into melted MHII agar maintained at 48°C. The inoculated medium (12.5 ml) was poured into 100- by 15-mm petri dishes, and 9-mm wells were punched after the agar was set. For standard curve preparation, ceftazidime was solubilized in phosphate-buffered saline (pH 7.0) to a concentration of 1 mg/ml, diluted 1:10 in sterile mouse plasma (Harlan Bioproducts for Science, Inc., Indianapolis, Ind.), and then serially diluted 1:2 in sterile mouse plasma to yield concentrations ranging from 50 to 0.390 μg/ml. For each standard curve and mouse plasma sample, 100 μl was added to each plated well and performed in duplicate. Plates were incubated overnight at 35°C, and zone diameters were measured to the nearest 0.1 mm. The lower limit of detection for the assay was found to be 0.78 μg/ml. Plasma pharmacokinetic parameters were calculated using the Eli Lilly and Co. ADME/PTK (absorption, distribution, metabolism, and excretion/pharmacokinetics) computer software application for a noncompartmental analysis. Area under the curve values were calculated from time zero to the last measurable time point and from zero to infinity.
Statistical methods.
JMP software version 3.2.2 or SAS software version 6.12 from the SAS Institute, Cary, N.C., was used for all analyses. For in vivo data, ICCD readings and viable counts (CFU/thigh) from left and right legs were averaged for each animal prior to analysis. Correlations reported in Fig. 4 were determined using analysis of covariance with the baseline log PC as the covariant. Endpoint data were analyzed by two-way analysis of variance (ANOVA) with time and treatment as factors. Time course data shown in Fig. 6 below were analyzed by repeated-measures ANOVA with compound symmetry error structure. The data shown in Fig. 7 below were correlated using analysis of covariance with the baseline log PC as the covariate.
FIG. 4.
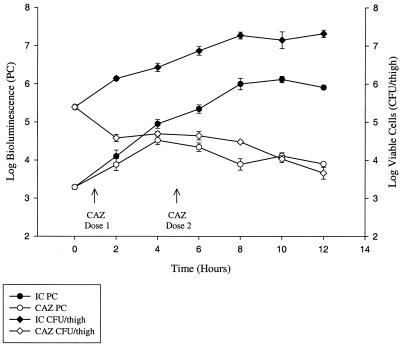
Growth and bioluminescence curves of EC14(pCGLS1.UC) grown in vivo using the neutropenic-mouse thigh model of infection. Viable counts are reported as CFU per thigh, and bioluminescence is represented as PCs as measured using the ICCD camera. Each data point is the mean ± SE determined using two animals, with the exception of the 12-h time point, which is the mean ± SE of four animals. Bioluminescence was determined at each time point from a set of two or four animals immediately prior to determination of viable-cell count. In this study, the correlation of viable-cell count to bioluminescence was 0.95 from 4 to 12 h and 0.88 from 2 to 12 h. IC, infection control; CAZ, ceftazidime treatment (50 mg/kg at 1 and 5 h postinfection).
FIG. 6.
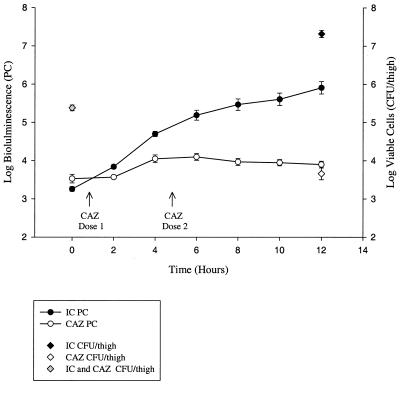
In vivo bioluminescence monitoring of EC14(pCGLS1.UC) in the neutropenic-mouse thigh model of infection using the ICCD camera. Each data point is the mean ± SE of the same four animals at each time point. Viable counts are indicated for 0- and 12-h time points for both the untreated infection control group and the ceftazidime treated group. IC, infection control; CAZ, ceftazidime treatment (50 mg/kg at 1 and 5 h postinfection).
FIG. 7.
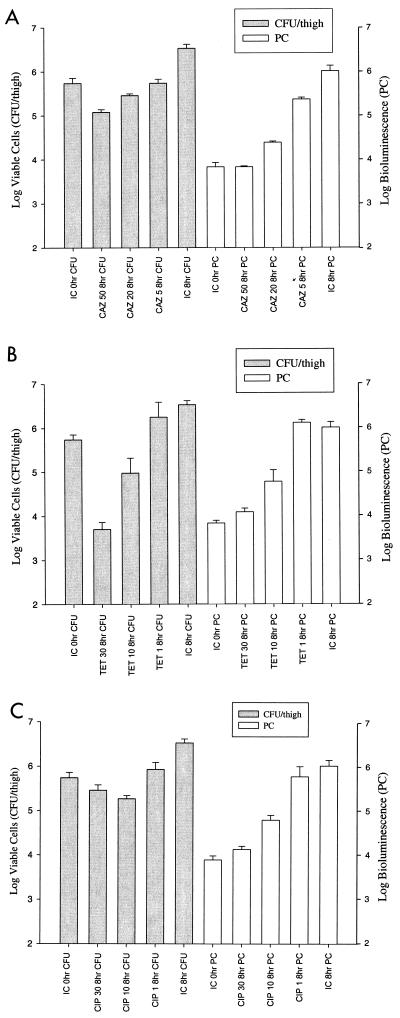
Comparison of viable counts and bioluminescence (measured by ICCD camera) with administration of different doses of ceftazidime (CAZ; 50, 20, and 5 mg/kg) (A), tetracycline (TET; 30, 10, and 1 mg/kg) (B), and ciprofloxacin (CIP; 30, 10, and 1 mg/kg) (C) in the neutropenic-mouse thigh model of infection. Viable counts and bioluminescence were determined at 0 and 8 h for each dose of antibiotic and for infection controls (IC). The correlation between viable- cell count and bioluminescence is 0.98, 0.94, and 0.91 for ceftazidime (A), tetracycline (B), and ciprofloxacin (C), respectively. Each data set is the mean ± SE determined using two animals.
RESULTS
In vitro susceptibility studies.
Antibiotic-susceptibility tests of EC14(pCGLS1.UC) were performed in duplicate, and results are shown in Table 1. Susceptibilities of EC14 were also determined for the same set of antibiotics and found to be within twofold of EC14(pCGLS1.UC) (data not shown). For each antibiotic tested, the MIC values of EC14(pCGLS1.UC) were identical as determined by either standard turbidity assays or bioluminescence, indicating inhibition of both bacterial growth and light emission. The MBC value for one of the seven antibiotics tested, gentamicin, was one doubling dilution higher as determined using the ICCD camera, likely due to the increased sensitivity of the system compared to that of visual growth assessment.
TABLE 1.
Antibiotic susceptibilities of EC14(pCGLS1.UC) as determined by bacterial growth and bioluminescence
| Antibiotic | MIC (μg/ml) by method
|
MBC (μg/ml) by method
|
||
|---|---|---|---|---|
| Turbiditya | Bioluminescenceb | Visual growth | Bioluminescenceb | |
| Ceftazidime | 0.5 | 0.5 | 0.5 | 0.5 |
| Chloramphenicol | 8 | 8 | 128 | 128 |
| Tetracycline | 0.5 | 0.5 | 128 | 128 |
| Ciprofloxacin | <0.125 | <0.125 | <0.125 | <0.125 |
| Gentamicin | 1 | 1 | 0.5 | 1 |
| Kanamycin | 4 | 4 | 4 | 4 |
| Tobramycin | 1 | 1 | 2 | 2 |
These values were determined by measuring the turbidity at 540 nm using a 96-well plate reader.
Bioluminescence was measured using the ICCD camera.
In vitro bioluminescence studies.
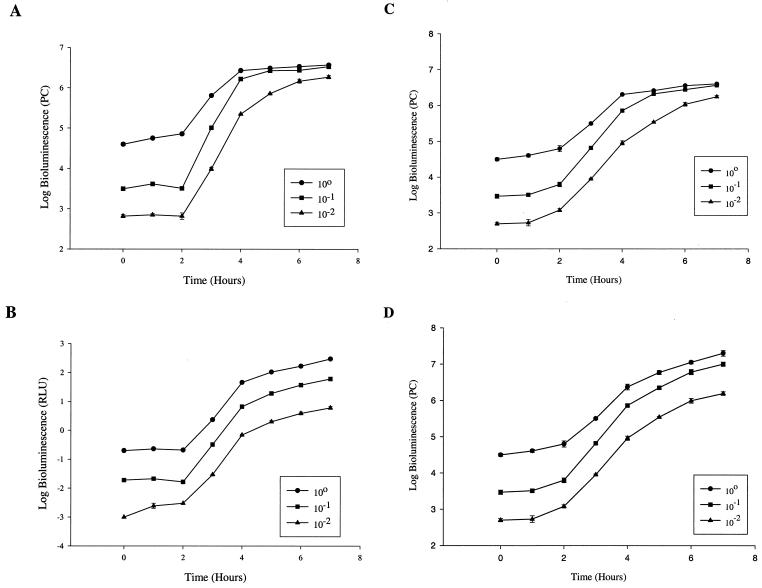
Bioluminescence of EC14(pCGLS1.UC) was measured using a conventional microtiter luminometer and an ICCD camera. Tenfold dilutions of a mid-log-phase culture were assayed for bioluminescence using these two systems, and the results are illustrated in Fig. 1. Similar bioluminescence curves were obtained for each system (Fig. 1A and B); however, the PCs measured with the ICCD camera showed signal saturation effects with the highest of the three dilutions between 4 and 7 h (Fig. 1A).
FIG. 1.
Bioluminescence growth curves of EC14(pCGLS1.UC) grown in vitro. A series of 10-fold dilutions were measured for bioluminescence using the ICCD camera (A) and the microtiter luminometer (B) from 0 to 7 h. Bioluminescence is reported as PCs for the ICCD camera and relative light units (RLU) for the luminometer. Panels C and D compare bioluminescence reading of the ICCD camera in the presence (D) and absence (C) of lens filters. For panel D, only those bioluminescence readings greater than 6 log units were measured using the lens filters. The values are means plus or minus standard errors (SE) of two independent experiments.
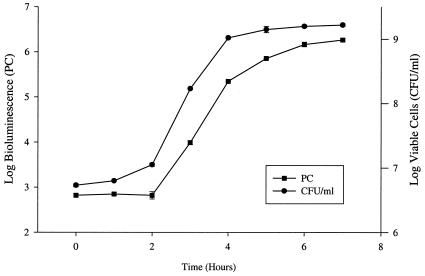
When the ICCD camera lens was fitted with appropriate filters, these saturation effects could be eliminated (Fig. 1C and D). In the absence of the filters, the dynamic range of the ICCD camera was between approximately 2.6 and 6 log units. The bioluminescence curves were found to closely correlate with viable cell counts, yielding correlation coefficients of 0.98 for both the luminometer and ICCD (Fig. 2), respectively. The sensitivity of the ICCD camera system was also found to be higher than that of the luminometer, detecting a lower limit of approximately 400 cells with a 1-min signal accumulation time as compared to 104 cells shown with the luminometer (data not shown).
FIG. 2.
Growth and bioluminescence curves (10−2 dilution) of EC14(pCGLS1.UC). Viable counts are represented as CFU/ml, while bioluminescence, measured with the ICCD camera, is expressed as PCs. The correlation of viable-cell count to bioluminescence was 0.98. Each set of measurements is the mean of two independent experiments ± SE.
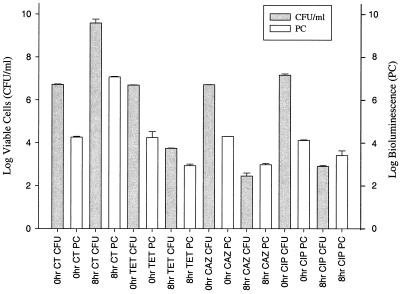
Antimicrobial-agent-exposure studies of EC14(pCGLS1.UC) demonstrated a decrease in both viable cell count and bioluminescence from 0 to 8 h when cells were treated with ceftazidime, tetracycline, or ciprofloxacin (Fig. 3). In all cases, an increase or decrease in cell number reflected a corresponding increase or decrease in bioluminescence, yielding a correlation coefficient of 0.98. The log number of viable cells was usually found to be higher than the log bioluminescence, as seen in Fig. 2 and 3. Exceptions were the ceftazidime- and ciprofloxacin-treated 8-h cultures (Fig. 3) in which the bioluminescence was equal or greater than that in the tetracycline-treated 8-h culture, while the numbers of viable cells in the ceftazidime- and ciprofloxacin-treated samples were lower. This may suggest that in some cases antibacterial treatment may not cause immediate cell death, allowing cells to maintain some level of bioluminescence at the 8-h time point. Such cells would not be recoverable by the ensuing viable plate count method, which is reflected in the lower cell number determined 16 to 24 h after luminescence evaluation. Alternatively, both ceftazidime and ciprofloxacin have been reported to cause cellular elongation in addition to cell killing, which results in filament formation (22, 24, 25). This morphological change has been reported to primarily occur during exposure to sub-MIC levels of antibiotic (25); however, Trautmann et al. (22) reported filament formation in E. coli upon exposure to 50-fold the MIC of either ceftazidime or ciprofloxacin. This cell elongation could cause an increase in viable bacterial biomass while viable cell counts decrease and may explain the lack of a corresponding decrease in bioluminescence at these later time points.
FIG. 3.
Viable-cell counts and bioluminescence (ICCD) measurements of EC14(pCGLS1.UC) grown in vitro and treated with either tetracycline (TET), ceftazidime (CAZ), or ciprofloxacin (CIP). The cultures were treated with the antibiotics at mid-log phase, using 250-fold the MIC. Viable-cell counts and bioluminescence were measured at 0 and 8 h. The correlation of viable-cell count to bioluminescence was 0.98. Each set of measurements is the mean of two separate experiments ± SE. CT, untreated control.
In vivo bioluminescence monitoring of antimicrobial therapy.
Studies were performed in the mouse thigh infection model comparing the growth kinetics of EC14 and EC14(pCGLS1.UC). EC14(pCGLS1.UC) was recovered from the thigh model at 8 h postinfection at a count 0.94 log unit lower than that of the EC14 strain alone (data not shown). A similar trend was observed in vitro, with EC14(pCGLS1.UC) being 0.25 log unit lower than EC14 following 8 h of growth (data not shown). In vivo, however, the reduced growth of EC14(pCGLS1.UC) did not appear to affect the outcome of the infection model, as an overall 1.93-log-unit increase in EC14(pCGLS1.UC) was observed during the 12-h study (Fig. 4).
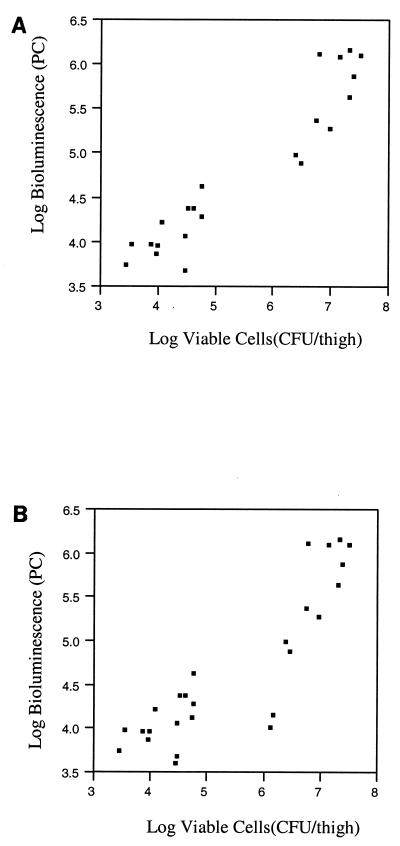
To assess the feasibility of using bioluminescence as a quantitative indicator of bacteria in vivo, studies were performed which directly compared bioluminescence in PCs to the number of viable cells (CFU per thigh). In this 12-h study, animals were separated into two groups; the first group was the infection control group, which received no antimicrobial therapy, while the second group received ceftazidime. Anesthetized animals were monitored for bioluminescence throughout the study using the ICCD camera which externally collects and localizes photons emitted from EC14(pCGLS1.UC) within the animal. At 2-h intervals a given set of animals (two or four) in each group was assessed for viable EC14(pCGLS1.UC). Plating experiments on selective and nonselective media revealed that pCGLS1.UC was maintained within EC14 during the 12-h study (correlation coefficient, 0.98). The greatest difference between viable cell count and bioluminescence was observed at the time of inoculation into the thigh (0 h). In the infection control group, a difference of 2 log units was seen at 0 h, decreasing to a difference of 1.4 log units by 12 h (Fig. 4). The low PC at 0 h was likely due to the depth and concentration of the initial inoculum within the thigh tissue. Over the course of the 12-h study, however, a high correlation coefficient (0.95 from 4 to 12 h and 0.88 from 2 to 12 h) was observed between the number of EC14(pCGLS1.UC) cells recovered at each time point and the level of bioluminescence in both the untreated infection control group and the ceftazidime treatment group (Fig. 4). For these correlations, scatterplots were used to verify the linear relationships (Fig. 5). For the ceftazidime therapy group, as bioluminescence increased from time zero, there was a lower correlation at 2 h after inoculation, when the viable cell count decreased. As the first dose of ceftazidime was administered at 1 h postinfection, it may be that bacterial cells inhibited by the antibiotic treatment were still bioluminescent at the 2-h ICCD reading but not recoverable by conventional viable plating methods, as was observed for the in vitro ceftazidime and ciprofloxacin treatment study (Fig. 3).
FIG. 5.
Scatterplots of viable cells and bioluminescence data used to generate the graph and correlations from Fig. 4. (A) The correlation plot for the in vivo study between 4 and 12 h (correlation coefficient, 0.95); (B) the plot for data between 2 and 12 h (correlation coefficient, 0.88). Both plots demonstrate the linear relationship between bioluminescence and viable-cell counts. Separate clustering of the treated and untreated animals can also be seen in the lower and upper quadrants of the plots.
A decrease in bioluminescence at the 12-h time point within the infection control group of Fig. 4 may reflect some interanimal variation as different animals were used for each time point. Figure 6 illustrates that when the same set of animals was repeatedly monitored throughout the study, a steady increase in bioluminescence could be seen to 12 h. For those animals receiving ceftazidime therapy, a decrease in both viable cells and bioluminescence was observed, and these treated animals could easily be distinguished from infection control animals based on either viable-cell counts or bioluminescence (P < 0.0001). Some of the variation observed within the treatment group was attributed to variability among animals, since bioluminescent monitoring of the same set of ceftazidime-treated animals revealed a more consistent decrease in PCs (Fig. 6) than that of different sets of animals measured over time (Fig. 4).
Table 2 illustrates the advantages of noninvasively monitoring infections and antimicrobial therapies through repeated measurements on the same set of animals during experiments (based on data illustrated in Fig. 4 and 6). Although the actual mean log treatment differences were smaller for the PC data than the viable count data, due to a narrower range of values obtainable with the ICCD camera, the method of repeated measurement of PCs could detect smaller differences (0.34 log units) between the ceftazidime-treated group and untreated control group. Thus using fewer animals, more precise treatment comparisons can be made using repeated-measure data from the ICCD camera.
TABLE 2.
Comparison of viable-cell counts and bioluminescence analysis in determining ceftazidime treatment differences in the mouse thigh model of infectiona
| Analytical methods (no. of animalsb) | Time period (h) | Log mean difference between treatment groups ± SE | P value between treatment groupsc | Least significant log difference among treatment groups |
|---|---|---|---|---|
| Viable-cell plate counts—two-way ANOVA (28) | 8 | 2.8 ± 0.21 | 2.0E-09 | 0.44 |
| 12 | 3.6 ± 0.18 | 9.0E-12 | 0.38 | |
| ICCD camera—two-way ANOVA (28) | 8 | 2.1 ± 0.19 | 2.0E-08 | 0.41 |
| 12 | 2.0 ± 0.16 | 7.0E-09 | 0.35 | |
| ICCD camera—repeated-measures ANOVA (8) | 8 | 1.5 ± 0.17 | 3.0E-09 | 0.34 |
| 12 | 2.0 ± 0.17 | 1.0E-11 | 0.34 |
The animals from the 0-h time point are not included here as no treatment difference would be seen.
P values, determined using JMP software, indicate significant differences between ceftazidime-treated and untreated control groups.
To ensure that appropriate ceftazidime pharmacokinetic data were obtained within the neutropenic-mouse thigh model, a single-dose antimicrobial study was performed. The resulting serum concentrations were used to calculate area under the curve values of 24.51 and 27.7 μg per h/ml, respectively, for time zero to the last measurable time point and from zero to infinity. Ceftazidime was found to be rapidly absorbed following IP administration, with a mean peak concentration of 38.91 μg/ml observed at the first collection time point. Ceftazidime plasma concentrations subsequently decreased in a monophasic manner. The half-life value was determined to be 28.2 min in this study. These pharmacokinetic parameters are similar to those previously reported for ceftazidime in the neutropenic-mouse thigh model (13).
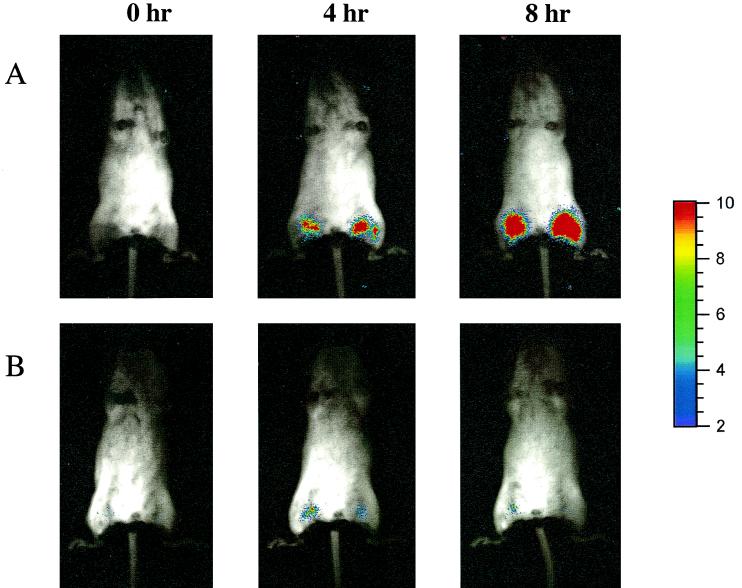
To determine whether dose responses to an antimicrobial therapy could be detected using bioluminescence as an indicator, a second in vivo study was conducted using ceftazidime (50, 20, and 5 mg/kg), tetracycline (30, 10, and 1 mg/kg), and ciprofloxacin (30, 10, and 1 mg/kg). In this study, two administrations of each antibiotic dose (e.g., 50 mg/kg) were given IP at 1 and 5 h postinfection. For all antibiotics, a dose-dependent response was observed over a three-dose range when relying on either viable cell counts or bioluminescence levels measured at 8 h postinfection (Fig. 7A, B, and C). The highest dose of ciprofloxacin (30 mg/kg) showed higher viable cell counts than the intermediate dose of 10 mg/kg; however, when factoring in the error bars, a dose response was still observed (Fig. 7C). Statistical analysis revealed correlations of 0.98, 0.94, and 0.91 for ceftazidime, tetracycline, and ciprofloxacin doses, respectively, when comparing viable cell counts to bioluminescence. When two additional intermediate doses were administered in a 5-dose study (ceftazidime, 50, 35, 20, 12.5, and 5 mg/kg; tetracycline, 30, 20, 10, 5, and 1 mg/kg; ciprofloxacin, 30, 20, 10, 5, and 1 mg/kg), a dose-dependent response was again observed for each antibiotic by both methods (data not shown). Figure 8 illustrates the ICCD images of an infection control animal (Fig. 8A) and a ceftazidime-treated animal (50 mg/kg [Fig. 8B]) collected at 0, 4, and 8 h postinfection. Following injection of 105 cells per thigh, bioluminescent E. coli were weakly visualized on both thighs (Fig. 8, lane 0 h). As the infection progresses, the 4- and 8-h images of the infection control animal demonstrate that the area of luminescence expands over the thighs, which correlates with an increase in viable-cell number. The ceftazidime-treated animal reveals a slight increase in bioluminescence at 4 h postinfection; however, by 8 h the level of bioluminescence was equivalent to that of the 0-h time point. This is confirmed in Fig. 7A whereby 0- and 8-h PCs of the 50-mg/kg ceftazidime dose yielded similar values of 3.83 log units.
FIG. 8.
Localization of EC14(pCGLS1.UC) in the neutropenic-mouse thigh model. A bacterial suspension of 105 cells/thigh was injected intramuscularly, and images were acquired with the ICCD camera at 0, 4, and 8 h. Infection control animals are shown in panel A, while panel B illustrates the antibacterial effects of a 50-mg/kg treatment with ceftazidime administered IP at 1 and 5 h postinfection. A similar bit range of 0 to 3 was used to display each image.
DISCUSSION
For E. coli, we were able to demonstrate that bioluminescence could serve as a biosensor of antibacterial activity for both in vitro and in vivo studies. Previous work by other researchers had shown that E. coli harboring genes encoding the P. luminescens luciferase and fatty aldehyde substrate enzymes achieved a bioluminescence optimum at 37°C in vivo and exhibited elevated thermal stability at up to 45°C in vitro (21, 27). These higher levels of stability at increased temperatures make the P. luminescens bacterial-bioluminescence system the preferred system for in vivo studies. The presence of oxygen is essential for the bioluminescence reaction (reviewed in reference 16), and thus in vivo assessment is achieved using live animals and interpreted on the basis of oxygen availability within the measured site in the animal. In this study use of a soft tissue model of infection ensured a highly oxygenated environment, which allowed favorable detection of bioluminescent bacteria.
In vitro studies were first performed on the clinical isolate EC14 containing pCGLS1.UC, to determine MIC and MBC values using both bioluminescence and growth determination methods. The antibiotics tested were either bacteriostatic (e.g., chloramphenicol) or bactericidal (e.g., ceftazidime) and had various modes of action, including protein synthesis inhibitors (chloramphenicol, tetracycline, gentamicin, kanamycin, and tobramycin), cell wall synthesis inhibitors (ceftazidime), and DNA synthesis inhibitors (ciprofloxacin). Regardless of the mode of action or the ability to reverse growth inhibition, MIC or MBC values were the same when determined by either turbidity/growth or bioluminescence. For gentamicin, the MBC value was one doubling dilution higher when determined by bioluminescence simply due to the increased sensitivity of the ICCD system over visual growth assessment on agar plates.
Antimicrobial studies were performed in vitro using three of the previously studied antibiotics, ceftazidime, tetracycline, and ciprofloxacin, which demonstrated that increases or decreases in viable cell number were associated with similar changes in bioluminescence. Viable cell counts gave greater log values than bioluminescence readings due to the difference in dynamic measurement ranges between the two methods. The exception was the 8-h ceftazidime and ciprofloxacin PC value (Fig. 3). It is interesting that repeated-measures data from the in vivo ceftazidime treatment also gave a slightly higher PC value at 12 h postinfection compared to the viable count value (Fig. 6). In both cases it is possible that cells monitored by the ICCD camera at the end of the antimicrobial study may maintain a certain level of bioluminescence, but only a subset of these bacteria are recoverable by viable plate count methods at 16 to 24 h post-ICCD measurement. An alternative as mentioned may be that the biomass of the cell population increases at these later time points due to filament formation following ceftazidime and ciprofloxacin exposure, which may explain the lack of a corresponding decrease in bioluminescence.
Studies performed in vivo using ceftazidime, tetracycline, and ciprofloxacin demonstrated dose-dependent responses using both a three-dose and a five-dose range for each antibiotic. Comparing the infection control at 8 h with that of the highest dose of each antibiotic shows a decrease in both bioluminescence and viable cells (Fig. 7). When relying on either method as an indicator of antimicrobial efficacy, ceftazidime, tetracycline, and ciprofloxacin therefore demonstrate therapeutic success over a 2-log-unit range. However, when bioluminescence measurements at 8 h were compared to the 0-h infection control (initial inoculum), the ceftazidime 50-mg/kg treatment showed no change, while the tetracycline 30-mg/kg and ciprofloxacin 30-mg/kg treatments at 8 h gave 0.25-log-unit increases. The viable-cell enumeration results revealed a 0.66-log-unit cell count reduction in ceftazidime (50 mg/kg) from the 0-h infection control, the tetracycline (50 mg/kg) showed a 2.04-log-unit reduction, and the ciprofloxacin (30 mg/kg) showed a 0.30-log-unit reduction. This difference between viable-cell count and bioluminescence may again be attributed the low 0-h PC reading, underestimating the amount of bioluminescence associated with a particular viable-cell number due to tissue depth and concentration of bacterial inoculum at the site of thigh injection. Camera technologies offering enhanced sensitivity are being explored, which may allow better bioluminescent detection and collection capabilities at the 0-h time points.
The growth and bioluminescence study performed in vivo (Fig. 4) reflected high correlations between viable cells and bioluminescence. The 2-h time point within the ceftazidime treatment group however did not correlate as viable-cell counts decreased while bioluminescence increased. As mentioned previously it is conceivable that ICCD imaging at 1 h posttreatment (the 2-h time point) may detect bioluminescent bacterial cells that are inhibited by the antibiotic but not recoverable by the traditional plating methods at 16 to 24 h post-ICCD reading. However, despite the lower statistical correlation at the 2-h time point, either method could be used to ascertain therapeutic success because ceftazidime-treated animals were easily distinguished from infection control animals based on both viable-cell counts and bioluminescence levels (P < 0.0001). Thus, E. coli bioluminescence measurements were quantitative in the absence of antimicrobial therapy (i.e., infection control) and were quantitative during treatment; however, differences may be detected during therapy due to real-time assessment as compared to the standard viable-cell enumeration methods.
We have also demonstrated the benefit of tracking the same animal during therapy, as repeated-measures data produce bioluminescence curves with steady increases or decreases in PC values for the infection control and ceftazidime-treated groups, respectively (Fig. 6), as compared to separate sets of animals at each time point (Fig. 4). Repeated-measures analysis (Table 2) also illustrated that smaller differences in treatment efficacies could be detected between groups.
From our statistical data, E. coli bioluminescence was found to be both a qualitative and a quantitative measure of viable cells in vitro and in vivo. In the presence of antimicrobial agents, bioluminescence was found to be qualitative and quantitative; however, early time points do show differences from conventional plating methods. The two methods used in our studies were indicative of therapeutic efficacy both in vitro and in vivo and were able to detect dose-dependent responses in the neutropenic-mouse thigh model of infection. From our repeated-measure data with the ICCD camera, we have shown that fewer animals can be used to reliably detect smaller treatment differences during antimicrobial therapy than those detected by viable plating methods. To address the potential of this technology for applications to drug discovery, similar in vivo studies will be performed utilizing a broader range of antimicrobial agents. We also plan to extend the validation and utility of this technology to other bacterial systems, as well as to different in vivo infection models to study the effects of antimicrobial agents.
REFERENCES
- 1.Arain T M, Resconi A E, Hickey M J, Stover C K. Bioluminescence screening in vitro (Bio-Siv) assays for high-volume antimycobacterial drug discovery. Antimicrob Agents Chemother. 1996;40:1536–1541. doi: 10.1128/aac.40.6.1536. [DOI] [PMC free article] [PubMed] [Google Scholar]
- 2.Binotto J, MacLachlan R, Sanderson K E. Electrotransformation in Salmonella typhimurium LT2. Can J Microbiol. 1991;37:474–477. doi: 10.1139/m91-078. [DOI] [PubMed] [Google Scholar]
- 3.Camilli A. Noninvasive techniques for studying pathogenic bacteria in the whole animal. Trends Microbiol. 1996;4:295–296. doi: 10.1016/0966-842x(96)30022-x. [DOI] [PubMed] [Google Scholar]
- 4.Casey W M, Nguyen N A. Use of the green fluorescent protein to rapidly assess viability of E. coli in preserved solutions. J Pharm Sci Technol. 1996;50:352–355. [PubMed] [Google Scholar]
- 5.Cleeland R, Squires E. Evaluation of new antimicrobials in vitro and in experimental animal infections. In: Lorian V, editor. Antibiotics in laboratory medicine. 3rd ed. New York, N.Y: The Williams & Wilkins Co.; 1991. pp. 739–786. [Google Scholar]
- 6.Contag C H, Contag P R, Mullins J I, Spilman S D, Stevenson D K, Benaron D A. Photonic detection of bacterial pathogens in living hosts. Mol Microbiol. 1995;18:593–603. doi: 10.1111/j.1365-2958.1995.mmi_18040593.x. [DOI] [PubMed] [Google Scholar]
- 7.Contag C H, Contag P R, Spilman S D, Stevenson D K, Benaron D A. Photonic monitoring of infectious disease and gene regulation. In: Sevick-Muraca E, Benaron D, editors. Biomedical optical spectroscopy and diagnostics. Trends in optics and photonics. Vol. 9. Washington, D.C.: Optical Society of America; 1996. pp. 220–224. [Google Scholar]
- 8.Contag C H, Spilman S D, Contag P R, Oshiro M, Eames B, Dennery P, Stevenson D K, Benaron D A. Visualizing gene expression in living mammals using a bioluminescent reporter. Photochem Photobiol. 1997;66:523–531. doi: 10.1111/j.1751-1097.1997.tb03184.x. [DOI] [PubMed] [Google Scholar]
- 9.Contag P R, Olomu I N, Stevenson D K, Contag C H. Bioluminescent indicators in living mammals. Nat Med. 1998;4:245–247. doi: 10.1038/nm0298-245. [DOI] [PubMed] [Google Scholar]
- 10.Craig W A, Redington J, Ebert S C. Pharmacodynamics of amikacin in vitro and in mouse thigh and lung infections. J Antimicrob Chemother. 1991;27(Suppl.):29–40. doi: 10.1093/jac/27.suppl_c.29. [DOI] [PubMed] [Google Scholar]
- 11.Frackman S, Anhalt M, Nealson K H. Cloning, organization, and expression of the bioluminescence genes of Xenorhabdus luminescens. J Bacteriol. 1990;172:5767–5773. doi: 10.1128/jb.172.10.5767-5773.1990. [DOI] [PMC free article] [PubMed] [Google Scholar]
- 12.Jacobs W R, Jr, Barletta R G, Udani R, Chan J, Kalkut G, Sosne G, Kieser T, Sarkis G J, Hatfull G F, Bloom B R. Rapid assessment of drug susceptibilities of Mycobacterium tuberculosis by means of luciferase reporter phages. Science. 1993;260:819–822. doi: 10.1126/science.8484123. [DOI] [PubMed] [Google Scholar]
- 13.Leggett J E, Fantin B, Ebert S, Totsuka K, Vogelman B, Calame W, Mattie H, Craig W A. Comparative antibiotic dose-effect relations at several dosing intervals in murine pneumonitis and thigh-infection models. J Infect Dis. 1988;159:281–292. doi: 10.1093/infdis/159.2.281. [DOI] [PubMed] [Google Scholar]
- 14.Loimaranta V, Tenovuo J, Koivisto L, Karp M. Generation of bioluminescent Streptococcus mutans and its usage in rapid analysis of the efficacy of antimicrobial compounds. Antimicrob Agents Chemother. 1998;42:1906–1910. doi: 10.1128/aac.42.8.1906. [DOI] [PMC free article] [PubMed] [Google Scholar]
- 15.Meighen E A. Enzymes and genes from the lux operons of bioluminescent bacteria. Annu Rev Microbiol. 1988;42:151–176. [Google Scholar]
- 16.Meighen E A. Bacterial bioluminescence: organization, regulation, and application of the lux genes. FASEB J. 1993;7:1016–1022. doi: 10.1096/fasebj.7.11.8370470. [DOI] [PubMed] [Google Scholar]
- 17.Meighen E A. Genetics of bacterial bioluminescence. Annu Rev Genet. 1994;28:117–139. doi: 10.1146/annurev.ge.28.120194.001001. [DOI] [PubMed] [Google Scholar]
- 18.Meighen E A, Dunlap P. Physiological, biochemical, and genetic control of bacterial bioluminescence. Adv Microb Physiol. 1993;34:1–67. doi: 10.1016/s0065-2911(08)60027-2. [DOI] [PubMed] [Google Scholar]
- 19.National Committee for Clinical Laboratory Standards. Methods for dilution antimicrobial susceptibility tests for bacteria that grow aerobically. Approved standard M7–A4. Wayne, Pa: National Committee for Clinical Laboratory Standards; 1997. [Google Scholar]
- 20.Siragusa G R, Nawotka K, Spilman S D, Contag P R, Contag C H. Real-time monitoring of Escherichia coli O157:H7 adherence to beef carcass surface tissues with a bioluminescent reporter. Appl Environ Microbiol. 1999;65:1738–1745. doi: 10.1128/aem.65.4.1738-1745.1999. [DOI] [PMC free article] [PubMed] [Google Scholar]
- 21.Szittner R, Meighen E. Nucleotide sequence, expression, and properties of luciferase coded by lux genes from a terrestrial bacterium. J Biol Chem. 1990;265:16581–16587. [PubMed] [Google Scholar]
- 22.Trautmann M, Zick R, Rukavina T, Cross A S, Marre R. Antibiotic-induced release of endotoxin: in-vitro comparison of meropenem and other antibiotics. J Antimicrob Chemother. 1998;41:163–169. doi: 10.1093/jac/41.2.163. [DOI] [PubMed] [Google Scholar]
- 23.Ulitzur S, Kuhn J. Introduction of lux genes into bacteria, a new approach for specific determination of bacteria and their antibiotic susceptibility. In: Scholmerich J, et al., editors. Bioluminescence: new perspectives. New York, N.Y: John Wiley & Sons; 1986. pp. 463–472. [Google Scholar]
- 24.van Langevelde P, Kwappenberg K M C, Groeneveld P H P, Mattie H, van Dissel J T. Antibiotic-induced lipopolysaccharide (LPS) release from Salmonella typhi: delay between killing by ceftazidime and imipenem and release of LPS. Antimicrob Agents Chemother. 1998;42:739–743. doi: 10.1128/aac.42.4.739. [DOI] [PMC free article] [PubMed] [Google Scholar]
- 25.Vranes J, Zagar Z, Kurbel S. Influence of subinhibitory concentrations of ceftazidime, ciprofloxacin and azithromycin on the morphology and adherence of P-fimbriated Escherichia coli. J Chemother. 1996;8:254–260. doi: 10.1179/joc.1996.8.4.254. [DOI] [PubMed] [Google Scholar]
- 26.Wick W E, Preston D A, White W A, Gordee R S. Compound 64716, a new synthetic antibacterial agent. Antimicrob Agents Chemother. 1973;4:415–420. doi: 10.1128/aac.4.4.415. [DOI] [PMC free article] [PubMed] [Google Scholar]
- 27.Xi L, Cho K-W, Tu S-C. Cloning and nucleotide sequences of lux genes and characterization of luciferase of Xenorhabdus luminescens from a human wound. J Bacteriol. 1991;173:1399–1405. doi: 10.1128/jb.173.4.1399-1405.1991. [DOI] [PMC free article] [PubMed] [Google Scholar]


