

Abstract
Biologists have long been fascinated by the processes that give rise to phenotypic complexity of organisms, yet whether there exist geographical hotspots of phenotypic complexity remains poorly explored. Phenotypic complexity can be readily observed in ant colonies, which are superorganisms with morphologically differentiated queen and worker castes analogous to the germline and soma of multicellular organisms. Several ant species have evolved ‘worker polymorphism', where workers in a single colony show quantifiable differences in size and head-to-body scaling. Here, we use 256 754 occurrence points from 8990 ant species to investigate the geography of worker polymorphism. We show that arid regions of the world are the hotspots of superorganism complexity. Tropical savannahs and deserts, which are typically species-poor relative to tropical or even temperate forests, harbour the highest densities of polymorphic ants. We discuss the possible adaptive advantages that worker polymorphism provides in arid environments. Our work may provide a window into the environmental conditions that promote the emergence of highly complex phenotypes.
Keywords: Formicidae, ant castes, organismic complexity, social evolution, social organization
1. Introduction
Phenotypic complexity has been studied in relation to ecology and evolution of lineages, but the modern-day geographical distribution of such complexity remains enigmatic [1]. Identifying such geographical hotspots of phenotypic complexity may help provide a window into the environmental conditions that promote phenotypic innovation. However, if asked which part of the world comprises an overabundance of extant and highly complex organisms, one would probably not know the answer.
The concept of phenotypic complexity can be defined in a number of ways and described at various levels of organizations: from genes, cells, individuals to societies [2]. McShea [2], for example, defines complexity as the number of different part types at a given hierarchical level. Within a multicellular organism, phenotypic complexity is most often quantified as the number of cell types [3]. A eusocial insect colony, such as that of ants, bees, wasps and termites, is thought to be analogous to a superorganism with a reproductive queen caste functioning as its germline and non-reproductive worker caste functioning as its soma [4–7]. In solitary multicellular organisms, a single genome can produce differentiated cell types in response to cues from its internal environment, like morphogen gradients. Similarly, in superorganisms, a single genome can also produce morphologically differentiated castes within a single colony in response to external, such as nutrition, and internal, such as hormonal, cues [8–11]. Therefore, eusocial insects offer a unique opportunity to study the geography and environmental drivers of superorgansim complexity.
In addition to the morphologically distinct reproductive queen caste and a non-reproductive worker caste, some species of ants display remarkable variations in the worker caste [12]. Worker ants of the same colony can differ dramatically in their size and head-to-body scaling (see figure 1; electronic supplementary material, figure S1). This interindividual variation within a colony is called ‘worker polymorphism' and is associated with enhanced division of labour [8]. In some cases, polymorphic ant species exhibit wide variation in body size with little variation in head to body scaling [13]. Such species are considered more morphologically complex than species with limited worker body size variation (i.e. monomorphic worker castes) but less complex than species with discrete morphological castes, which vary tremendously in both size and head-to-body scaling (reviewed in [5]). Therefore, superorganisms fall along a continuum of phenotypic complexity that is governed by multiple-levels of selection, from individual to colony-level selection [7,9,14]. Furthermore, previous work has identified a suite of traits that generally correlate with the morphological complexity of superorganisms, including colony size, reproductive division of labour, queen–worker dimorphism and worker polymorphism [8,12,14–18]. The degree of morphological differentiation within the worker caste of a single colony can thus be used as one proxy for the complexity of superorganisms across ants [8,19] (figure 1).
Figure 1.
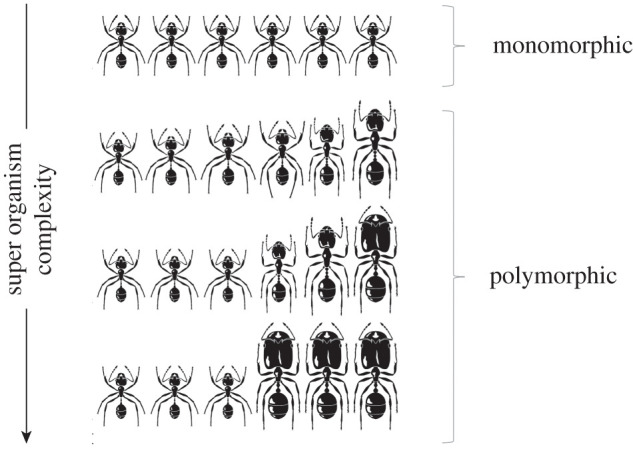
Morphologically simple versus morphologically complex superorganisms. Worker polymorphism is a correlate of superorganism complexity, where a monomorphic worker caste is considered to represent a morphologically simple superorganism, whereas polymorphic worker caste is considered to represent a morphologically complex superorganism. A monomorphic worker caste is defined by limited size and head-to-body scaling variation. A polymorphic worker caste is defined by significant variation in size and/or head-to-body scaling. For a complete detailed description of worker caste polymorphism classification, see electronic supplementary material, figure S1. Adapted from Hölldobler & Wilson [9].
Worker polymorphism evolved at least eight times within ants [13] and was previously estimated to occur in 13% of the approximately 330 ant genera [20]. As an example, several of the genera wherein worker polymorphism evolved, such as the leaf-cutting ants (i.e. Atta), carpenter ants (i.e. Camponotus), army ants (i.e. Eciton), fire ants (i.e. Solenopsis) and big-headed ants (e.g. Pheidole), comprise species with larger colony sizes (thousands to millions of ants within a colony), dramatic morphological differences between workers in the colony and enhanced division of labour [5]. Many of these same species have strong effects on the structure of food webs and ecosystems as dominant predators, herbivores and ecosystem engineers [21]. In addition, morphologically diverse ant species have often been argued to have enhanced cooperation and division of labour and a higher propensity for ecological and evolutionary dominance [12,13,22–24]. For these reasons, the ecology, evolution and development of worker polymorphism in ants have been extensively studied in a select set of species and in a few regions of the world [11,13,23,25]. Yet, it remains unclear where in the world one is more likely to encounter a polymorphic ant colony, and whether abiotic conditions are associated with such superorganism complexity. Some have suggested that polymorphism might be more common in tropical regions [26], but this hypothesis is largely anecdotal. To our knowledge, no other hypotheses predicting how worker polymorphism is geographically distributed have been proposed.
Owing to the current lack of process-based hypotheses, we aim to generate the first global map of the geography of worker polymorphism and assess the influence of the abiotic environment on this pattern. Specifically, we investigate the drivers of the global geography of ant worker polymorphism (superorganism complexity) using a dataset including 8990 ant species and 256 754 spatial occurrences. We first identify global hotspots of superorganisms complexity defined as climatic zones where the probability of encountering a worker polymorphic ant colony is greatest relative to the total number of ant colonies and ant species recorded in the region. To do this, we model each occurrence data point as representing an ant colony that is either polymorphic or monomorphic. Then, we compare model fit in a series of linear models relating the presence/absence of polymorphism in an ant colony to ambient climatic conditions. In addition, because the probability of encountering a polymorphic ant colony is highest where the total number of ant colonies (sampling effort) and species (species richness (SR)) is highest by chance alone, we ran a series of models aimed at evaluating the influence of these covariates on model selection. We present our results and focus the discussion on models that account for differences in sampling effort and SR, which helps us identify climatic zones that are dominated by complex superorganisms.
2. Methods
(a) . Identifying polymorphism
We reviewed the literature and classified 15 518 species of ants as either ‘polymorphic’ according to a broad definition of worker polymorphism or as ‘monomorphic' (electronic supplementary material, tables S1 and S2). Species lacking significant size or allometric variation in the worker caste were classified as monomorphic, whereas all others were classified as polymorphic (see electronic supplementary material, figure S1 for more details). To classify ant species as polymorphic or monomorphic, we first systematically searched AntWiki [27] and AntWeb [28], two open-access repositories curated by myrmecologists that collate information and list studies on each ant species, for relevant literature. These databases were chosen because resources are easily accessible and the taxonomic upkeep of the species pages is consistent [27,28]. Using the primary literature cited on these pages, we searched for explicit mention of the terms monomorphic, polymorphic or any of the categories of polymorphism defined by Wilson [13]. When multiple sources were available for a given species, we used the most recent article.
Species were considered to be polymorphic if the primary literature reported any type of interindividual variation in size and head-to-body allometry, from monophasic allometry (continuous morphological variation) to di- or even trimorphic allometry (discrete morphological variation; see electronic supplementary material, figure S1 for more details). If species-specific references were not found in AntWiki or AntWeb, we used the scientific name of the species in Google Scholar to find up-to-date sources. When there was no published information on polymorphism for a given species, we assigned the same category of polymorphism to all species within a genus based on Bolton's [29] classification. A similar approach was used in a recent study [20]. If peer-reviewed genus-specific references were available [30–34], their classification was favoured over that of Bolton [29]. Species-specific information on polymorphism was available for 20% of the species used in our analyses (1826/8990). When only considering polymorphic species, 68% of the species included in the analyses (1636/2408) were classified with species-level information.
Classification of ant species as either monomorphic or monophasic is most challenging and could possibly bias our result. Some monophasic species are considered polymorphic by some and monomorphic by others [25]. However, monophasic species represent less than 1% of all species in our data and therefore unlikely to affect our results. In the current study, we classified monophasic species as polymorphic.
(b) . Compiling occurrence data
We used the species occurrence data from the Global Ant Biodiversity Informatics database [35]. This occurrence database is a synthesis of data from published literature (approx. 10 000 publications), as well as from online, open-source databases, museum records (including 87 online open-source databases, such as AntWeb) and personal collection databases. The taxonomy of legacy records is placed in a common framework and continuously updated with new data. It also includes records extracted from 87 online, open-source databases, such as AntWeb, as well as museum records. Species name validity is being checked for each record and follows the Bolton Catalogue available from AntCat.org. Species identification errors are corrected on the basis of taxonomic revisions and biodiversity literature (e.g. species checklist), contact with experts and direct decisions based on biogeographic knowledge. We extracted all spatially validated occurrence points from the database (accessed in May 2018) and after excluding occurrence data from oceanic islands, we retained 256 754 points matching 8990 ant species for our analyses.
Sampling effort (i.e. the number of occurrences in a grid cell) has an influence on estimates of SR (i.e. the number of species detected in a grid cell) and therefore on the probability of detecting a polymorphic ant colony (see electronic supplementary material, figure S2 for maps of sampling effort and SR). To avoid the bias produced from differences in sampling intensity and SR among different regions of the world, we divided the world into grid cells and use grid cell (SiteID) and SR as covariates in some of our models. Specifically, we divided the world into 1° latitude × 1° longitude grid cells, and all occurrence points falling within a given grid cell were attributed that grid cell ID. Note that including grid cell as a random effect also accounts for the non-independence of spatially aggregated data points. Similarly, the number of species detected in a grid cell were used as estimated of SR.
(c) . Modelling the occurrence of worker polymorphism along climatic gradients
To assess how the probability of encountering a polymorphic ant species varies along global climatic gradients, we constructed a series of models that related temperature and precipitation to the presence/absence of polymorphism in an ant colony. Here, we assumed that each occurrence data point was associated with a given ant colony, since at least one worker ant from at least one colony was found at that location. Mean annual temperature and mean annual precipitation for each occurrence data point were extracted from WorldClim v1.0 [36] using the raster package in R [37]. We assessed the influence of temperature and precipitation jointly and separately on the occurrence of polymorphism by performing a series of generalized linear mixed models (hereafter referred to as GLMMs) assuming a binomial distribution. The binary response variable for our GLMMs was the point occurrence of polymorphism, coded as ‘1', or absence of polymorphism, coded as ‘0', in our database. In other words, we assigned to each of the 256 754 ant occurrence points either a ‘1’ or a ‘0’, depending on whether they represented a polymorphic ant colony or not. We then examined a distinct set of models consisting of various combinations of temperature (linear and quadratic) and precipitation (linear and quadratic), as well as a null model. The full configuration of our GLMMs is described in electronic supplementary material, table S3.
(d) . Sensitivity analyses
Among grid cell differences in sampling effort and SR could bias the results of our analyses. Indeed, both the number of occurrence data points or colonies (i.e. sampling effort) and the total number of monomorphic and polymorphic species (i.e. SR) vary among grid cells (electronic supplementary material, figure S2). To assess the influence of SR on model selection, regardless of sampling effort, we ran a second set of analyses wherein the grid cell's SR (polymorphic + monomorphic species) was modelled as a fixed effect. To assess the simultaneous influence of sampling effort and SR on model selection, we ran a third set of analyses wherein a latent variable (i.e. SiteID) was modelled as a random effect. We also assessed the influence of using an equal area projection on our model selection. GLMMs were run using the lme4 package in R [38].
(e) . Taxon-specific analyses
To assess whether our best models were consistent among taxonomic groups, we tested them separately on each ant subfamilies. Specifically, we took the three best models from this first all-taxa analysis and ran them separately on each ant subfamily subsets of our global dataset. Note that nine subfamilies were excluded from taxon-specific analyses due to data insufficiency, which hampered model convergence. Data insufficiency prevented taxon-specific analyses at the level of ant genera because models failed to converge in a majority of genera. We selected best fit models based on the Akaike Information Criterion (hereafter referred to as AIC), choosing the model with the lowest AIC as the best model [39,40]. For a model to be selected and be considered a significantly better model, it needed to be at least 2 units lower than the second lowest AIC [39]. All statistical analyses were carried out using the R statistical software (R Core Team, version 3.5.0).
To ensure that explanatory variables were not collinear, a variance inflation factor between temperature and precipitation was calculated. To do this, we used the usdm package in R and found that the variance inflation factor was 1.48 indicating little collinearity; thus, both variables could be included in our models [41]. We also verified whether they were over-dispersed as this could lead to inaccurate estimation of relationships between variables. We found that overdispersion in these models was less than 1, indicating very little over dispersion and proceeded with the model selection procedure.
(f) . Phylogenetic analyses
One way to account for phylogenetic effects in our analyses would be to perform a phylogenetic correction at the species level [42]. However, the only comprehensive, time-calibrated, molecular phylogenies currently available for ants are at the genus level, whereas a complete species-level phylogeny that includes species we analyze in this study is not available. We therefore assessed the degree of phylogenetic signal in worker polymorphism at the genus level using the Abouheif test [43] from the adephylo package [44] with a genus-level molecular phylogeny of ants [20]. A genus was considered polymorphic if it was comprised of more than 50% polymorphic species [20].
3. Results
Our data show that worker polymorphism occurs in approximately 29% of all ant species, which is a much larger number of worker polymorphic ant lineages than previously thought (electronic supplementary material, tables S1 and S2) [10,20,29]. Specifically, 4732 of the 15 518 species in our database are polymorphic (i.e. ranging from monophasic to trimorphic allometry; electronic supplementary material, table S1 and figure S1), which is double the previous estimate of 13% [20,29]. Using a threshold of greater than 50% of species within the genus being polymorphic, we found that 85 (25%) of the 337 ant genera are polymorphic (electronic supplementary material, table S2). Taken together, our results indicate that many lineages possess the developmental capacity to generate substantial variation in size and/or head-to-body scaling between individuals within a single colony [20,45,46].
To estimate the probability of worker polymorphism, we assessed the relationship between the probability of polymorphism and climate. We discovered that the probability of polymorphism is highest in arid regions of the world (figure 2). Specifically, the model with the lowest AIC was one including a positive linear term for temperature, a negative linear term for precipitation and a quadratic term for precipitation (tables 1 and 2; electronic supplementary material, table S4). The probability of encountering a polymorphic species is therefore highest in the warmest regions and very dry regions of the world (electronic supplementary material, figures S3 and S5). We also conducted sensitivity analyses to assess the influence of (i) sampling effort (SiteID as random effect) and (ii) SR (as fixed effect) on model selection (electronic supplementary material, tables S4 and S5) and (iii) the influence of using an equal area grid cell projection on our model selection (electronic supplementary material, table S6). Our results were robust to all sensitivity analyses. Finally, as a post hoc analysis, we used the model with the random effect to predict the probability of polymorphism among climatic zones (i.e. biomes) of the world (figure 3). Using this model, the probability of encountering a polymorphic ant colony is highest in arid regions around the world including deserts and tropical savannahs (figure 3).
Figure 2.

Global map showing geographical variation in the probability of encountering a polymorphic ant colony. Dark red grid cells indicate areas where the probability of encountering a polymorphic ant colony is high, whereas light yellow grid cells indicate areas where such probability is low. (Online version in colour.)
Table 1.
Results of model selection for the generalized linear mixed models for probability of encountering a polymorphic species at the global scale. Models are sorted from best fit (lowest AIC) to worst fit (highest AIC). The best fit model is indicated in bold. SiteID was modelled as a random effect.
| variables | AIC | ΔAIC | AIC |
|---|---|---|---|
| precipitation2 + precipitation + temperature | 295 509.5 | 0.00 | 0.99 |
| precipitation + temperature | 295 520.9 | 11.36 | 0.00 |
| precipitation × temperature | 295 522.3 | 12.79 | 0.00 |
| temperature2 + temperature | 295 765.3 | 255.81 | 0.00 |
| temperature | 295 804.7 | 295.23 | 0.00 |
| precipitation2 + precipitation | 295 921.0 | 411.54 | 0.00 |
| precipitation | 295 932.2 | 422.65 | 0.00 |
| 1 | 296 040.5 | 530.96 | 0.00 |
Table 2.
Parameter estimates for the two best models selected based on AIC comparisons. The random effect was site ID.
| predictors | precipitation2 + precipitation + temperature |
precipitation × temperature |
||||||
|---|---|---|---|---|---|---|---|---|
| estimate | odds ratios | CI | p | estimate | odds ratios | CI | p | |
| (intercept) | −1.76 | 0.17 | 0.15–0.19 | <0.001 | −1.79 | 0.17 | 0.15–0.18 | <0.001 |
| precipitation | −3.16 | 0.04 | 0.03–0.05 | <0.001 | −2.63 | 0.07 | 0.06–0.09 | <0.001 |
| precipitation2 | 2.19 | 9.00 | 6.59–12.29 | <0.001 | ||||
| temperature | 1.70 | 5.53 | 4.78–6.38 | <0.001 | 1.63 | 5.15 | 4.45–5.96 | <0.001 |
| temperature × precipitation | 0.67 | 1.96 | 1.50–2.57 | <0.001 | ||||
| σ2 | 3.29 | 3.29 | ||||||
| τ00 | 0.47 | 0.48 | ||||||
| Intra Class Correlation | 0.13 | 0.13 | ||||||
| n | 4349 | 4349 | ||||||
| observations | 256 754 | 256 754 | ||||||
| marginal R2/conditional R2 | 0.017/0.140 | 0.018/0.143 | ||||||
Figure 3.

Variation in the probability of encountering a polymorphic ant colony among the world's biomes and along climatic gradients. Predicted values were obtained from a model accounting for variation in the number of ant colonies (sampling effort) recorded in a grid cell. (a) Global map of the world's biomes, where each colour represents a different biome (numbered 1–13), and each black dot is an occurrence data point (include polymorphic and non-polymorphic occurrences). (b) Average predicted polymorphism per biome, and (c) predicted occurrence of highest level of polymorphism along global temperature and precipitation gradients. (Online version in colour.)
Finally, we assessed the potential influence of evolutionary history on the global distribution of polymorphism. We first compared model fit separately for each subfamily. We found that seven of the eight subfamilies show that polymorphism is positively related with temperature, while for five of the eight subfamilies, it is negatively related with precipitation (table 3; electronic supplementary material, table S7). Furthermore, we quantified phylogenetic signal across 306 ant genera and found that closely related genera are no more likely to be polymorphic than distantly related ones (electronic supplementary material, table S8). This is consistent with the fact that polymorphism evolved several times independently in specific genera. Together, these analyses show that the global distribution of polymorphism is not a consequence of differences in the evolutionary history of subfamilies and genera. However, there may be an effect of the evolutionary history of species within genera. A large majority of polymorphic species are in the hyper-diverse genera Camponotus and Pheidole. However, these genera are present and diverse in almost all biomes of the world (electronic supplementary material, figure S6), suggesting that the distributions of these genera do not have a disproportionate influence on the global geography of polymorphism. The genus Cephalotes appears to be the third most diverse polymorphic genera in tropical dry forests and savannahs, while the genera Myrmecosystus, Messor and Cataglyphis comprise a large proportion of polymorphic species in deserts and scrublands. Therefore, these genera, which evolved worker polymorphism independently, contribute substantially to the peak in polymorphism in arid regions.
Table 3.
Results of model selection for the generalized linear mixed models for the global distribution of worker caste polymorphism by subfamily of ants. All models included site ID as a random effect. The bolded AICs represent the lowest AIC (i.e. best model) for the global distribution of worker polymorphism. Subfamilies with insufficient data for model convergence are excluded.
| subfamily | precipitation + temperature | precipitation2 + precipitation + temperature | precipitation × temperature | temperature |
|---|---|---|---|---|
| Amblyoponinae | 2352.91 | 2355.19 | 2378.73 | 2352.91 |
| Dolichoderinae | 25 860.42 | 25 802.62 | 25 798.94 | 25 939.77 |
| Dorylinae | 3725.25 | 3726.68 | 3721.56 | 3723.59 |
| Formicinae | 71 456.18 | 71 428.20 | 71 449.56 | 71 887.28 |
| Myrmeciinae | 1441.20 | 1433.01 | 1443.20 | 1450.77 |
| Myrmicinae | 134 471.40 | 134 464.23 | 134 470.79 | 134 473.86 |
| Ponerinae | 2896.62 | 2898.62 | 2887.76 | 2925.04 |
| Pseudomyrmecinae | 300.85 | 301.80 | 302.86 | 305.91 |
4. Discussion
Our results show that complex superorganisms are overrepresented in the warmest and most arid regions of the world, which typically harbour fewer ant species [47,48]. Specifically, the probability of encountering worker polymorphic colonies peak in tropical dry forests, savannahs and deserts. Although the processes underpinning the formation and maintenance of these organismic complexity hotspots remain enigmatic [8,9,11,23,49], this first outlook into the geography of ant worker polymorphism provides novel insights that will guide future research.
Arid systems emerge as hotspots of complex superorganisms (figures 2 and 3). These results show that worker polymorphic ant colonies are most common in warm and dry regions of the world. There are several hypotheses that may explain why polymorphic ants dominate arid systems. One possibility is that worker polymorphism in arid regions is not adaptive, but rather a consequence of evolutionary and biogeographic history. In this scenario, the current geographical distribution of worker polymorphism in particular lineages reflects that of their ancestors. However, our assessment of historical effects on the over-representation of worker polymorphism in arid environments suggests that these effects are negligeable. Furthermore, some of the most diversified and polymorphic ant genera in arid systems (e.g. Camponotus, Pheidole, Cephalotes, Cataglyphis, Messor) are not closely related and evolved independently, perhaps through convergent evolution mediated by strong selection pressure in these stressful environments [20,23]. It is likely that worker polymorphism enables persistence in extremely hot and resource-scarce environments. This is not to say that worker polymorphism originated in such environments but that it provides fitness advantages or permit survival in such environments.
The over-representation of polymorphic ants in arid regions of the world thus implies that phenotypic complexity enables persistence in these stressful environments. First, there might be size-related differences in the diet of ant workers within a colony. Arid ecosystems are numerically dominated by ants that specialize in the harvesting of seeds. Such diet specialization may only be possible, or optimized, if colonies can exploit a wide array of seed size and shapes [50]. Large workers of several seed harvester ants, for example, are known to specialize on larger food items than do smaller ants within the colony [51]. Added to the fact that deserts and savannahs are resource-limited and unpredictable, polymorphism might allow more efficient exploitation of specific and limited seed resources [52]. Second, there might be size-related differences in the thermal and drought tolerance of workers within ant colonies [53]. A few studies have shown that such differences exist, where larger workers within the colony forage at midday when temperature is at its peak and smaller worker forage when temperature cools down [54]. Moreover, in at least two species belonging to two different genera (i.e. Cataglyphis and Messor), size-related differences in the foraging schedule of workers correspond with higher tolerance to extreme temperature and to desiccation [54,55]. In sum, evidence for the hypothesis that worker polymorphism promotes persistence in arid environment is generally sparse and anectodical for the moment being, but our results provide additional incentive to test its generality.
Our findings further suggest that more generally, warm temperature is a key factor influencing the occurrence of complex superorganisms across the globe. One hypothesis to explain this trend is that warm temperatures promote worker polymorphism by shaping the biotic environment outside the colony. Many claim that biotic interactions are more intense in warm climates [56], which might favour the polymorphic phenotype, and in particular large workers involved in colony defence, through selection and social regulation [57,58]. Consistent with this hypothesis, ecological specialization, driven by intense resource competition, explains the evolution of polymorphism within at least two polymorphic genera [52,59,60]. Another hypothesis is that ecological factors such as diet and nutrition, which maybe more rich and abundant in warm regions, can also interact with developmental pathways and lead to the evolution of a greater diversity of phenotypes within the worker caste of an ant colony [17,61]. Worker polymorphism is a social trait mediating resource exploitation, resource monopolization and colony defence, both directly and indirectly affecting energy acquisition by a colony. In tropical environments, for example, resources are abundant, but competition is intense, which calls for efficient exploitation strategy including diet specialization and resource defence, both of which might relate to worker morphological complexity [56,62,63]. Polymorphism may have evolved to better defend space or more efficiently acquire resources [59,64].
We hope our findings will facilitate our understanding of the relative contributions of developmental processes, social behaviour and the ecological environment in shaping spatial variation in the expression of phenotypic complexity, which will be the key to elucidating the geography of organismic and super-organismic complexity [17,45,46,52,59,60,64–68]. Looking forward, we need to develop standardized and repeatable quantitative approaches to compare the degree of phenotypic complexity within and across species, which would allow stronger comparative studies in macroecology and macroevolution. As a first step, worker polymorphism can be quantified by relating head width (y-axis) to body length (x-axis) for individual workers within a single colony [45]. Rigorous tests of hypotheses regarding the distribution and evolution of phenotypic complexity could then be tested on solitary multicellular organisms as well as on superorganisms. Complexity can be defined and quantified across hierarchical levels of complexity, from genomic to cellular to phenotypic complexity. To accomplish this in eusocial insects, we also need to create comprehensive databases for other traits associated with superorganism complexity, namely colony size, reproductive division of labour and the number and degree of partitioning of behaviorial tasks [5,18]. Finally, whereas we investigated the two main axes of climatic variation on Earth (i.e. temperature and precipitation), which are typically used to define climatic zones, future work could investigate the influence of seasonality or climatic predictability, which could also play a role in the geographical distribution of polymorphism. The present study nevertheless represents an important first step in furthering our understanding of what facilitates and what restricts the global distribution of phenotypic complexity.
Finally, warm, and in particular arid, regions of the world harbour the greatest density of complex superorganism, which has intriguing implications in the context of climate change. Ongoing climate change leads to the aridification of many of the world's ecosystems, increasing the frequency and intensity of fires and drought events, which threatens biological diversity [69–72]. On the other hand, our findings suggest that ecosystem aridifications favour the survival of highly complex superorganisms, which often play crucial roles in decomposition and nutrient cycling, among other things [73]. The plasticity conferred to polymorphic species could also help them cope with changing abiotic and biotic conditions amid global changes. Moreover, if arid systems are hotspots of phenotypic complexity and potentially epicentres of morphological evolution and innovation in eusocial insects, then the biodiversity climate crisis may either promote further phenotypic innovation if they can adapt or drive our most complex superorganisms to extinction if they cannot. A look at the biodiversity crisis through the lenses of phenotypic complexity, a neglected dimension of biological diversity, could help identify and protect some of the world's hidden evolutionary centres.
Supplementary Material
Acknowledgements
We thank Mathieu Molet, the associate editor as well as anonymous reviewers for providing constructive feedback on the manuscript, and Pedro Peres-Neto, Lilian Sales and Michael Borregaard for advising on analytical approaches.
Contributor Information
Ehab Abouheif, Email: ehab.abouheif@mcgill.ca.
Jean-Philippe Lessard, Email: jp.lessard@concordia.ca.
Data accessibility
Data on ant species occurrence and polymorphism classification are available from the Dryad Digital Repository: https://datadryad.org/stash/share/2WYof3lmWteaWz05918NCp8ZtgUEeXYScxUTuJiSZI4 [75].
Authors' contributions
F.L.R.: conceptualization, data curation, formal analysis, methodology, writing—original draft; G.M.: formal analysis, methodology, visualization, writing—review and editing; B.G.: data curation, writing—review and editing; R.R.D.: funding acquisition, writing—review and editing; E.E.: funding acquisition, writing—review and editing; S.P.: data curation, writing—review and editing; N.J.S.: funding acquisition, writing—review and editing; M.D.W.: data curation, writing—review and editing; E.A.: conceptualization, data curation, funding acquisition, investigation, methodology, supervision, writing—original draft, writing—review and editing; J.-P.L.: conceptualization, data curation, funding acquisition, investigation, methodology, supervision, writing—original draft, writing—review and editing.
All authors gave final approval for publication and agreed to be held accountable for the work performed therein.
Competing interests
We declare we have no competing interests.
Funding
This research was supported by an NSERC Discovery Grant (RGPIN-2015-06081) and an FRQNT New Researcher Grant (2016-NC-189273) to J.-P.L., an NSERC Discovery Grant (RGPIN-2020-05175) to E.A. M.D.W. was supported by NSF (MSB-FRA no 1702426). G.M. was supported by a Concordia Graduate Fellowship and Concordia Excellence Award. E.E. was supported by subsidy funding to OIST and a grants from the Japan Ministry of the Environment (4-1904) and Japan Society for the Promotion of Science KAKENHI (JP17K15180). The Quebec Centre for Biodiversity Science supported the research and training of F.L.R. and G.M.
References
- 1.Carroll SB. 2001. Chance and necessity: the evolution of morphological complexity and diversity. Nature 409, 1102-1109. ( 10.1038/35059227) [DOI] [PubMed] [Google Scholar]
- 2.McShea DW. 2017. Evolution of complexity. In Evolutionary developmental biology (ed. Nuño L). Cham, Switzerland: Springer. [Google Scholar]
- 3.Fisher RM, Shik JZ, Boomsma JJ. 2020. The evolution of multicellular complexity: the role of relatedness and environmental constraints. Proc. R. Soc. B 287, 20192963. ( 10.1098/rspb.2019.2963) [DOI] [PMC free article] [PubMed] [Google Scholar]
- 4.Bonner JT. 1993. Dividing the labour in cells and societies. Curr. Sci. 64, 459-466. [Google Scholar]
- 5.Anderson C, Mcshea DW. 2001. Individual versus social complexity, with particular reference to ant colonies. Biol. Rev. 76, 211-237. ( 10.1017/S1464793101005656) [DOI] [PubMed] [Google Scholar]
- 6.Lüscher M. 1953. The termite and the cell. Sci. Am. 188, 74-80. ( 10.1038/scientificamerican0553-74) [DOI] [Google Scholar]
- 7.Boomsma JJ, Gawne R. 2018. Superorganismality and caste differentiation as points of no return: how the major evolutionary transitions were lost in translation. Biol. Rev. 93, 28-54. ( 10.1111/brv.12330) [DOI] [PubMed] [Google Scholar]
- 8.Oster GF, Wilson EO. 1978. Caste and ecology in the social insects (monographs in population biology 12). Princeton, NJ: Princeton University Press. [PubMed] [Google Scholar]
- 9.Hölldobler B, Wilson EO. 2008. The superorganism: the beauty, elegance and strangeness of insect societies. New York, NY: W. W. Norton & Company. [Google Scholar]
- 10.Wills BD, Moreau CS, Wray BD, Hoffmann BD, Suarez AV. 2014. Body size variation and caste ratios in geographically distinct populations of the invasive big-headed ant, Pheidole megacephala (Hymenoptera: Formicidae). Biol. J. Linnean Soc. 113, 423-438. ( 10.1111/bij.12386) [DOI] [Google Scholar]
- 11.Lillico-Ouachour A, Abouheif E. 2017. Regulation, development, and evolution of caste ratios in the hyperdiverse ant genus Pheidole. Curr. Opi. Insect Sci. 19, 43-51. ( 10.1016/j.cois.2016.11.003) [DOI] [PubMed] [Google Scholar]
- 12.Hölldobler B, Wilson EO. 1990. The ants. Berlin, Germany: Springer. [Google Scholar]
- 13.Wilson EO. 1953. The origin and evolution of polymorphism in ants. Q. Rev. Biol. 28, 136-156. ( 10.1086/399512) [DOI] [PubMed] [Google Scholar]
- 14.Bourke. 1999. Colony size, social complexity and reproductive conflict in social insects. J. Evol. Biol. 12, 245-257. ( 10.1046/j.1420-9101.1999.00028.x) [DOI] [Google Scholar]
- 15.Michener CD. 1974. The social behavior of the bees. Cambridge, MA: Harvard University Press. [Google Scholar]
- 16.Peters C. 1997. Morphologically ‘primitive’ ants: comparative review of social characters and the importance of queen-worker dimorphism. In The evolution of social behavior in insects and arachnids (eds Choe JC, Crespi BJ), pp. 372-391. Cambridge, MA: Cambridge University Press. [Google Scholar]
- 17.Wheeler DE. 1986. Developmental and physiological determinants of caste in social hymenoptera: evolutionary implications. Am. Nat. 128, 13-34. ( 10.1086/284536) [DOI] [Google Scholar]
- 18.Lecocq de Pletincx N, Dellicour S, Aron S. 2021. The evolution of ant worker polymorphism correlates with multiple social traits. Behav. Ecol. Sociobiol. 75, 113. ( 10.1007/s00265-021-03049-6) [DOI] [Google Scholar]
- 19.Brian MV. 1979. Caste differentiation and division of labor. In Social insects (ed. Hermann H), pp. 121-221. New York, NY: Elsevier. [Google Scholar]
- 20.Blanchard BD, Moreau CS. 2017. Defensive traits exhibit an evolutionary trade-off and drive diversification in ants. Evolution 71, 315-328. ( 10.1111/evo.13117) [DOI] [PubMed] [Google Scholar]
- 21.Del Toro I, Silva RR, Ellison AM. 2015. Predicted impacts of climatic change on ant functional diversity and distributions in eastern North American forests. Divers. Distrib. 21, 781-791. ( 10.1111/ddi.12331) [DOI] [Google Scholar]
- 22.Bar-On YM, Phillips R, Milo R. 2018. The biomass distribution on earth. Proc. Natl Acad. Sci. USA 115, 6506-6511. ( 10.1073/pnas.1711842115) [DOI] [PMC free article] [PubMed] [Google Scholar]
- 23.Wills BD, Powell S, Rivera MD, Suarez AV. 2018. Correlates and consequences of worker polymorphism in ants. Annu. Rev. Entomol. 63, 575-598. ( 10.1146/annurev-ento-020117-043357) [DOI] [PubMed] [Google Scholar]
- 24.Wilson EO. 2003. Pheidole in the new world: a dominant, hyperdiverse ant genus. Cambridge, MA: Harvard University Press. [Google Scholar]
- 25.Passera L. 1976. Origine des intercastes dans les sociétés dePheidole pallidula (Nyl.) (Hymenoptera Formicidae) parasitées parMermis sp. (Nematoda Mermithidae). Insectes Soc. 23, 559-575. ( 10.1007/bf02223482) [DOI] [Google Scholar]
- 26.Wilson EO. 1968. The ergonomics of caste in the social insects. Am. Nat. 102, 41-66. ( 10.1086/282522) [DOI] [Google Scholar]
- 27.Urbani B, Andrade D. 2017. AntWiki—where ant biologists share their knowledge. See www.antwiki.org.
- 28.Fisher B, Ward P. 2002. Antweb. San Francisco, CA: California Academy of Sciences. [Google Scholar]
- 29.Bolton B. 2003. Synopsis and classification of Formicidae. Memoirs of the American Entomological Institute 71, 1-370. [Google Scholar]
- 30.Borowiec M. 2016. Generic revision of the ant subfamily Dorylinae (Hymenoptera, Formicidae). ZooKeys 4, 1-208. ( 10.3897/zookeys.608.9427) [DOI] [PMC free article] [PubMed] [Google Scholar]
- 31.Schmidt CA, Shattuck SO. 2014. The higher classification of the ant subfamily Ponerinae (Hymenoptera: Formicidae), with a review of Ponerine ecology and behavior. Zootaxa 3817, 1-242. ( 10.11646/zootaxa.3817.1.1) [DOI] [PubMed] [Google Scholar]
- 32.Shattuck S. 2000. Australian ants: their biology and identification. Collingwood, Australia: CSIRO Publishing. [Google Scholar]
- 33.LaPolla JS, Brady SG, Shattuck SO. 2010. Phylogeny and taxonomy of the Prenolepis genus-group of ants (Hymenoptera: Formicidae). Syst. Entomol. 35, 118-131. ( 10.1111/j.1365-3113.2009.00492.x) [DOI] [Google Scholar]
- 34.Shattuck S, Cover S. 2016. Taxonomy of some little-understood North American ants (Hymenoptera: Formicidae). Zootaxa 4175, 10-22. ( 10.11646/zootaxa.4175.1.2) [DOI] [PubMed] [Google Scholar]
- 35.Guenard B, Weiser MD, Gomez K, Narula N, Economo EP. 2017. The global ant biodiversity informatics (GABI) database: synthesizing data on ant species geographic distribution. Myrmecol. News 24, 83-86. [Google Scholar]
- 36.Fick SE, Hijmans RJ. 2017. WorldClim 2: new 1-km spatial resolution climate surfaces for global land areas. Int. J. Climatol. 37, 4302-4315. ( 10.1002/joc.5086) [DOI] [Google Scholar]
- 37.Hijmans RJ, van Etten J. 2014. raster: Geographic data analysis and modeling. R package version 2.
- 38.Bates D, Mächler M, Bolker B, Walker S. 2014. Fitting linear mixed-effects models using lme4. arXiv preprint arXiv 1406, 5823.
- 39.Akaike H. 1992. Information theory and an extension of the maximum likelihood principle. In Breakthroughs in statistics, pp. 610-624. Berlin, Germany: Springer. [Google Scholar]
- 40.Bolker BM, Brooks ME, Clark CJ, Geange SW, Poulsen JR, Stevens MHH, White J-SS. 2009. Generalized linear mixed models: a practical guide for ecology and evolution. Trends Ecol. Evol. 24, 127-135. ( 10.1016/j.tree.2008.10.008) [DOI] [PubMed] [Google Scholar]
- 41.Naimi B. 2015. usdm: uncertainty analysis for species distribution models. R package version 1.1-15.
- 42.Ives AR, Garland T. 2014. Phylogenetic regression for binary dependent variables. In Modern phylogenetic comparative methods and their application in evolutionary biology: concepts and practice (ed. Garamszegi LZ), pp. 231-261. Berlin, Germany: Springer. [Google Scholar]
- 43.Jombart T, Balloux F, Dray S. 2010. Adephylo: new tools for investigating the phylogenetic signal in biological traits. Bioinformatics 26, 1907-1909. ( 10.1093/bioinformatics/btq292) [DOI] [PubMed] [Google Scholar]
- 44.Jombart T, Dray S. 2010. Adephylo: exploratory analyses for the phylogenetic comparative method. Bioinformatics 26, 1-21. [DOI] [PubMed] [Google Scholar]
- 45.Rajakumar R, et al. 2018. Social regulation of a rudimentary organ generates complex worker-caste systems in ants. Nature 562, 574-577. [DOI] [PubMed] [Google Scholar]
- 46.Rajakumar R, et al. 2012. Ancestral developmental potential facilitates parallel evolution in ants. Science 335, 79-82. ( 10.1126/science.1211451) [DOI] [PubMed] [Google Scholar]
- 47.Economo EP, Narula N, Friedman NR, Weiser MD, Guénard B. 2018. Macroecology and macroevolution of the latitudinal diversity gradient in ants. Nat. Commun. 9, 1778. ( 10.1038/s41467-018-04218-4) [DOI] [PMC free article] [PubMed] [Google Scholar]
- 48.Dunn RR, et al. 2009. Climatic drivers of hemispheric asymmetry in global patterns of ant species richness. Ecol. Lett. 12, 324-333. ( 10.1111/j.1461-0248.2009.01291.x) [DOI] [PubMed] [Google Scholar]
- 49.Metzl C, Wheeler DE, Abouheif E. 2018. Wilhelm Goetsch (1887–1960): pioneering studies on the development and evolution of the soldier caste in social insects. Myrmecol. News 26, 81-96. ( 10.25849/myrmecol.news_026:081) [DOI] [Google Scholar]
- 50.Davidson DW. 1977. Species diversity and community organization in desert seed-eating ants. Ecology 58, 711-724. ( 10.2307/1936208) [DOI] [Google Scholar]
- 51.Heredia A, Detrain C. 2005. Influence of seed size and seed nature on recruitment in the polymorphic harvester ant Messor barbarus. Behav. Process. 70, 289-300. ( 10.1016/j.beproc.2005.08.001) [DOI] [PubMed] [Google Scholar]
- 52.Powell S. 2008. Ecological specialization and the evolution of a specialized caste in Cephalotes ants. Funct. Ecol. 22, 902-911. ( 10.1111/j.1365-2435.2008.01436.x) [DOI] [Google Scholar]
- 53.Baudier KM, Mudd AE, Erickson SC, O'Donnell S. 2015. Microhabitat and body size effects on heat tolerance: implications for responses to climate change (army ants: Formicidae. Ecitoninae). J. Anim. Ecol. 84, 1322-1330. ( 10.1111/1365-2656.12388) [DOI] [PubMed] [Google Scholar]
- 54.Cerda X, Retana J. 2000. Alternative strategies by thermophilic ants to cope with extreme heat: individual versus colony level traits. Oikos 89, 155-163. ( 10.1034/j.1600-0706.2000.890117.x) [DOI] [Google Scholar]
- 55.Lighton JRB, Quinlan MC, Feener DH Jr. 1994. Is bigger better? Water balance in the polymorphic desert harvester ant Messor pergandei. Physiol. Entomol. 19, 325-334. ( 10.1111/j.1365-3032.1994.tb01059.x) [DOI] [Google Scholar]
- 56.Schemske DW, Mittelbach GG, Cornell HV, Sobel JM, Roy K. 2009. Is there a latitudinal gradient in the importance of biotic interactions? Ann. Rev. Ecol. Evol. Syst. 40, 245-269. ( 10.1146/annurev.ecolsys.39.110707.173430) [DOI] [Google Scholar]
- 57.Passera L, Roncin E, Kaufmann B, Keller L. 1996. Increased soldier production in ant colonies exposed to intraspecific competition. Nature 379, 630-631. ( 10.1038/379630a0) [DOI] [Google Scholar]
- 58.Planqué R, Powell S, Franks NR, van den Berg JB. 2016. Disruptive selection as a driver of evolutionary branching and caste evolution in social insects. J. Evol. Biol. 29, 2111-2128. ( 10.1111/jeb.12952) [DOI] [PubMed] [Google Scholar]
- 59.Powell S, Franks NR. 2006. Ecology and the evolution of worker morphological diversity: a comparative analysis with Eciton army ants. Funct. Ecol. 20, 1105-1114. ( 10.1111/j.1365-2435.2006.01184.x) [DOI] [Google Scholar]
- 60.Powell S. 2016. A comparative perspective on the ecology of morphological diversification in complex societies: nesting ecology and soldier evolution in the turtle ants. Behav. Ecol. Sociobiol. 70, 1075-1085. ( 10.1007/s00265-016-2080-8) [DOI] [Google Scholar]
- 61.Wheeler DE. 1991. The developmental basis of worker caste polymorphism in ants. Am. Nat. 138, 1218-1238. ( 10.1086/285279) [DOI] [Google Scholar]
- 62.Jeanne RL. 1979. A latitudinal gradient in rates of ant predation. Ecology 60, 1211-1224. ( 10.2307/1936968) [DOI] [Google Scholar]
- 63.Roslin T, et al. 2017. Higher predation risk for insect prey at low latitudes and elevations. Science 356, 742-744. ( 10.1126/science.aaj1631) [DOI] [PubMed] [Google Scholar]
- 64.Powell S. 2009. How ecology shapes caste evolution: linking resource use, morphology, performance and fitness in a superorganism. J. Evol. Biol. 22, 1004-1013. ( 10.1111/j.1420-9101.2009.01710.x) [DOI] [PubMed] [Google Scholar]
- 65.Fjerdingstad EJ, Crozier RH. 2006. The evolution of worker caste diversity in social insects. Am. Nat. 167, 390-400. ( 10.1086/499545) [DOI] [PubMed] [Google Scholar]
- 66.Abouheif E Ant caste evo-devo: it’s not all about size. Trends Ecol. Evol. 36, 668-670. ( 10.1016/j.tree.2021.04.002) [DOI] [PubMed] [Google Scholar]
- 67.Yang AS, Martin CH, Nijhout HF. 2004. Geographic variation of caste structure among ant populations. Curr. Biol. 14, 514-519. ( 10.1016/j.cub.2004.03.005) [DOI] [PubMed] [Google Scholar]
- 68.Alvarado S, Rajakumar R, Abouheif E, Szyf M. 2015. Epigenetic variation in the Egfr gene generates quantitative variation in a complex trait in ants. Nat. Commun. 6, 6513. ( 10.1038/ncomms7513) [DOI] [PubMed] [Google Scholar]
- 69.Brodie J, Post E, Laurance WF. 2012. Climate change and tropical biodiversity: a new focus. Trends Ecol. Evol. 27, 145-150. ( 10.1016/j.tree.2011.09.008) [DOI] [PubMed] [Google Scholar]
- 70.Overpeck JT, Udall B. 2020. Climate change and the aridification of North America. Proc. Natl Acad. Sci. USA 117, 11 856-11 858. ( 10.1073/pnas.2006323117) [DOI] [PMC free article] [PubMed] [Google Scholar]
- 71.Tøttrup AP, Klaassen RHG, Kristensen MW, Strandberg R, Vardanis Y, Lindström Å, Rahbek C, Alerstam T, Thorup K. 2012. Drought in Africa caused delayed arrival of European songbirds. Science 338, 1307. ( 10.1126/science.1227548) [DOI] [PubMed] [Google Scholar]
- 72.McLaughlin BC, Ackerly DD, Klos PZ, Natali J, Dawson TE, Thompson SE. 2017. Hydrologic refugia, plants, and climate change. Glob. Change Biol. 23, 2941-2961. ( 10.1111/gcb.13629) [DOI] [PubMed] [Google Scholar]
- 73.Folgarait PJ. 1998. Ant biodiversity and its relationship to ecosystem functioning: a review. Biodivers. Conserv. 7, 1221-1244. ( 10.1023/A:1008891901953) [DOI] [Google Scholar]
- 74.Gould SJ. 1966. Allometry and size in ontogeny and phylogeny. Biol. Rev. 41, 587-638. ( 10.1111/j.1469-185X.1966.tb01624.x) [DOI] [PubMed] [Google Scholar]
- 75.La Richelière F, et al. 2022. Data from: Warm and arid regions of the world are hotspots of superorganism complexity. Dryad Digital Repository. [DOI] [PMC free article] [PubMed]
Associated Data
This section collects any data citations, data availability statements, or supplementary materials included in this article.
Data Citations
- La Richelière F, et al. 2022. Data from: Warm and arid regions of the world are hotspots of superorganism complexity. Dryad Digital Repository. [DOI] [PMC free article] [PubMed]
Supplementary Materials
Data Availability Statement
Data on ant species occurrence and polymorphism classification are available from the Dryad Digital Repository: https://datadryad.org/stash/share/2WYof3lmWteaWz05918NCp8ZtgUEeXYScxUTuJiSZI4 [75].