

Abstract
BACKGROUND
Cardiomyocytes are organized in microstructures termed sheetlets that reorientate during left ventricular thickening. Diffusion tensor cardiac magnetic resonance (DT-CMR) may enable noninvasive interrogation of in vivo cardiac microstructural dynamics. Dilated cardiomyopathy (DCM) is a condition of abnormal myocardium with unknown sheetlet function.
OBJECTIVES
This study sought to validate in vivo DT-CMR measures of cardiac microstructure against histology, characterize microstructural dynamics during left ventricular wall thickening, and apply the technique in hypertrophic cardiomyopathy (HCM) and DCM.
METHODS
In vivo DT-CMR was acquired throughout the cardiac cycle in healthy swine, followed by in situ and ex vivo DT-CMR, then validated against histology. In vivo DT-CMR was performed in 19 control subjects, 19 DCM, and 13 HCM patients.
RESULTS
In swine, a DT-CMR index of sheetlet reorientation (E2A) changed substantially (E2A mobility ~46°). E2A changes correlated with wall thickness changes (in vivo r2 = 0.75; in situ r2 = 0.89), were consistently observed under all experimental conditions, and accorded closely with histological analyses in both relaxed and contracted states. The potential contribution of cyclical strain effects to in vivo E2A was ~17%. In healthy human control subjects, E2A increased from diastole (18°) to systole (65°; p < 0.001; E2A mobility = 45°). HCM patients showed significantly greater E2A in diastole than control subjects did (48 ; p < 0.001) with impaired E2A mobility (23°; p < 0.001). In DCM, E2A was similar to control subjects in diastole, but systolic values were markedly lower (40° ; p < 0.001) with impaired E2A mobility (20°; p < 0.001).
CONCLUSIONS
Myocardial microstructure dynamics can be characterized by in vivo DT-CMR. Sheetlet function was abnormal in DCM with altered systolic conformation and reduced mobility, contrasting with HCM, which showed reduced mobility with altered diastolic conformation. These novel insights significantly improve understanding of contractile dysfunction at a level of noninvasive interrogation not previously available in humans. (J Am Coll Cardiol 2017;69:661–76) Published by Elsevier on behalf of the American College of Cardiology Foundation.
Keywords: dilated cardiomyopathy, helical structure, hypertrophic cardiomyopathy, laminar structure, left ventricle, sheetlet structure
The microstructure of left ventricular (LV) compact myocardium in humans and other mammals consists of a continuously branching syncytium of cardiomyocytes embedded in a predominantly collagen matrix. The primary helical arrangement of cardiomyocytes through the depth of the LV wall (1,2) (Figures 1A and 1B) can be quantified by the helix angle (HA) (3,4). LV contraction entails both longitudinal and circumferential shortening of the ventricle (~10% to 25%, depending on direction and depth) accompanied by radial wall thickening (>35%), together with twisting of the apex relative to the base (5). Cardiomyocytes, the heart’s fundamental contractile element, individually shorten by only ~15% and thicken by only ~8% during systole (5). Such conformational changes in cardiomyocytes in a helical arrangement alone are insufficient to explain the observed magnitude of systolic wall thickening (5). The secondary organization of cardiomyocytes consists of laminar microstructures, 5 to 10 cardiomyocytes thick, termed sheetlets (3,6). Reorientation of these sheetlets (7,8), quantified by changes in sheetlet angle (SA), has been proposed as the predominant mechanism associated with macroscopic LV wall thickening in vivo (9–12) (Figures 1C to 1J, Online Video 1).
FIGURE 1. LV Myocardial Helical and Sheetlet Microstructures.
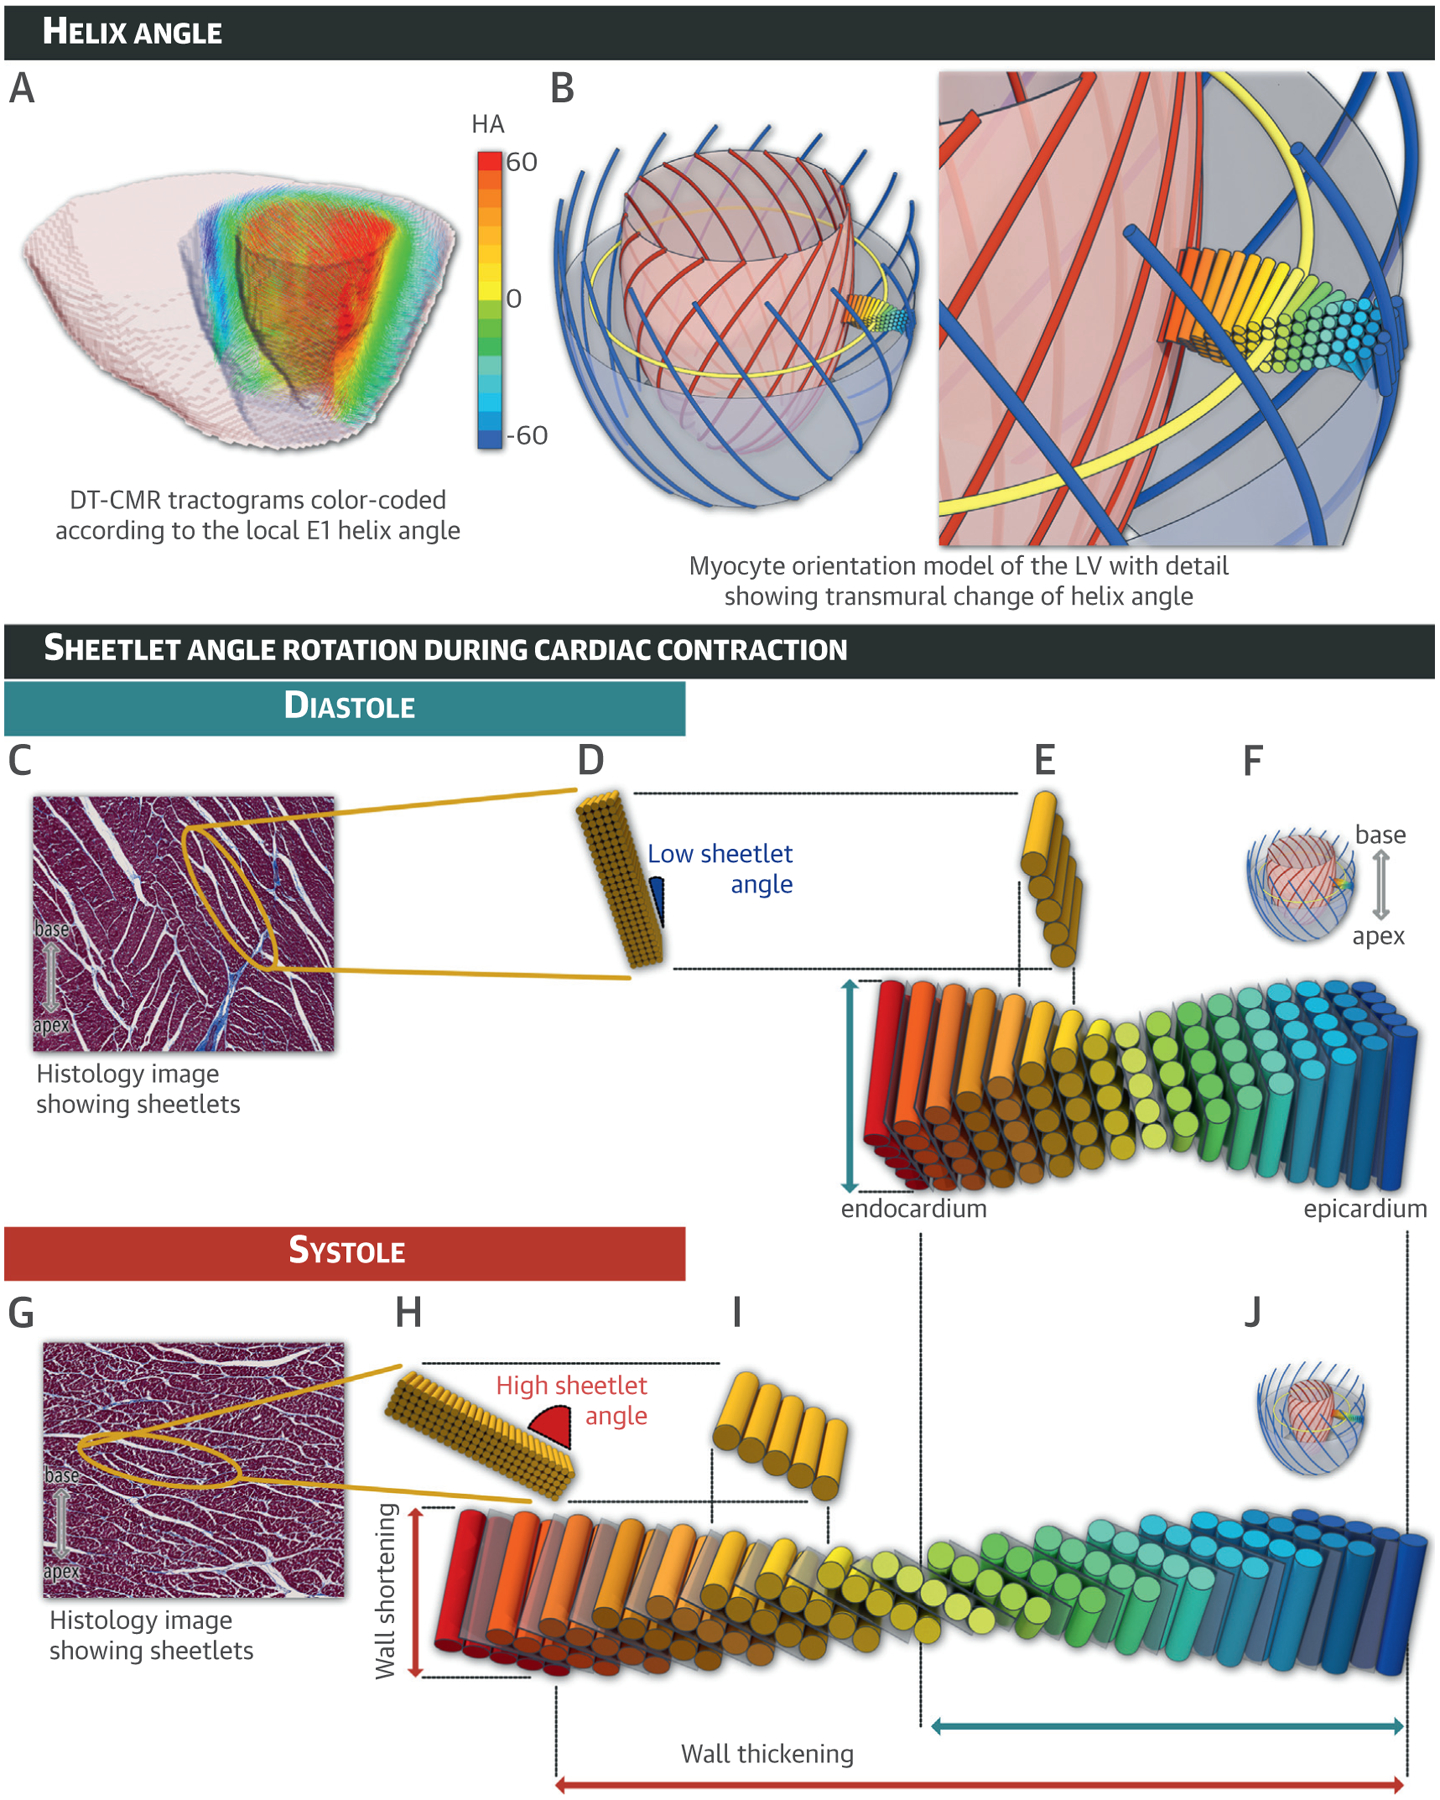
(A) Multi-slice tractogram obtained from ex vivo diffusion tensor cardiac magnetic resonance depicts the primary diffusion eigenvector (E1) direction color-coded according to the helix angle (HA). (B) Schematic diagram of the helical structure of cardiomyocytes with zoom. Sheetlet angle (SA) rotation during cardiac contraction is depicted during diastole (C to F) and systole (G to J) with myocardial sheetlet microstructures shown in relaxed (F) and contracted (J) states. In mid-myocardial zooms of histology sections cut perpendicular to the local cardiomyocytes acquired from relaxed (C) and contracted (G) ex vivo heart samples, a yellow ellipse surrounds a single sheetlet composed of closely packed cardiomyocytes bounded by the pale cracks of shear layers. Additionally, the sheetlet angle is defined as the angle between the sheetlet and the local epicardial left ventricular (LV) wall. Here, SA varied from a low value (SA ~15°) in diastole (D) to a high value (SA ~60°) in systole (H). See Online Video 1. Blue = left-handed epicardial helixes; yellow = mid-myocardium circumferential alignments; red = right-handed endocardial helixes; gray = intervening cracks or shear layers. DT-CMR = diffusion tensor cardiac magnetic resonance.
Cardiomyopathies affect both myocardial structure and function in the absence of coronary artery disease or abnormal loading conditions (13,14). In hypertrophic cardiomyopathy (HCM), there is an annual incidence of cardiovascular death of 1% to 2% due to heart failure and sudden cardiac death from arrhythmias (15). In dilated cardiomyopathy (DCM), 5-year mortality is up to 20% with a 14% risk of sudden or aborted cardiac death (16,17). Consequently, efforts are underway to better characterize these patient populations and direct appropriate therapies to those at risk. Cardiac magnetic resonance (CMR) is important to this process through improved phenotyping (18,19) and tissue characterization, particularly the detection and quantification of fibrosis through late gadolinium enhancement imaging (20,21).
Diffusion tensor (DT)-CMR potentially provides a novel approach for phenotyping through noninvasive interrogation of the 3-dimensional heart microarchitecture (22,23). In DT-CMR, the primary eigenvector (E1) corresponds to the local cardiomyocyte long-axis orientation, whereas the secondary eigenvector (E2) reportedly corresponds to the local within-sheetlet cross-cardiomyocyte orientation (6,24–34). The angle of E1 relative to the local wall tangent plane (E1A) is an index of mean intravoxel HA, and the angle of E2 (E2A) is an index of mean intravoxel SA (6,28) (Online Appendix). DT-CMR has been used to demonstrate the HA architecture in the normal beating heart (25,27) and in different pathological conditions (28,29), supported by studies validating ex vivo DT-CMR against histology (31–33). DT-CMR data supporting reorientation of laminar microstructures at different phases of the cardiac cycle have been reported in healthy rodent hearts imaged ex vivo in either contracted or relaxed states, with paired histology (6,34), as well as in vivo in healthy volunteers (30,35,36). Abnormal sheetlet dynamics have been demonstrated in dyssynchronous canine hearts (37,38) and in dystrophic rodent hearts (39) imaged ex vivo with paired histology.
In previous work, we implemented robust quantitative in vivo DT-CMR and confirmed its reproducibility in healthy subjects (40) and in HCM (41). We reported E2A changes from systole to diastole, which we hypothesized represented dynamic rearrangement of sheetlets in healthy subjects, as well as E2A changes in HCM, consistent with systolic hypercontraction and attenuated diastolic relaxation (28). However, the in vivo DT-CMR technique used encoded myocardial diffusion over an entire cardiac cycle, and so the influence of tissue deformation on the diffusion measurements has remained unclear (5,28,30,42).
To help understand the relationship of these in vivo findings to the actual underlying tissue microstructure, our study objectives included comprehensive validation of in vivo DT-CMR measures of cardiac microstructure against histology, characterization of microstructural dynamics associated with myocardial wall thickening in the loaded beating heart in vivo, and characterization of altered microstructural dynamics in HCM and DCM.
METHODS
Detailed methods are available in the Online Appendix and the study protocol is summarized in Online Figure 1. The main DT-CMR protocol parameters were as follow: b0 = 50 s/mm2; b = 500 s/mm2 in 6 diffusion encoding directions; repetition time TR = 2 RR intervals = 1,400 ms (assuming a heart rate of 86 beats/min); acquisition time per 2 averages Tacq = 34 RR intervals ≈ 24 s, 20 averages. Animal procedures were approved by the National Heart, Lung, and Blood Institute Animal Care and Use Committee. In brief, in vivo DT-CMR was performed in Yorkshire pigs (n = 16) at 2 mid-ventricular short-axis slices with 6 to 9 time points per cardiac cycle. Subsequently, a single mid-ventricular short-axis slice was continuously imaged with DT-CMR (temporal resolution = 24 s) in the intact animal in situ during the first hour after induction of cardiac arrest by intravenous potassium chloride (KCl) (n = 6) or barium chloride (BaCl2) (n = 6) (34). KCl-arrested hearts approximated a diastolic configuration for >1 h after arrest. The BaCl2-arrested hearts initially approximated a diastolic configuration, but ~20 to 40 min after injection, they underwent a single final contraction over an additional 5 to 10 min (Online Figure 2) and remained contracted. This effectively slowed cardiac contraction by 3 orders of magnitude (from ~300 ms in vivo to ~5 min), allowing interrogation of contraction by DT-CMR in the absence of cyclical strain effects. The hearts were then excised and imaged by ex vivo DT-CMR (n = 16), after which tissue samples were obtained for paired histology (n = 16) (Online Figure 3). DCM and HCM were diagnosed in accordance with guidelines (21). The National Research Ethics Committee approved this study. In vivo DT-CMR was performed both at late diastole and end systole as previously described (40,43) (Online Appendix, Online Figures 4 and 5). The CMR protocol also included whole heart stacks of 2-dimensional cines for volumetric analysis, cine strain acquisitions, and late gadolinium enhancement (Online Appendix).
RESULTS
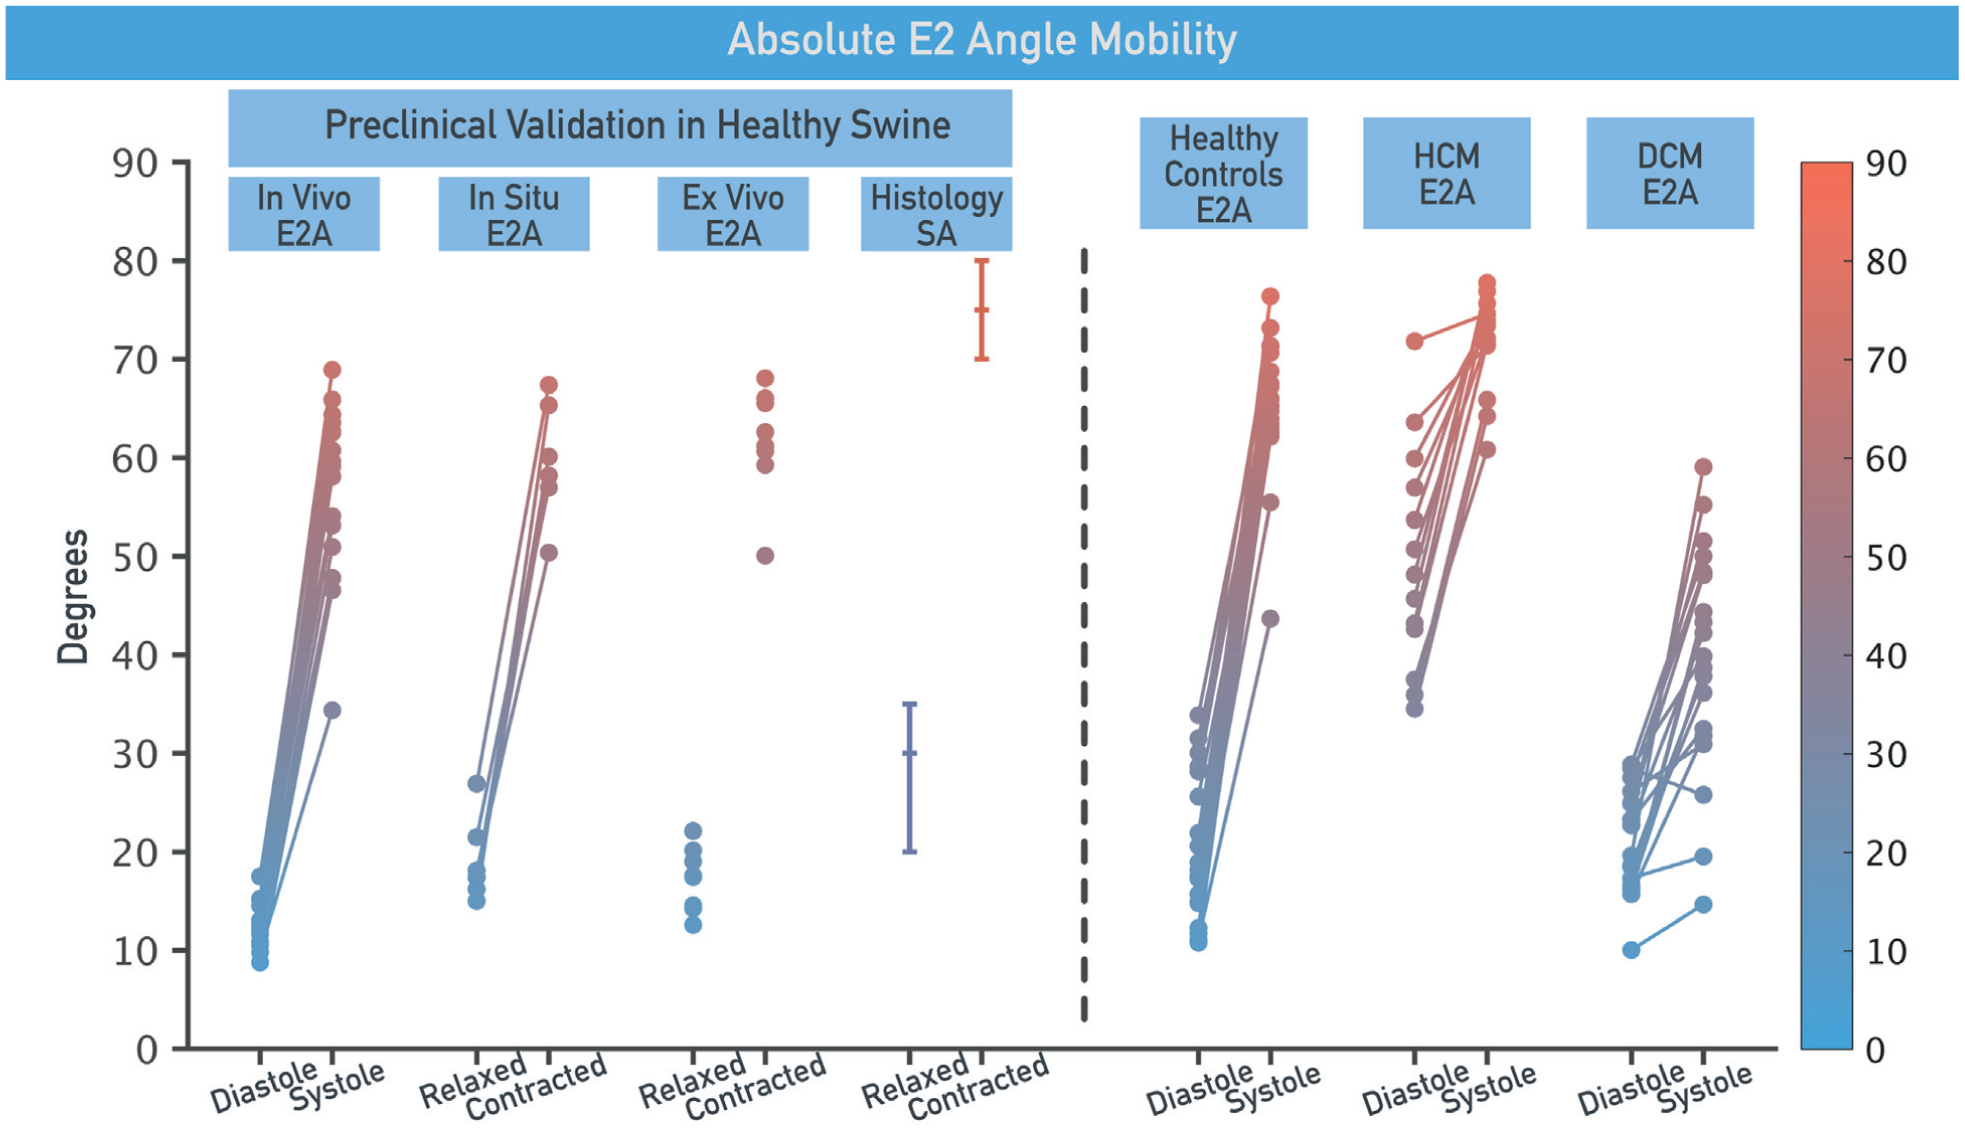
Under all experimental conditions, we observed that the major change associated with myocardial wall thickening was an increase in E2A (Figure 2; Table 1). E2A values are presented as median (interquartile range [IQR]), because E2A was not normally distributed over the LV. In vivo imaging demonstrated a gradual transition of E2A from a median of 13° (IQR: 11° to 15°) in diastole to 59° (IQR: 52° to 63°) in systole (n = 16; p < 0.0001) (Figure 2A). Following BaCl2, changes in E2A akin to those observed during in vivo systolic contraction were also seen (median: relaxed: 18° [IQR: 13° to 19°]; contracted: 59° [IQR: 57° to 65°]; p < 0.0001; n = 6) (Figure 2B, Online Video 2). By contrast, after KCl, E2A and LV wall thickness remained unchanged with median values comparable to those observed in vivo during diastole (E2A = 17° [IQR: 16° to 20°]; 15° [IQR: 16° to 22°]; p = 0.05; n = 6) (Figure 2B, Online Video 2). In situ median E2A values ~50 min after arrest increased substantially between KCl relaxed (15° [IQR: 16° to 22°]) and BaCl2 contracted (59° [IQR: 57° to 65°]; p = 0.0034; n = 6) hearts. Ex vivo imaging demonstrated significantly increased median E2A between KCl-relaxed (18° [IQR: 14° to 20°]; n = 8) and BaCl2-contracted (62° [IQR: 60° to 66°]; n = 8; p = 0.0008) states (Figure 2C). Quantitative histological analysis of SA ranged from a median 30° (IQR: 20° to 35°) in KCl-relaxed hearts (n = 8) to 75° (IQR: 70° to 80°) in BaCl2-contracted hearts (n = 8; p = 0.0008) (Figure 2D), and correlated well with ex vivo E2A (r = 0.89; p < 0.0001). These data confirmed in vivo E2A as a metric of mean intravoxel sheetlet orientation, suggesting that tilting of laminar sheetlet orientation is the predominant mediator of myocardial systolic thickening.
FIGURE 2. E2A Changes Throughout the Cardiac Cycle.
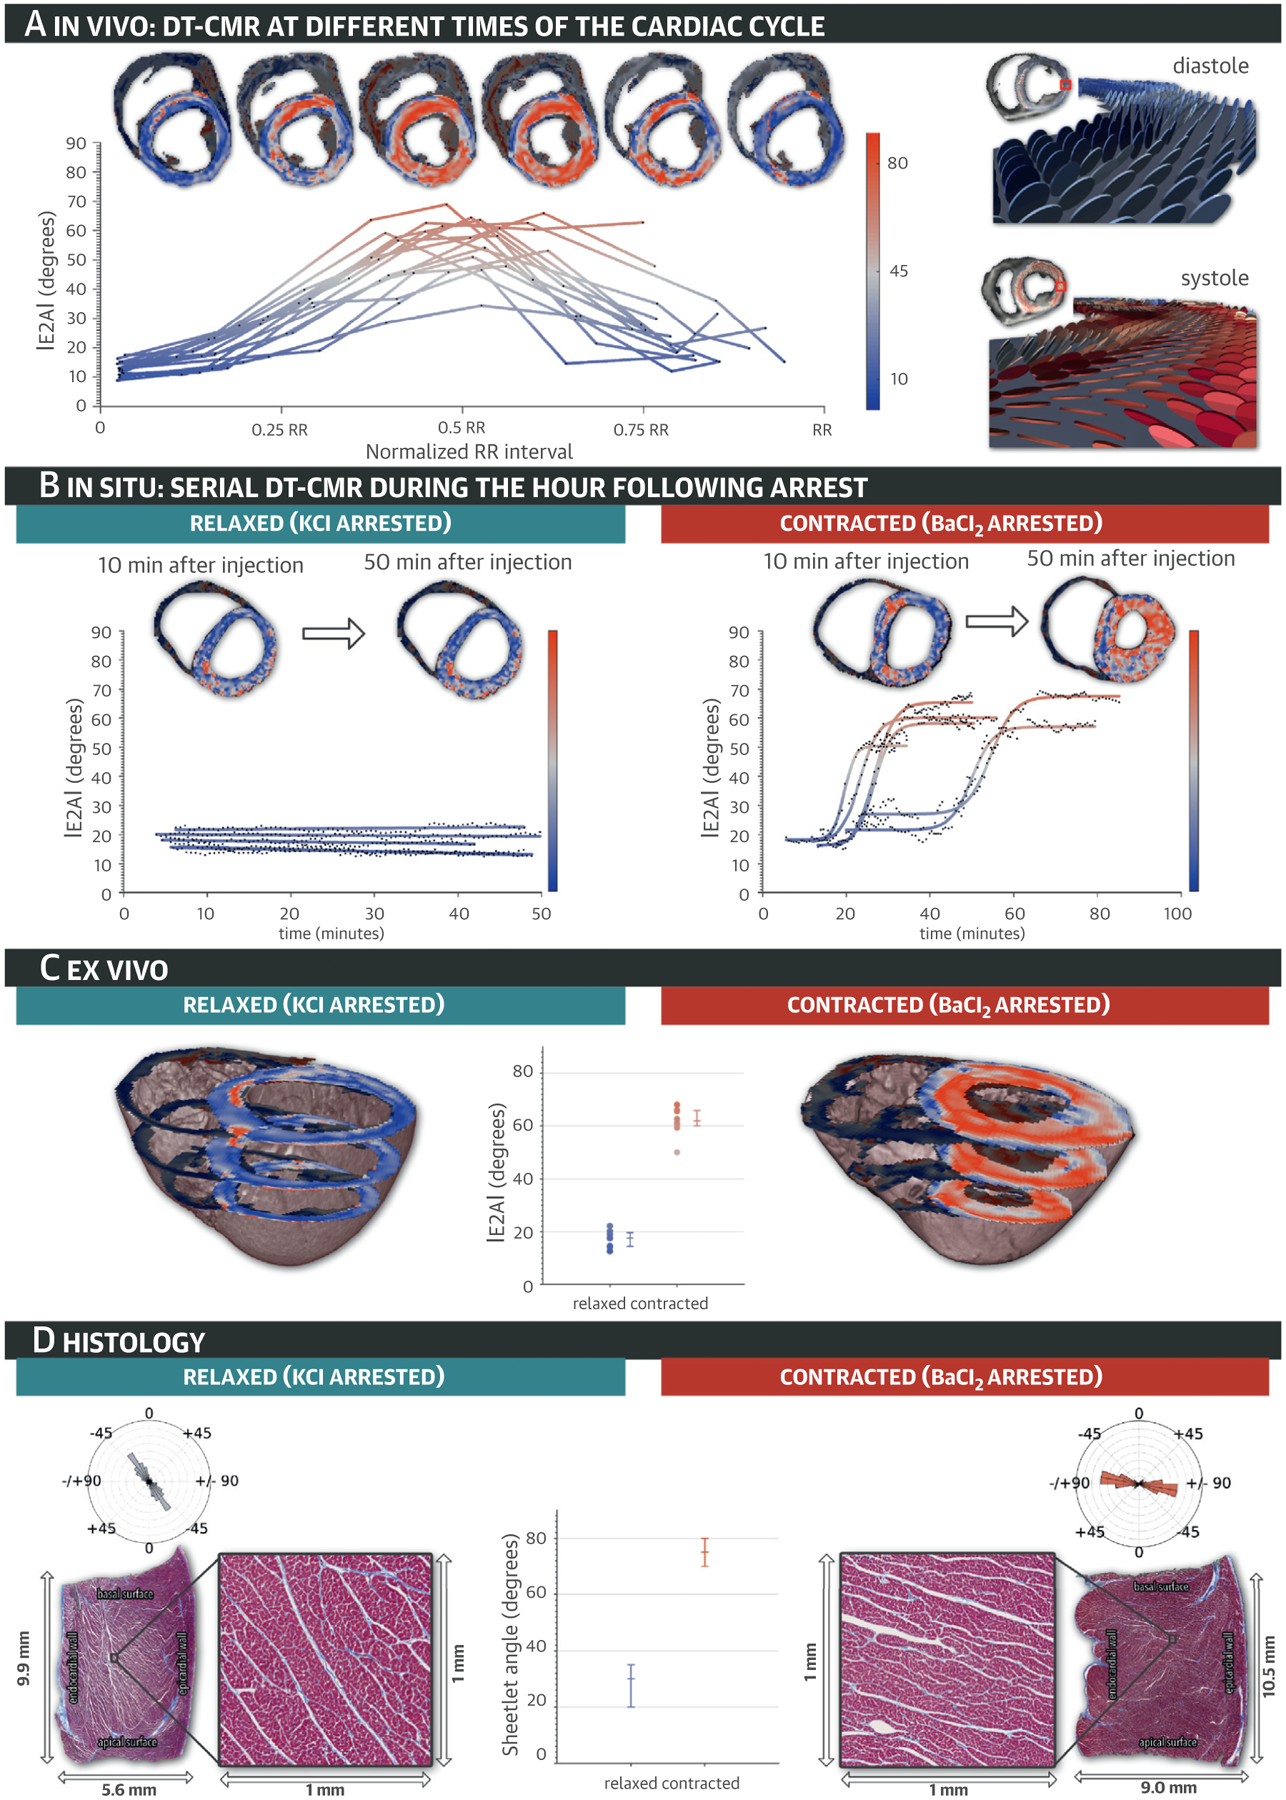
(A) In vivo secondary diffusion tensor eigenvector angle (E2A) maps are depicted at multiple points of the cardiac cycle, together with a plot of E2A throughout the entire cardiac cycle for all in vivo experiments. As the measured planes swivel from diastole to systole, E2A increases and their color changes from blue to red. (B) In situ and (C) ex vivo E2A maps depict relaxed and contracted hearts after injection of potassium chloride (KCl) and barium chloride (BaCl2). (D) Long-axis histological cuts with mesocardial layer details show sheetlets in relaxed and contracted heart tissue samples, with their corresponding angular histograms, demonstrating the sheetlet and cleavage plane reorientation. See Online Video 2. DT-CMR = diffusion tensor cardiac magnetic resonance.
TABLE 1.
E1A and E2A Values
| E2A, ° | E1Aepi, ° | E1Aendo, ° | E1AR, ° | Wall Thickness, mm | ||||||
|---|---|---|---|---|---|---|---|---|---|---|
| In vivo | ||||||||||
| Diastole* | 13 (11 to 15) | −57 (−57 to −54) | 33 (31 to 35) | 90 (86 to 94) | 7.5 (7.3 to 7.9) | |||||
| Systole* | 59 (52 to 63) | −56 (−61 to −54) | 40 (35 to 43) | 96 (89 to 101) | 10.0 (9.5 to 10.5) | |||||
| In situ | ||||||||||
| Relaxed† | 17 (16 to 20)§ | 15 (16 to 22)∥ | −39 (−41 to −38)§ | −41 (−45 to −40)∥ | 33 (31 to 37)§ | 32 (19 to 36)∥ | 74 (70 to 78)§ | 75 (60 to 81)∥ | 7.0 (6.5 to 7.5)§ | 6.9 (6.5 to 7.5)∥ |
| Contracted† | 18 (13 to 19)§ | 59 (57 to 65)∥ | −53 (−56 to −41)§ | −68 (74 to 66)∥ | 41 (40 to 46)§ | 50 (48 to 53)∥ | 95 (83 to 101)§ | 118 (117 to 119)∥ | 9.8 (7.6 to 8.1)§ | 13.7 (12.9 to 14.0)∥ |
| Ex vivo | ||||||||||
| Relaxed‡ | 18 (14 to 20) | −52 (−54 to −51) | 36 (33 to 37) | 89 (85 to 92) | 8.0 (7.6 to 8.1) | |||||
| Contracted‡ | 62 (60 to 66) | −62 (−66 to −59) | 47 (46 to 49) | 109 (107 to 113) | 13.5 (12.6 to 14.4) | |||||
| Histology | SA | HAepi | HAendo | HAR | ||||||
| Relaxed‡ | 30 (20 to 35) | −20 (−26 to −13) | 46 (30 to 55) | 72 (50 to 75) | ||||||
| Contracted‡ | 75 (70 to 80) | −28 (−29 to −23) | 49 (36 to 52) | 73 (60 to 84) | ||||||
Values are median (interquartile range).
n = 16.
n = 6.
n = 8.
10 min after arrest.
50 min after arrest.
E1A = primary diffusion tensor eigenvector angle; E1AR = E1 angle range; E2A = secondary diffusion tensor eigenvector angle; endo = endocardial; epi = epicardial; HA = helix angle; HAR = helix angle range; SA = sheetlet angle.
To address the potential influence of cyclical strain on in vivo E2A measures, the relationship between E2A changes (ΔE2A) and LV wall thickness changes (ΔWT) in vivo and with BaCl2 in situ was analyzed. ΔE2A strongly correlated with ΔWT in both settings (in vivo r2 = 0.75; in situ r2 = 0.89) (Table 1, Figure 3). Whereas DE2A was similar for in vivo and BaCl2 in situ, ΔWT of hearts contracted by BaCl2 was greater than corresponding ΔWT measured in vivo. Direct comparison between BaCl2 in vivo and in situ E2A versus WT correlations (Figure 3) led to a 17% difference. These data suggested that measured changes in E2A during myocardial thickening are principally accounted for by sheetlet reorientation with a lesser contribution from cyclical strain effects.
FIGURE 3. E2A Increase and Wall Thickening.
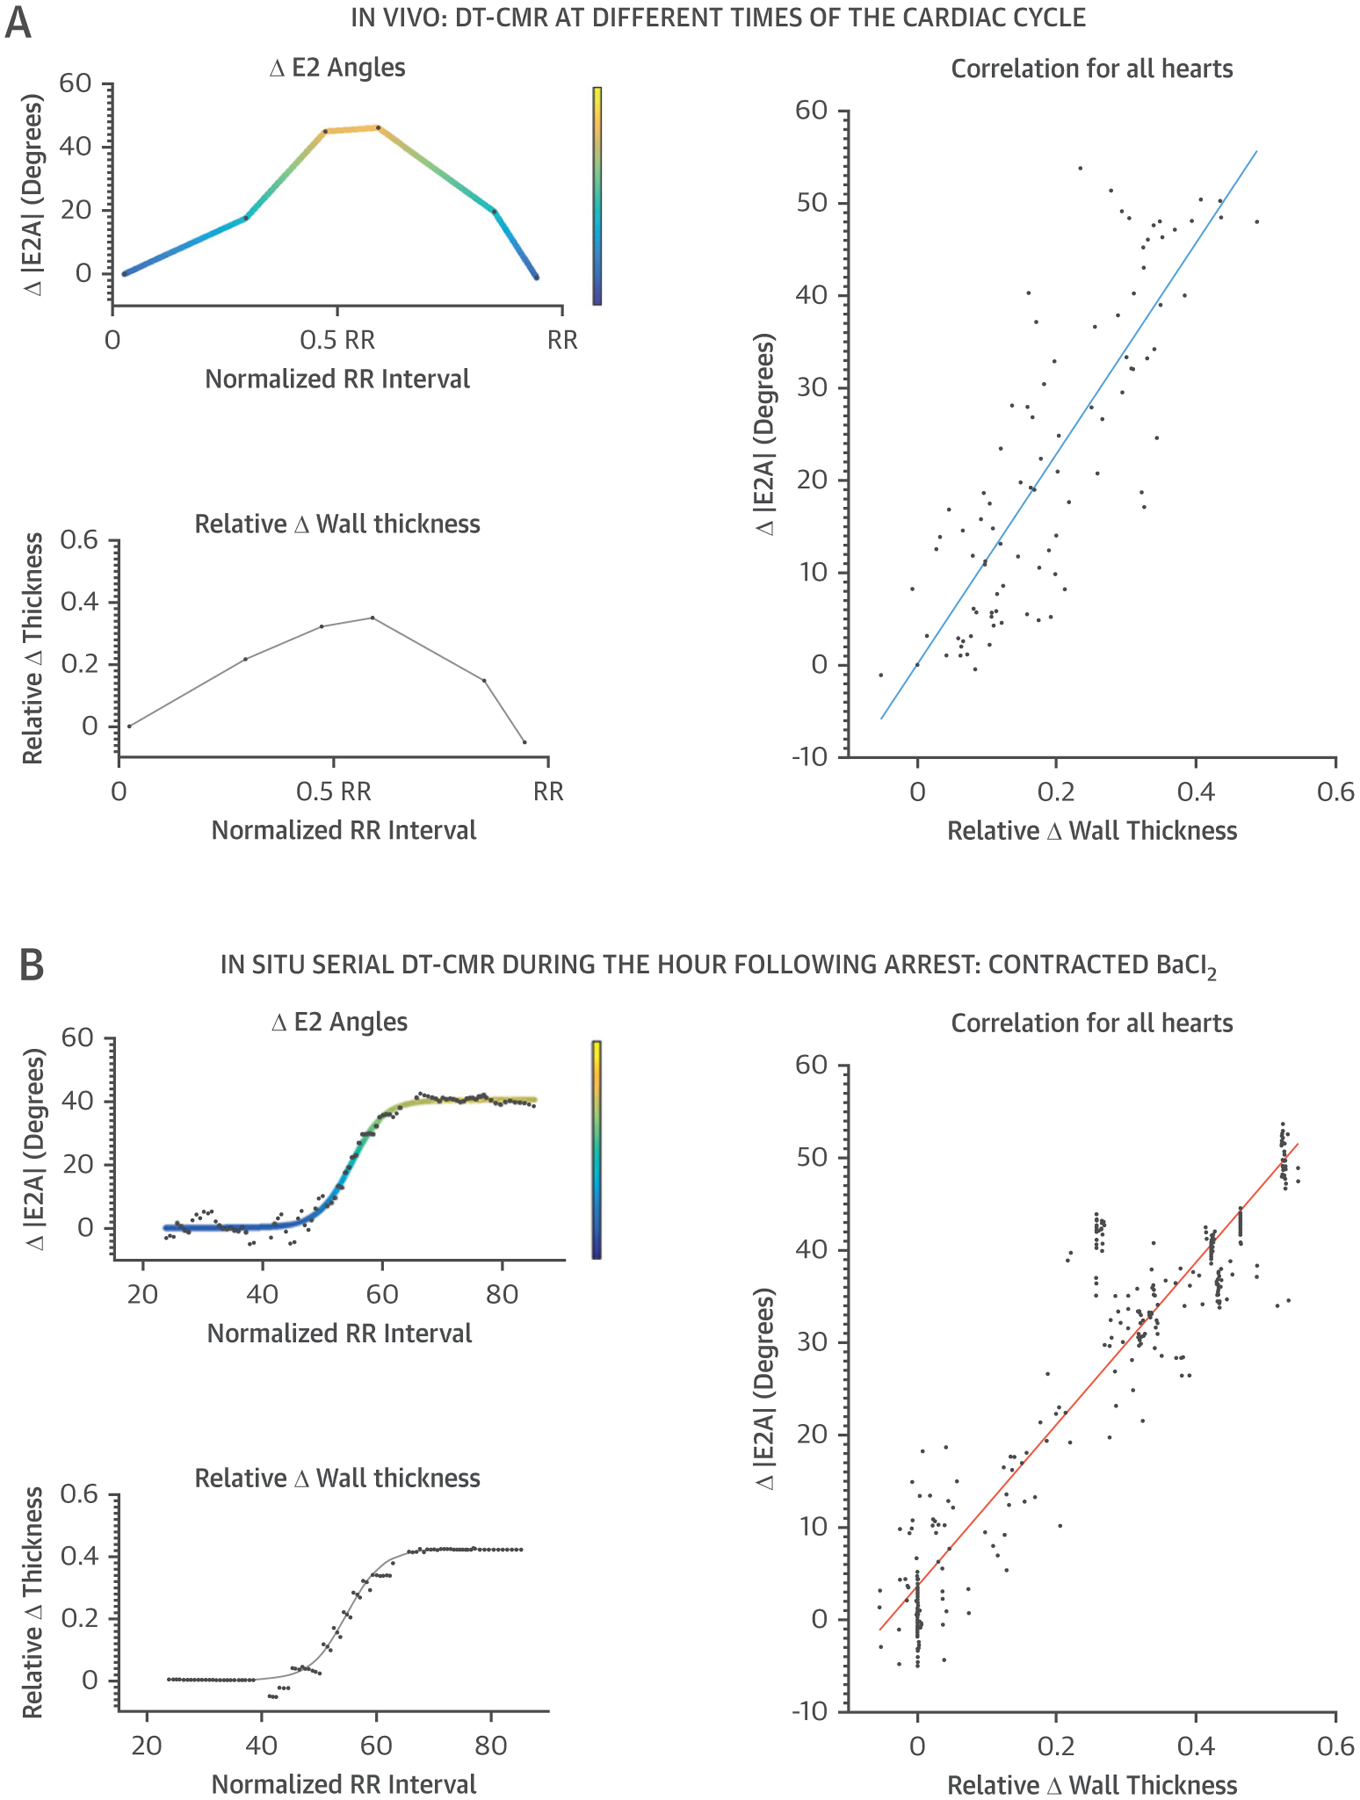
Color-coded plots of E2A change (ΔE2A) versus wall thickness changes (ΔWT) are shown for both in vivo (A) and in situ (B) with BaCl2 arrest acquisitions. The strong correlation between ΔE2A and ΔWT supported the thesis that the reorientation of the sheetlets contributes significantly to systolic wall thickening. Abbreviations as in Figures 1 and 2.
The magnitude of change of the transmural distribution of E1A was substantially lower than observed for E2A under all experimental conditions (Figure 4, Table 1). In vivo E1A range (E1AR) (44) changed from a median 90° (IQR: 86° to 94°) in diastole (n = 8) to 96° (IQR: 89° to 101°) in systole (n = 8; p = 0.037) (Figure 4A). In situ E1AR changed from a median 75° (IQR: 60° to 81°) in the KCl-relaxed hearts (n = 6) to 118° (IQR: 117° to 119°) in the BaCl2-contracted hearts (n = 6; p = 0.004) (Figure 4B, Online Video 2). Ex vivo DT-CMR images (Figure 4C) showed similar E1AR values (median: 89° [IQR: 85° to 92°] in relaxed hearts; 109° [IQR: 107° to 113°] in contracted hearts; n = 8; p = 0.0008). Histology confirmed the expected transition of HA from epicardium to endocardium (HA range [HAR], median: 72° [IQR: 50° to 75°] in the relaxed state, which was not significantly different from 73° [IQR: 60°, 84°] in the contracted state; n = 8; p = 0.3) (Figure 4D, Online Videos 3 and 4). Ex vivo E1AR correlated well with HAR derived from histology (r = 0.92; p < 0.0001; n = 32). These data confirmed that in vivo E1A is a measurement of mean intravoxel HA.
FIGURE 4. E1A Distribution Through Depth of LV Wall.
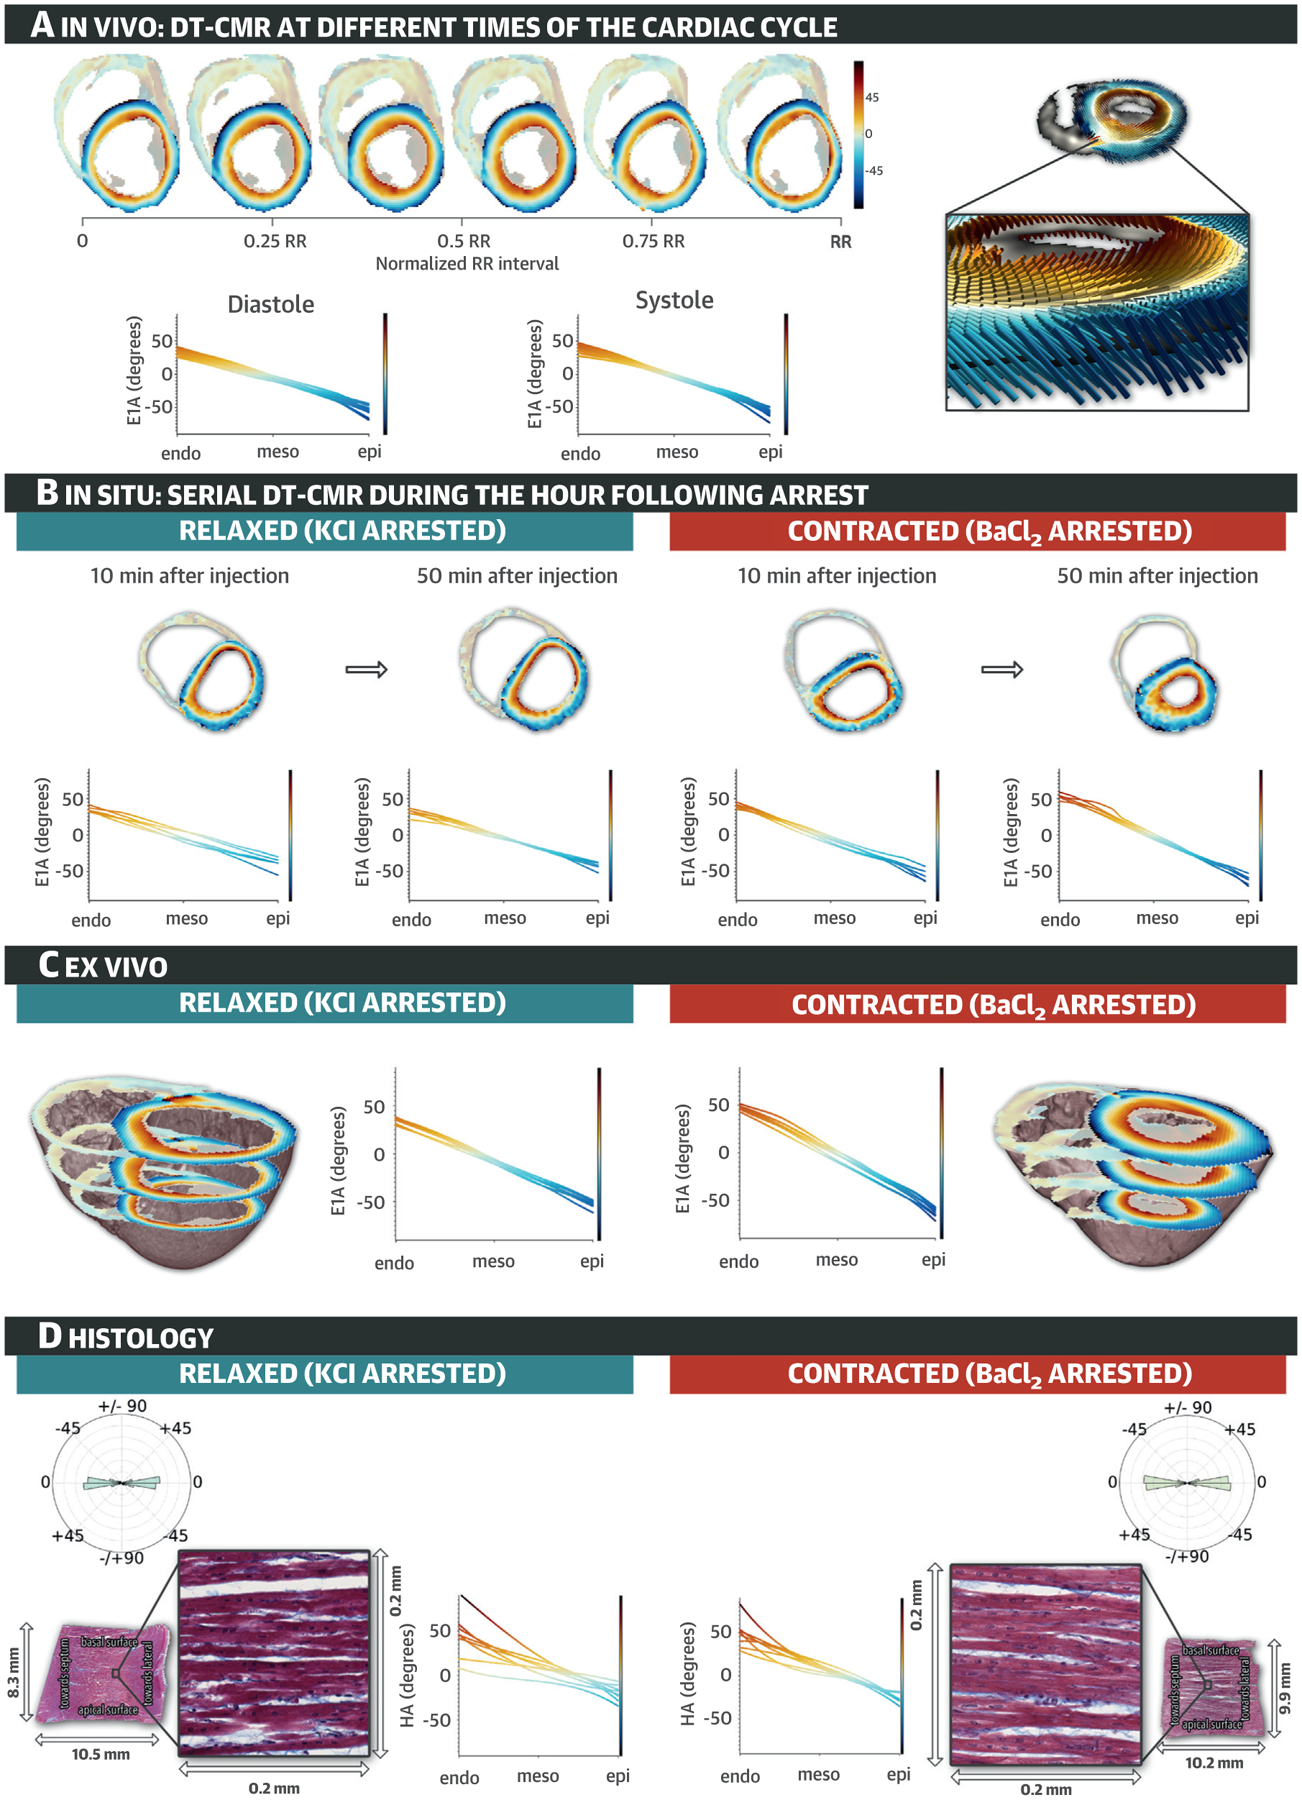
(A) Typical in vivo primary diffusion eigenvector angle (E1A) maps derived from DT-CMR at 6 time points in the cardiac cycle, and mean E1A against wall depth plots at systole and diastole for all in vivo experiments; inset illustrates E1 and E1A changes with LV wall depth. (B) Typical in situ E1A maps from DT-CMR after arrest by injection of KCl and BaCl2. See Online Video 2. (C) Typical ex vivo E1A maps at 3 mid-ventricular slices and E1A against wall depth plots in relaxed and contracted hearts. (D) Typical mid-layer wall-parallel histology sections showing circumferentially aligned cardiomyocytes that appear approximately horizontal on the images and expanded views, and their respective radial histograms measuring HA ~0°, with line plots of HA against wall depth derived from multiple wall parallel sections of all relaxed and contracted hearts. See Online Videos 3 and 4. endo = endocardium; epi = epicardium; meso = mesocardium; other abbreviations as in Figures 1 and 2.
CLINICAL STUDY.
DT-CMR was performed on 19 DCM patients, 13 HCM patients, and 19 control subjects (2 DCM, 1 HCM, and 4 control subjects were excluded for arrhythmia, difficulty breath-holding, and incidental findings). Table 2 contains baseline features of these groups. The mean ejection fraction (EF) in DCM was 45 ± 11%, in HCM 74 ± 6%, and in control subjects 65 ± 5%. Significant differences in cardiac parameters between groups accorded with known pathologies.
TABLE 2.
Baseline Characteristics
| DCM Patients (n = 19) | HCM Patients (n = 13) | Healthy Control Subjects (n = 19) | p Value* | |
|---|---|---|---|---|
| Age, yrs | 51 ± 14 | 57 ± 13 | 48 ± 12 | 0.17 |
| Male | 11 (58) | 8 (62) | 11 (58) | 0.974 |
| Body surface area, m2 | 1.98 ± 0.25 | 1.92 ± 0.23 | 1.89 ± 0.21 | 0.46 |
| Systolic BP, mm Hg | 130 ± 23 | 125 ± 10 | 118 ± 28 | 0.63 |
| Diastolic BP, mm Hg | 71 ± 14 | 74 ± 9 | 73 ± 8 | 0.82 |
| Heart rate, beats/min | 62 ± 10 | 60 ± 8 | 57 ± 6 | 0.24 |
| QRS width, ms | 119 ± 29 | 101 ± 16 | 97 ± 18 | <0.001† |
| Indexed LV EDV, ml/m2 | 132 ± 34 | 78 ± 13 | 77 ± 10 | <0.001† |
| Indexed LV ESV, ml/m2 | 76 ± 35 | 20 ± 6 | 27 ± 6 | <0.001† |
| Ejection fraction, % | 45 ± 11 | 74 ± 6 | 65 ± 5 | <0.001‡ |
| Maximum wall thickness, mm | 9 ± 2 | 20 ± 2 | 9 ± 2 | <0.001§ |
| Indexed LV mass, g/m2 | 78 ± 18 | 119 ± 37 | 63 ± 11 | <0.001§ |
| E2A, ° | ||||
| Diastole | 23 (17 to 26) | 48 (41 to 58) | 18 (15 to 28) | <0.001 |
| Systole | 40 (48 to 32) | 74 (70 to 76) | 65 (63 to 68) | <0.001 |
| Mobility | 20 (10 to 26) | 23 (16 to 30) | 45 (39 to 50) | <0.001 |
| Peak radial strain | 0.24 (0.18 to 0.3) | 0.24 (0.19 to 0.51) | 0.64 (0.49 to 0.74) | <0.001 |
| Peak circumferential strain | −0.12 (−0.14 to 0.01) | −0.14 (−0.14 to −0.11) | −0.17 (−0.18 to −0.15) | <0.001 |
| Presence of late gadolinium enhancement in whole heart | 14/18 (78) | 13/13 (100) | – | |
| Percent fibrosis in slice of interest | 6.8 (0.3 to 16.2) | 7.7 (1.8 to 21.0) | – |
Values are mean ± SD, n (%), median (interquartile range), or n/N (%).
Analysis of variance/Pearson chi-square test.
DCM patients have elevated values compared with healthy control subjects and HCM patients.
All ejection fractions are significantly different.
HCM patients’ wall thickness and LV mass are elevated compared with those of healthy control subjects and DCM patients.
BP = blood pressure; DCM = dilated cardiomyopathy; E2A = secondary diffusion tensor eigenvector angle; EDV = end-diastolic volume; ESV = end-systolic volume; HCM = hypertrophic cardiomyopathy; LV = left ventricular.
In control subjects, low E2A values predominated in diastole (median: 18° [IQR: 15° to 28°]) with high E2A values in systole (median: 65° [IQR: 63° to 68°]), yielding a median E2A mobility of 45° (IQR: 39° to 50°) (Figure 5A). However, in HCM, E2A was raised in diastole (median: 48° [IQR: 41° to 58°]; p < 0.001), but similar to control subjects in systole (median: 74° [IQR: 70° to 76°]), yielding reduced E2A mobility compared with that of control subjects (median: 23° [IQR: 16° to 30°]; p < 0.001) (Figure 5A). And in the DCM cohort, diastolic E2A was normal (median: 23° [IQR: 17° to 26°]), but reduced in systole (median: 40° [IQR: 32° to 48°]) compared with that of control subjects, again yielding reduced mobility versus control subjects (median: 20° [IQR: 10° to 26°]; p < 0.001). There was no significant difference in E2A mobility between the 2 cardiomyopathies.
FIGURE 5. Plots of Median E2A.
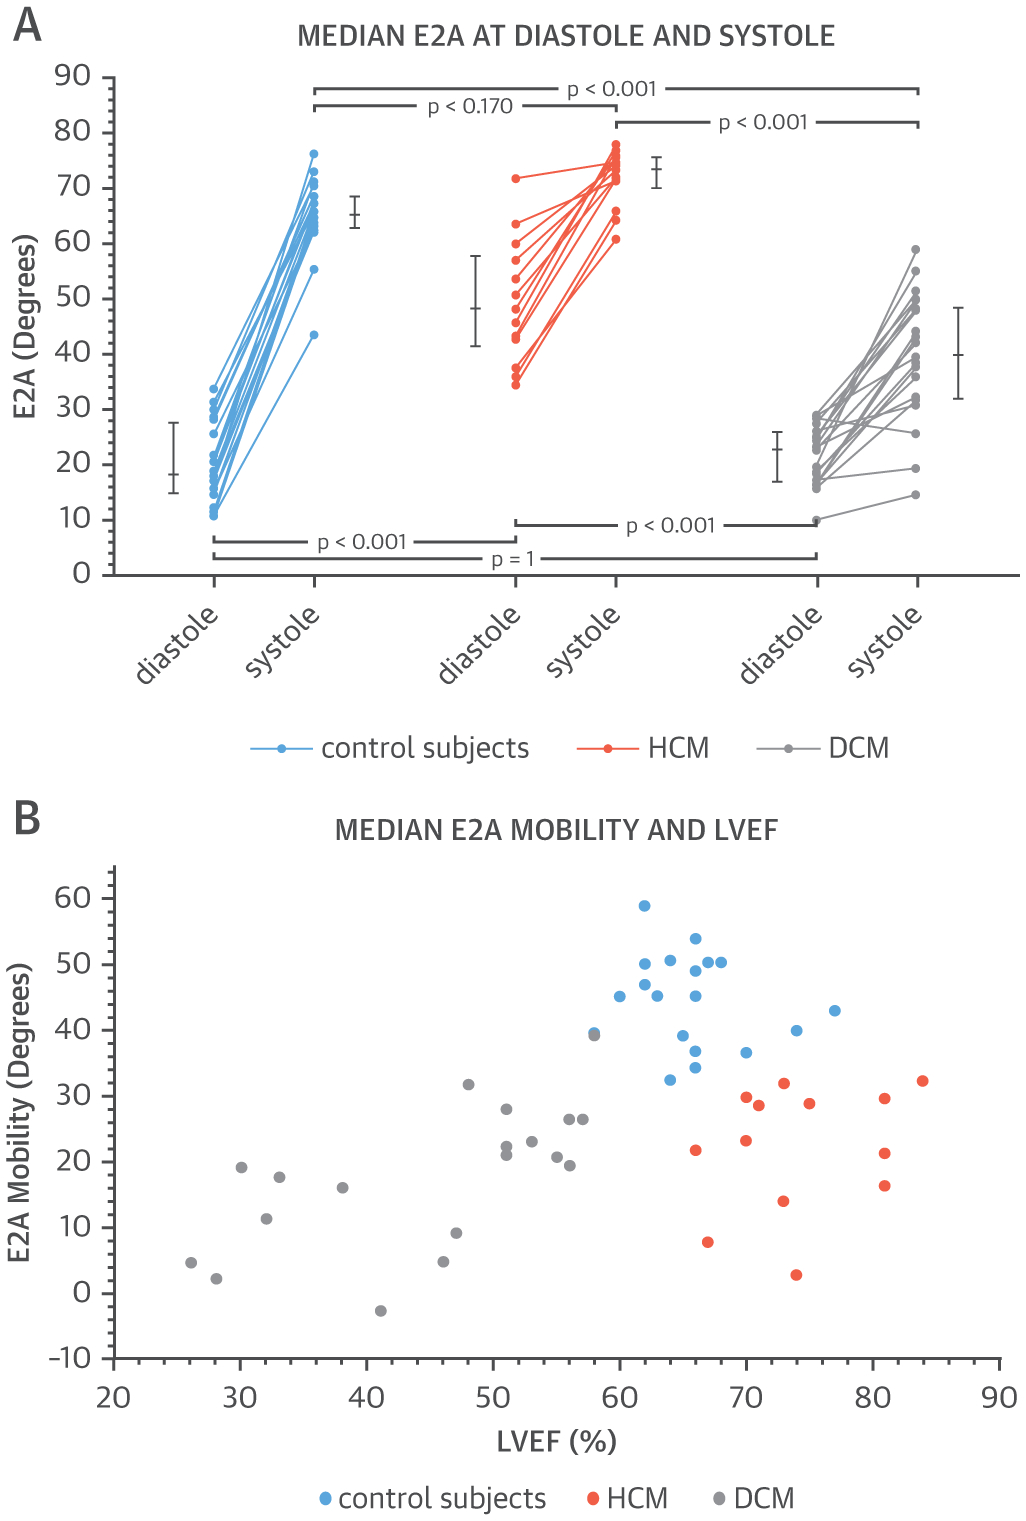
(A) Variations in diastolic and systolic secondary diffusion tensor eigenvector angle (E2A) are seen among patients with hypertrophic cardiomyopathy (HCM) or dilated cardiomyopathy (DCM) as well as control subjects. (B) These 3 groups are clearly differentiated when E2A is measured against left ventricular ejection fraction (LVEF).
The E2A mobility of all groups was plotted against EF (Figure 5B). There was clear clustering, with control subjects distinguished by their normal EF and high E2A mobility, HCM patients with elevated EF but low E2A mobility, and DCM patients with reduced EF and low E2A mobility. These differing E2A parameters are pictorially displayed in E2A maps and 3-dimensional glyphs (Figure 6). A control subject showed the normal change from diastole (wall-parallel with low E2A in blue) to systole (wall-perpendicular with high E2A in red). Correspondingly, Figure 6 shows similarities in HCM and control systolic E2A maps (red; wall perpendicular sheetlets), with more heterogeneous diastolic E2A maps (mix of red and blue; wall parallel and wall perpendicular sheetlets). By contrast, DCM and control diastolic E2A maps were alike (blue; wall parallel sheetlets), with more heterogeneous systolic E2A maps (mix of red and blue; wall parallel and wall perpendicular sheetlets). Figure 7 shows histograms displaying the distribution of helical and E2A in both diastole and systole. In DCM, the histogram of E2A indicated a predominance of low E2A values in diastole similar to control subjects, with a flat distribution of E2A values in systole. In HCM, the histogram of E2A indicated a flat distribution of E2A values in diastole, with a predominance of high E2A values in systole similar to control subjects.
FIGURE 6. E1A and E2A Maps.
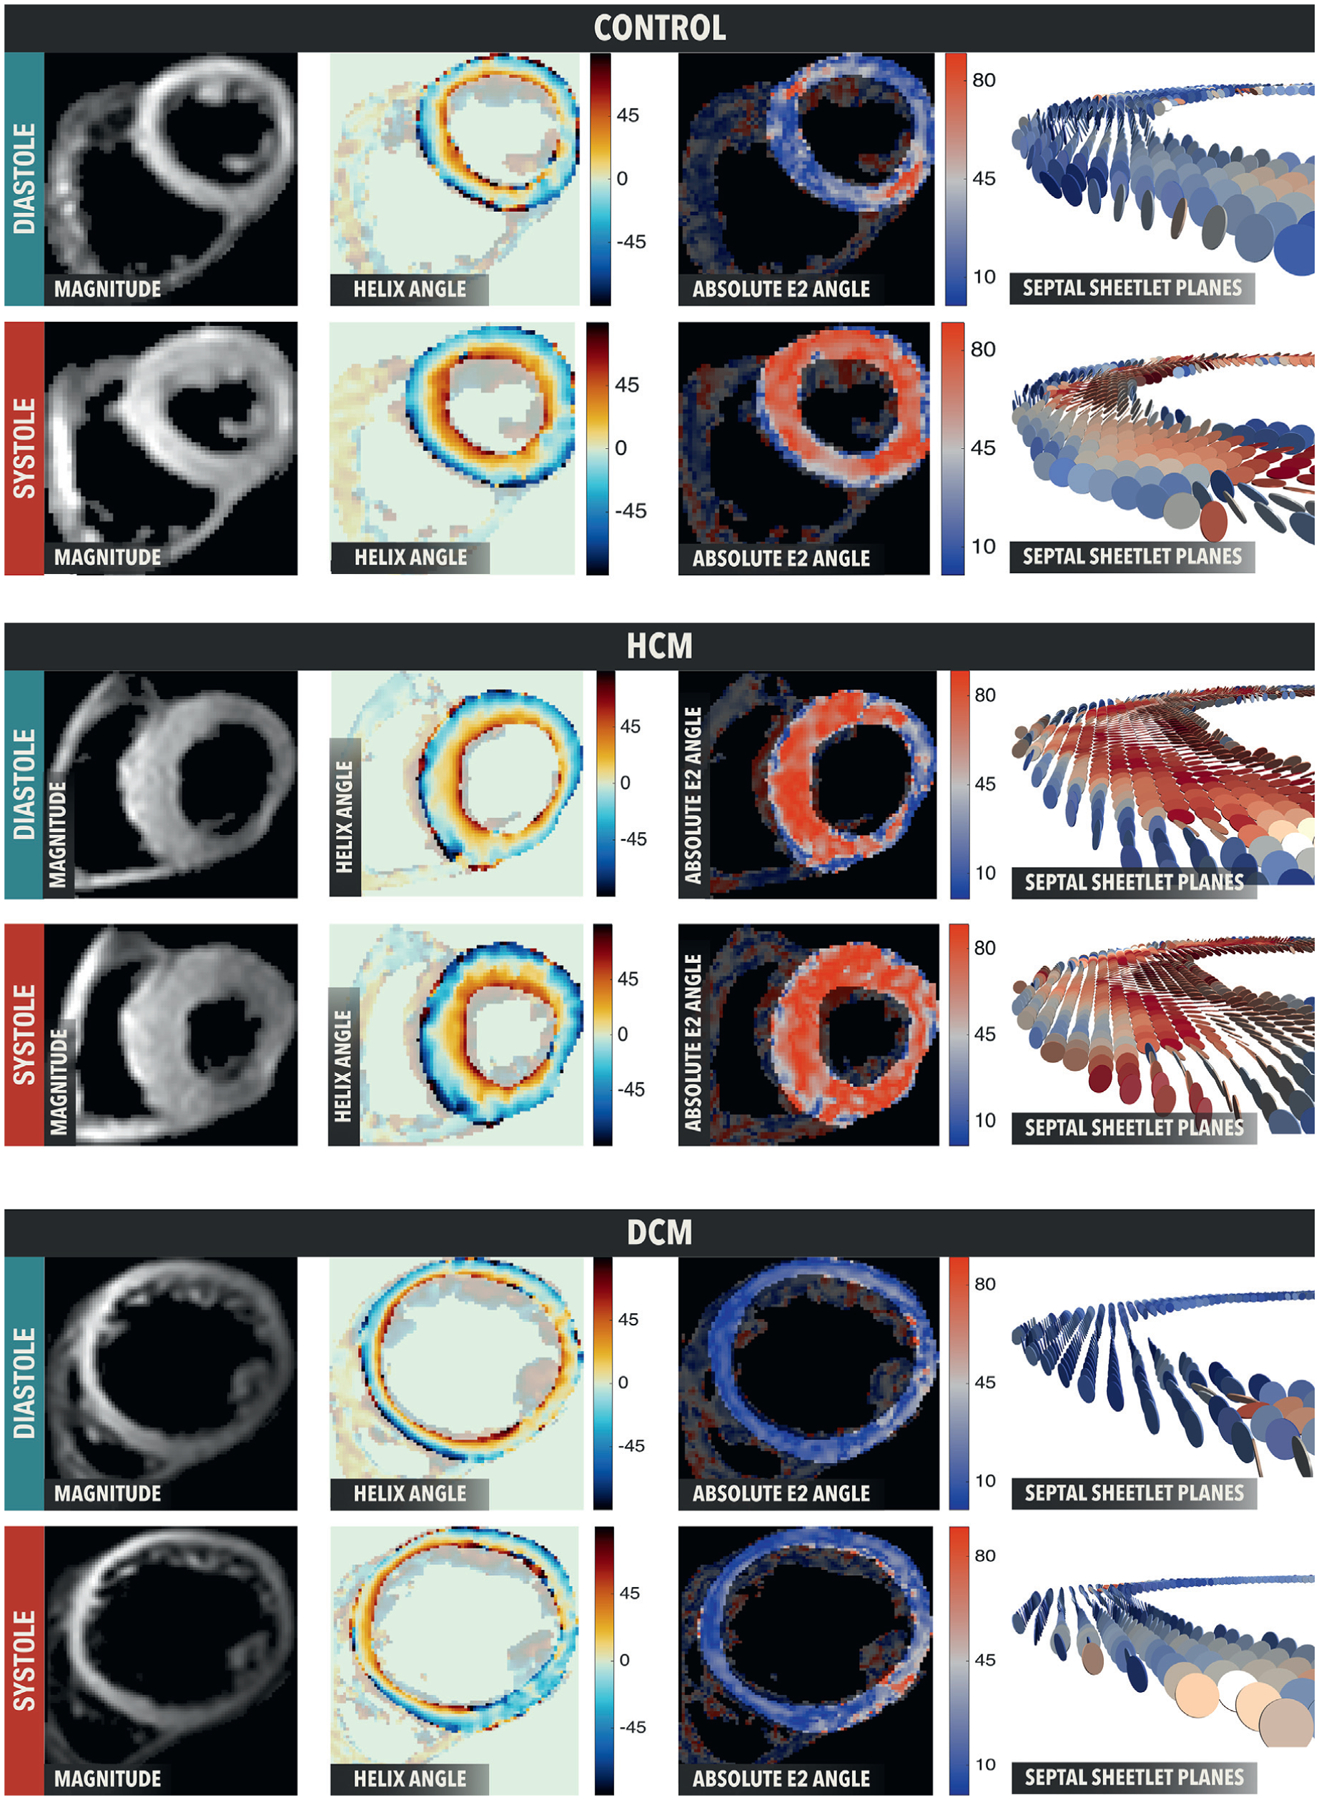
The E1A maps show similar E1A distributions in all populations and contractile states whereas E2A maps are color coded according to absolute E2 angle. E2A changes are from blue in diastole to red in systole in healthy control subjects. The HCM example takes a healthy systolic conformation (wall perpendicular sheetlets) but an incomplete diastolic conformation (mix of wall parallel and wall perpendicular sheetlets). The DCM example takes a healthy diastolic conformation (wall parallel sheetlets) but an incomplete systolic conformation (mix of wall parallel and wall perpendicular sheetlets). Abbreviations as in Figures 2, 4, and 5.
FIGURE 7. E1A and E2A Histograms at Diastole and Systole.
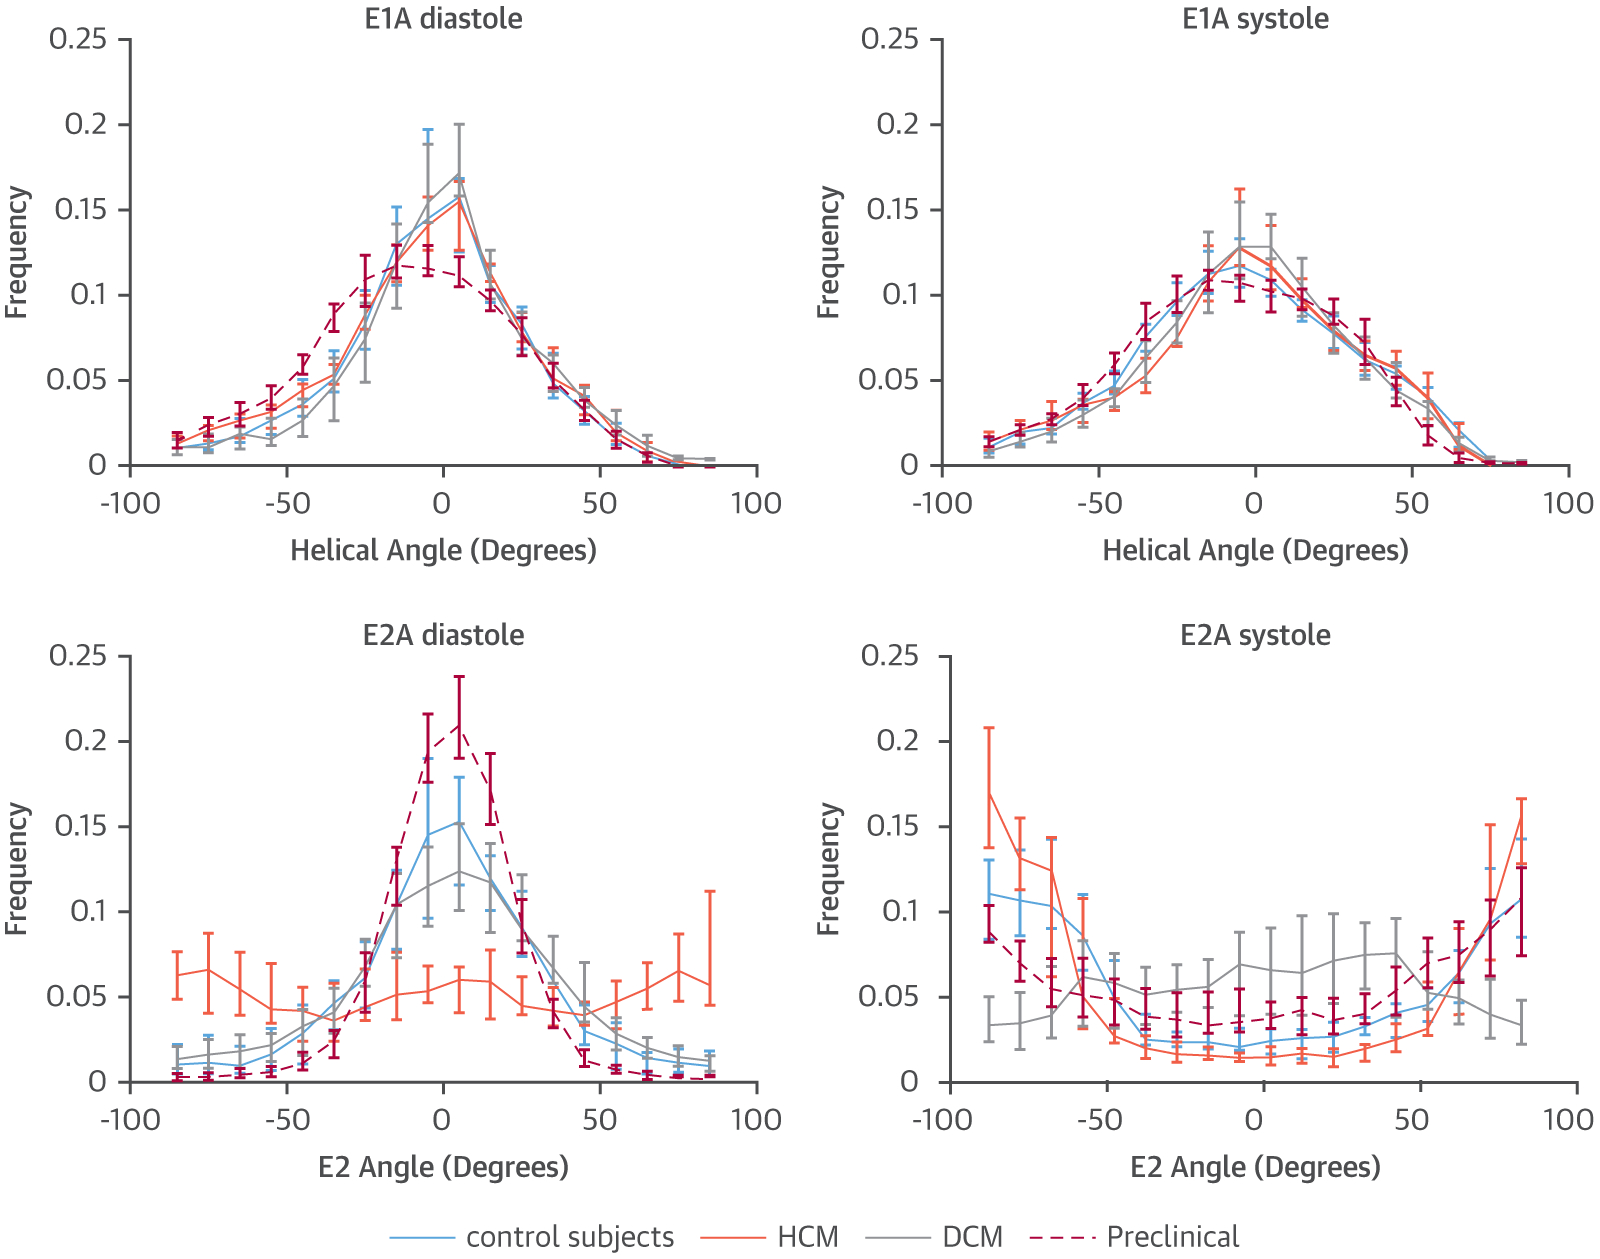
Whereas E1A histograms overlap for all groups in both diastole and systole, with a slightly broader E1A distribution in systole, E2A distribution in diastole is predominantly low in control subjects, swine (preclinical), and DCM, with a relatively wide even distribution in HCM. In systole, E2A is predominantly high in control subjects, swine, and HCM, with a relatively wide even distribution in DCM. Abbreviations as in Figures 2, 4, and 5.
An analysis of E2A values through the depth of the LV wall showed higher E2A mobility in the endocardium and mesocardium, and lowest E2A mobility in the epicardium (Online Figure 6).
Strain data were of sufficient quality for analysis in 13 of 19 DCM, 7 of 13 HCM, and 16 of 19 control subjects. Peak circumferential and radial strain values are shown in Table 2. The median radial strain in control subjects of 0.64 (IQR: 0.49 to 0.75) was significantly greater than for HCM and DCM (0.24 [IQR: 0.19 to 0.51] and 0.24 [IQR: 0.18 to 0.32], respectively; p < 0.001). A similar pattern was found for circumferential strain, with the greatest value for control subjects of −0.17 (IQR: −0.18 to −0.15) versus HCM and DCM (−0.14 [IQR: −0.14 to −0.11] and −0.12 [IQR: −0.14 to −0.01] respectively; p < 0.001). The reduction in strain in DCM and HCM concurred with reduced E2A mobility in both groups compared with control subjects, but contrasted with their low and high EF. Because both groups showed LV contractile impairment, the difference in EF was explained by the small LV cavity size and increased wall thickness in HCM (p < 0.001) (Table 2) (45).
DISCUSSION
This preclinical study results supported the hypothesis that both helical and sheetlet microstructural dynamics can be effectively interrogated in vivo in the beating heart with DT-CMR, as previously postulated (28). The current results also showed limited changes in helical microstructure, measured as E1A and HA by DT-CMR and histology, between different contractile states. By contrast, E2A increased substantially over the cardiac cycle. Changes in E2A with contraction were consistently observed under all experimental conditions and closely agreed with SA changes measured histologically (Central Illustration). These data confirmed in vivo E1A as an HA index and E2A as an SA index, supporting the hypothesis that reorientations of secondary laminar microstructures mediate myocardial thickening (28) and can be measured by DT-CMR. The change of SA from a low value in diastole to a high value in systole, which could be likened to the zig-zag linkage of a helically twisted lazy tong (Online Figure 7), represented the microstructural dynamic basis of the longitudinal and circumferential wall shortening that together deliver proportional WT far greater than that of any single cardiomyocyte.
CENTRAL ILLUSTRATION. Assessment of Myocardial Microstructural Dynamics by In Vivo Diffusion Tensor Cardiac Magnetic Resonance.
Myocardial microstructure dynamics can be characterized by in vivo diffusion tensor cardiac magnetic resonance (DT-CMR). E2 angle (E2A) is a DT-CMR index of myocardial sheetlet rotation; increase in E2A from diastole to systole was consistently observed in healthy swine in vivo, in situ, and ex vivo, and correlated well with histology. E2A changes in healthy volunteers match closely those in healthy swine. Varying E2A patterns emerged in patients with hypertrophic cardiomyopathy (HCM) and dilated cardiomyopathy (DCM). E2A mobility was highest for control subjects and reduced for HCM and DCM. Sheetlet function was abnormal in DCM with altered systolic conformation and reduced mobility, contrasting with HCM, which showed reduced mobility with altered diastolic conformation. These novel insights significantly improve understanding of contractile dysfunction at a level of noninvasive interrogation not previously available in humans. SA = sheetlet angle.
We showed, for the first time, a unique pattern of sheetlet behavior in DCM patients who exhibit normal diastolic conformation (wall-parallel sheetlets) but a mixture of wall-parallel and wall-perpendicular sheetlets during systole. The opposite pattern was observed in HCM, where a predominantly wall-perpendicular sheetlet orientation was observed in systole (as in control subjects) with a mix of wall-parallel and wall-perpendicular sheetlets during diastole. These observations provided new insight into aberrant dynamics of laminar microstructures in cardiomyopathies and identified distinct mechanisms associated with reduced strain development. Both DCM (low LVEF) and HCM (high LVEF) displayed similarly impaired strain compared with that of healthy control subjects (normal LVEF). In DCM, a failure to adequately rotate sheetlets to a contracted conformation in systole occurs, whereas in HCM a failure to adequately rotate sheetlets to a relaxed conformation in diastole predominates. In vivo DT-CMR may provide new mechanistic insights into altered ventricular mechanics, adverse remodeling, and the substrate for arrhythmogenesis in various clinical conditions including post-myocardial infarction, valvular heart disease, and inherited and congenital cardiac diseases. Other applications include identifying the potential for LV contractile recovery and reverse remodeling, and as a new monitoring marker for interventions to improve contractile function. These data could prove to be useful for modeling the microstructural dynamics of cardiac contraction.
Pioneering work proposed corrections for cyclical strain effects on in vivo DT-CMR measures assuming a simple homogeneous elastic material (30,42,46). However, with the growing appreciation that myocardial thickening entails the reorientations of laminar microstructures, we need to reconsider the relationship between myocardial strain and in vivo DT-CMR measures (5,28). Given the microscopic distances over which water diffusion occurs, the complex microstructural barriers, including sarcomere deformation and the fluid in intervening shear layers, need to be considered. The more complex model required to appropriately account for these is beyond the scope of this work. We compared in vivo, in situ, and ex vivo data to assess the influence of strain on in vivo DT-CMR data. The correspondence between in vivo, in situ, and ex vivo E2A changes indicated that the in vivo E2A observations originate predominantly from phasic changes of microstructural orientation. This was further supported by our model of slowed myocardial thickening induced by BaCl2 administration (47,48), which occurred in the absence of cyclical strain effects, and yet demonstrated remarkably similar behavior of E1A and E2A to that observed during in vivo experiments. Comparisons of the relationships between ΔE2A and ΔWT in vivo and with BaCl2 in situ provided an estimate of the maximum potential influence of cyclical strain to in vivo E2A of ~17%. This might be an overestimate, because the different loading conditions between in vivo and BaCl2 in situ experiments might also account for some of the differences observed experimentally. The changes in E2A shown in DCM and HCM greatly exceeded this potential confounder. Furthermore, the differences in the diastolic and systolic conformations of E2A in HCM and DCM, respectively, occurred in the context of similarly impaired strains, further supporting E2A mobility as a robust and clinically relevant measure.
STUDY LIMITATIONS.
Approximately one-half the DCM group had only mildly impaired LVEF. Inclusion of cases with more impaired LVEF might have produced even lower E2A mobilities. However, this patient population already showed significant differences compared with those of healthy control subjects. Histological sectioning with 2-dimensional analysis was of only 1 transmural tissue block per heart; 3-dimensional isotropic whole heart histology (3) would be ideal, but to our knowledge has not been reported due to limitations of histological sectioning and image processing. Trimming of tissue blocks during histological preparation resulted in discarding ~26% of the epicardium, creating loss of the steepest epicardial HA values and reduced HAR.
The preponderance of circumferential E1A suggested by the histograms was at odds with the plots of E1A against wall depth (Online Figure 8), which showed a relatively smooth transition from epicardium to endocardium. This mismatch is inherent to these 2 different measures of E1A distribution within the LV. Histograms displayed the frequency distribution of E1A over the whole LV but contained no information about its transmural arrangement. Therefore, histograms were less sensitive to the spatial resolution of the underlying DT-CMR data, though they might still be affected by the exclusion of the outermost epicardial and innermost endocardial layers, leading to a slight reduction of the frequency of the highest and lowest E1A values. Plots of E1A against wall depth displayed the transmural distribution of E1A but contained no information about the frequency of each E1A value. Therefore, they were highly sensitive to the spatial resolution of the underlying DT-CMR data. Furthermore, the averaging of several transmural line profiles might lead to smoother lines and reduced plateau at E1A w0. DT-CMR has limited spatial resolution with thousands of cardiomyocytes arranged in hundreds of sheetlets in each voxel (28). Therefore, E1A and E2A averaged all helical and sheetlet directions in the voxel and might not detect changes at a histological scale. Sheetlets can occur in countersloping alignments (7,31,49). However, our histological analyses supported the predominance of a single sheetlet population orientation in most sections. Limitations in spatial resolution, together with the fact that DT-CMR can only resolve the predominant sheetlet population in any given voxel, precluded an accurate analysis of the transmural distribution of E2A. Higher spatial resolution acquisitions combined with higher angular diffusion resolution techniques such as diffusion spectrum imaging (24) may provide further insights, although current acquisition times are clinically prohibitive.
CONCLUSIONS
We showed that myocardial sheetlet reorientation in the loaded and beating heart in vivo was the predominant mechanism underlying systolic LV wall thickening, and that primary and secondary microstructures in the myocardium and their dynamic reorientations during cardiac contraction can be studied noninvasively by in vivo DT-CMR. In DCM, DT-CMR showed reduced sheetlet mobility and a diastolic conformation, contrasting with the reduced mobility and systolic conformation seen in HCM, despite similarly reduced systolic myocardial strain. In general terms, at the microstructural level, this indicated a failure of systolic sheetlet rotation to a contracted conformation in DCM and a failure of rotation of sheetlets to a relaxed conformation in diastole in HCM. These results provide the rationale for further study of the microstructural dynamics of cardiac contraction and myocardial dysfunction using in vivo DT-CMR to provide new diagnostic and prognostic information in human cardiac disease.
Supplementary Material
PERSPECTIVES.
COMPETENCY IN MEDICAL KNOWLEDGE:
Myocardial sheetlet function is the predominant microstructural mechanism responsible for contractile WT. In vivo DT-CMR can characterize the architectural arrangement of cardiomyocytes throughout the cardiac cycle. Designation of a specific vector of diffusion relative to the tangential wall plane identifies specific patterns of deranged sheetlet orientation and mobility in patients with various forms of cardiomyopathy.
TRANSLATIONAL OUTLOOK:
Clinical studies could apply DT-CMR as a tool to understanding the pathogenesis, natural history, and response to therapeutic interventions in patients with cardiomyopathy.
ACKNOWLEDGMENTS
The authors thank Joni Taylor, Shawn Kozlov, and Katherine Lucas for expert animal care and Rick Wage and Gill Smith for their expert CMR technical help. They would also like to thank Prof. Stephen M. Hewitt, Dr. Candice Perry, and Dr. Kris Ylaya for the use of the Nanozoomer.
This work was supported by the National Heart, Lung, and Blood Institute, National Institutes of Health, Division of Intramural Research, Department of Health and Human Services (HL004607-14CPB); the British Heart Foundation; and the National Institute of Health Research Cardiovascular Biomedical Research Unit at the Royal Brompton Hospital and Imperial College, London. Dr. Gatehouse has a departmental research agreement and collaborates on other work with Siemens. Dr. Ennis has received research support from Siemens Medical Solutions. Dr. Arai is a principal investigator on a U.S. government Cooperative Research and Development Agreement with Siemens Medical Solutions (HL-CR-05-004); and has a research agreement with Bayer. Dr. Pennell is a shareholder and Director of Cardiovascular Imaging Solutions; and has received research support from Siemens. Royal Brompton Hospital has research collaboration agreements with Siemens AG Medical Solutions. All other authors have reported that they have no relationships relevant to the contents of this paper to disclose.
ABBREVIATIONS AND ACRONYMS
- CMR
cardiac magnetic resonance
- DCM
dilated cardiomyopathy
- DT
diffusion tensor
- E1A
primary diffusion tensor eigenvector angle
- E1AR
E1 angle range
- E2A
secondary diffusion tensor eigenvector angle
- EF
ejection fraction
- HA
helix angle
- HAR
helix angle range
- HCM
hypertrophic cardiomyopathy
- IQR
interquartile range
- LV
left ventricle
- SA
sheetlet angle
- WT
wall thickness
Footnotes
APPENDIX For a supplemental Methods sections as well as figures and videos, please see the online version of this article.
REFERENCES
- 1.Streeter DD, Bassett DL. An engineering analysis of myocardial fiber orientation in pigs left ventricle in systole. Anat Rec 1966;155:503. [Google Scholar]
- 2.Streeter DD Jr., Spotnitz HM, Patel DP, Ross J Jr., Sonnenblick EH. Fiber orientation in canine left ventricle during diastole and systole. Circ Res 1969;24:339–47. [DOI] [PubMed] [Google Scholar]
- 3.Sands GB, Gerneke DA, Hooks DA, Green CR, Smaill BH, LeGrice IJ. Automated imaging of extended tissue volumes using confocal microscopy. Microsc Res Tech 2005; 67:227–39. [DOI] [PubMed] [Google Scholar]
- 4.Smerup M, Nielsen E, Agger P, et al. The three-dimensional arrangement of the myocytes aggregated together within the mammalian ventricular myocardium. Anat Rec (Hoboken) 2009;292:1–11. [DOI] [PubMed] [Google Scholar]
- 5.Axel L, Wedeen VJ, Ennis DB. Probing dynamic myocardial microstructure with cardiac magnetic resonance diffusion tensor imaging. J Cardiovasc Magn Reson 2014;16:89. [DOI] [PMC free article] [PubMed] [Google Scholar]
- 6.Hales PW, Schneider JE, Burton RA, Wright BJ, Bollensdorff C, Kohl P. Histo-anatomical structure of the living isolated rat heart in two contraction states assessed by diffusion tensor MRI. Prog Biophys Mol Biol 2012;110:319–30. [DOI] [PMC free article] [PubMed] [Google Scholar]
- 7.Harrington K, Rodriguez F, Cheng A, et al. Direct measurement of transmural laminar architecture in the anterolateral wall of the ovine left ventricle: new implications for wall thickening mechanics. Am J Physiol Heart Circ Physiol 2005;288: H1324–30. [DOI] [PMC free article] [PubMed] [Google Scholar]
- 8.Spotnitz HM, Spotnitz WD, Cottrell TS, Spiro D, Sonnenblick EH. Cellular basis for volume related wall thickness changes in Rat left-ventricle. J Mol Cell Cardiol 1974;6:317–31. [DOI] [PubMed] [Google Scholar]
- 9.Costa KD, Takayama Y, McCulloch AD, Covell JW. Laminar fiber architecture and three-dimensional systolic mechanics in canine ventricular myocardium. Am J Physiol 1999;276: H595–607. [DOI] [PubMed] [Google Scholar]
- 10.LeGrice IJ, Takayama Y, Covell JW. Transverse shear along myocardial cleavage planes provides a mechanism for normal systolic wall thickening. Circ Res 1995;77:182–93. [DOI] [PubMed] [Google Scholar]
- 11.Takayama Y, Costa KD, Covell JW. Contribution of laminar myofiber architecture to load-dependent changes in mechanics of LV myocardium. Am J Physiol Heart Circ Physiol 2002;282: H1510–20. [DOI] [PubMed] [Google Scholar]
- 12.Noble D A theory of biological relativity: no privileged level of causation. Interface Focus 2012; 2:55–64. [DOI] [PMC free article] [PubMed] [Google Scholar]
- 13.Elliott P, Andersson B, Arbustini E, et al. Classification of the cardiomyopathies: a position statement from the European Society of Cardiology Working Group on Myocardial and Pericardial Diseases. Eur Heart J 2008;29:270–6. [DOI] [PubMed] [Google Scholar]
- 14.Modesto K, Sengupta PP. Myocardial mechanics in cardiomyopathies. Prog Cardiovasc Dis 2014;57:111–24. [DOI] [PubMed] [Google Scholar]
- 15.Elliott PM, Anastasakis A, Borger MA, et al. 2014 ESC guidelines on diagnosis and management of hypertrophic cardiomyopathy: the Task Force for the Diagnosis and Management of Hypertrophic Cardiomyopathy of the European Society of Cardiology (ESC). Eur Heart J 2014;35: 2733–79. [DOI] [PubMed] [Google Scholar]
- 16.Felker GM, Thompson RE, Hare JM, et al. Underlying causes and long-term survival in patients with initially unexplained cardiomyopathy. N Engl J Med 2000;342:1077–84. [DOI] [PubMed] [Google Scholar]
- 17.Gulati A, Jabbour A, Ismail TF, et al. Association of fibrosis with mortality and sudden cardiac death in patients with nonischemic dilated cardiomyopathy. JAMA 2013;309:896–908. [DOI] [PubMed] [Google Scholar]
- 18.McCrohon JA, Moon JC, Prasad SK, et al. Differentiation of heart failure related to dilated cardiomyopathy and coronary artery disease using gadolinium-enhanced cardiovascular magnetic resonance. Circulation 2003; 108:54–9. [DOI] [PubMed] [Google Scholar]
- 19.Valente AM, Lakdawala NK, Powell AJ, et al. Comparison of echocardiographic and cardiac magnetic resonance imaging in hypertrophic cardiomyopathy sarcomere mutation carriers without left ventricular hypertrophy. Circ Cardiovasc Genet 2013;6:230–7. [DOI] [PMC free article] [PubMed] [Google Scholar]
- 20.O’Hanlon R, Grasso A, Roughton M, et al. Prognostic significance of myocardial fibrosis in hypertrophic cardiomyopathy. J Am Coll Cardiol 2010;56:867–74. [DOI] [PubMed] [Google Scholar]
- 21.Richardson P, McKenna W, Bristow M, et al. Report of the 1995 World Health Organization/International Society and Federation of Cardiology Task Force on the Definition and Classification of cardiomyopathies. Circulation 1996;93: 841–2. [DOI] [PubMed] [Google Scholar]
- 22.Basser PJ. Inferring microstructural features and the physiological state of tissues from diffusion-weighted images. NMR Biomed 1995;8: 333–44. [DOI] [PubMed] [Google Scholar]
- 23.Basser PJ, Mattiello J, LeBihan D. MR diffusion tensor spectroscopy and imaging. Biophys J 1994; 66:259–67. [DOI] [PMC free article] [PubMed] [Google Scholar]
- 24.Edelman RR, Gaa J, Wedeen VJ, et al. In vivo measurement of water diffusion in the human heart. Magn Reson Med 1994;32:423–8. [DOI] [PubMed] [Google Scholar]
- 25.Reese TG, Weisskoff RM, Smith RN, Rosen BR, Dinsmore RE, Wedeen VJ. Imaging myocardial fiber architecture in vivo with magnetic resonance. Magn Reson Med 1995;34:786–91. [DOI] [PubMed] [Google Scholar]
- 26.Garrido L, Wedeen VJ, Kwong KK, Spencer UM, Kantor HL. Anisotropy of water diffusion in the myocardium of the rat. Circ Res 1994;74:789–93. [DOI] [PubMed] [Google Scholar]
- 27.Gamper U, Boesiger P, Kozerke S. Diffusion imaging of the in vivo heart using spin echoes—considerations on bulk motion sensitivity. Magn Reson Med 2007;57:331–7. [DOI] [PubMed] [Google Scholar]
- 28.Ferreira PF, Kilner PJ, McGill LA, et al. In vivo cardiovascular magnetic resonance diffusion tensor imaging shows evidence of abnormal myocardial laminar orientations and mobility in hypertrophic cardiomyopathy. J Cardiovasc Magn Reson 2014;16:87. [DOI] [PMC free article] [PubMed] [Google Scholar]
- 29.Tseng WY, Dou J, Reese TG, Wedeen VJ. Imaging myocardial fiber disarray and intramural strain hypokinesis in hypertrophic cardiomyopathy with MRI. J Magn Reson Imaging 2006;23:1–8. [DOI] [PubMed] [Google Scholar]
- 30.Dou J, Reese TG, Tseng WY, Wedeen VJ. Cardiac diffusion MRI without motion effects. Magn Reson Med 2002;48:105–14. [DOI] [PubMed] [Google Scholar]
- 31.Kung GL, Nguyen TC, Itoh A, et al. The presence of two local myocardial sheet populations confirmed by diffusion tensor MRI and histological validation. J Magn Reson Imaging 2011;34: 1080–91. [DOI] [PMC free article] [PubMed] [Google Scholar]
- 32.Scollan D, Holmes A, Winslow R, Forder J. Histological validation of myocardial microstructure obtained from diffusion tensor magnetic resonance imaging. Am J Physiol 1998;275: H2308–18. [DOI] [PubMed] [Google Scholar]
- 33.Scollan DF, Holmes A, Zhang J, Winslow RL. Reconstruction of cardiac ventricular geometry and fiber orientation using magnetic resonance imaging. Ann Biomed Eng 2000;28:934–44. [DOI] [PMC free article] [PubMed] [Google Scholar]
- 34.Chen J, Liu W, Zhang H, et al. Regional ventricular wall thickening reflects changes in cardiac fiber and sheet structure during contraction: quantification with diffusion tensor MRI. Am J Physiol Heart Circ Physiol 2005;289:H1898–907. [DOI] [PubMed] [Google Scholar]
- 35.Dou J, Tseng WY, Reese TG, Wedeen VJ. Combined diffusion and strain MRI reveals structure and function of human myocardial laminar sheets in vivo. Magn Reson Med 2003;50:107–13. [DOI] [PubMed] [Google Scholar]
- 36.Stoeck CT, Kalinowska A, von Deuster C, et al. Dual-phase cardiac diffusion tensor imaging with strain correction. PLoS One 2014;9:e107159. [DOI] [PMC free article] [PubMed] [Google Scholar]
- 37.Helm PA, Younes L, Beg MF, et al. Evidence of structural remodeling in the dyssynchronous failing heart. Circ Res 2006;98:125–32. [DOI] [PubMed] [Google Scholar]
- 38.Helm PA, Tseng HJ, Younes L, McVeigh ER, Winslow RL. Ex vivo 3D diffusion tensor imaging and quantification of cardiac laminar structure. Magn Reson Med 2005;54:850–9. [DOI] [PMC free article] [PubMed] [Google Scholar]
- 39.Cheng YJ, Lang D, Caruthers SD, Efimov IR, Chen J, Wickline SA. Focal but reversible diastolic sheet dysfunction reflects regional calcium mishandling in dystrophic mdx mouse hearts. Am J Physiol Heart Circ Physiol 2012;303:H559–68. [DOI] [PMC free article] [PubMed] [Google Scholar]
- 40.Nielles-Vallespin S, Mekkaoui C, Gatehouse P, et al. In vivo diffusion tensor MRI of the human heart: reproducibility of breath-hold and navigator-based approaches. Magn Reson Med 2012;70:454–65. [DOI] [PMC free article] [PubMed] [Google Scholar]
- 41.McGill LA, Ismail TF, Nielles-Vallespin S, et al. Reproducibility of in-vivo diffusion tensor cardiovascular magnetic resonance in hypertrophic cardiomyopathy. J Cardiovasc Magn Reson 2012; 14:86. [DOI] [PMC free article] [PubMed] [Google Scholar]
- 42.Reese TG, Wedeen VJ, Weisskoff RM. Measuring diffusion in the presence of material strain. J Magn Reson B 1996;112:253–8. [DOI] [PubMed] [Google Scholar]
- 43.Scott AD, Ferreira PF, Nielles-Vallespin S, et al. Optimal diffusion weighting for in vivo cardiac diffusion tensor imaging. Magn Reson Med 2015;74:420–30. [DOI] [PubMed] [Google Scholar]
- 44.Froeling M, Strijkers G, Nederveen A, Chamuleau S, Luijten P. Diffusion tensor MRI of the heart—in vivo imaging of myocardial fiber architecture. Curr Cardiovasc Imaging Rep 2014;7: 1–11. [Google Scholar]
- 45.MacIver DH, Adeniran I, Zhang H. Left ventricular ejection fraction is determined by both global myocardial strain and wall thickness. IJC Heart Vasculature 2015;7:113–8. [DOI] [PMC free article] [PubMed] [Google Scholar]
- 46.Tseng WY, Reese TG, Weisskoff RM, Wedeen VJ. Cardiac diffusion tensor MRI in vivo without strain correction. Magn Reson Med 1999; 42:393–403. [DOI] [PubMed] [Google Scholar]
- 47.Munch DF, Comer HT, Downey JM. Barium contracture: a model for systole. Am J Physiol 1980;239:H438–42. [DOI] [PubMed] [Google Scholar]
- 48.Saeki Y, Shibata T, Shiozawa K. Excitation-contraction coupling in mammalian cardiac muscle during Ba2þ-induced contracture. Am J Physiol 1981;240:H216–21. [DOI] [PubMed] [Google Scholar]
- 49.Arts T, Costa KD, Covell JW, McCulloch AD. Relating myocardial laminar architecture to shear strain and muscle fiber orientation. Am J Physiol Heart Circ Physiol 2001;280:H2222–9. [DOI] [PubMed] [Google Scholar]
Associated Data
This section collects any data citations, data availability statements, or supplementary materials included in this article.