

Abstract
The linkage between neutrophil death and the development of autoimmunity has not been thoroughly explored. Here, we show that neutrophils from either lupus-prone mice or patients with systemic lupus erythematosus (SLE) undergo ferroptosis. Mechanistically, autoantibodies and interferon-α present in the sera induce neutrophil ferroptosis through enhanced binding of the transcriptional repressor CREMα to the glutathione peroxidase 4 (Gpx4, the key ferroptosis regulator) promoter, which leads to suppressed expression of Gpx4 and subsequent elevation of lipid-reactive oxygen species (lipid-ROS). Moreover, the findings that mice with neutrophil-specific Gpx4 haploinsufficiency recapitulate key clinical features of human SLE including autoantibodies, neutropenia, skin lesions and proteinuria and that the treatment with a specific ferroptosis inhibitor significantly ameliorates disease severity in lupus-prone mice, reveal the role of neutrophil ferroptosis in lupus pathogenesis. Together, our data demonstrate that neutrophil ferroptosis is an important driver of neutropenia in SLE and heavily contributes to disease manifestations.
Keywords: Systemic lupus erythematosus, Neutrophil, Ferroptosis, GPX4
INTRODUCTION
Systemic lupus erythematosus (SLE) is a chronic debilitating autoimmune disease characterized by a global loss of immune tolerance with activation of both innate and adaptive branches of the immune system1. Central features include accumulated non-cleared cell debris derived from various forms of cell death, elevated type I IFN signaling and increased autoantibody production2. Neutrophils are the dominant immune cells in the circulation and contribute to a variety of autoimmune disorders. In patients with SLE, a number of abnormalities in neutrophils have been reported, including impaired phagocytosis, increased aggregation and accelerated cell death3. Elevated levels of anti-neutrophil cytoplasmic antibodies in the sera of patients with SLE suggest that neutrophil death together with ineffective clearance of the subsequent debris provide a stable source of autoantigens for disease initiation and propagation4. However, the main forms of neutrophil death in SLE and the underlying mechanisms have not been fully characterized.
Ferroptosis is a newly recognized form of programmed cell death that is morphologically, biochemically, and genetically distinct from other forms of regulated cell death such as apoptosis, necroptosis and pyroptosis5. It is characterized by production of lipid-reactive oxygen species (ROS) and iron overload, leading to caspase- and necrosome-independent cell death. As a key regulator of ferroptosis, phospholipid peroxidase glutathione peroxidase 4 (GPX4) can detoxify hydroperoxides in membrane lipids directly, thereby reducing damage to membrane function and preventing the generation of lipid peroxidation-derived reactive products and mitigating ferroptosis6, 7, 8. Inhibition or ablation of GPX4 induces ferroptosis in different cell types9, 10, 11. Here we describe how autoantibodies and type I IFNs cooperatively induce neutrophil ferroptosis in lupus through the CaMKIV/CREMα signaling axis. Importantly, the observations that neutrophil-specific Gpx4 haploinsufficiency in mice give rise to SLE-like phenotypes and in vivo inhibition of ferroptosis mitigates disease progression in lupus prone MRL/lpr mice, confirm the immunopathogenic effects of neutrophil ferroptosis. Therefore, our results, reported herein, identify a novel central cellular defect and provide the missing link between neutropenia and lupus pathogenesis.
RESULTS
Serum factors modulate neutrophil viability in SLE
To substantiate the concept that neutropenia is a common feature in SLE, a total of 126 patients with SLE were included in the analysis (Supplementary Table 1-3). Compared with healthy controls (HC), neutrophil counts in patients with SLE were significantly reduced, with 35% of them presenting a neutrophil count below 2 × 10⁹/L. In contrast, this was not observed in patients with other autoimmune diseases (Fig. 1a). Moreover, to exclude the potential interference of treatment, 98 patients with newly diagnosed untreated SLE were selected and as expected, the neutrophil counts correlated inversely with disease activity as measured by SLE Disease Activity Index (SLEDAI) (Fig. 1b). Importantly, the numbers of neutrophils were restored to normal levels after effective treatment with standard of care medications. (Fig. 1c, Supplementary Table 4).
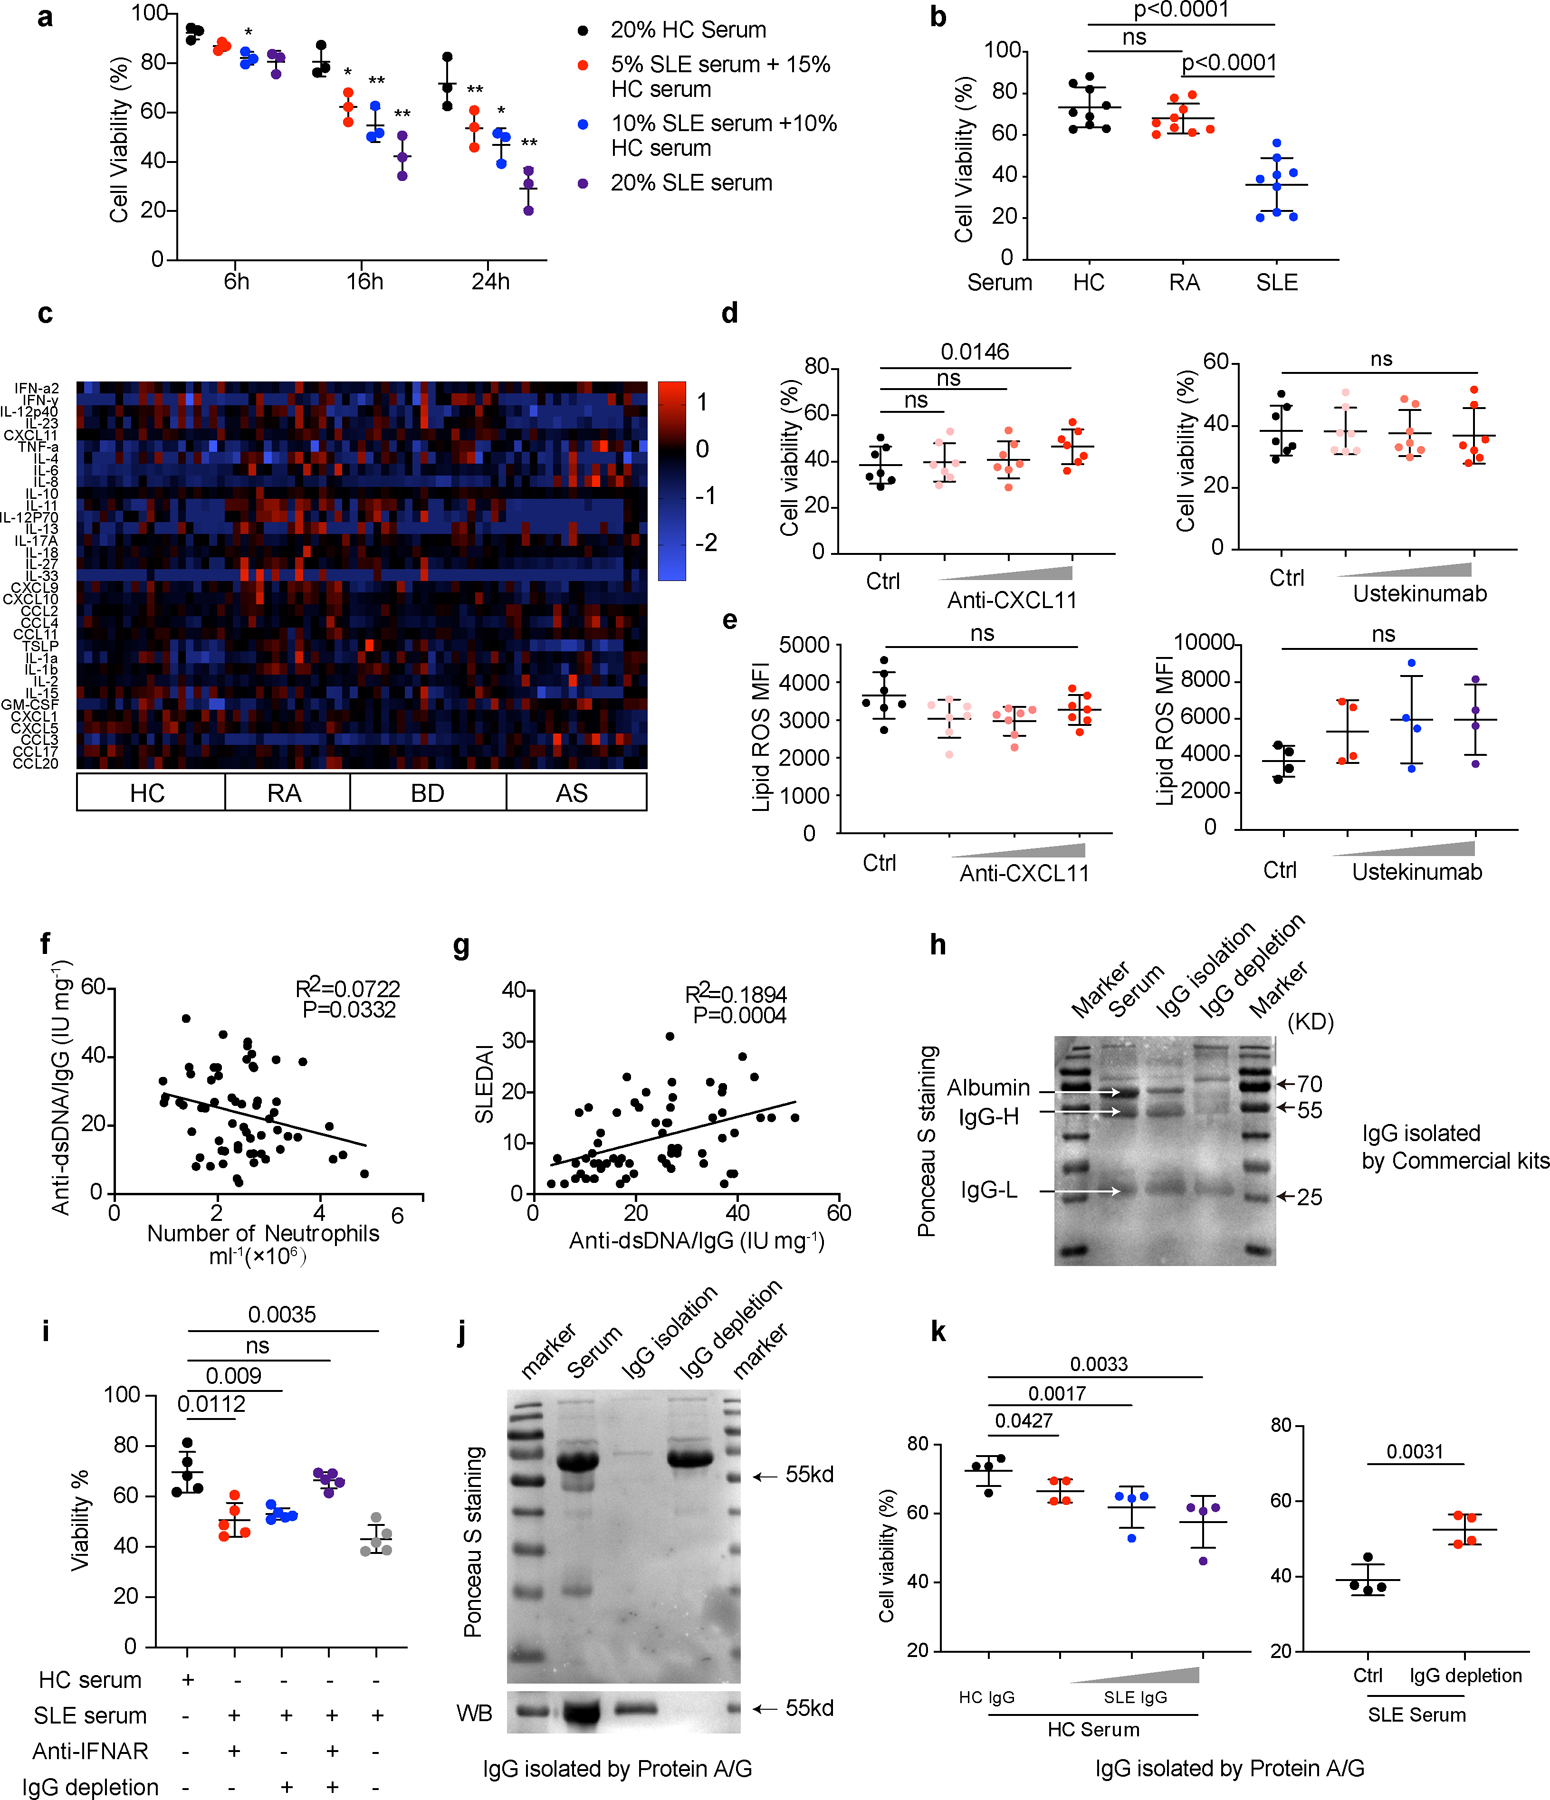
Fig. 1. SLE IgG and IFNα modulate neutrophil viability.
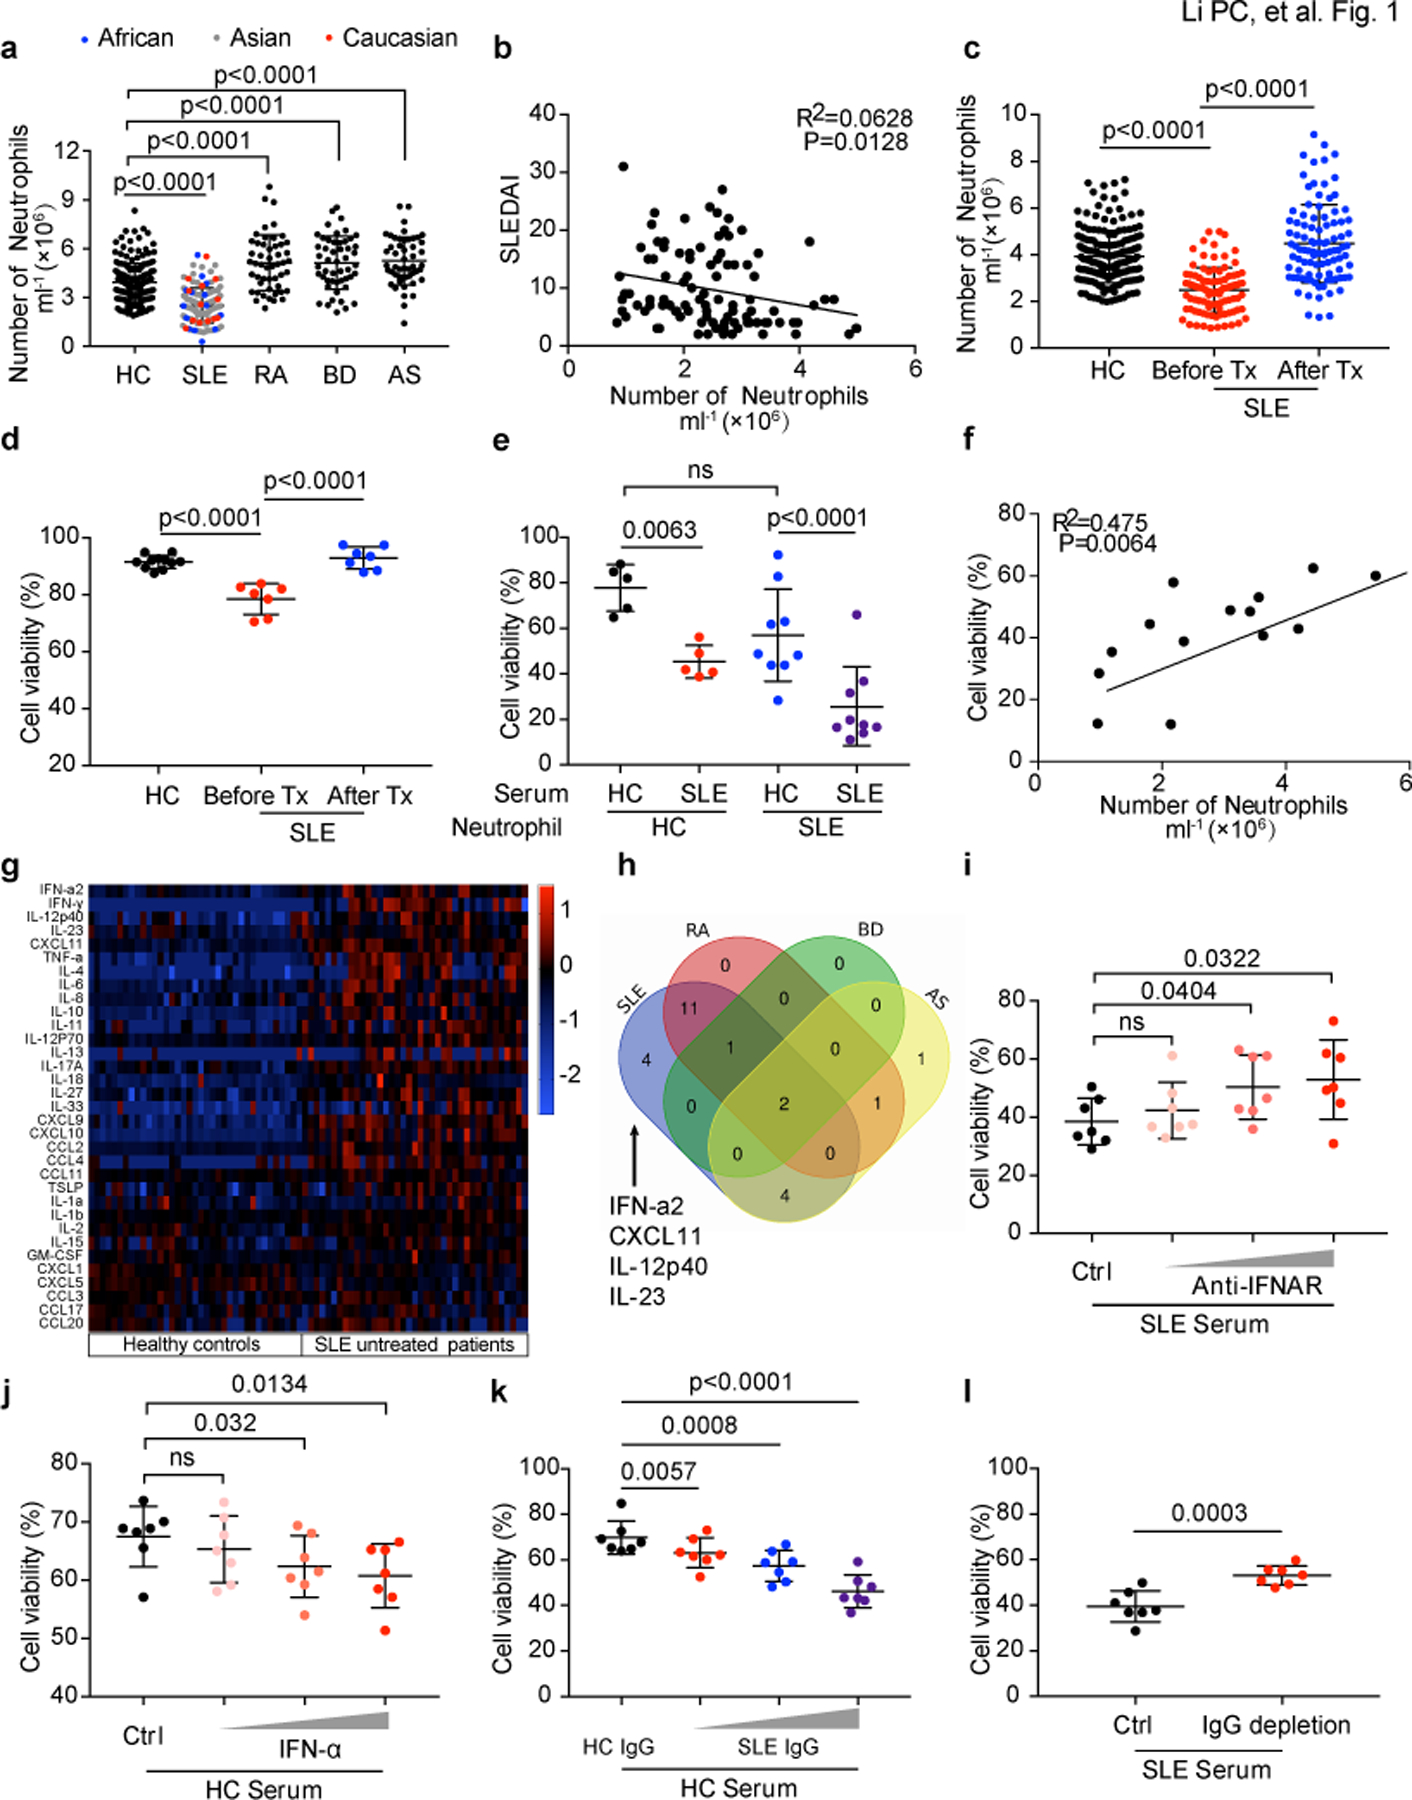
a. The numbers of peripheral neutrophils from either healthy controls (HC) or patients with different rheumatic diseases including systemic lupus erythematosus (SLE), rheumatoid arthritis (RA), Behcet’s disease (BD) and ankylosing spondylitis (AS) (HC: n=188, SLE: n=126, RA: n=50, BD: n=50, AS: n=50). b. The numbers of peripheral neutrophils in SLE correlated negatively with disease activities as measured by systemic lupus erythematosus disease activity index (SLEDAI) (n=98). c. The numbers of peripheral neutrophils in SLE (n=98) patients before and after treatments vs. HCs. d. Flow cytometry quantification of cell viability of neutrophils freshly isolated from peripheral blood of SLE patients before and after treatments (n=7) vs. HCs (n=11) (live cells were defined as 7AAD-AnexinV-). e. Flow cytometry quantification of cell viability of neutrophils cultured in vitro with 20 % serum from either HCs (n=5) or SLE patients (n=9) for 16 hours. f. The in vitro effect of SLE sera on neutrophil cell viability corelated with the peripheral neutrophil counts in SLE patients (n=14). g. Multiplex cytokine array of the inflammatory factors in sera from SLE patients vs. HCs (SLE=39, HC=37). h. Venn diagram showed serum factors specifically increased in SLE. i-j. Flow cytometry quantification of cell viability of neutrophils (n=7) cultured in vitro with SLE serum supplemented with blocking antibody targeting IFNα at different dosages (0.1, 1, 10 µg ml−1), or with HC serum with the addition of IFNα at different dosages (10^3, 10^4, 10^5 U ml−1) for 16 hours. k-l. Flow cytometry quantification of cell viability of neutrophils (n=7) from HC cultured with HC serum with the addition of SLE IgG at different dosages (1.2, 2.4, 3.6 g L−1), or SLE serum with/without IgG depletion, for 16 hours. Data are shown as mean ± SD. ns p > 0.05. Two-tailed unpaired or paired Student’s t-test was applied.
We next evaluated the viability (live cells were gated as 7AAD− Annexin V−) of fresh neutrophils isolated from SLE patient blood and as expected, they displayed lower cell viability compared with those from HCs; notably, effective treatments helped restore neutrophil viability (Fig. 1d). Collectively, these observations led us to hypothesize that the sera from patients with active SLE might promote neutrophil death. As expected, neutrophils cultured with SLE sera displayed significantly reduced viability (Fig. 1e, Extended Data Fig. 1a) and this reduction correlated positively with the severity of neutropenia in the patients (Fig. 1f and Supplementary Table 5). Of note, serum from RA patients did not have the same effect (Extended Data Fig. 1b). To determine key factors in SLE sera responsible for this effect, we compared cytokine profiles in SLE sera with those in other autoimmune diseases and HCs. Four cytokines were specifically increased in SLE, including IFN-α, CXCL11, IL-12p40 and IL-23 (Fig. 1g,h, Extended Data Fig. 1c). However, blockade of type 1 IFN signaling but not of the other cytokines12, abrogated the enhanced neutrophil death mediated by SLE sera (Fig. 1i, Extended Data Fig. 1d), and the addition of IFN-α to HC serum promoted neutrophil death (Fig. 1j). These results indicate that type 1 IFN contributes to neutrophil death in lupus patients.
The production of autoantibodies is a hallmark of SLE and plays a critical role in disease pathogenesis13, 14. Interestingly, the proportion of autoantibodies, such as anti-dsDNA IgG, in total IgG correlated positively with the severity of neutropenia (Extended Data Fig. 1f,g). To investigate whether autoantibodies are involved in neutrophil death, we purified total IgG from either healthy or SLE sera (Extended Data Fig. 1h,j), and applied them to healthy neutrophils in the presence of HC serum. As expected, SLE but not healthy IgG reduced the viability of neutrophils in a concentration-dependent manner (Fig. 1k, Extended Data Fig. 1k). Consistently, the depletion of IgG from SLE serum reduced the ability of serum to decrease cell viability of cultured neutrophils and the addition of IFNAR neutralizing antibody further curtailed this modulating capability (Fig. 1l, Extended Data Fig. 1i,k). Taken together, these results suggest that SLE IgG and IFN-α present in SLE sera induce neutrophil death.
Neutrophil ferroptosis is prevalent in patients with SLE
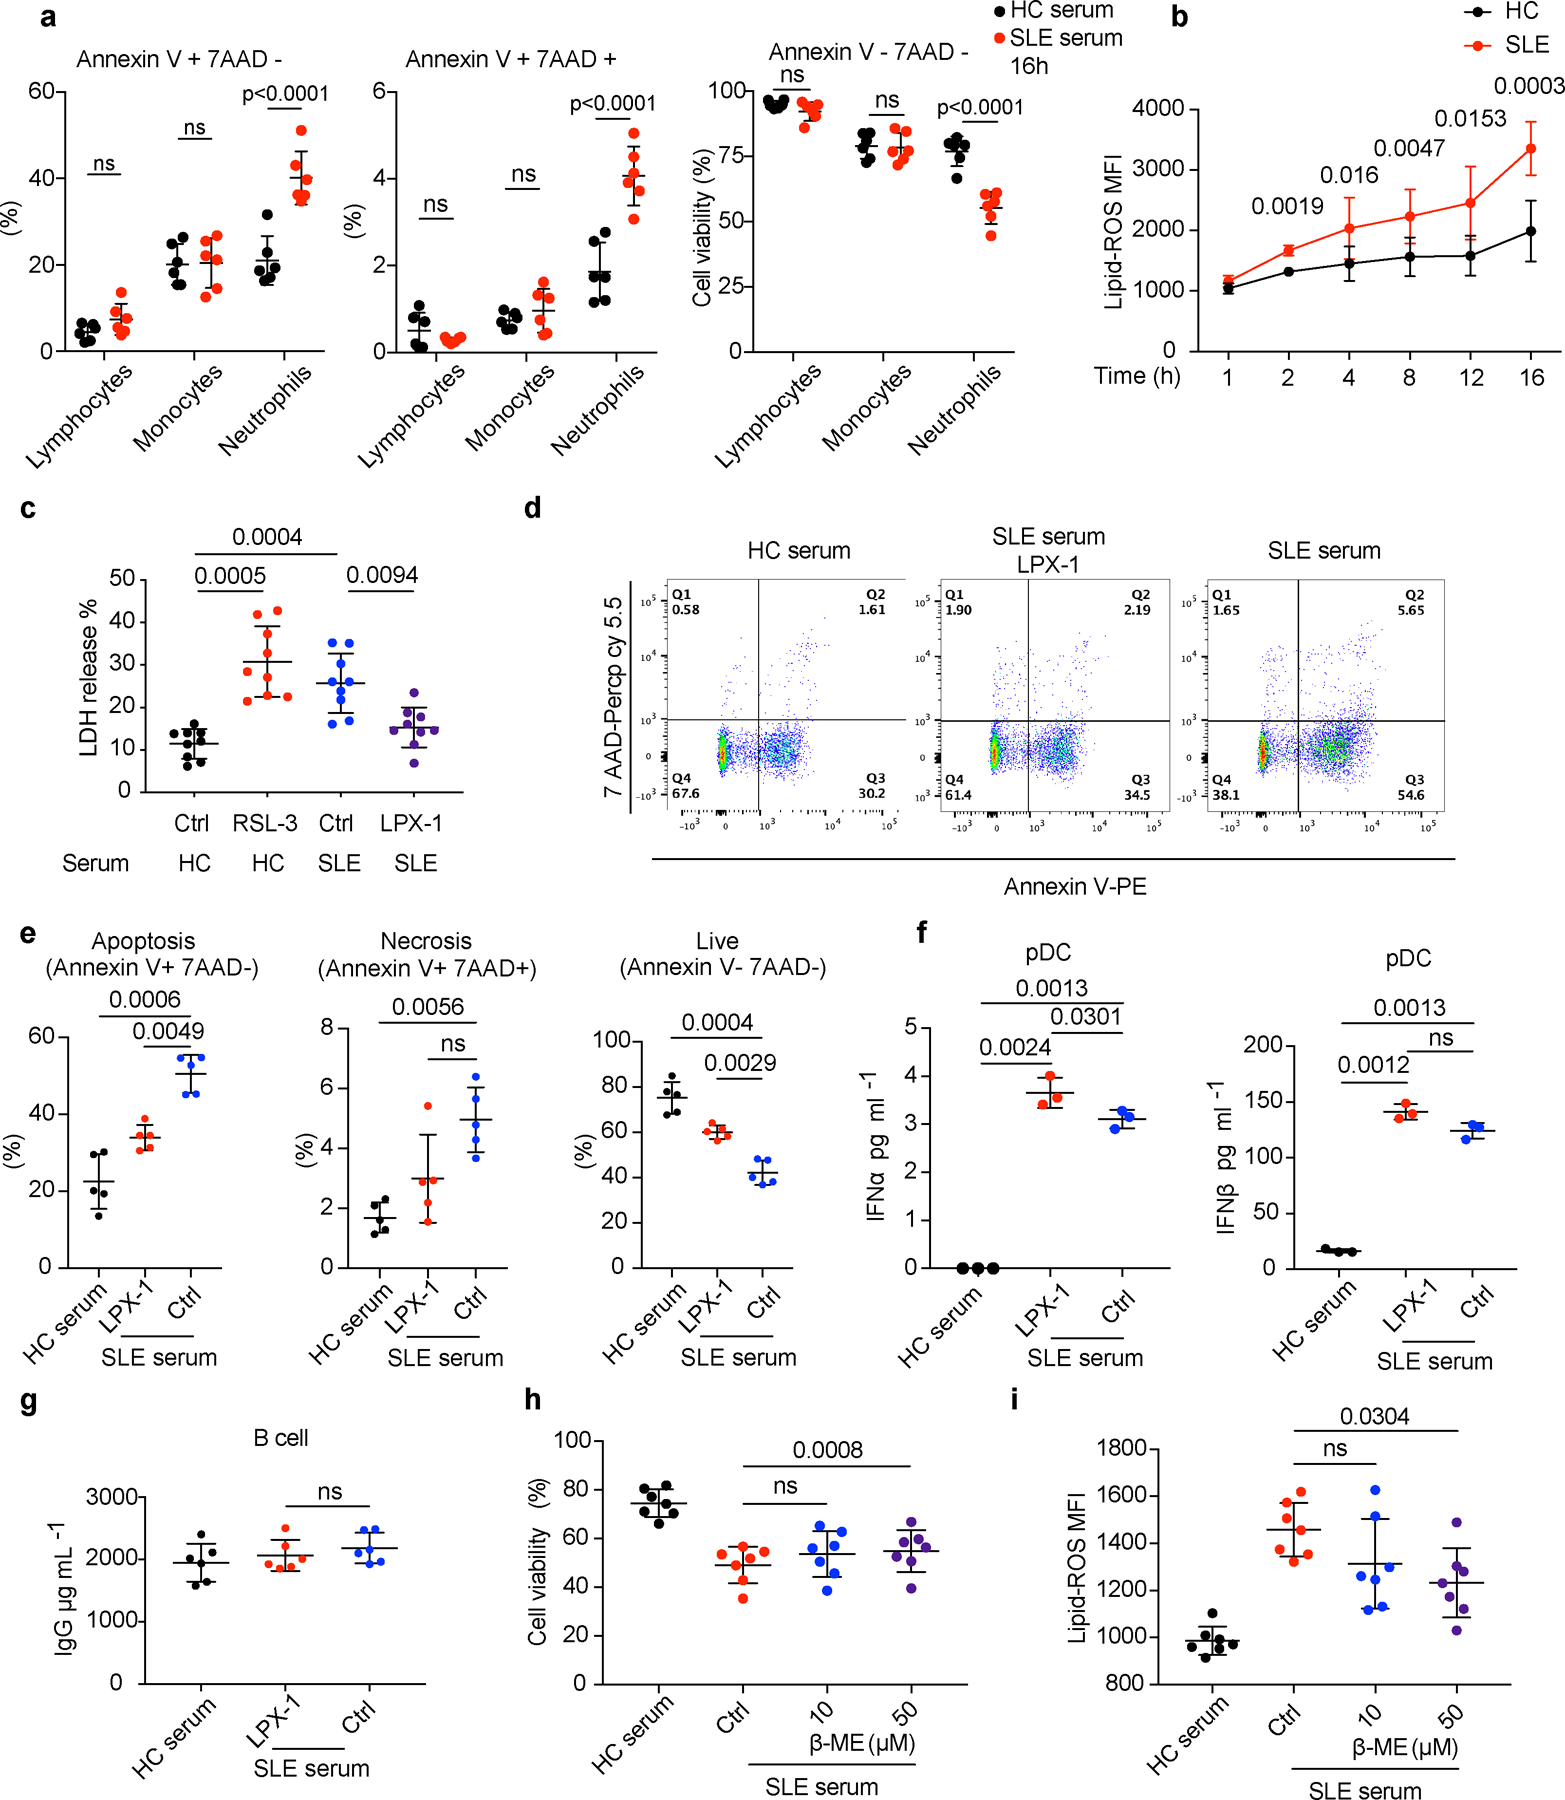
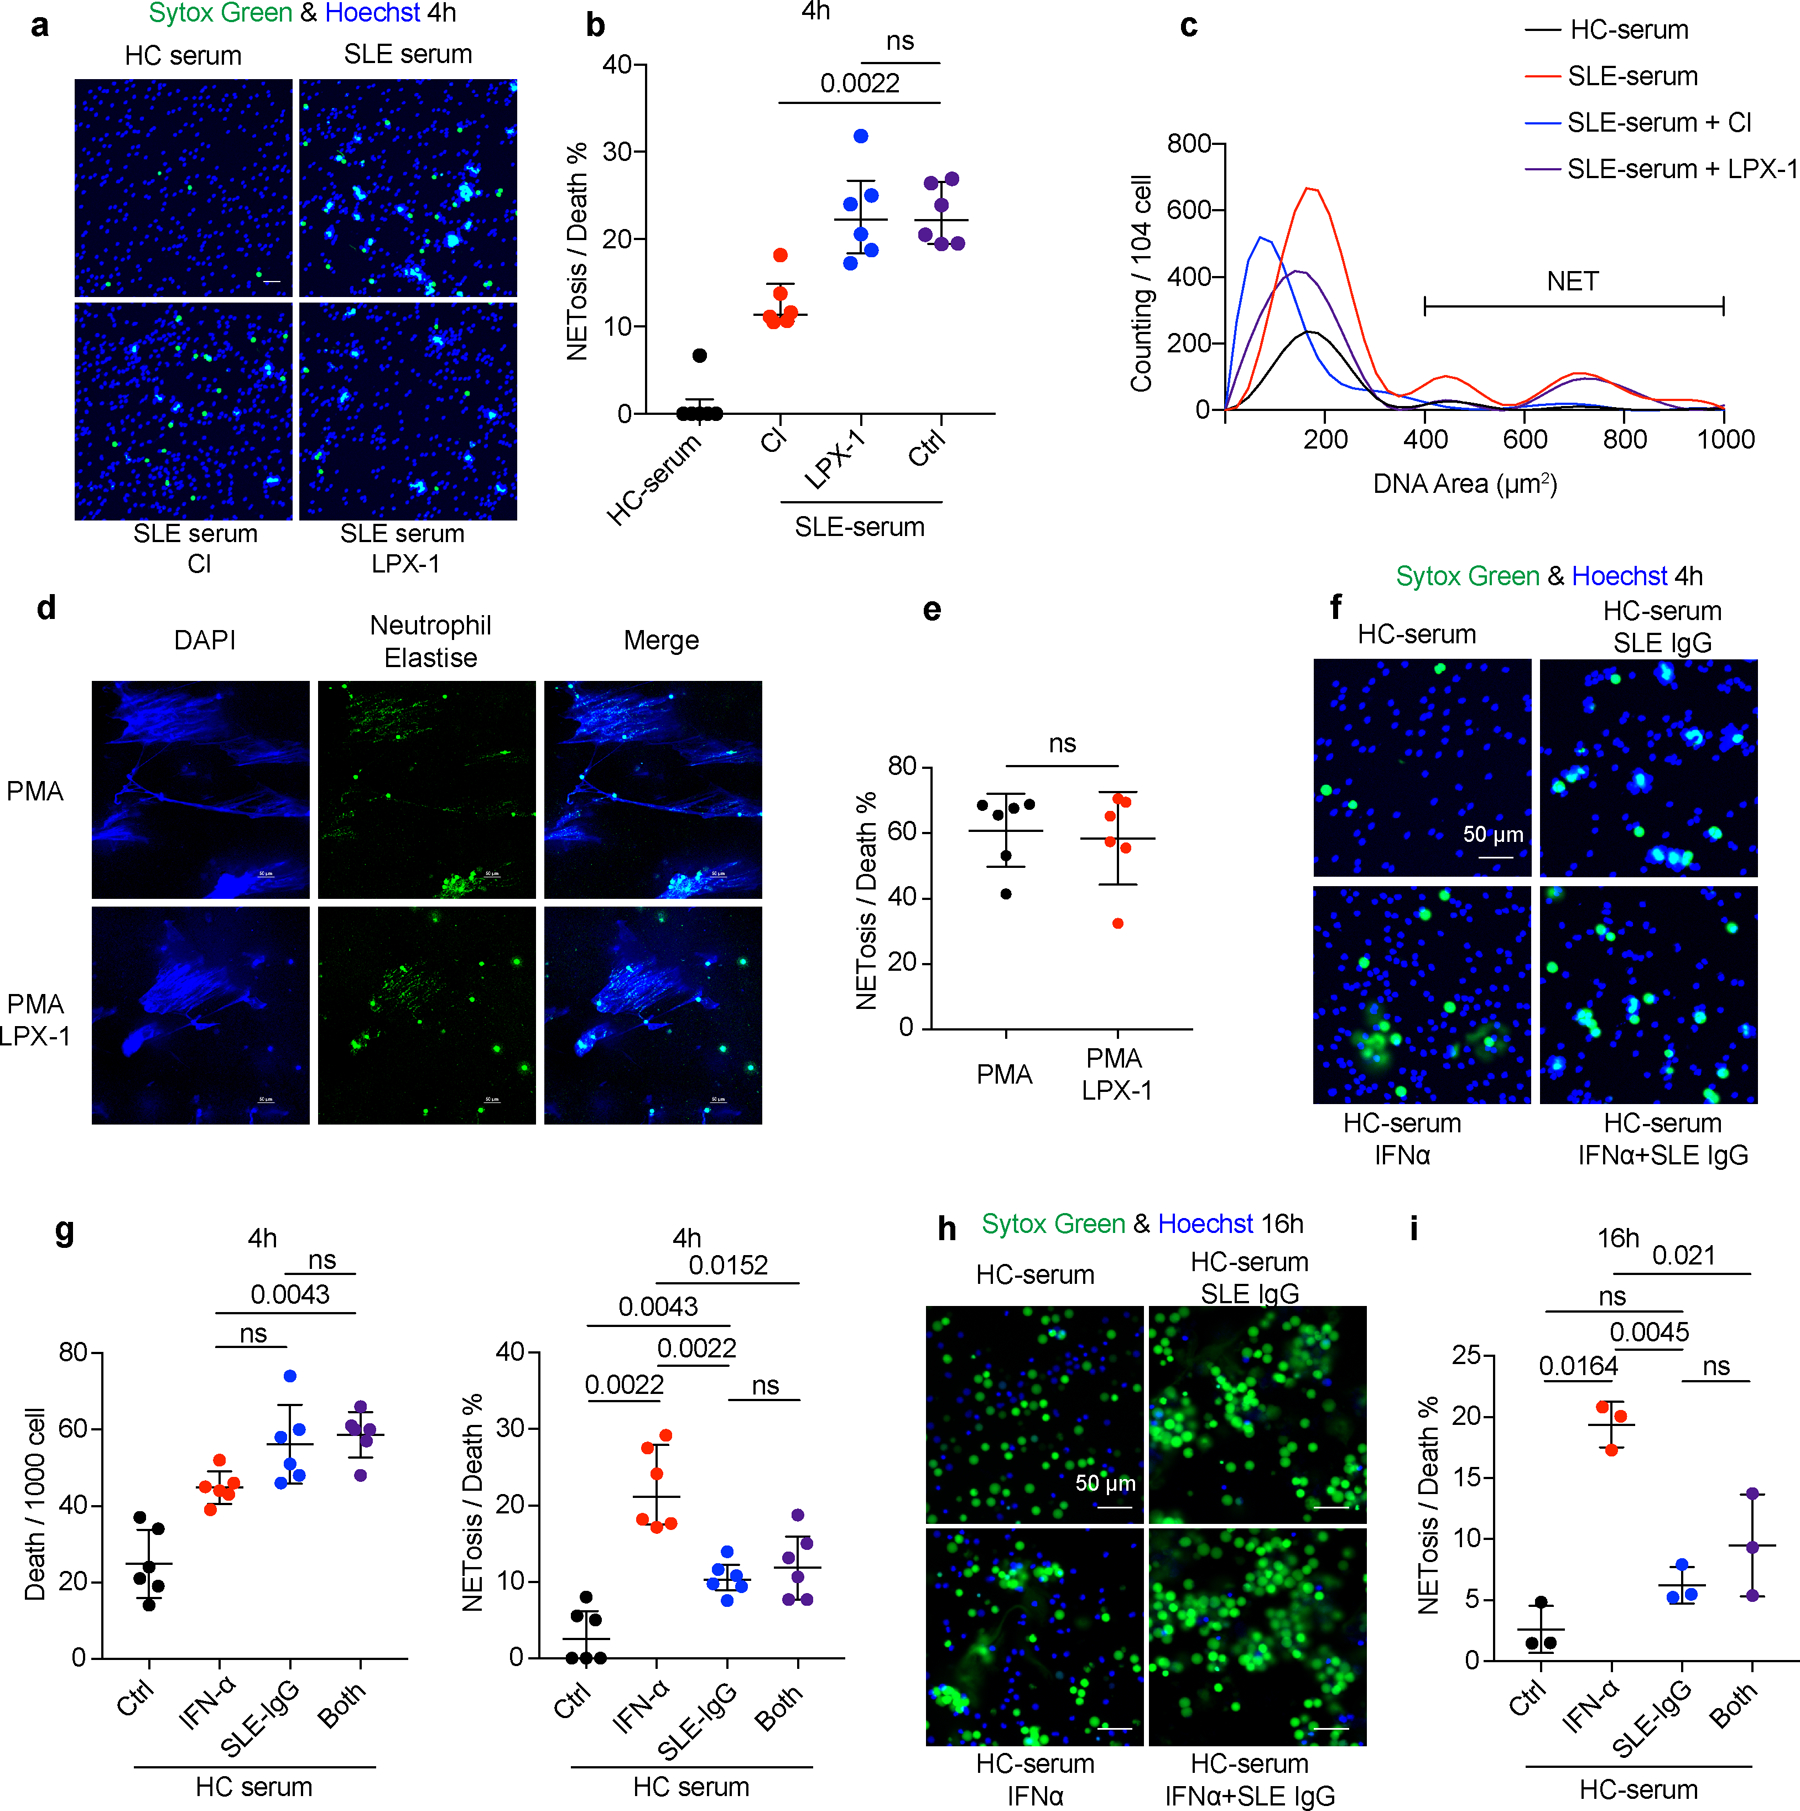
NETosis, a unique form of neutrophil death characterized by the release of decondensed chromatin and granular contents to the extracellular spaces, has been proposed as an important cause of neutropenia in lupus15. To test this, peripheral neutrophils from both HC and patients with SLE were stained with propidium iodide (PI) to detect dead cells and DAPI as counterstain, and NETs were defined as cells with a surrounding DNA area exceeding 400 μm2 16. We observed only a small portion of dead neutrophils could be attributed to NETosis (Fig. 2a). Therefore, we further looked into neutrophil death by electron microscopy, and we found a significant portion of neutrophils isolated from patients with SLE exhibited typical morphological characteristics of ferroptosis5, including mitochondrial vacuole formation with increased mitochondrial membrane density and disappearance of mitochondrial cristae (Fig. 2b). Similar morphologic changes were recapitulated in HC neutrophils treated with RSL-3, a ferroptosis inducer17 (Fig. 2c). Consistent with this, the levels of lipid-ROS, both an indicator and strong inducer of ferroptosis5, were higher in patients with SLE with active diseases but were remarkedly reduced after effective systemic treatments (Fig. 2d). Of note, the increased levels of lipid-ROS were restricted to neutrophils and did not extend to lymphocytes or monocytes from patients with SLE, and consistently SLE serum induced lipid-ROS and reduced cell viability in neutrophils only (Fig. 2e,f, Extended Data Fig. 2a,b). In contrast to the finding that RSL-3 induced death in neutrophils cultured with HC serum, two ferroptosis inhibitors, liproxstatin-1 (LPX-1) and the iron chelator deferoxamine (DFO), rescued neutrophil death induced by SLE serum 5, 18 (Fig. 3a,b, Extended Data Fig. 2c-e), suggesting that ferroptosis may be the main form of neutrophil death in SLE. Of note, LPX-1 did not inhibit NETosis and had no or negligible effects on B cell or plasmacytoid dendritic cell function indicated by antibody or type I IFN production, respectively (Fig. 3c, Extended Data Fig. 2f,g 3a-e). Notably, necroptosis inhibitors, necrosulfonamide (NSA) and necrostatin-1 (Nec-1), and the apoptosis inhibitor, Z-VAD, produced only minimal effects on neutrophil death (Fig. 3b). It has been shown that direct inhibition of GSH synthesis induces ferroptosis19. Of note, low dose of ß-ME could partially rescue neutrophil death by boosting GSH biosynthesis (Extended Data Fig. 2h,i). Collectively, these findings indicate that ferroptosis is the main driver of neutrophil death in patients with SLE.
Fig. 2. Neutrophil ferroptosis is prevalent in patients with SLE.
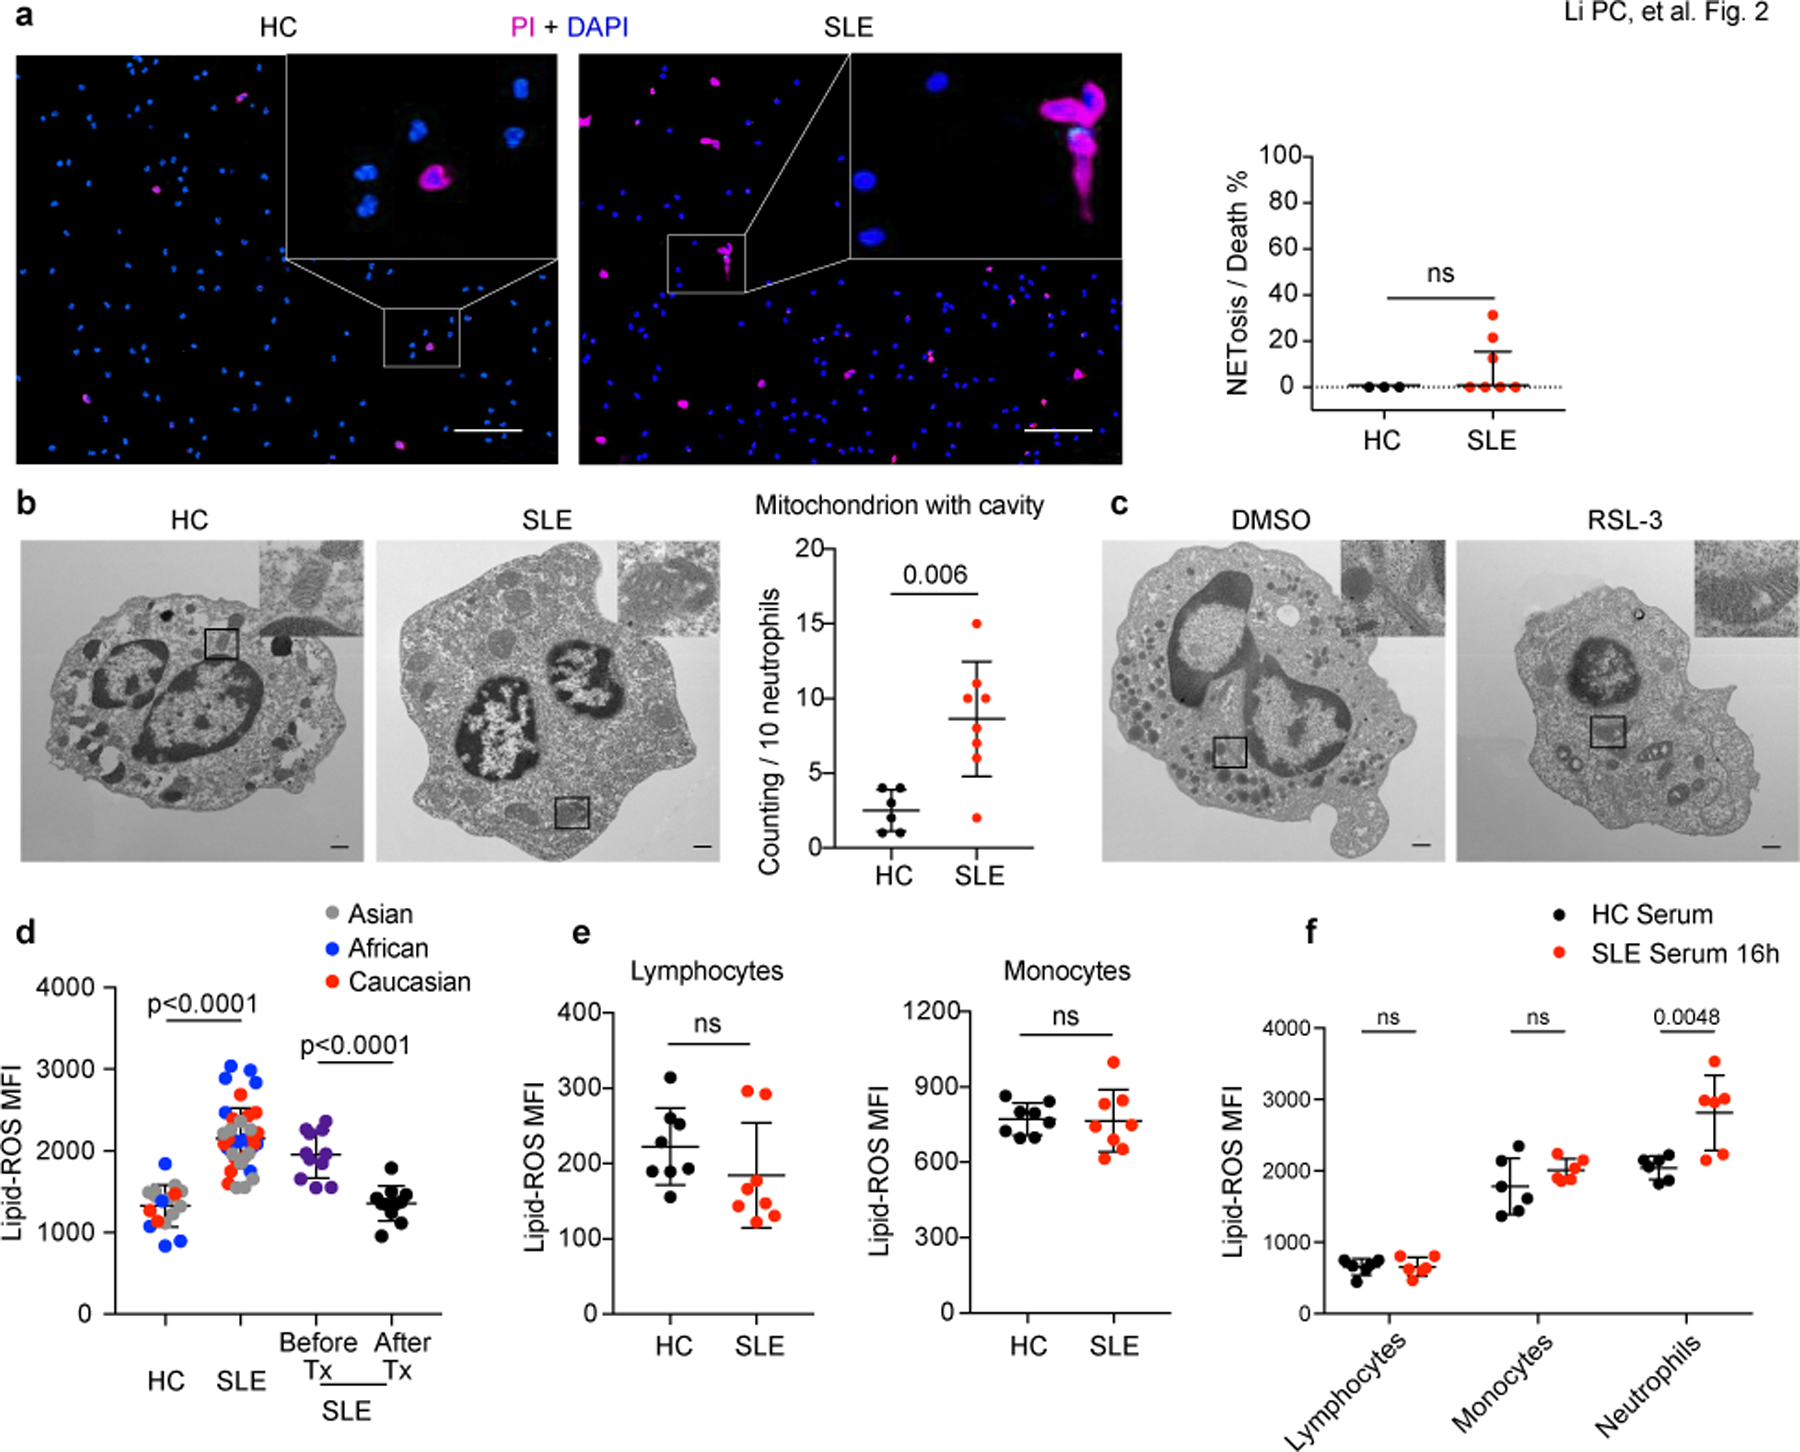
a. Left: Representative fluorescent images indicated neutrophils death. Peripheral neutrophils from both HCs and patients with SLE were stained with propidium iodide (PI) to detect dead cells and DAPI as counterstain, and NETs were defined as cells with DNA area exceeding 400 μm2. The scale bar represents 100 μm. Right: Dot plots showed the quantification (HC: n=3, SLE: n=7). b. Left: Representative electron microscopy images of neutrophils in HCs and SLE patients. Right: Quantification of neutrophil mitochondrion with cavity in HCs (n=6) and SLE patients (n=8). The scale bar represents 500 nm. c. Representative electron microscopy images of HC neutrophils cultured with 20% HC serum supplemented with dimethyl sulfoxide (DMSO) vehicle or 10 μM RSL-3, a ferroptosis inducer for 4 hours. The scale bar represents 500 nm. d. Lipid-ROS content in neutrophils from SLE patients (n=39), paired SLE samples before and after treatments (n=11), neutrophils from HCs were used as controls (n=17). Cells were incubated with BODIPY C11, a fluorescent lipid peroxidation reporter molecule that shifts its fluorescence from red to green, for 15 min before flow cytometry assessment. e. Flow analysis of lipid-ROS content in lymphocytes and monocytes from either HCs or SLE patients (n=8). f. Flow analysis of lipid-ROS content in HC lymphocytes, monocytes, and neutrophils, after cultured with 20% HC or SLE serum respectively for 16 hours (n=6). Data are shown as mean ± SD or median with interquartile range. ns p > 0.05. Two-tailed unpaired or paired Student’s t-test or Mann Whitney test were applied.
Fig. 3. Neutrophil ferroptosis, the main form of neutrophil death in SLE, is induced by autoantibodies and IFNα.
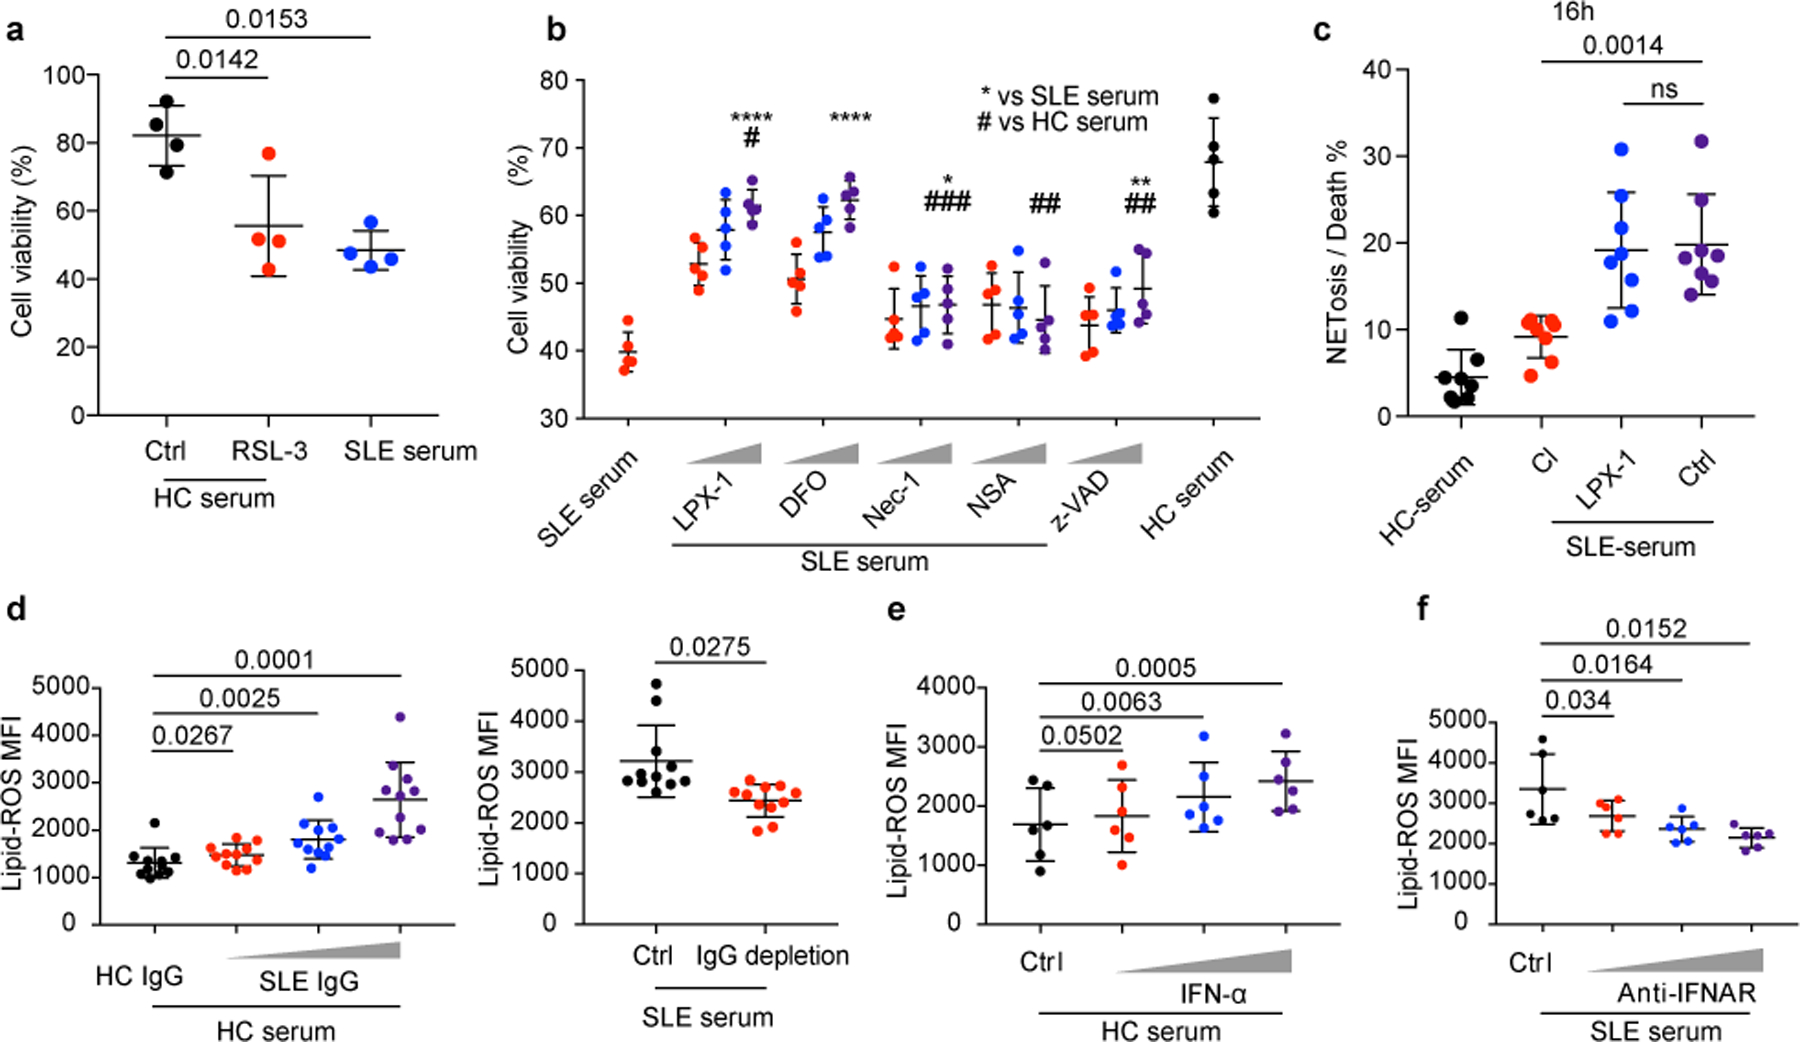
a. HC neutrophil cell viability when cultured with 20% HC serum supplemented with RSL-3 (10 μM) or DMSO for 16 hours, and cell viabilities were assessed by flow cytometry (n=4). b. HC neutrophil cell viability when cultured in 20% HC or SLE serum supplemented with increasing dosages of various reagents, including two ferroptosis inhibitors, liproxstatin-1 (LPX-1, 10/100/1000 nM), or deferoxamine (DFO, 1/10/100 μM), two necroptosis inhibitors, necrostatin-1 (Nec-1, 10/100/1000 nM), or necrosulfonamide (NSA, 10/100/1000 nM), or apoptosis inhibitor, Z-VAD (0.1/1/10 μM) for 16 hours, and cell viabilities were assessed by flow cytometry (n=5). c. HC neutrophils were cultured in the presence of HC or SLE serum with or without addition of Cl-amidine (Cl) (an inhibitor of NETosis, 100 μM), or LPX-1 (1 μM) for 16 hours and NETs were counted in SYTOX Green+ cells by morphology (n=8). Neutrophils with DNA area greater than 400um2 were considered to have undergone NETosis. Dot plots show the percentage of NETosis in all dead neutrophils in the indicated group. d. Lipid ROS production by HC neutrophils when cultured with 20% HC serum supplemented with SLE IgG, or with SLE serum with or without IgG depletion for 16 hours (n=11). e. Lipid ROS production by HC neutrophils when stimulated with IFN-α at different concentrations (10^3, 10^4, 10^5 U ml−1) for 16 hours (n=6). f. Lipid ROS production by HC neutrophils when cultured with SLE serum in the absence or presence of IFNAR blocking antibody at different dosages (0.1, 1, 10 µg ml−1) for 16 hours (n=6). Data are shown as mean ± SD. *p < 0.05, **p < 0.01, ***p < 0.001, ****p < 0.0001, ns p > 0.05; two-tailed unpaired or paired Student’s t-test were applied.
As was expected, the addition of SLE IgG or IFN-α to HC serum increased neutrophil lipid-ROS in a concentration-dependent manner (Fig. 3d,e), whereas IgG depletion or treatment with IFNAR neutralizing antibodies reduced the capacity of SLE sera to induce lipid-ROS production by neutrophils (Fig. 3d,f and Extended Data Fig. 1e). Although both IFNα and SLE IgG induced neutrophil ferroptosis, SLE IgG was a more potent inducer. Of note, although there was approximately 20% NETosis in total dead neutrophils induced by IFN-α stimulation alone, the addition of SLE IgG, clearly re-programed the neutrophil death program indicated by a significant decrease of NETosis in the face of slightly enhanced neutrophil death (Extended Data Fig. 3f-i). Taken together, our results suggest that in the SLE milieu, neutrophil ferroptosis is a dominant form of neutrophil death considering the co-presence of IFNα and IgG.
Inhibition of ferroptosis attenuates lupus in mice
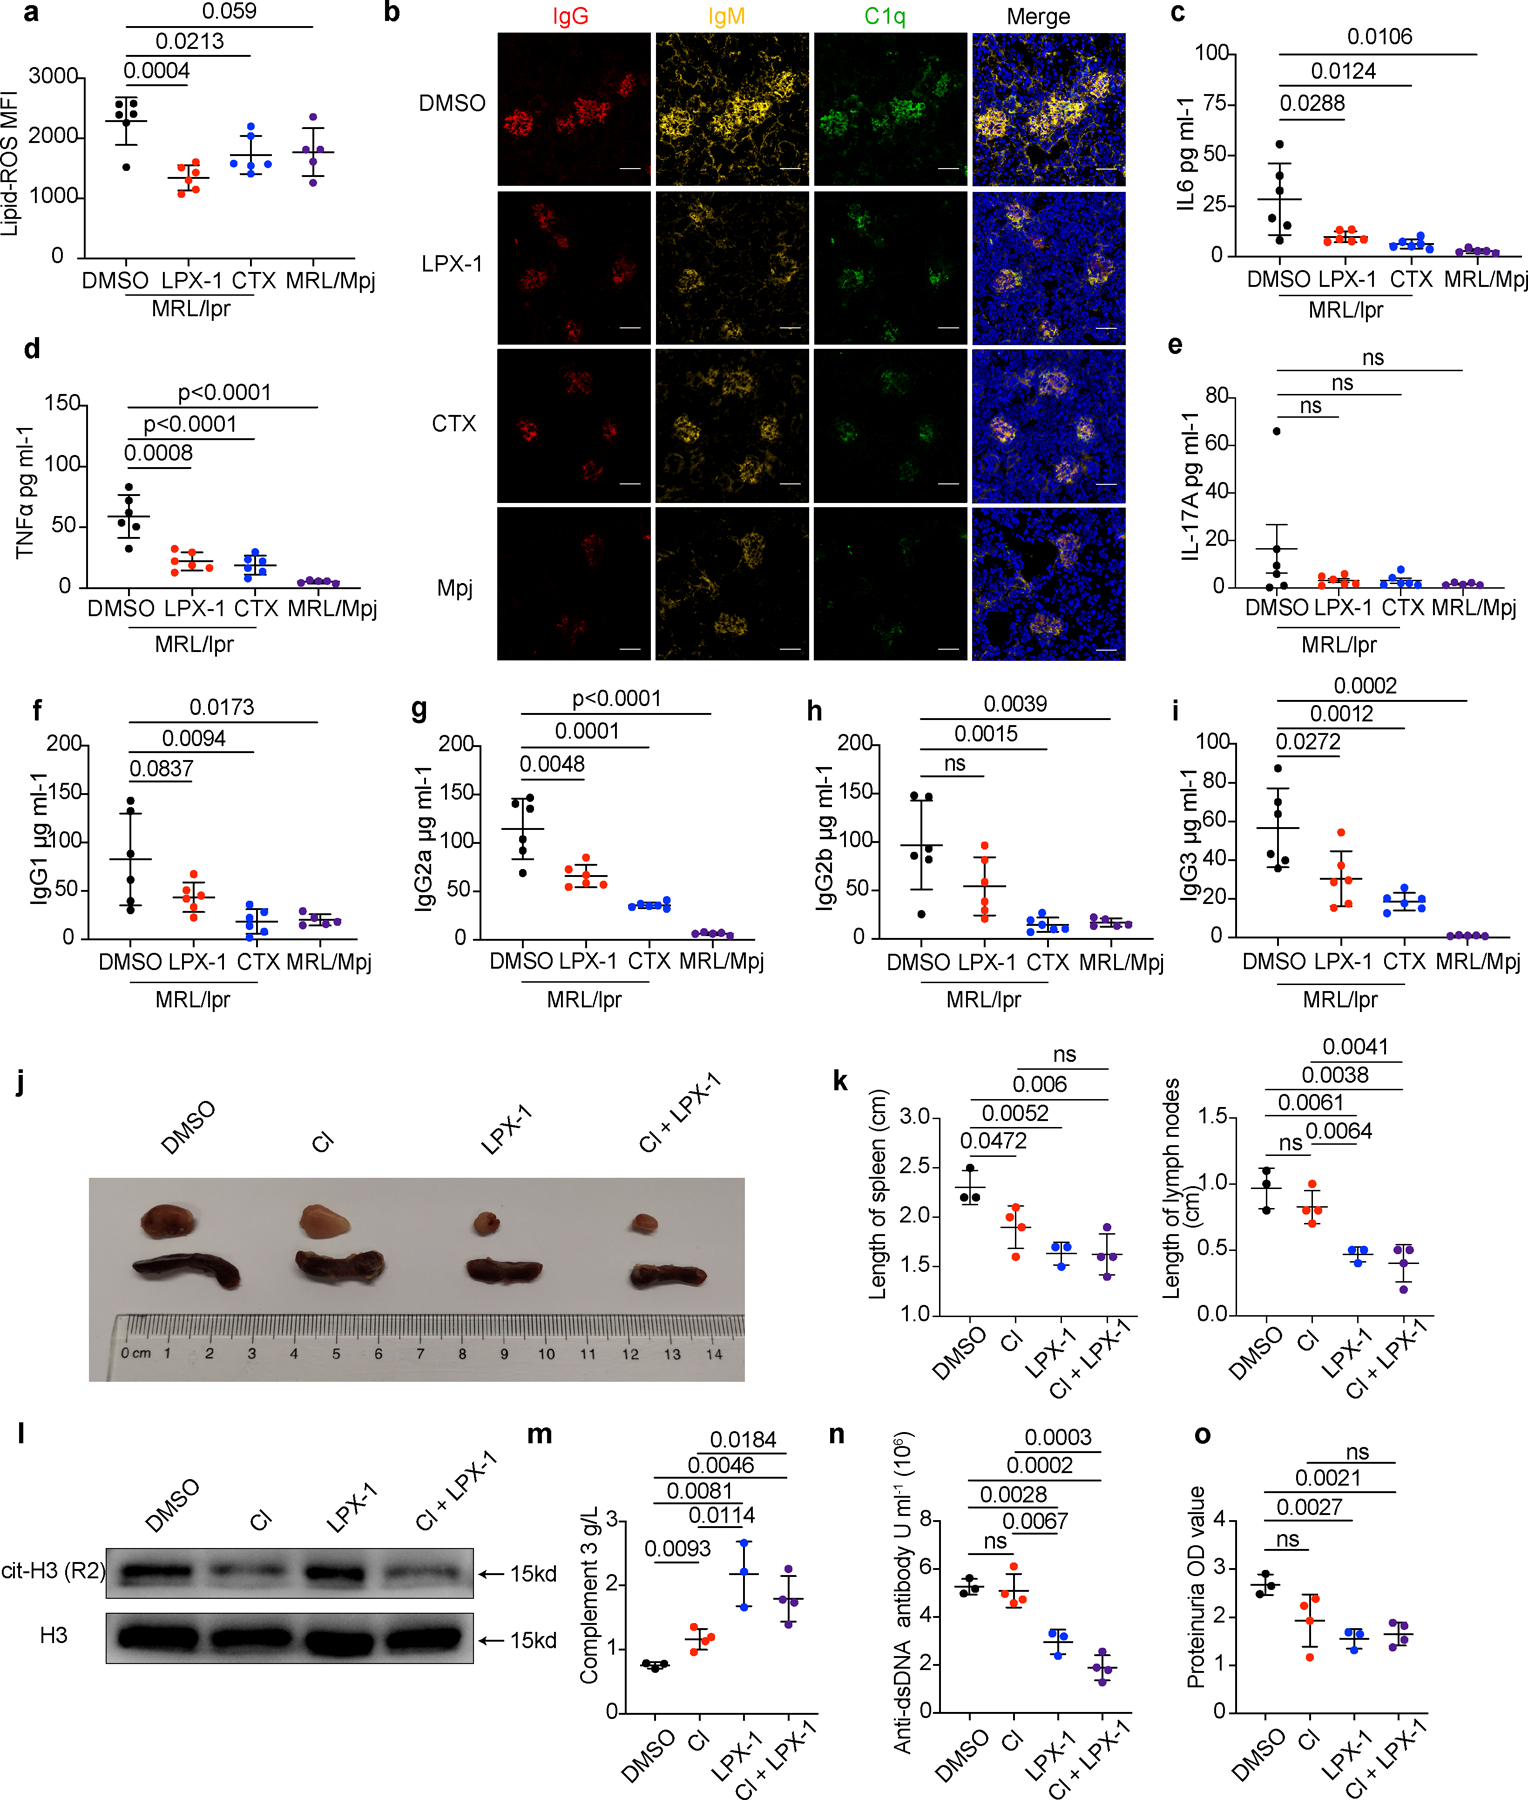
We next examined neutrophil ferroptosis in different lupus-prone mice20, 21. Consistent with our finding in patients with SLE, we observed decreased neutrophil viability and increased lipid-ROS production in both MRL/lpr and NZB/W F1 mice (Fig. 4a,b). Furthermore, LPX-1 treatment of MRL/lpr mice at 12 weeks of age efficiently inhibited the production of lipid-ROS in neutrophils, significantly mitigated disease progression, reduced the production of autoantibodies and various inflammatory cytokines, as well as increased serum complement component 3 (C3), alleviated splenomegaly, lymphadenopathy and severity of lupus nephritis (Fig. 4c-j, Extended Data Fig. 4a-i). Cytoxan (CTX), a drug used to treat people with SLE was administered as control22. Of note, the NETosis inhibitor Cl-amidine did not provide equivalent therapeutic values as LPX-1 confirming the distinct role of neutrophil ferroptosis in lupus pathogenesis (Extended Data Fig. 4j-o). Taken together, these results suggest that neutrophil ferroptosis is a main cause of neutropenia in lupus and targeted therapies and correction of this abnormality yield therapeutic effects.
Fig. 4. Ferroptosis inhibitors ameliorate disease progression in MRL/lpr mice.
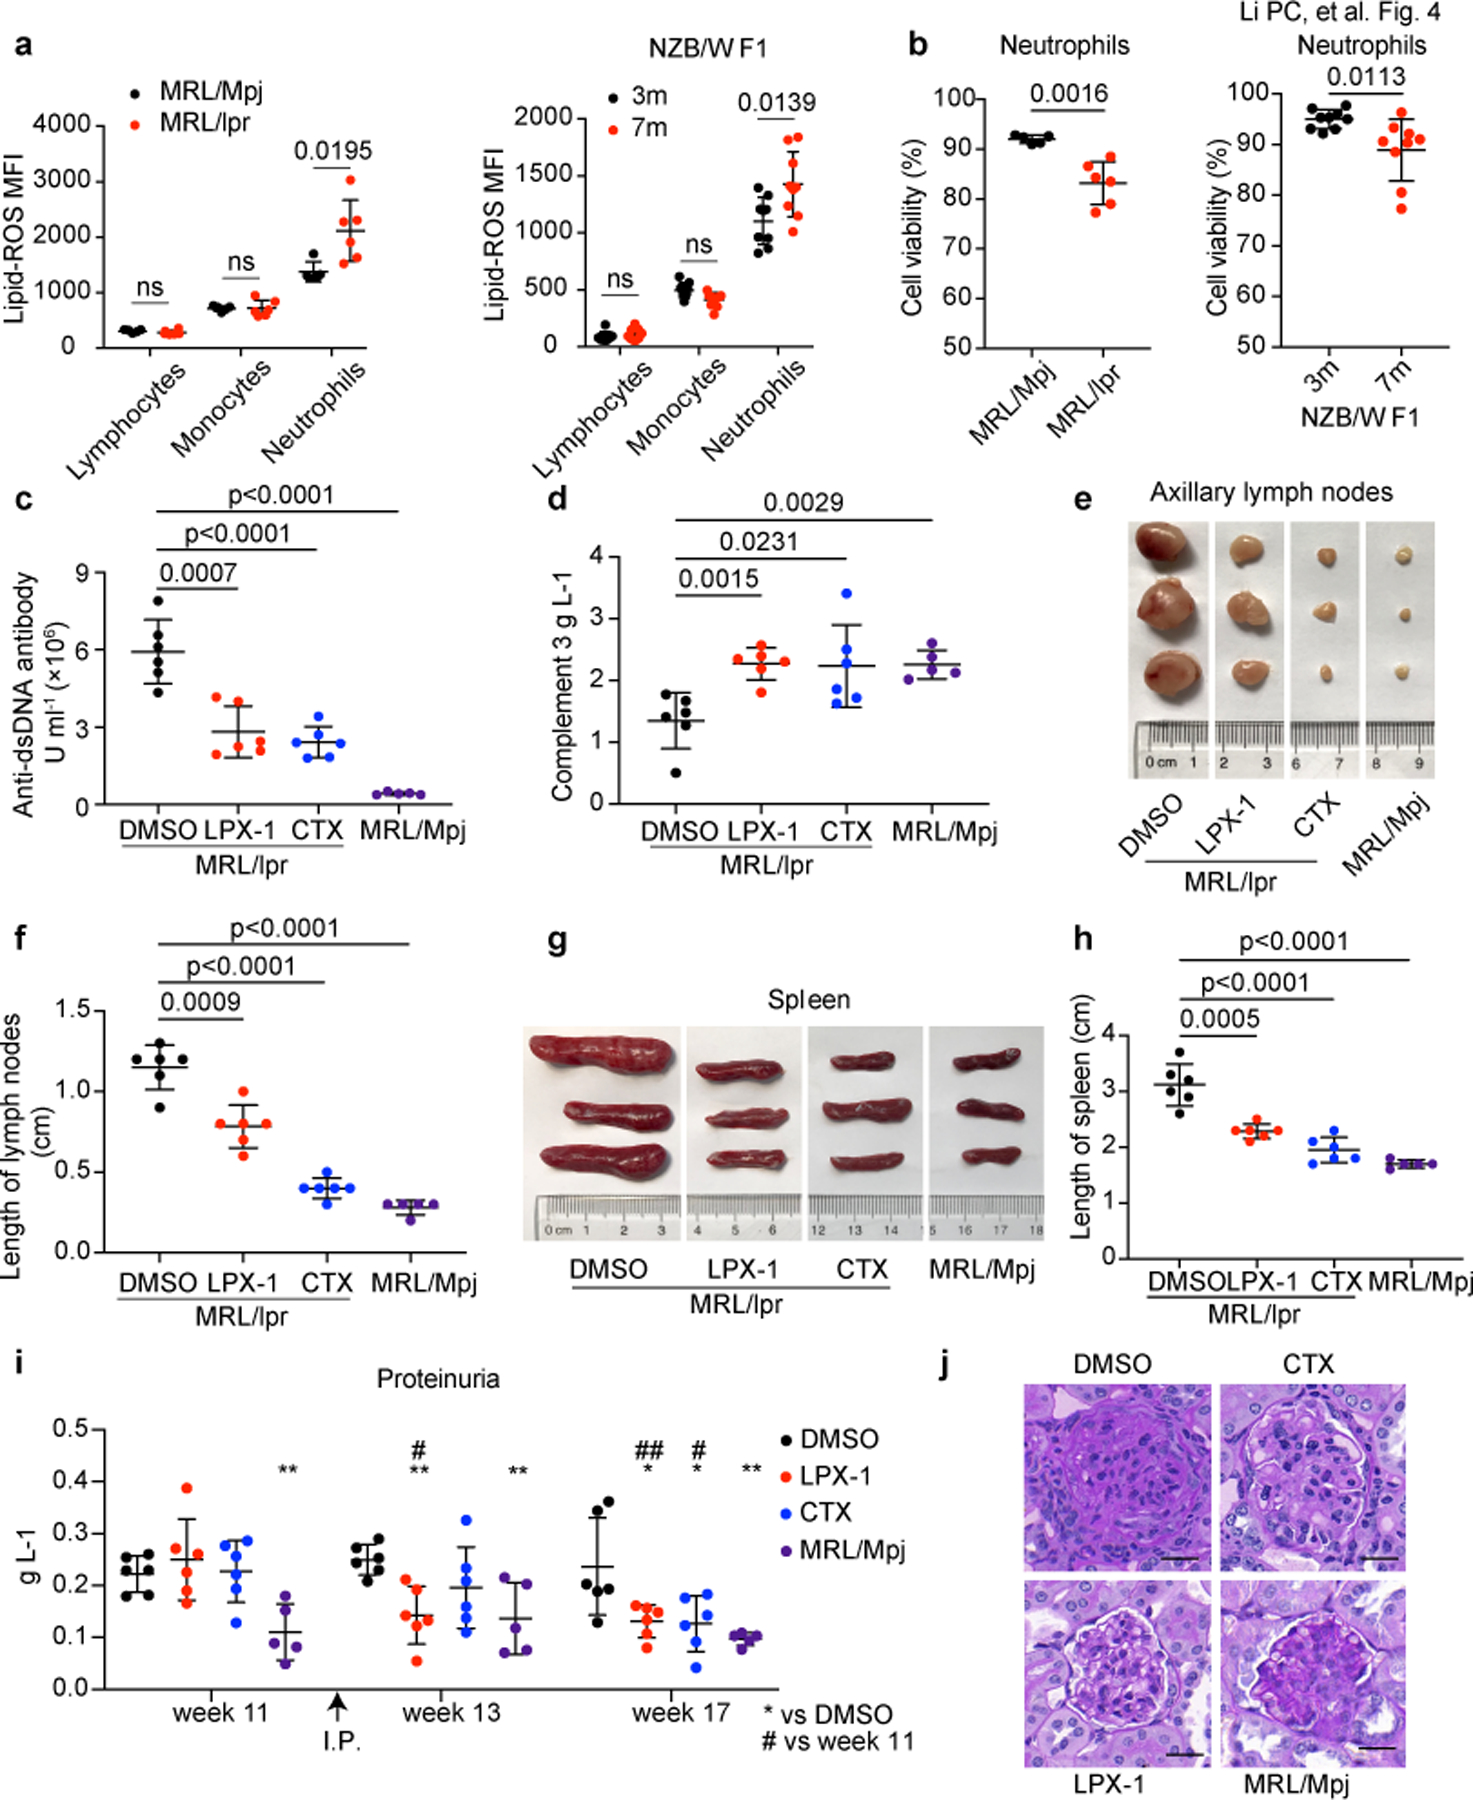
a. Flow cytometry quantification of lipid ROS in lymphocytes, monocytes and neutrophils from MRL/Mpj (n=6), MRL/lpr (n=6) and NZB/W F1 mice (n=9). Splenic cells were incubated with BODIPY C11 for 15 min before flow cytometry assessment. b. Cell viability of circulating neutrophils from indicated mice as quantified by flow cytometry (MRL/Mpj, MRL/lpr were euthanized at 18 weeks of age for analysis, NZB/W F1 at 3 or 7 months of age). c-j. MRL/lpr mice (n=6) were treated with DMSO, LPX-1, or cytoxan (CTX) every other day for 6 weeks starting at week 12, DMSO was applied to sex-matched MRL/Mpj mice (n=5) as control. Mice were euthanized at 18 weeks of age for analysis. (c) ELISA assessment of serum anti-dsDNA antibodies titers. (d) ELISA assessment of serum complement 3. (e,f) Size and length of axillary lymph nodes. (g, h) Size and length of spleens. i. Bicinchoninic acid (BCA) assay of urine proteins. j. Periodic Acid-Schiff (PAS) staining of glomeruli. The scale bar represents 20 μm. Data are shown as mean ± SD. *or # p < 0.05, **or ## p < 0.01, ***p < 0.001, ****p < 0.0001, ns p > 0.05. Two-tailed unpaired Student’s t-test was applied.
SLE IgG and IFN-α suppress GPX4 expression in neutrophils
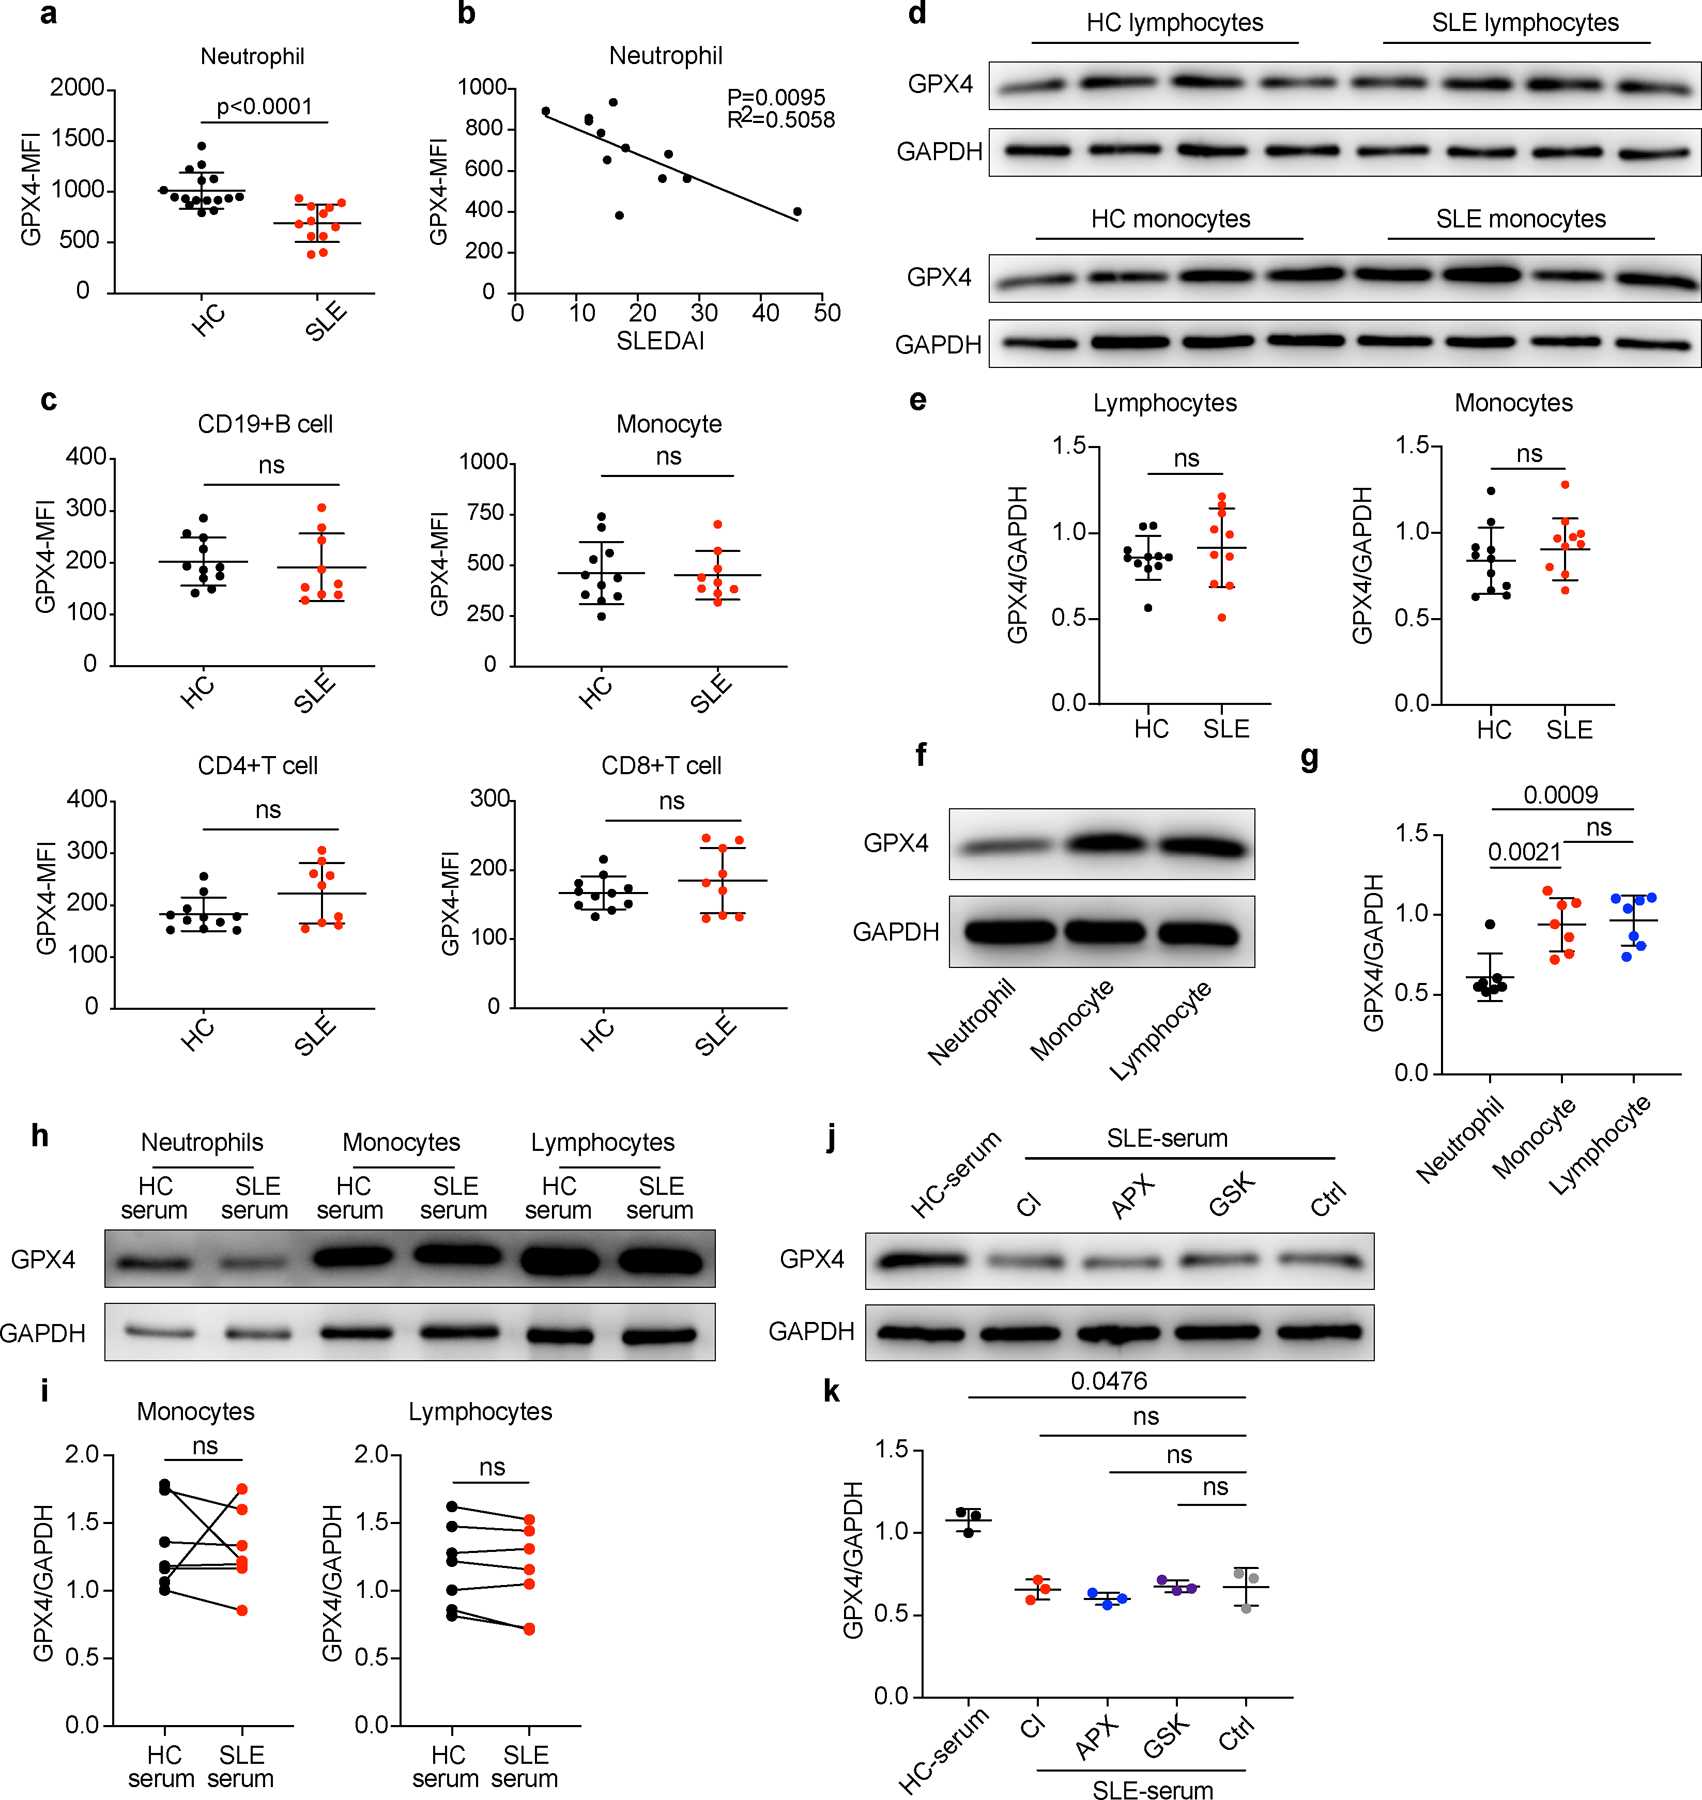
We next conducted RNA-Seq analysis and compared neutrophil ferroptosis related gene expression between HCs and patients with SLE, and identified 21 down-regulated genes and 2 upregulated genes in SLE neutrophils (Extended Data Fig. 5a, Supplementary Table 6,7). Given that GPX4 has been reported to be a key negative regulator of ferroptotic cell death by removing lipid peroxides 6, 23, 24, we confirmed that GPX4 expression was significantly decreased in the neutrophils but not other immune cells from both lupus-prone mice and people with SLE (Fig. 5a-e, Extended Data Fig. 6a-e, Supplementary Table 5) although the expression of SLC7A11 was not significantly changed (Extended Data Fig. 5b,c). The expression of GPX4 in neutrophils correlated inversely with SLEDAI score but was restored to normal levels after effective systemic treatments (Fig. 5d, Extended Data Fig. 6b, Supplementary Table 5). Furthermore, when we examined GPX4 expression in neutrophils cultured with different sera, we found, not surprisingly, GPX4 expression was downregulated when cultured with SLE serum, especially from patients with active disease and neutropenia, but not HC serum (Fig. 5f-h, Extended Data Fig. 6h,i).
Fig. 5. IFN-α and SLE IgG are the main drivers of neutropenia by reducing GPX4 in neutrophils.
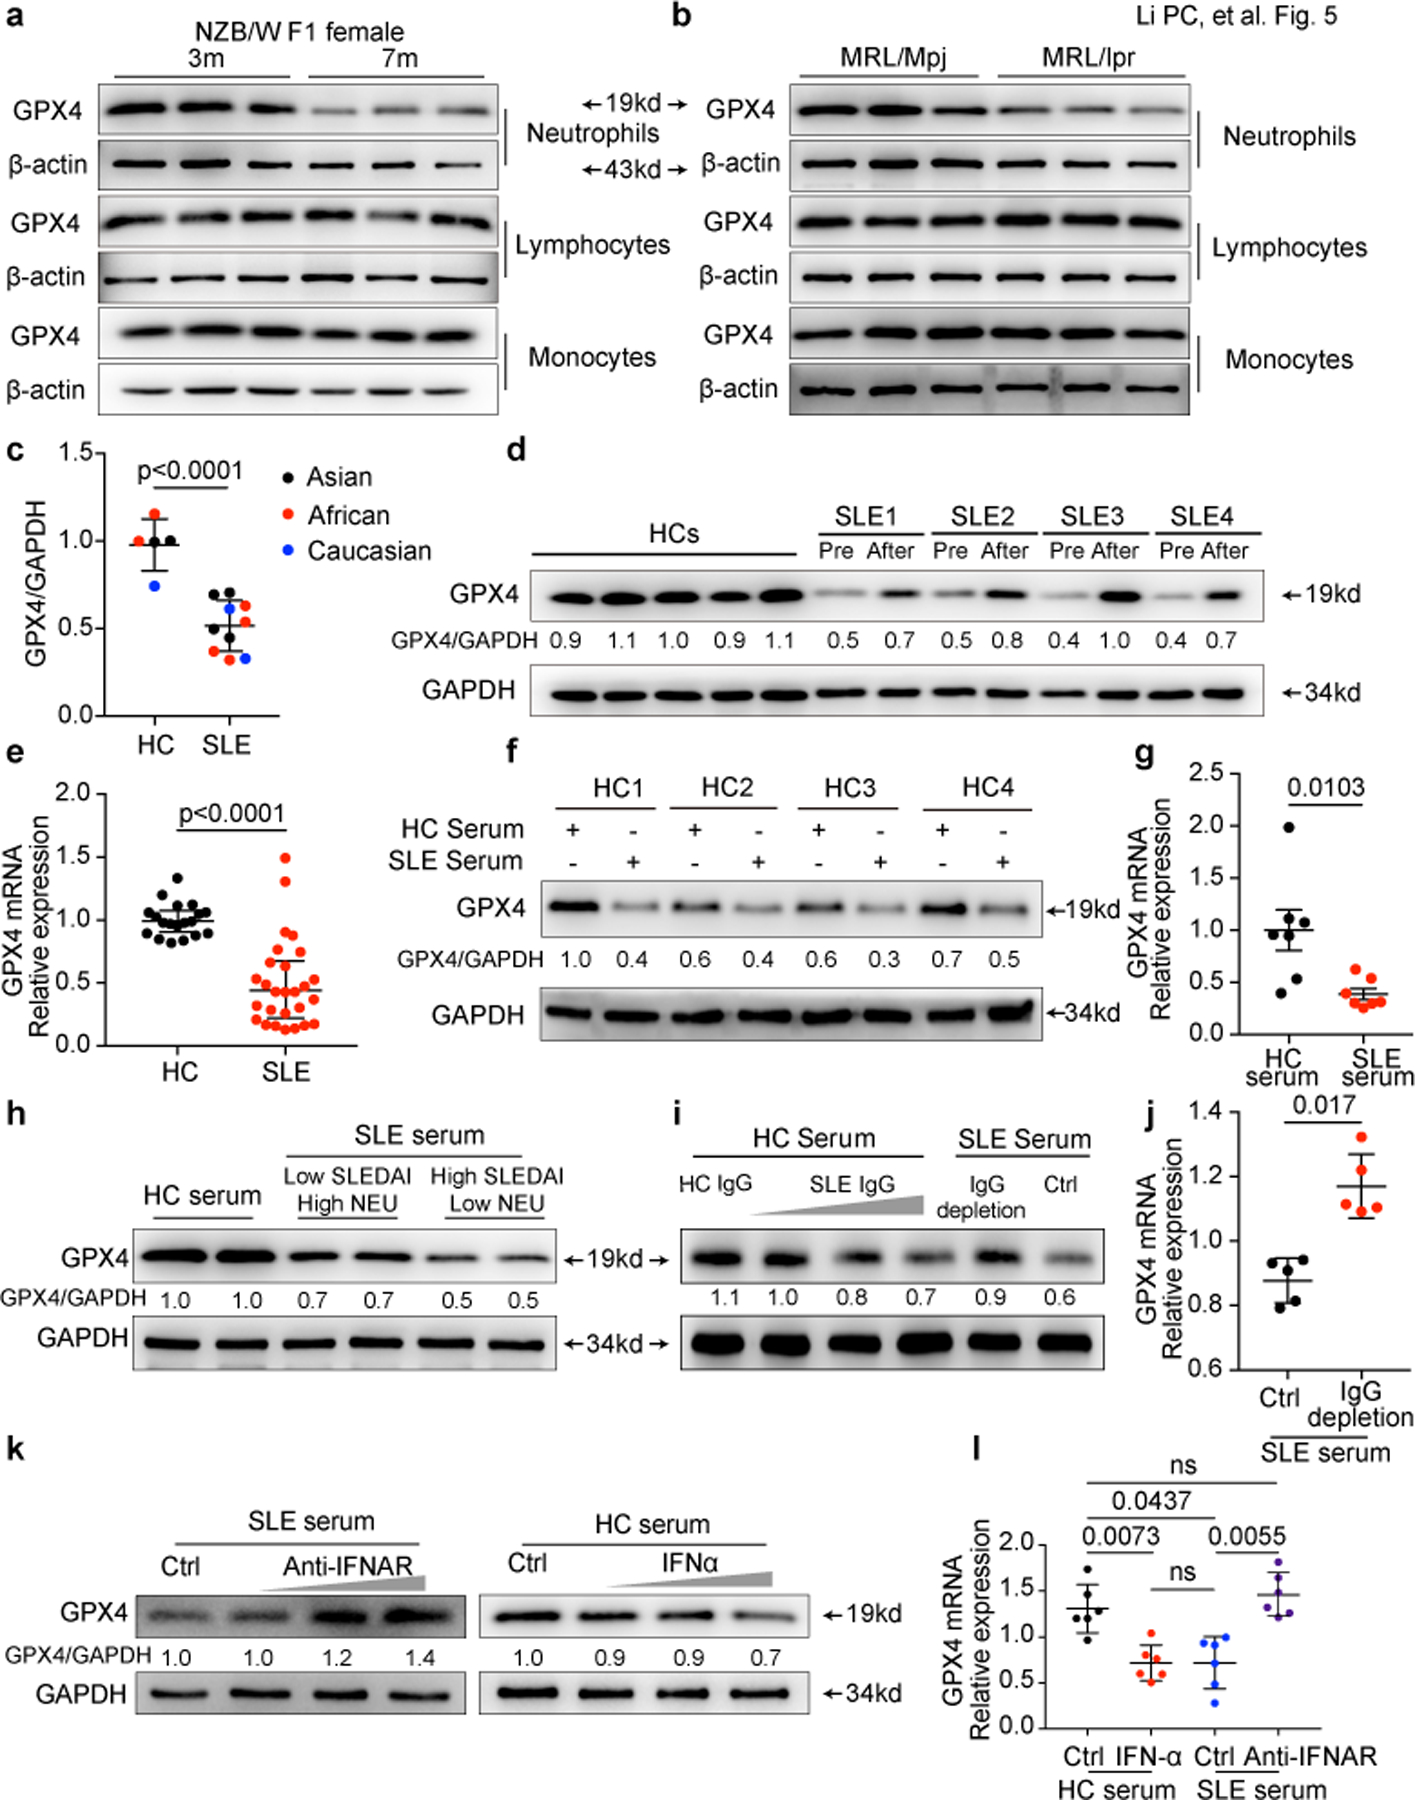
a-b. Western blot analysis of GPX4 expression in lymphocytes, monocytes and neutrophils from MRL/Mpj, MRL/lpr and NZB/W F1 mice. c-e. Western blot (HC=5, SLE=10) and qPCR analysis (HC=19, SLE=27) of GPX4 expression in neutrophils isolated from HCs and SLE patients. Paired SLE samples before and after effective treatments were analyzed (d). f-g. Western blot and qPCR analysis of GPX4 expression in HC neutrophils cultured with 20% HC or SLE serum for 30 hours (n=7). h. Western blot analysis of GPX4 expression in HC neutrophils cultured for 30 hours with 20% HC or SLE serum with different disease activities and neutrophil (NEU) counts. i-j. GPX4 expressions in HC Neutrophils when cultured with HC serum supplemented with SLE IgG (1.2, 2.4, 3.6 g L−1), or with SLE serum with or without IgG depletion for 16 hours (n=5). k-l. GPX4 expressions in HC neutrophils when cultured with HC serum supplemented with IFNα (10^3, 10^4, 10^5 U ml−1) or SLE serum supplemented with anti-IFNAR monoclonal antibody (0.1, 1, 10 µg ml-1) (n=6). Data are shown as mean ± SD. ns p > 0.05. Two-tailed unpaired or paired Student’s t-test were applied.
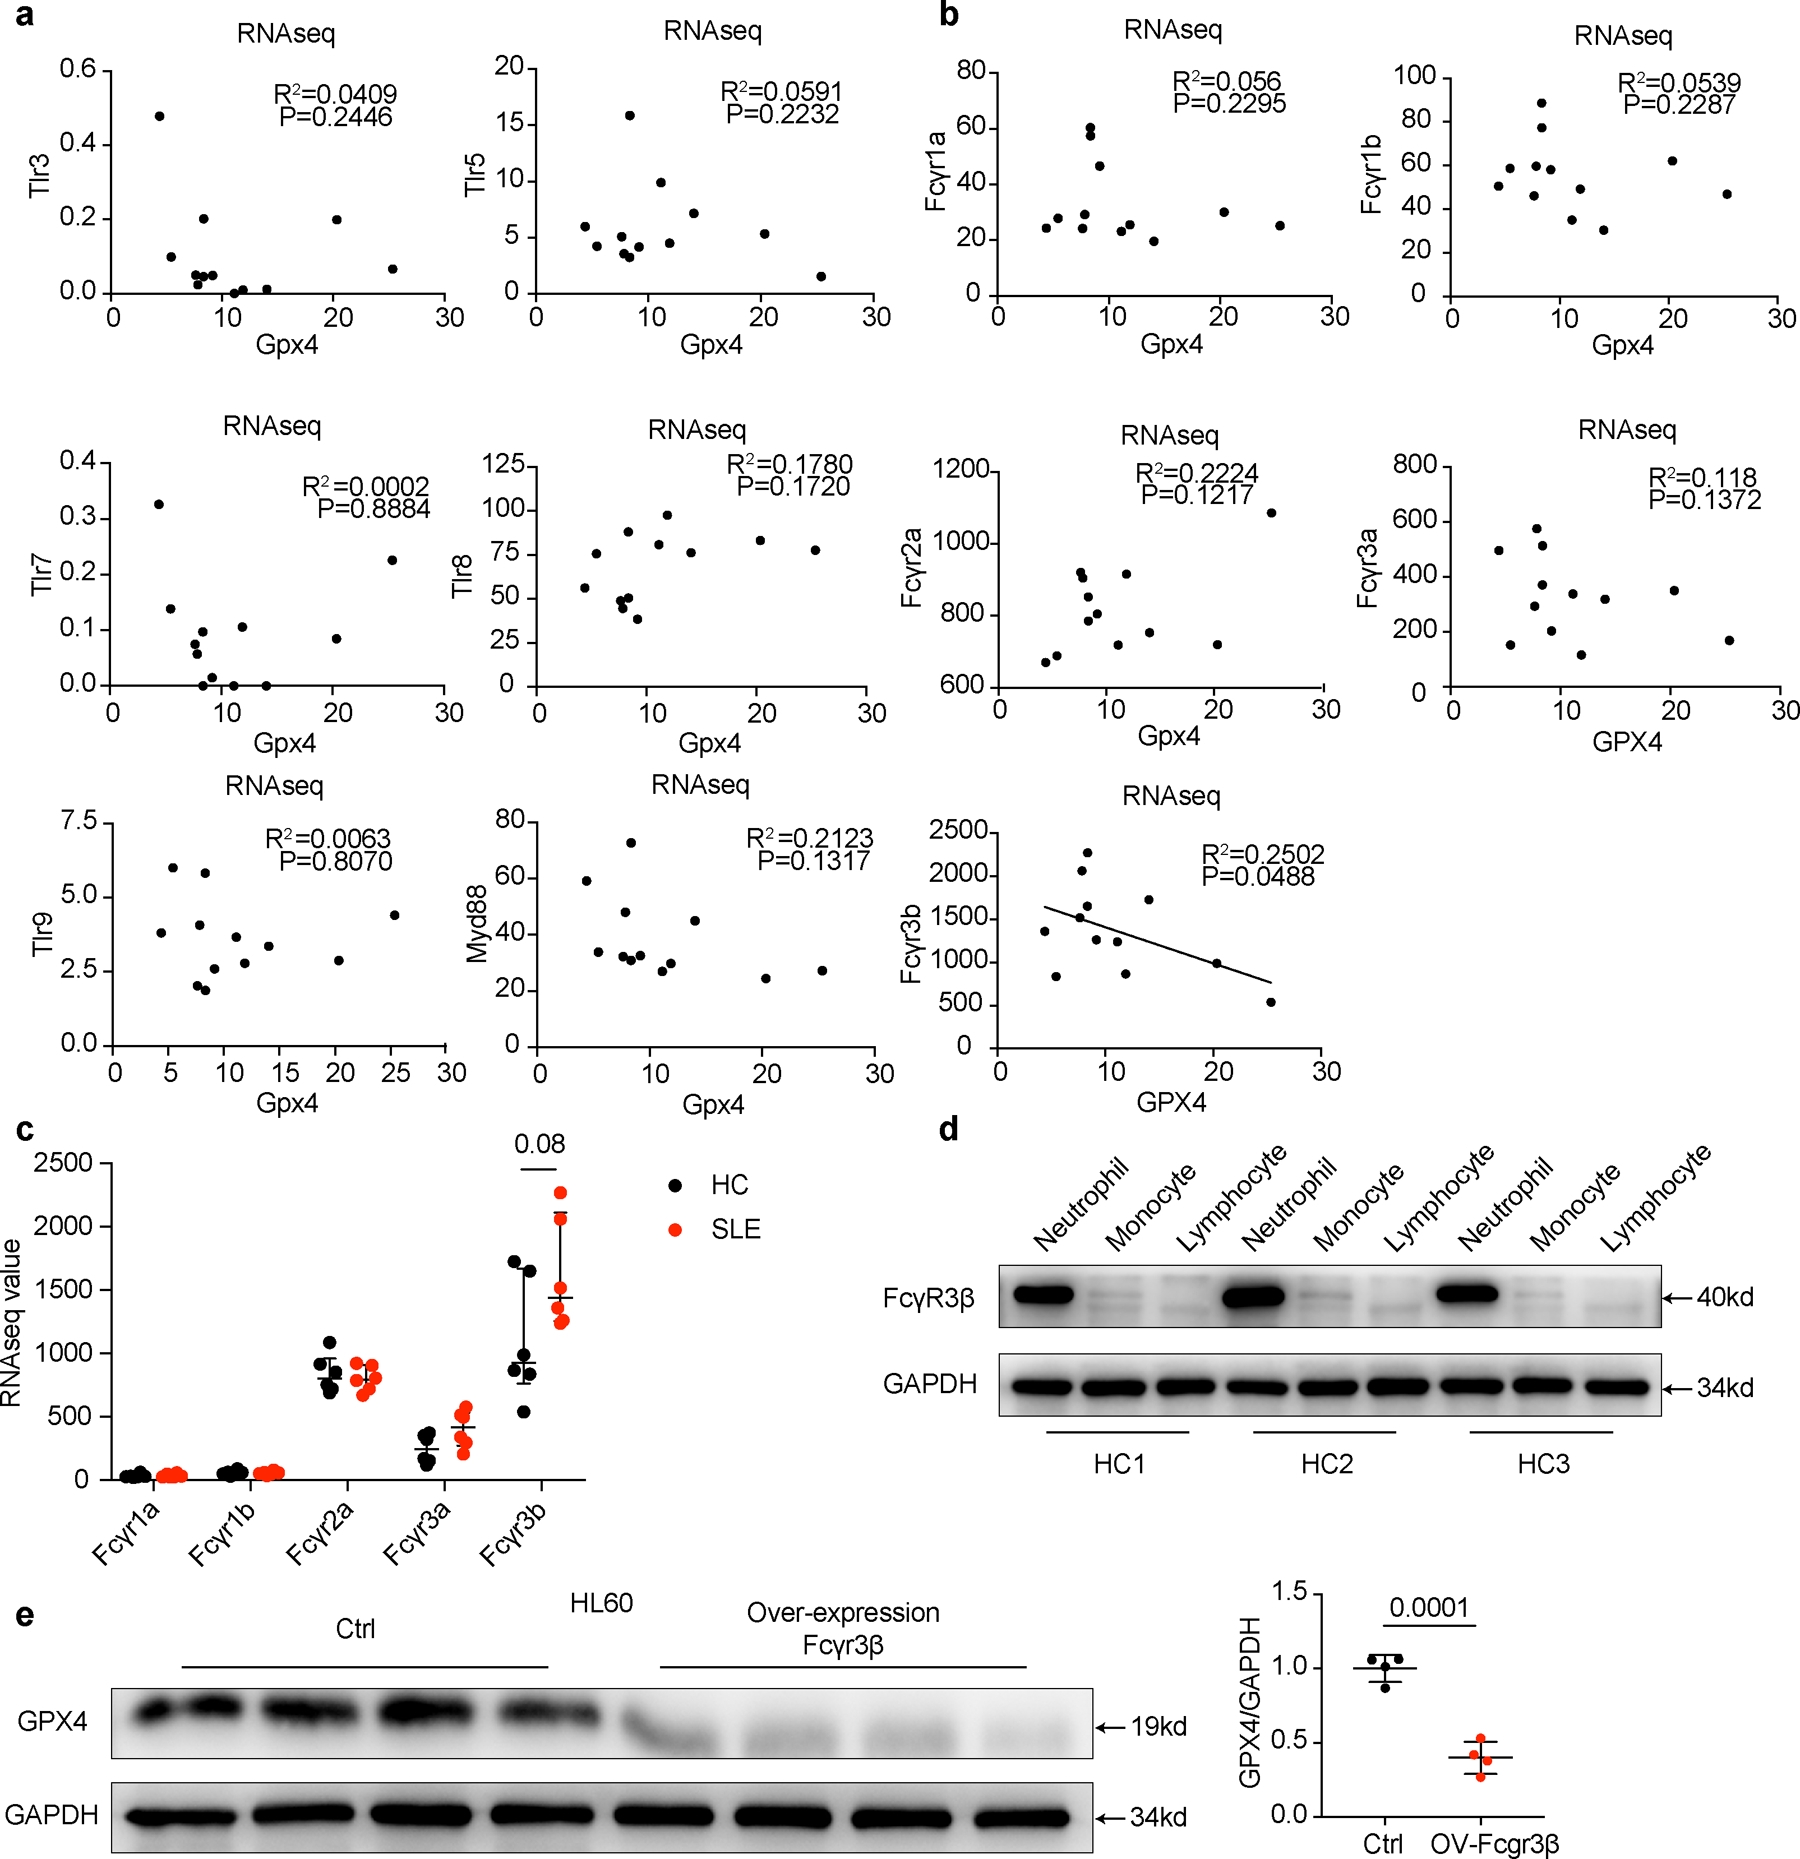
As autoantibodies and type I IFNs were found to be pivotal in inducing neutrophil ferroptosis, we next examined their effect on GPX4 expression in neutrophils. As expected, we observed that autoantibodies and IFN-α suppressed the expression of GPX4, whereas addition of anti-IFNAR or IgG depletion reduced the ability of SLE serum to downregulate GPX4 (Fig. 5i-l). Of note, in healthy donors, neutrophils express significantly lower GPX4 compared to other immune cells, which may explain why neutrophils are more sensitive to SLE serum induced ferroptosis considering their much lower threshold of ferroptosis induction (Extended Data Fig. 6f,g). Of note, GPX4 expression was not affected by NETosis inhibitors (Extended Data Fig. 6j,k). The expression correlation analysis indicated the involvement of FcγR3β in neutrophils ferroptosis by regulating GPX4 (Extended Data Fig. 7a,b). The high expression of FcγR3β in neutrophils aligned with the finding that the overexpression of FcγR3β significantly enhanced the sensitivity of HL60 cells to SLE IgG induced GPX4 reduction confirmed the role of FcγR3β in SLE IgG mediated neutrophil ferroptosis (Extended Data Fig. 7c-e). Because TLR-dependent mechanisms have been shown to trigger NETosis 3, 25, more information is needed to exclude their relevant contribution to neutrophil ferroptosis. Together, our results demonstrate that the autoantibodies and the increased IFN-α in SLE sera downregulate the expression of GPX4 and lead to neutrophil ferroptosis.
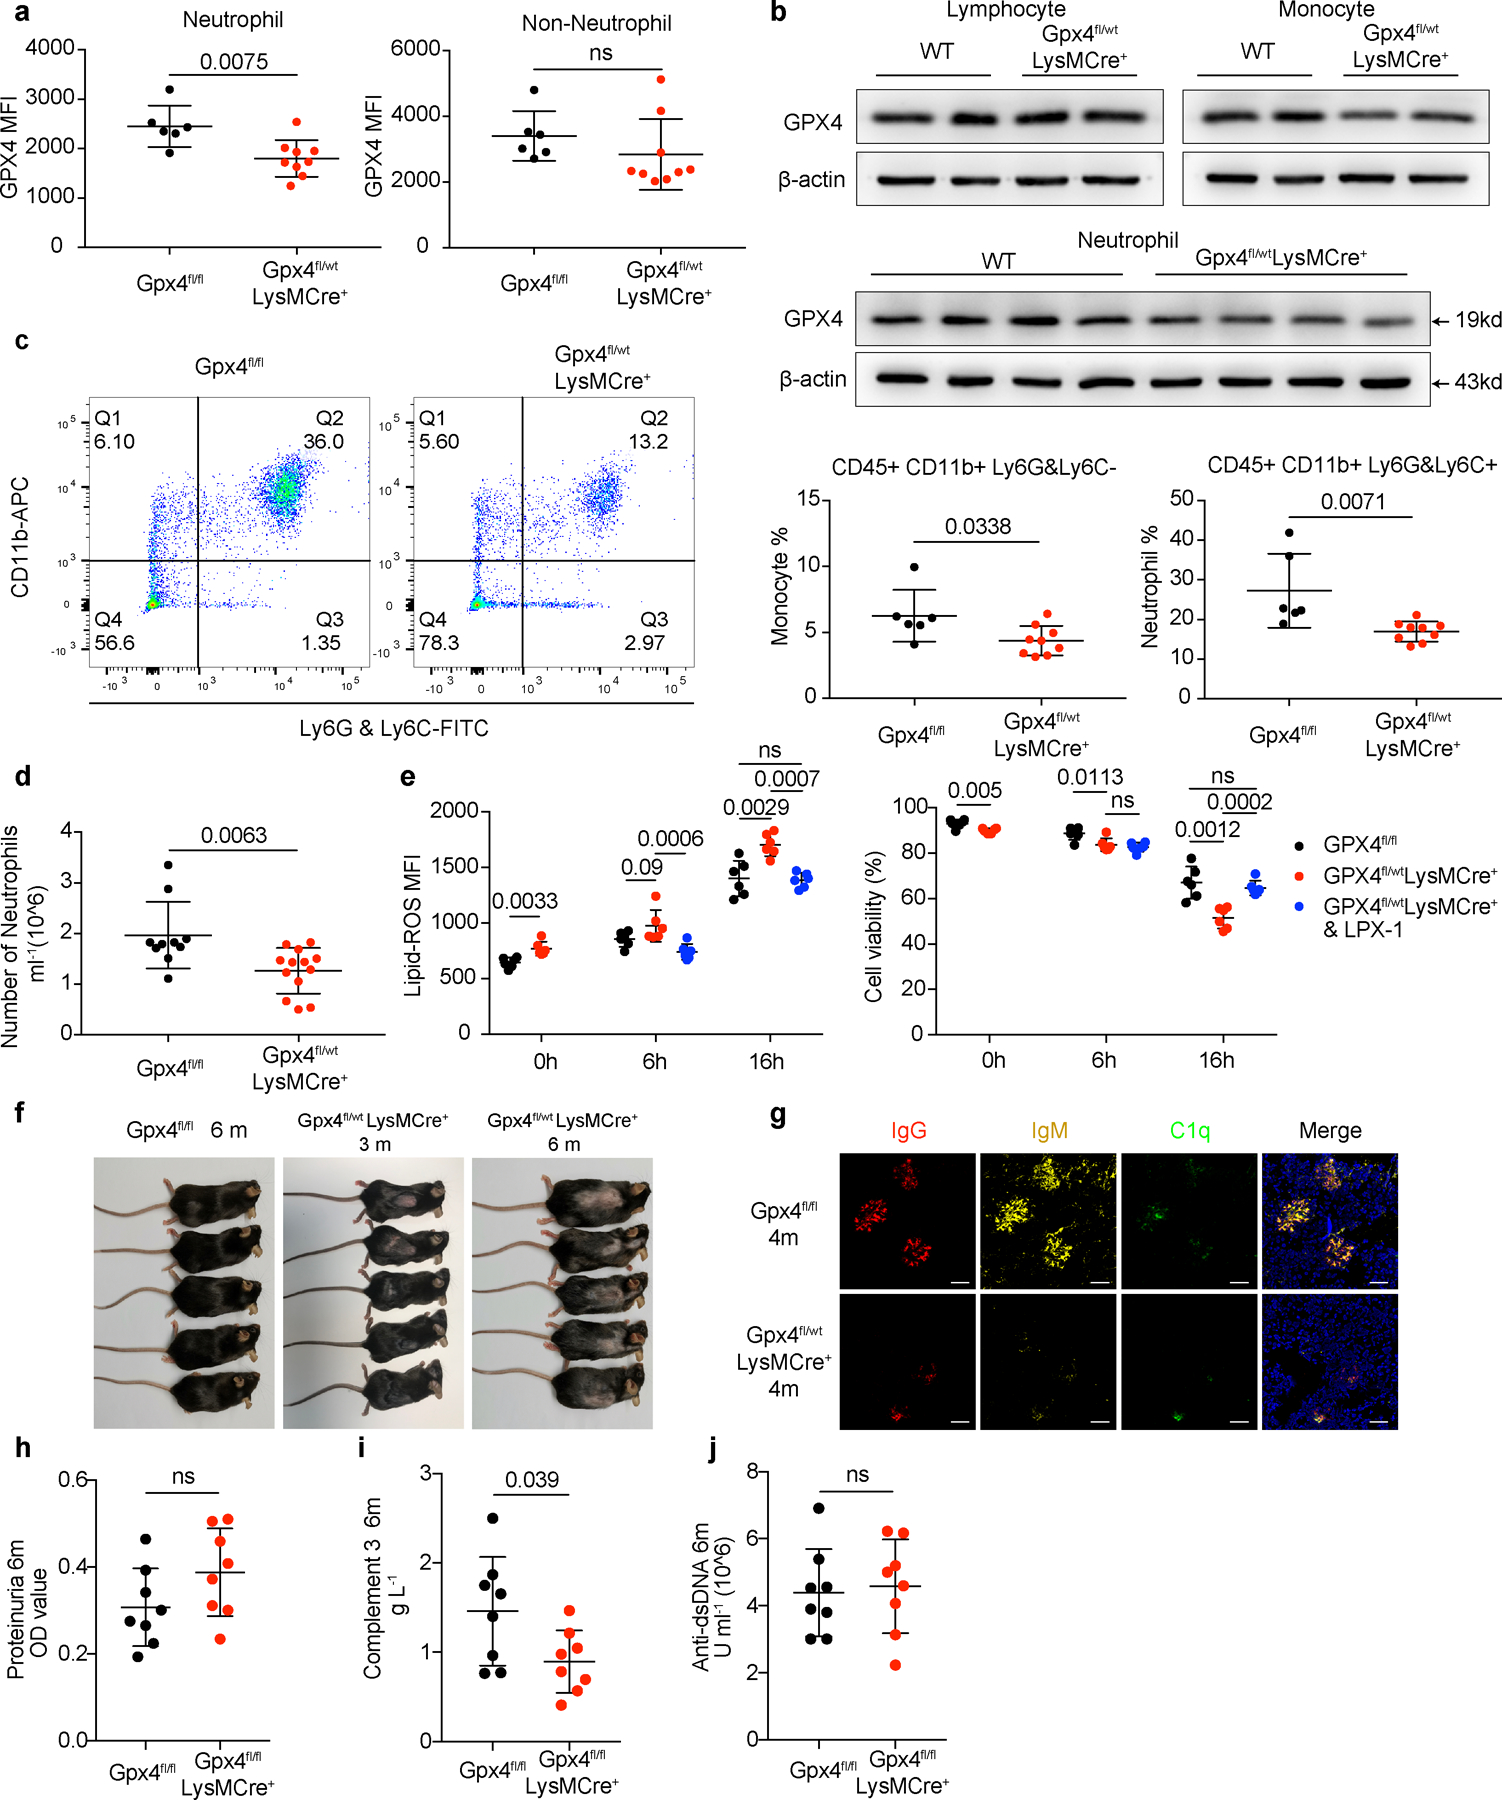
Gpx4fl/wt LysMCre+ mice develop lupus-like disease
To validate the pathogenic role of neutrophil ferroptosis in vivo, we generated a myeloid cell-specific Gpx4 haploinsufficient mouse (Gpx4fl/wt LysMCre+) to examine the direct contribution of defective GPX4 expression in neutrophils to the breakdown of immune tolerance. As expected, Gpx4fl/wt LysMCre+ mice showed reduction of GPX4 expression in neutrophils (Extended Data Fig. 8a,b). Of note, the percentage and absolute cell count of neutrophils in the peripheral blood were significantly decreased in Gpx4fl/wt LysMCre+ mice, which mimicked the neutropenia in patients with SLE (Extended Data Fig. 8c,d). The increased lipid-ROS production and decreased neutrophils viability in these mice phenocopied what we noted in patients with SLE, and also these defects could be rescued by addition of LPX-1 (Extended Data Fig. 8e). Furthermore, we observed lupus-like manifestations, including the production of inflammatory cytokines and autoantibodies, development of skin lesion, splenomegaly, lymphadenopathy, proteinuria and glomerular deposition of IgG, IgM and C3 in Gpx4fl/wt LysMCre+ mice (Fig. 6a-e, and Extended Data Fig. 8f,g), Interestingly, Gpx4fl/fl LysMCre+ mice with homozygous GPX4 reduction exhibited only mild signs of autoimmunity with extremely low neutrophils in vivo, which was consistent with the fact that neutrophils are requisite in lupus pathogenesis. (Extended Data Fig. 8h-j). Collectively, the Gpx4fl/wt LysmCre+ mice represent a new mouse to study lupus and the findings herein strongly support the role of neutrophil ferroptosis in the immunopathogenesis in SLE.
Fig. 6. Mice with Gpx4 haploinsufficiency in neutrophils develop spontaneous lupus-like disease.
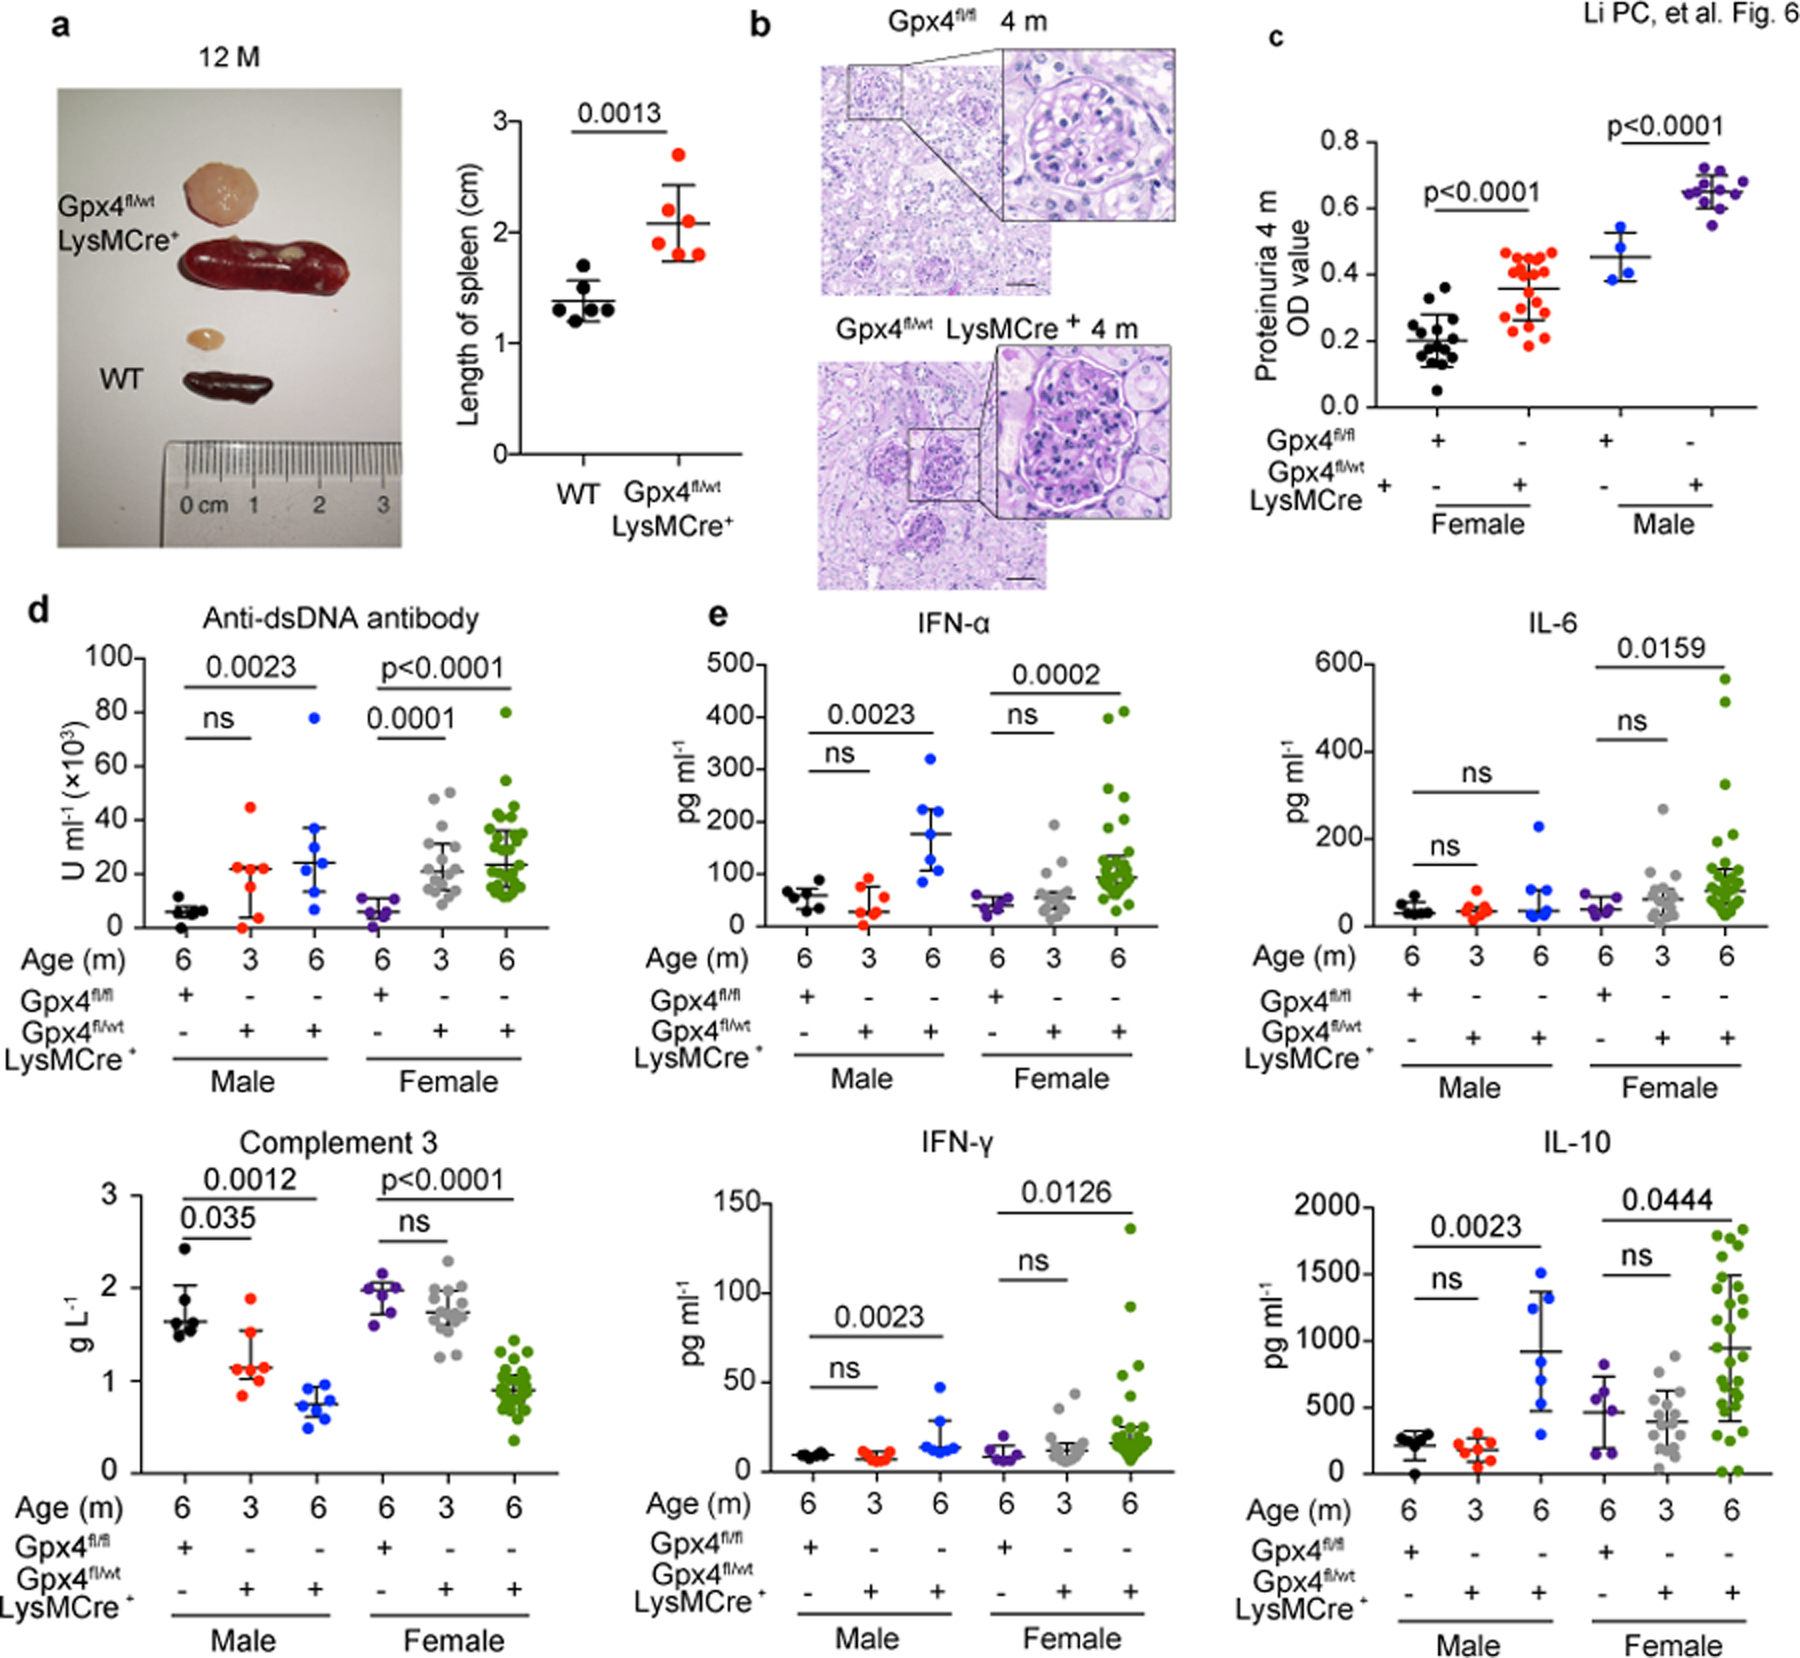
a. Size and length of spleen and lymph node from Gpx4fl/wtLysMCre+ and wild-type (WT) mice at 12 months of age (n=6). b. Glomeruli of WT and Gpx4fl/wtLysMCre+ mice at 4 months of age (PAS staining). The scale bar represents 50μm. c. Proteinuria of Gpx4fl/fl and Gpx4fl/wtLysMCre+ mice at 4 months of age (BCA assay) (Gpx4fl/fl: female=15, male=4, Gpx4fl/wt: female=20, male=11). d-e. The titers of circulating anti-dsDNA antibodies, complement 3 and various inflammatory factors in Gpx4fl/fl and Gpx4fl/wtLysMCre+ mice at different ages by ELISA and Multiplex cytokine detection (Gpx4fl/fl: female=6, male=6, Gpx4fl/wtLysMCre+: female (3m/6m) =16/29, male (3m/6m) =7/7). Data are shown as mean ± SD or median with interquartile range. ns p > 0.05. Two-tailed unpaired or paired Student’s t-test or Mann Whitney test were applied.
SLE IgG and IFN-α promote CREMα binding to the Gpx4 promoter
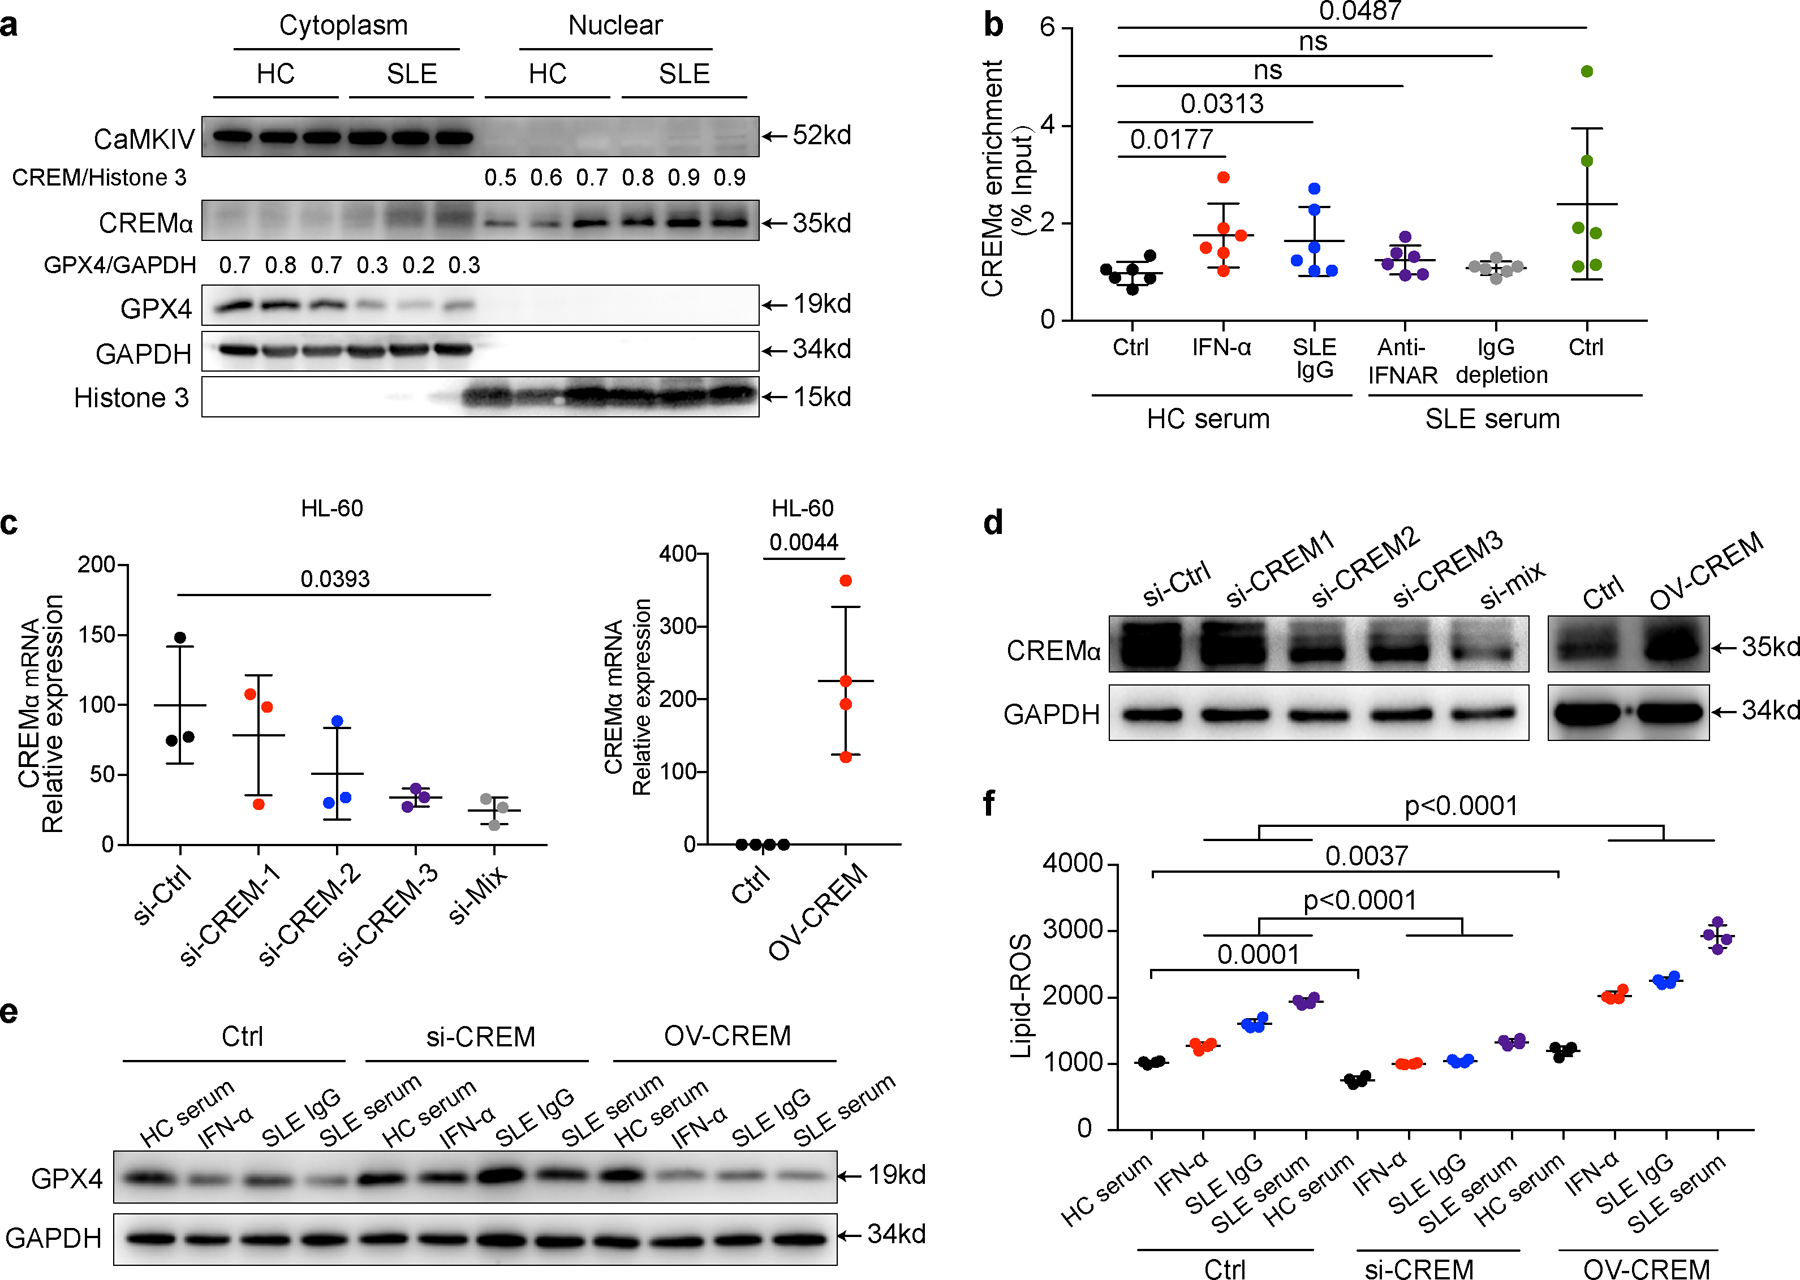
Next, we aimed to explore the molecular pathway regulating ferroptosis in neutrophils. By nucleotide sequence analysis, we found a conserved cAMP response element (CRE) located at 42~35 base pairs upstream of the human Gpx4 promoter, which was a critical binding site for cAMP-response element-binding protein (CREB) and cAMP response element modulator (CREM)26, 27. CREMα is a widely expressed transcriptional repressor that has been implicated in the termination of T cell immune responses, and increased CREMα in SLE T cells has been linked to decreased interleukin-2 (IL-2) and increased interleukin-17F (IL-17F) production28, 29. Calcium/calmodulin kinase IV (CaMKIV) has been demonstrated to be involved in the translocation of CREMα to the nucleus and its binding to the CRE sites30. As expected, we observed increased nuclear accumulation of both CaMKIV and CREMα in SLE neutrophils (Fig. 7a, Extended Data Fig. 9a). This phenomenon could also be induced in HC neutrophils by culture with SLE serum, or with HC serum supplemented with either SLE IgG or IFN-α (Fig. 7b,c). In contrast, SLE serum with either depletion of IgG or addition of IFNAR neutralizing antibodies failed to induce nuclear translocation of these two molecules (Fig. 7b,c). These data indicate that autoantibodies and type 1 IFNs induce nuclear translocation of both CaMKIV and CREMα in SLE neutrophils.
Fig. 7. IFN-α and SLE IgG suppresses the transcription of GPX4 by promoting binding of CREM to the Gpx4 promoter.
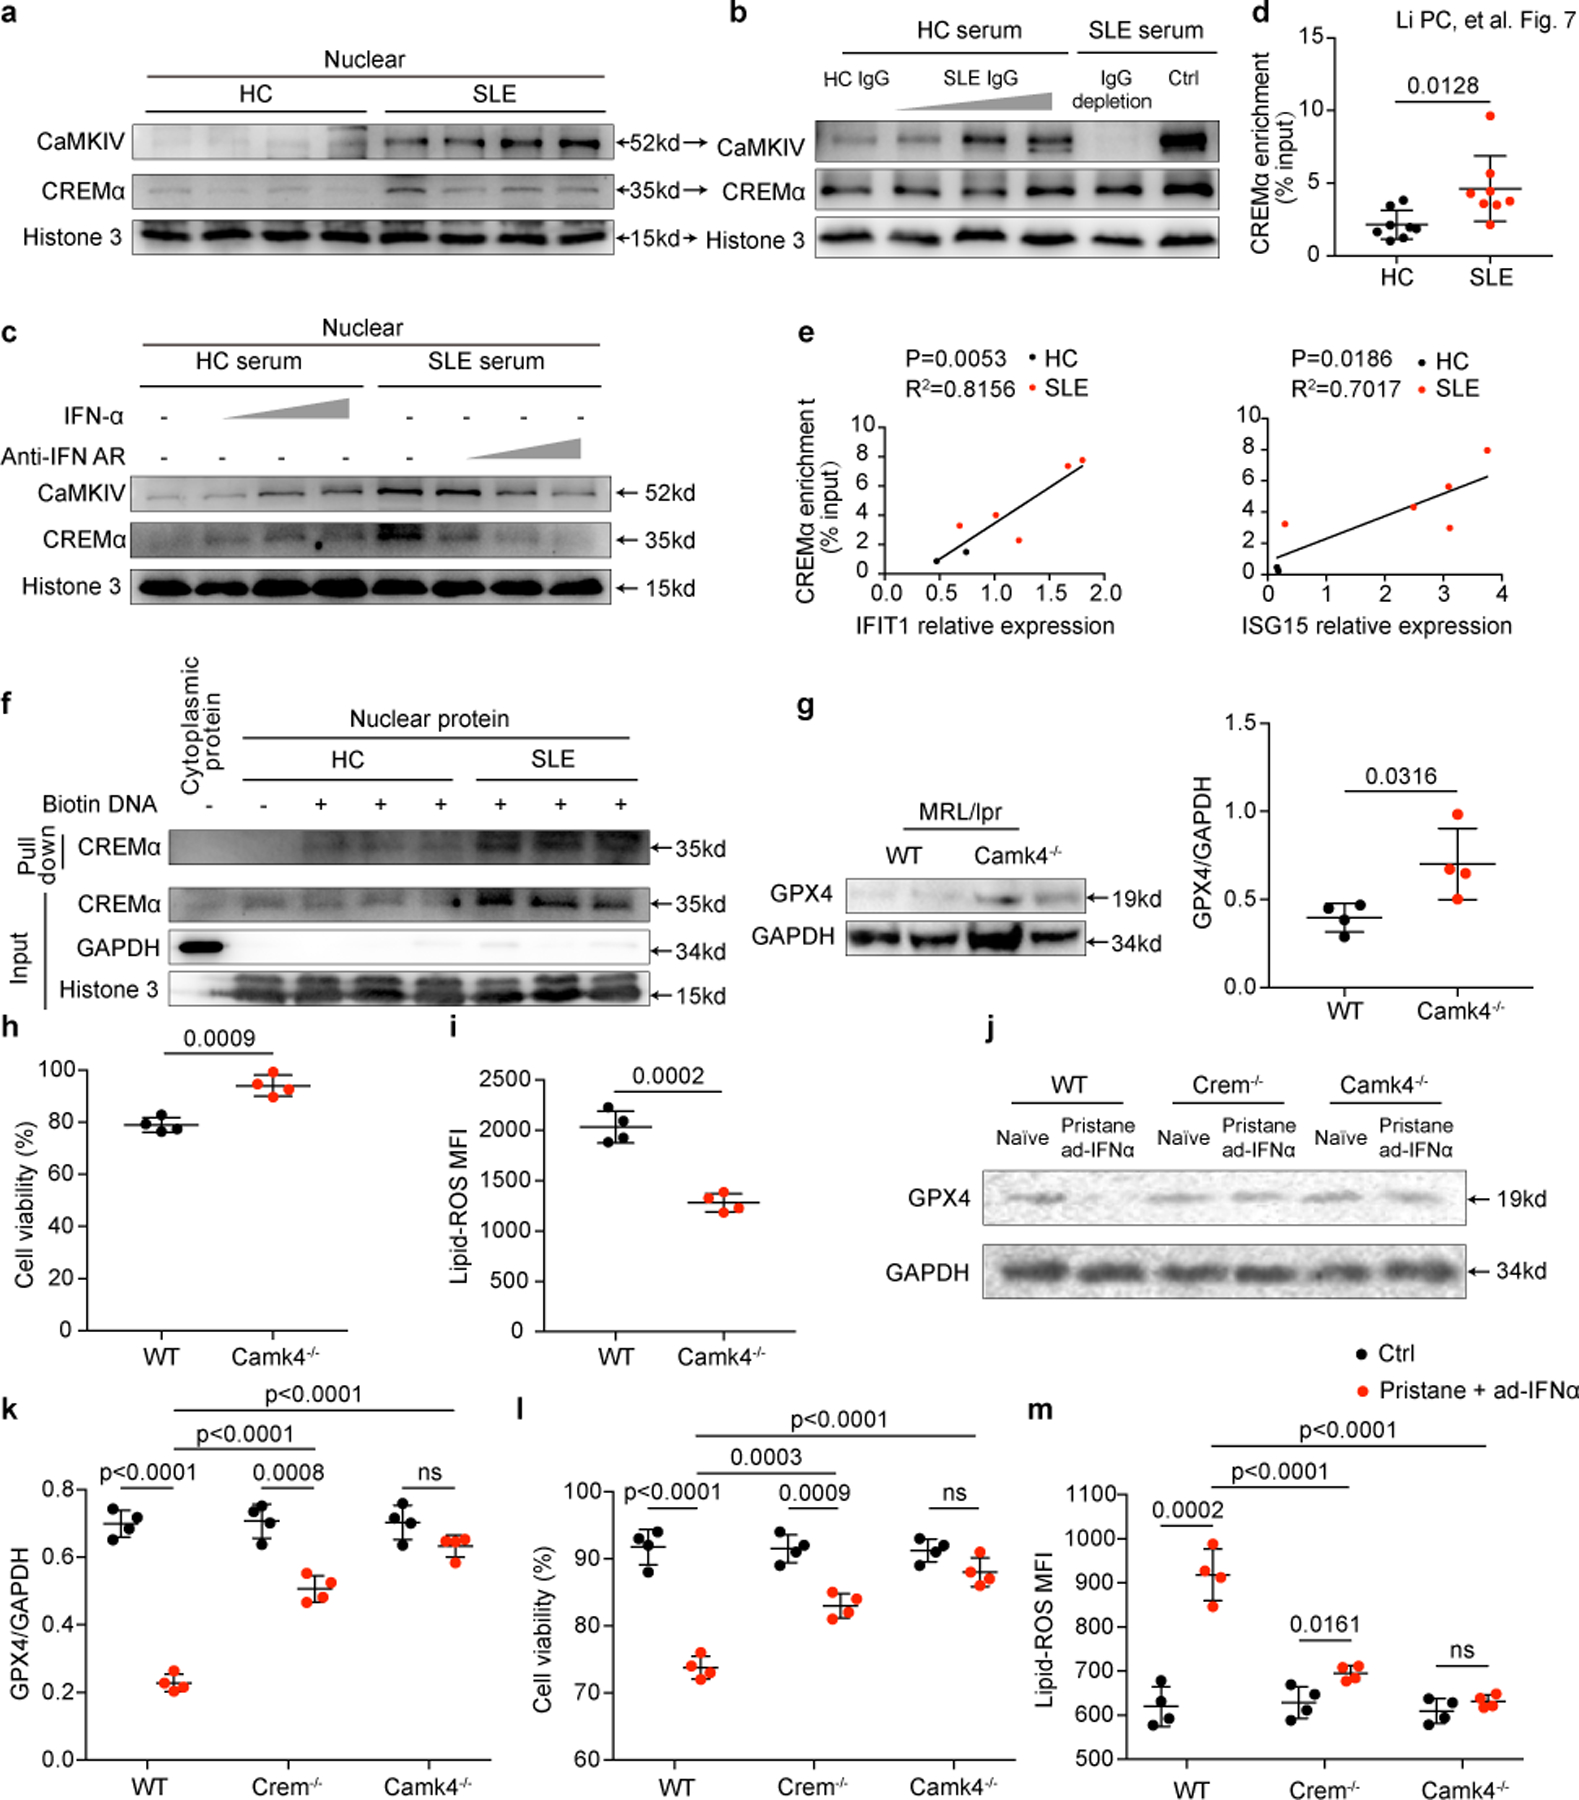
a. Western blot analysis of nuclear accumulation of CREMα and CaMKIV in neutrophil isolated from HCs and SLE patients. b-c. SLE IgG (1.2, 2.4, 3.6 g L−1) and IFNα (10^3, 10^4, 10^5 U ml−1) at different concentrations increased nuclear accumulation of CREMα and CaMKIV. d. SLE serum increased DNA-binding of CREMα to Gpx4 promoter area by chromatin immunoprecipitation analysis (n=8). e. Intracellular IFIT1 and ISG15 expressions correlated positively with the enrichment of CREMα in the Gpx4 promoter region. f. The interaction between the Gpx4-promotor and CREMα by DNA pulldown assay. g. Western blot analysis of GPX4 in neutrophil isolated from wild type and Camk4−/− MRL/lpr mice at 18 weeks of age (n=4). h. Dot plots show flow cytometry quantification of neutrophil viability in wild type (WT) and Camk4−/− MRL/lpr mice at 18 weeks of age (n=4). i. Flow cytometry quantification of lipid ROS in neutrophils from WT and Camk4−/− MRL/lpr mice (n=4). j-m. WT, Crem−/− and Camk4−/− mice were first administrated with pristane (i.p., 0.5 ml per mouse) for autoantibody induction and 2 months later i.v. with 2 x 10^9 pfu adenovirus IFNα (ad-IFNα) to overexpress IFNα in vivo. One more month after ad-IFNα administration, mice were euthanized and GPX4 expression, cell viability and lipid ROS in circulating neutrophils isolated from indicated mice were analyzed (n=4). Data are shown as mean ± SD. ns p > 0.05. Two-tailed unpaired Student’s t-test were applied.
In agreement with the increased CREMα nuclear accumulation, the enhanced binding of CREMα to the site 42 base pair upstream of Gpx4 promoter was observed in SLE neutrophils (Fig. 7d). In addition, enrichment of CREMα correlated positively with the activation of type I IFN signaling (Fig. 7e). Moreover, SLE neutrophils displayed increased binding of nuclear CREMα to the site 42 base pair upstream of the Gpx4 promoter as assessed by DNA pulldown assay (Fig. 7f). Accordingly, the binding of CREMα to the Gpx4 promoter was increased in HC neutrophils cultured with SLE serum, or HC serum supplemented with either SLE IgG or IFN-α, whereas the binding complex was reduced in SLE serum mixed with IFNAR neutralizing antibodies or depleted of IgG (Extended Data Fig. 9b).
Finally, siRNA knockdown of CREMα in neutrophil-like HL60 cells significantly abrogated GPX4 inhibition by SLE serum, autoantibodies, or IFN-α; in contrast, overexpression of CREMα decreased GPX4 expression (Extended Data Fig. 9c-e), supporting that CREMα is a key regulator upstream of GPX4 in neutrophils. As expected, HL60 cells stimulated with these factors displayed consistent changes in lipid-ROS (Extended Data Fig. 9f).
To validate the CREMα/ CaMKIV axis in neutrophil ferroptosis in vivo, we examined neutrophils in Camk4−/−MRL/lpr mice and observed higher levels of GPX4 and cell viability and lower lipid-ROS (Fig. 7g-i) compared with matched wild type controls, confirming that CaMKIV deficiency promoted GPX4 expression and reduced neutrophil ferroptosis. Furthermore, we induced lupus-like disease in wild type, CREM-deficient (Crem−/−) and CaMKIV-deficient (Camk4−/−) mice on the C57BL/6 background by administering pristane and adenovirus IFNα31, 32. As expected, the combined effect of autoantibodies and IFNα significantly decreased neutrophil GPX4 expression and viability and increased the production of lipid-ROS in wild type but not Crem−/− and Camk4−/− mice (Fig. 7j-m). Together, our findings demonstrate that autoantibodies and IFN-α in SLE promote the nuclear translocation of CREMα and its binding to the Gpx4 promoter in neutrophils, thus suppressing GPX4 expression and resulting in ferroptosis which contributes to disease development (Extended Data Fig. 10).
DISCUSSION
Herein, we verified the key role of GPX4 in neutrophil ferroptosis and identified two pivotal factors, serum autoantibodies and IFN-α, which were responsible for neutropenia in SLE by inducing neutrophil ferroptosis through the activation of CaMKIV/CREMα axis. The increased nuclear translocation of CaMKIV/CREMα led to the reduction of GPX4 accompanied by increased intracellular lipid-ROS, which finally resulted in neutrophil ferroptosis. The pathogenic role of neutrophil ferroptosis in SLE was further documented in vivo by the findings that genetic haploinsufficiency of Gpx4 in neutrophils led to the development of lupus-like disease in mice whereas approaches to reduce neutrophil ferroptosis significantly mitigated disease development in lupus-prone mice.
The immune system is poised to recognize and respond to a plethora of dying cells, components of which are potentially immunostimulatory and capable of triggering autoimmunity33. Short-lived neutrophils, the most abundant innate immune cells, represent one dominant source of dying cells in the daily burden34. In SLE, neutrophils are prone to cell death and the absolute numbers decrease remarkedly3. Increased levels of neutrophil NETosis have been reported in patients with SLE35. However, in our study, by carefully characterizing the pattern of neutrophil death in SLE, we demonstrated that ferroptosis is the major form of neutrophil death, although the contribution of NETosis cannot be excluded. Collectively, our data extend previous understanding on cell ferroptosis, which has been proposed to be associated with ischemic injury, degenerative and neoplastic diseases, and provide a missing link between neutropenia and inflammation in SLE9, 10.
Unlike the far better understood programmed cell death processes such as necroptosis and pyroptosis36, 37, ferroptosis and its exact role in inflammation and autoimmunity remain largely unknown. Two ways of quenching lipid peroxidation, that is, excessive oxidative modification of polyunsaturated fatty acids and the inhibition of GPX4, have been shown to induce cellular ferroptosis38. Here, serum IgG and IFN-α have been documented to induce neutrophil ferroptosis in patients with SLE by inhibiting GPX4 expression. However, further efforts are needed to explore additional ferroptosis triggers in SLE, including iron and lipid metabolites and also other potential signaling molecules, such as VDAC2/3, nuclear factor E2-related factor 2 (NRF2), NADPH oxidase (NOX) p5338. Of note, vitamin E suppresses autoantibody production in lupus39, which may be explained by its antioxidant effects to protect neutrophils away from ferroptosis. The immunogenicity of regulated cell death is critically dependent on the production of damage associated molecular patterns (DAMPs)40. Previous studies have indicated that ferroptosis results in the release of DAMPs, such as HMGB1 and LL-3741. By studying neutrophil death in SLE, we provide a model in which chronically elevated levels of autoantibodies and type I IFNs in patients with SLE provoke neutrophil ferroptosis, which through the release of autoantigens generates a positive feedback loop by providing stimuli to autoreactive B cells and plasmacytoid dendritic cells to produce autoantibodies and type I IFNs. However, further studies are needed to delineate in detail mechanisms whereby neutrophil ferroptosis boosts inflammation in autoimmune diseases and especially in SLE. In addition, ferroptosis of other tissue resident cells may contribute to the expression of autoimmune diseases. Previously, ferroptosis was demonstrated to account for neuronal cell death in patients with multiple sclerosis and mice immunized to develop encephalomyelitis42.
In summary, whereas most current theories concerning the induction of autoimmune diseases implicate the generation of autoreactive T and B lymphocytes, our findings propose a new paradigm which places neutrophil ferroptosis at the center of the pathogenesis of SLE and highlights the importance of targeting GPX4 transcription and neutrophil ferroptosis in the treatment of lupus.
METHODS
Ethics Statement
Informed consent was obtained from all human participants. Medical and economic support were provided for participants. All in vivo experiments were performed according to the guidance of the German Animal Welfare Law. Our study was approved by the Institutional Review Board and Animal Care and Use Committee of Peking Union Medical College Hospital (PUMCH) (JS-1196), Beth Israel Deaconess Medical Center’s Institutional Review Board (2006P000298) and Animal Care and Use Committee (088–2015).
Chemicals, cytokines and antibodies
Chemicals and cytokines used were as follows: recombinant human IFN α2b (11100–1, PBL assay science), RSL3 (S8155, Selleck), liproxstatin-1 (LPX-1) (S7699, Selleck), deferoxamine mesylate (DFO) (S5742, Selleck), necrostatin-1 (Nec-1) (S8037, Selleck), necrosulfonamide (NSA) (S8251, Selleck), Z-VAD-FMK (S7023, Selleck), PMA (P8139, Sigma), GSK2795039 (HY-18950, MedChem Express), APX-115 (HY-120801, MedChem Express), Cl-amidine (506282, Merck), β-ME (M6250, Sigma), dimethyl sulfoxide (DMSO) (D8371, Solarbio), cytoxan (CTX) (S2057, Selleck), BODIPY™ 581/591 C11 (D3861, Invitrogen), penicillin (Gibco), streptomycin (Gibco), lysing buffer (555899, BD Pharmingen), DAPI (S2110, Solarbio), 7AAD (559925, BD Pharmingen), propidium iodide (P1304MP, Thermo Scientific), Sytox Green (S7020, Invitrogen), Hoechst (62249, Thermo Scientific) and 16% formaldehyde (12606S, CST).
Antibodies used were as follows: anti-glutathione peroxidase 4 (GPX4) antibody (EPNCIR144, ab125066, Abcam; 1:1000), anti-CaMKIV antibody (ab3557, Abcam; 1:1000), anti-histone 3 antibody (ab1791, Abcam; 1:1000), anti-C1q antibody (4.8, ab182451, Abcam, 1:200), anti-neutrophil elastase antibody (ab68672, Abcam, 1:200), anti-CREM antibody (WB: nbp2–16009, NOVUS; 1:1000. CHIP: A5624, Abclonal), anti-GAPDH antibody (10494–1-AP, Proteintech; 1:1000), anti-β-actin (BE0022, Easybio; 1:1000), anti-SLC7A11 antibody (26864–1-AP, Proteintech; 1:1000), anti-histone H3 (citrulline R2) antibody (EPR17703, ab176843, Abcam; 1:1000), anti- FcγR3β antibody (MM0272–5L11, ab89207, Abcam; 1:1000), anti-rabbit IgG-HRP (BE0101, Easybio; 1:5000), anti-human IgG-HRP (BE0122, Easybio; 1:5000), anti-mouse IgG-HRP (BE0102, Easybio; 1:5000), PE conjugated anti-mouse Ly-6G (127607, Biolegend; 1:100), PE conjugated anti-human CD16 (561313, BD Pharmingen;1:100), APC conjugated anti-mouse/human CD11b (101212, Biolegend; 1:100), FITC conjugated anti-mouse CD45 (103108, Biolegend; 1:100), FITC conjugated anti-mouse Ly-6G&Ly-6C (553127, BD Pharmingen; 1:100), TruStain FcX anti-CD16/32 (422302, Biolegend; 1:100), goat pAb to mouse IgM Alexa Fluor 647 (ab150123, Abcam; 1:200), goat pAb to rabbit IgG Alexa Fluor 488 (ab150077, Abcam; 1:200), donkey pAb to rabbit IgG Alexa Fluor 647 (ab150075, Abcam; 1:100), goat anti-mouse IgG Alexa Fluor 594 (405326, Biolegend; 1:200), mouse monoclonal antibody against human interferon Alpha/Beta Receptor 1 (MMHAR-3, 21370–3, pbl assay science), anti-CXCL11 antibody (ab9955, Abcam), and anti-human IL-12/23 (ustekinumab) (HY-P9909, Medchem Express).
Patients and healthy controls (HCs)
SLE patients involved in this study were recruited from two cohorts, all fulfilling the diagnosis of SLE according to the criteria established by the American College of Rheumatology43. Peripheral blood samples were obtained from new onset untreated patients recruited from PUMCH. SLE patients were treated with standard of care medications including corticosteroid and immunosuppressants (such as mycophenolate mofetil (MMF) or CTX) combined with hydroxychloroquine for at least 2 months, and post-treatment blood samples from these same SLE patients were collected. WBC count, neutrophil count, and anti-dsDNA antibodies were measured and analyzed on the day of blood collection. Disease activity was assessed by the modified SLEDAI-2000 calculated by omitting the immunologic variables including anti-dsDNA antibodies and serum complement concentrations from the SLEDAI-2000 44.
SLE patients from another cohort (Caucasian n=13, African Americans n=15) were recruited from the Division of Rheumatology, Beth Israel Deaconess Medical Center.
Rheumatoid arthritis, ankylosing spondylitis, and Behcet’s disease patients involved were recruited from PUMCH, and were all untreated and diagnosed according to the corresponding criteria45, 46, 47. Patients with infections or severe underlying disorders were also excluded. HCs were age and gender-matched individuals without autoimmune, inflammatory or infectious diseases. Clinical characteristics and the treatment of SLE patients included in the study were shown in Supplementary Table 1-5 and 7.
Mice
Female MRL/Mpj and MRL.Mpj-Faslpr (MRL/lpr) mice were purchased from Shanghai Slack Laboratory, and maintained in the specific-pathogen-free conditions of PUMCH animal care facility.
NZB and NZW mice were purchased from Jackson lab, bred at Beijing Vital River Laboratory, and the first female generation (NZB/W F1) after crossbreeding was used for experiments.
The C57/B6-Gpx4fl/fl (027964) and C57/B6-LysMcre (004781) mice were purchased from The Jackson Laboratory. The Gpx4fl/fl allele has loxP sites flanking exons 2–4 of the Gpx4 gene. The LysMcre knock-in allele has a nuclear-localized Cre recombinase inserted into the first coding ATG of the lysozyme 2 gene (Lyz2) both abolishing endogenous Lyz2 gene function and placing NLS-Cre expression under the control of the endogenous Lyz2 promoter/enhancer elements. The Gpx4fl/fl mice were bred to the LysMcre mice to generate LysMcre+ Gpx4fl/wt versions of these strains. Gpx4fl/fl and LysMcre+ Gpx4fl/wt mice were used for experiments. All mice were bred and maintained in the animal facility of Beijing Vital River Laboratory under specific-pathogen-free conditions.
Female Camk4−/− C57BL/6 mice were obtained from The Jackson Laboratory. Female Crem−/− C57BL/6 and Camk4−/− MRL/lpr, mice are generated and maintained in the specific-pathogen–free animal facility at Beth Israel Deaconess Medical Center, Harvard Medical School. In all experiments, mice were carefully matched for age, sex, weight, and genetic background.
In-vivo experiments
In ferroptosis rescue experiments, LPX-1 (10 mg/kg), CTX (20 mg/kg) or 0.1ml DMSO (10%) was administered intraperitoneally to female MRL/Mpj and MRL/lpr mice every other day for six weeks beginning at 12 weeks of age. Urine was collected in the morning once a week. Mice were sacrificed at 18 weeks of age, and spleen, kidneys, lymph nodes, and peripheral blood were collected for analysis. For in vivo treatment, MRL/lpr mice were administered 0.1 ml DMSO (10%), Cl-amidine (20 mg/kg), LPX-1 (10 mg/kg), or Cl-amidine (20 mg/kg) combined with LPX-1 (10 mg/kg) intraperitoneally every other day for 3 weeks starting at 12 weeks of age48. Mice were euthanized at 15 weeks of age and spleen, lymph nodes, urine and peripheral blood were collected for analysis.
Peripheral blood and bone marrow were collected from three- or seven-month-old NZB/W F1, Gpx4fl/fl and Gpx4fl/wt LysMcre+, MRL/Mpj and MRL/lpr mice. Neutrophils, lymphocytes and monocytes were isolated with mouse peripheral blood lymphocyte separation kit (P8620, Solarbio), mouse bone marrow neutrophil isolation kit (P8550, Solarbio), mouse peripheral blood neutrophil separation kit (P9201, Solarbio) and mouse peripheral blood monocyte separation kit (P5230, Solarbio)
Gpx4fl/fl and Gpx4fl/wt LysMcre+ mice were observed without interventions. Urine was collected in the morning once a month, and tail venous blood was collected for analysis. Absolute neutrophil counts were analyzed by flow cytometry. Neutrophils were isolated and cultured in complete medium supplemented with LPX-1 (1 μM) for 16 hours and assessed for cell viability and lipid-ROS.
Pristane-induced murine lupus: 2 months old female Wild type, Crem−/− and Camk4−/− C57BL/6 were i.p. administered with Pristane (0.5 ml/mouse, P2870, Sigma). After 2 months, 2 × 10^9 pfu Adenovirus IFNα per mouse were i.v. administered and mice were euthanized 1 month later.
Cell isolation and in vitro culture
To isolate neutrophils and peripheral blood mononuclear cells (PBMCs), blood was layered on Ficoll-Hypaque density gradients and centrifuged following the manufacturer’s instructions. Erythrocytes were lysed with Lysing Buffer. Monocytes, B cells and plasmacytoid dendritic cells (pDC) were purified with CD14 microbeads (130050201, Miltenyi), CD19 microbeads (130050301, Miltenyi) and plasmacytoid dendritic cells isolation kit II human (130097415, Miltenyi) respectively. The preparation contained greater than 98% neutrophils as confirmed by flow cytometry using anti-CD16 and anti-CD11b antibodies. Cells were cultured in complete RPMI 1640 basic medium (Gibco) with 100 U/mL penicillin, 100 μg/mL streptomycin, and 20% serum from 10 randomly selected SLE patients or age-and gender-matched HCs, incubated at 37℃ in a humidified atmosphere of 20% O2 and 5% CO2. IFN-α2b (103-105 U/ml), anti-IFNAR1 (0.1–10 μg/ml), anti-CXCL11 antibody (0.1–10μg/ml), Ustekinumab (0.1–10 μg/ml), RSL-3 (10 μM), LPX-1 ( 0.01–1 μM), DFO ( 1–100 μM), Nec-1 ( 0.01–1 μM), NSA ( 0.01–1 μM), Z-VAD (0.01–1 μM), β-ME (10 or 50 μM), PMA (50nM), Cl-amidine (100 μM), GSK2795039 (10 μM), or APX-115 (5 μM) were added in corresponding experiments. Neutrophils were cultured for 4–30 hours to further analysis. Cultural supernatant of pDC and B cells was collected at 24h and 72h respectively.
In relevant experiments, purified SLE IgG (1.2–3.6 g/L) was added to complete medium.
Quantification of NET formation by Fluorescence Microscope
HC neutrophils were cultured in complete RPMI medium supplemented with 20% HC or SLE serum in the presence or absence of liproxstatin-1 (1 μM), Cl-amidine (100 μM), IFN-α2b (105 U/ml), SLE IgG (3.6g/L) for 4 or 16 hours at a density of 1 × 10⁵ cells/ml in 96-well plates. The release of NET-DNA was measured with DAPI and propidium iodide or Sytox Green and Hoechst by Fluorescence Microscope (ZEISS). Neutrophils whose DNA area exceeds 400 μm2 were considered undergoing NETosis as previously described49.
Cell viability quantification
The viability of freshly isolated or cultured neutrophils, monocytes and lymphocytes was determined by the Annexin V/7-AAD assay with the PE Annexin V Apoptosis Detection Kit I (559763, BD Pharmingen). Annexin V (-) and 7AAD (-) cells were considered living cells. Lactate dehydrogenase (LDH) release was measured with Cytotoxicity Detection Kit according to manufacturer’s instructions (11644793001, Merck). The viability quantification by fluorescence microscope was similar to NET quantification, measured with Sytox Green and Hoechst.
IgG purification
SLE or HC IgG was purified using the ProteoExtract Albumin/IgG Removal Kit (122643, Merck) or Protein A/G (BE6868, Easybio) according to the manufacturer’s protocols. For kit-isolated IgG, 0.75M NaHCO3 was used to neutralize the pH of the eluent. IgG was enriched by centrifugal filters (UFC905096, Merck) and resuspended in PBS.
Transmission Electron Microscopy
Neutrophils freshly isolated or cultured with vehicle (DMSO) or RSL-3 (10 μM) for 4 hours were fixed with 2.5% glutaraldehyde in 0.1 M Sorenson’s buffer for 3 hours, and then treated with 1% OsO4 in 0.1 M Sorenson’s buffer for 2 hours. Enblock staining used 1% tannic acid. After dehydration through an ethanol series, neutrophils were embedded in Lx-112 (Ladd Research Industries) and Embed-812 (EMS). The thin cut sections were stained with 1% uranyl acetate and 0.4% lead citrate and examined under the TEM-1400 plus electron microscope. Electron micrographs were taken at 5,000–50,000-fold magnification. 8 SLE patients and 6 HCs were evaluated for mitochondrial vacuolization by EM. We randomly collected 10 neutrophils per sample under the lens of 50,000 times and counted the number of mitochondria with vacuoles for quantitative analysis. Images were optimized using Photoshop CC 2017 and Illustrator CC 2017 (Adobe).
Flow cytometry
For neutrophil percentages measurement, whole blood cells of mice were stained with combinations of antibodies including anti-Ly-6G, anti-CD11b and anti-CD45 for 30 minutes on ice in staining buffer. For detection of intracellular GPX4 expression, cells were stained with anti- Ly-6G&Ly-6C and anti- GPX4 antibody after fixation and permeabilization with Cytofix/Cytoperm solution (554714, BD Pharmingen). After incubation for 2 hours, cells were washed before being stained with anti-rabbit IgG Alexa Fluor 647. For the lipid ROS detection, neutrophils were washed twice and incubated for 15 min with 2 μM C11-BODIPY (581/591). Afterward, neutrophils were washed twice and resuspended in PBS. Lipid-ROS was assessed by measuring the fluorescence change of C11-BODIPY at 488nm using BD FACS Aria II (BD, Biosciences, CA, USA). Data was analyzed using FlowJo (version 10.4, Tree Star).
Multiplex cytokine detection
Cytokines and immunoglobulin in human and mouse plasma were measured with the LEGENDplexTM mouse Th cytokine panel (740005, Biolegend), mouse immunoglobulin isotyping panel (740493, Biolegend), human cytokine panel 2 (740102, Biolegend), human Th cytokine panel (740721, Biolegend), and human proinflammatory chemokine panel (740003, Biolegend) following the manufacturers’ instructions. Data analysis was carried out using LEGENDplex™ Data Analysis Software (version 8.0). Heatmaps were constructed using the Graphpad Prism 7, and Venn diagrams completed on http://bioinformatics.psb.ugent.be/.
Enzyme-linked immunosorbent assay (ELISA)
Mouse serum was diluted 1:100 with assay buffer for anti-dsDNA antibody detection and 1:25000 for complement 3 detections. Assays were carried out with Mouse Anti-dsDNA IgG ELISA Kit (5120, Alpha Diagnostic Intl. Inc.) and Complement 3 ELISA Kit (6270, Alpha Diagnostic Intl. Inc.), following the manufacturer’s protocols. Urine protein concentrations were detected using BCA Protein Assay Kit (23225, Thermo Scientific). IgG of B cell cultural supernatant was measured by Human IgG ELISA Kit (E88–104, Bethyl).
Western blot and nuclear separation
Cells were lysed on ice using RIPA buffer (Huaxingbio) supplemented with a protease inhibitor and phosphatase inhibitor cocktail (78446, Thermo Scientific). Protein concentration of lysates was determined using the BCA Protein Assay Kitaccording to manufacturers’ instructions. Cell lysates were boiled for 10 min at 95°C with SDS, and subjected to 12% SDS–PAGE, and then transferred to PVDF membranes (1620177, Bio-Rad). The membranes were blocked and then incubated with anti-GPX4, anti-CREM, anti-CaMKIV, anti-SLC7A11, anti- FcγR3β, anti-Histone 3, anti-GAPDH or anti-β-actin antibodies overnight at 4℃. The membranes were washed and incubated with anti-rabbit or -mouse IgG-HRP for 1h. Protein bands were visualized with the western blotting detection system Tanon-5200 (Bio-Tanon, China). Gray value analysis was done by ImageJ (version 1.50g, NIH) software. Nuclear content of cells was isolated and determined by Cytoplasmic & Nuclear Extraction Kits (SC-003, Invent) according to manufacturer’s instructions.
Immunofluorescence
For NET staining, freshly isolated neutrophils (105 cells) from HC and SLE patients were transferred into a 24- well plate with BioCoat poly-L-lysine slides (Corning), and cultured in complete RPMI 1640 basic medium with 20% HC or SLE serum in the presence or absence of liproxstatin-1 (1 μM) and PMA (50 nM). After incubation at 37℃ for 4 hours, cells were fixed with 4% paraformaldehyde. NETs were stained using anti-neutrophil elastase antibody for 2 hours, and then anti-rabbit IgG Alexa Fluor 488. Slides were mounted with anti-quenching agent containing DAPI.
Kidneys were taken from mice, fixed in 4% paraformaldehyde, embedded in paraffin and stained with Periodic Acid-Schiff (PAS). The second kidney from each mouse was frozen in O.C.T compound (Tissue-Tek) at −80℃, and used for assessment of immune complex deposition. 6-μm sections of snap-frozen kidney tissue were treated with blocking buffer (100 mM Tris-HCl, pH 8.0, 0.3% Triton X-100, 2% BSA, and 50 μg/ml goat non-specific IgG) for 1 hour. Afterward, the tissue was stained with anti-mouse IgG Alexa Fluor 594, anti-mouse IgM Alexa Fluor 647, or anti-C1q antibody plus anti-rabbit IgG Alexa Fluor 488. Coverslips were mounted in anti-quenching agent with DAPI. All slides were examined with the A1 HD25/A1R HD25 Nikon confocal laser microscopy (Nikon, Japan). Images were optimized using Photoshop CC 2017 and Illustrator CC 2017 (Adobe).
RNA isolation and qPCR
Total RNA was extracted with TRIzol (10296010, Invitrogen), and converted to complementary DNA using PrimeScript™ RT Master Mix (RR036A, Takara Bio). Real-time quantitative PCR was carried out with the Applied Biosystems 7500 using SYBR Premix Ex TaqTM Ⅱ (RR820A, Takara Bio). The relative RNA expression level was normalized to GAPDH mRNA according to the △△Ct calculation method.
The primers used were as follows:
GAPDH
Forward:5’- TCAACGACCACTTTGTCAAGCTCA-3’
Reverse: 5’- GCTGGTGGTCCAGGGGTCTTACT-3’,
GPX4
Forward:5’- AAGTGGATGAAGATCCAACCCAAG- 3’
Reverse: 5’- GGGGCAGGTCCTTCTCTATCA- 3’,
CREM
Forward:5’- CGTCGACATTCTTTGGCAGC-3’,
Reverse: 5’- ATGACCATGGAAACAGTTGAATCCCA-3’,
ISG15
Forward:5’- TGGACAAATGCGACGAACCTC -3’,
Reverse: 5’- TCAGCCGTACCTCGTAGGTG -3’,
IFIT1
Forward:5’- GCGCTGGGTATGCGATCTC-3’,
Reverse: 5’- CAGCCTGCCTTAGGGGAAG-3’
RNA-seq analysis
Total RNA of freshly isolated HC or SLE neutrophils was extracted with TRIzol, and subjected to RNA-seq analysis. RNA sequencing was performed by the Novogene Experimental Department using Illumina Hiseq 4000 platform. Raw reads of fastq format were firstly processed through in-house perl scripts and all the downstream analyses were based on the clean data with high quality. Index of the reference genome was built using bowtie2 v2.2.8 and paired-end clean reads were aligned to the reference genome using HISAT2 v2.0.4. The mapped reads of each sample were assembled by StringTie (v1.3.1). Cuffdiff (v2.1.1) was used to calculate FPKMs of coding genes in each sample and provided statistical routines for determining differential expression using a model based on the negative binomial distribution. Transcripts with a P-adjust <0.05 were assigned as differentially expressed.
DNA pull-down
Nuclear lysates were obtained from HC or SLE neutrophils as described above. Biotin-labeled Gpx4 promotor DNA was synthesized by Guangzhou RiboBio (Forward: 5’- ATTGGCTGACGTCG-3’, Reverse: 5’- CGACGTCAGCCAAT -3’). The biotinylated promotor DNA oligos were annealed and incubated with nuclear lysates at room temperature for 1 hour in binding buffer (10 mM Tris, 1 mM KCl, 1% NP-40, 1 mM EDTA, 5% glycerol). Afterward, M-280 streptavidin Dynabeads (10004D, Invitrogen) were added and incubated for 2 hours at 4°C with rotation. After three washes with binding buffer, the GPX4-promotor-binding proteins were eluted by boiling and analyzed by western blot.
Chromatin Immunoprecipitation (CHIP) Analysis
CHIP analysis was conducted on neutrophils with anti-CREM (Abclonal) and the assay was performed according to the manufacturer’s instructions (9003, CST). Each sample (4 × 10⁶ cells) was cross-linked with 1% formaldehyde and then subjected to nuclear extraction and chromatin digestion with micrococcal nuclease. Sonication was used for complete lysis of nuclei (10-s pulse and 30-s pause; five cycles). The efficiency of chromatin digestion was determined by nucleic acid electrophoresis. For immunoprecipitation, digested chromatin was incubated with 10 μg of antibodies for 6 hours at 4 °C with rotation. Afterward, magnetic beads were added to the immunoprecipitation reaction for 2 hours at 4 °C with rotation. After washing four times, immunoprecipitated chromatin DNA was eluted. Fold enrichment was quantified using qPCR with SYBR Green Realtime PCR Master Mix (QPK-201, TOYOBO) and calculated as a percentage of input chromatin (% input). The primers sequence of Gpx4 promotor was 5’- AACAAGTCCGCACGTCCGGT-3’(forward) and 5’- ATTGGTCAGACGCGTCGGTGTT-3’(reverse).
RNA interference and plasmids
HL60 cells (KG141, Keygen) were transfected with siRNA (20nmol/ml) or plasmids (1μg/ml) of Crem (NCBI Gene ID:1390) and Fcγr3b (NCBI Gene ID: 2215). 293T cells (CL-0005, Procell) were transfected with plasmids (1μg/ml) of Slc7a11(NCBI Gene ID: 23657). Full-length sequences were obtained from Sangon Biotech and then cloned into pcDNA3.1 vector. For transfection, cells were treated with the Gene Pulser II electroporation system (Bio-Rad) or 4D-Nucleofector X Kit L (V4XP-3024, LONZA,) or lipo-2000 (11668–027, Invitrogen) according to the manufacturer’s instructions. The efficiency of interference or overexpression was determined by qPCR or Western blot. The corresponding siRNAs used are as follow:
CREM:
siRNA-1
Forward:5’- GCAGAAUCAGAAGGUGUAATT-3’
Reverse: 5’- UUACACCUUCUGAUUCUGCTT-3’,
siRNA-2
Forward:5’- GGUGGAACAAUCCAGAUUUTT-3’
Reverse: 5’- AAAUCUGGAUUGUUCCACCTT-3’,
siRNA-3
Forward:5’- CCCAGGAUCUGAUGGUGUUTT-3’
Reverse: 5’- AACACCAUCAGAUCCUGGGTT-3’,
Statistics and Reproducibility
Each experiment was repeated independently more than three times, and similar results were obtained. All data were analyzed using GraphPad Prism7 software. Shapiro-Wilk test was used for normal distribution verification. For data with a normal distribution and homogeneity of variance, the independent sample t-test was used to compare differences between two groups. In some experiments, a paired Student’s t-test was applied as indicated. For data with non-normal distribution, Mann Whitney test were applied. Correlations were calculated using Pearson rank correlation analysis. Sample sizes were determined on the basis of previous experiments using similar methodologies and were detailed in each figure legend. For in vivo studies, mice were randomly assigned to treatment groups. Data in figure legends are presented as mean ± SD values or median with interquartile range. P<0.05 was considered significant.
Extended Data
Extended Data Fig. 1. IgG and IFNα but not CXCL11 or IL12/23 p40 present in SLE sera contributed to neutropenia.
a-b. Flow cytometry quantification of cell viability of neutrophils (a: n=3; b: n=9) in vitro cultured with (a) 5%, 10%, or 20% SLE serum for 6, 16, 24 hours respectively, or with (b) 20 % HC, SLE or RA serum respectively for 16 hours. c. Detection of the inflammatory factors in the sera from RA (n = 16), BD (n = 20) and AS (n = 18) patients vs. HCs (n = 19). d-e. Flow cytometry quantification of cell viability and lipid ROS of HC neutrophils (d: n=7; e: n=7 for anti-CXCL11 or n=4 for Ustekinumab) cultured in vitro with 20% SLE serum supplemented with anti-CXCL11 (0.1, 1, 5 µg ml−1) or Ustekinumab (0.1, 1, 10 µg ml−1) for 16 hours. f-g. The proportion of anti-dsDNA in total IgG correlated with SLE neutrophil counts and SLEDAI scores (n=63). h. Western blot validation of purified IgG from serum and of serum with IgG depletion. i. Flow cytometry quantification of cell viability of neutrophils (n=5) cultured in vitro with serum in the presence or absence of anti-IFNAR (10 µg ml−1), or IgG depletion, for 16 hours. j-k. Serum IgG was purified or depleted by Protein A/G. (j) Ponceau S staining (upper panel) and western blot (lower panel) detection of purified IgG and of serum with depleted IgG. (k) Flow cytometry quantification of cell viability of neutrophils (n=4) with HC serum in the presence of HC or SLE IgG at different concentrations (1.2, 2.4, 3.6 g L−1), or SLE serum with/without IgG depletion, for 16 hours. Data are shown as mean ± SD. *p < 0.05, **p < 0.01, ns p > 0.05. Two-tailed paired or unpaired Student’s t-test was applied.
Extended Data Fig. 2. Ferroptosis is restricted in neutrophils but not other cells in SLE and this could be reverted by addition of Ferroptosis specific inhibitors.
a. Flow cytometry quantification of cell viability of HC lymphocytes, monocytes, and neutrophils cultured with 20% HC or SLE serum for 16 hours and the proportion of apoptotic (Annexin V+ 7AAD-), necrotic (Annexin V+ 7AAD+) and live (Annexin V- 7AAD-) cells in each subset was analyzed (n=6). b. HC neutrophils were cultured with 20% HC or SLE serum, and lipid-ROS productions at different time points were detected (n=3). c. Dot plots show cell viability analyzed by lactate dehydrogenase (LDH) release. HC neutrophils (n=9) were cultured with 20% HC serum supplemented with RSL-3 (10 μM) or SLE serum supplemented with LPX-1 (1 μM) for 16 hours before analysis. d-e. Dot plots show flow cytometry quantification of the percentage of apoptotic, necrotic, and live cells. HC neutrophils (n=5) were cultured with 20% HC or SLE serum in the presence or absence of LPX-1 (1 μM) for 16 hours before analysis. f-g. HC B cells (n=6) were cultured in 20% HC or SLE serum supplemented with LPX-1 for 72 hours, and plasmacytoid dendritic cells (pDC) (n=3) were cultured for 24 hours, the level of IgG was assessed by ELISA and type 1 IFNs by flow cytometry individually. h-i. Dot plots show cell viability and lipid-ROS in HC neutrophils (n=7) cultured with 20% HC or SLE serum supplemented with ß-ME (10/50 μM) for 16 hours. Data are shown as mean ± SD. ns p > 0.05. Two-tailed paired Student’s t-test was applied.
Extended Data Fig. 3. The cooperative effects between IFNα and SLE IgG on cell death.
a-c. HC neutrophils were cultured in the presence of HC or SLE serum with or without the addition of Cl-amidine (Cl) (peptidyl arginine deiminase 4 (PAD4) inhibitor, 100 μM), or LPX-1 (1 μM) for 4 or 16 hours and NETs were assessed in SYTOX Green+ cells based on morphology (n=6). Neutrophils with DNA area greater than 400um2 were considered as NETs. Dot plots show the percentage of cells forming NETs in all dead neutrophils from the indicated group. d-e. Representative fluorescent images and related quantification of NETosis. HC neutrophils (n=6) were stimulated by PMA (50 nM) with or without LPX-1(1 μM) for 4 hours. f-i. HC neutrophils were cultured with SLE IgG (3.6 g L−1) and/or IFN-α (10^5 U ml−1) for 4 or 16 hours and cells were stained with SYTOX Green for the detection of NETs. Dot plots show the immunofluorescence microscope quantification of NETosis in total dead neutrophils from the indicated group (4h: n=6; 16h: n=3). The scale bar represents 50 μm. Data are shown as mean ± SD. ns p > 0.05. Two-tailed paired Student’s t-test was applied.
Extended Data Fig. 4. The ferroptosis inhibitor ameliorates lupus progression with much better therapeutic effect compared to the NETosis inhibitor.
a-i. MRL/lpr mice (n=6) were treated with DMSO (0.1ml 10%), LPX-1(10 mg/kg) or CTX (20 mg/kg) every other day at week 12 for 6 weeks, DMSO (0.1ml 10%) was applied to sex-matched MRL/Mpj mice (n=5) as control. Mice were euthanized at 18 weeks of age for analysis. (a). Flow cytometry quantification of lipid ROS. (b). Representative immunofluorescent images of glomeruli stained with IgG (red), IgM (yellow), C1q (green), and DAPI (blue). (c-e) Flow cytometry quantification of plasma inflammatory factors and (f-i) plasma IgG. j-o. MRL/lpr mice (DMSO, LPX-1: n=3; Cl, Cl+LPX-1: n=4) were treated with DMSO, Cl, LPX-1, or Cl combined with LPX-1 every other day for 3 weeks starting at the age of week 12. Mice were euthanized at 15 weeks of age for analysis. (j-k) Representative images and related quantification of axillary spleens and lymph nodes. (l) Western blot analysis of cit-H3 in circulating neutrophils from mice subjected to the indicated treatment. (m) Dot plots show the ELISA assessment of serum complement 3. (n) Dot plots show the ELISA assessment of serum anti-dsDNA antibodies titers. (o) Dot plots shows the Bicinchoninic acid (BCA) assay of urine proteins. The scale bar represents 50 μm. Data are shown as mean ± SD. ns p > 0.05. Two-tailed unpaired Student’s t-test was applied.
Extended Data Fig. 5. The expression of cystine transporter SLC7A11 is not different between HC and SLE neutrophils.
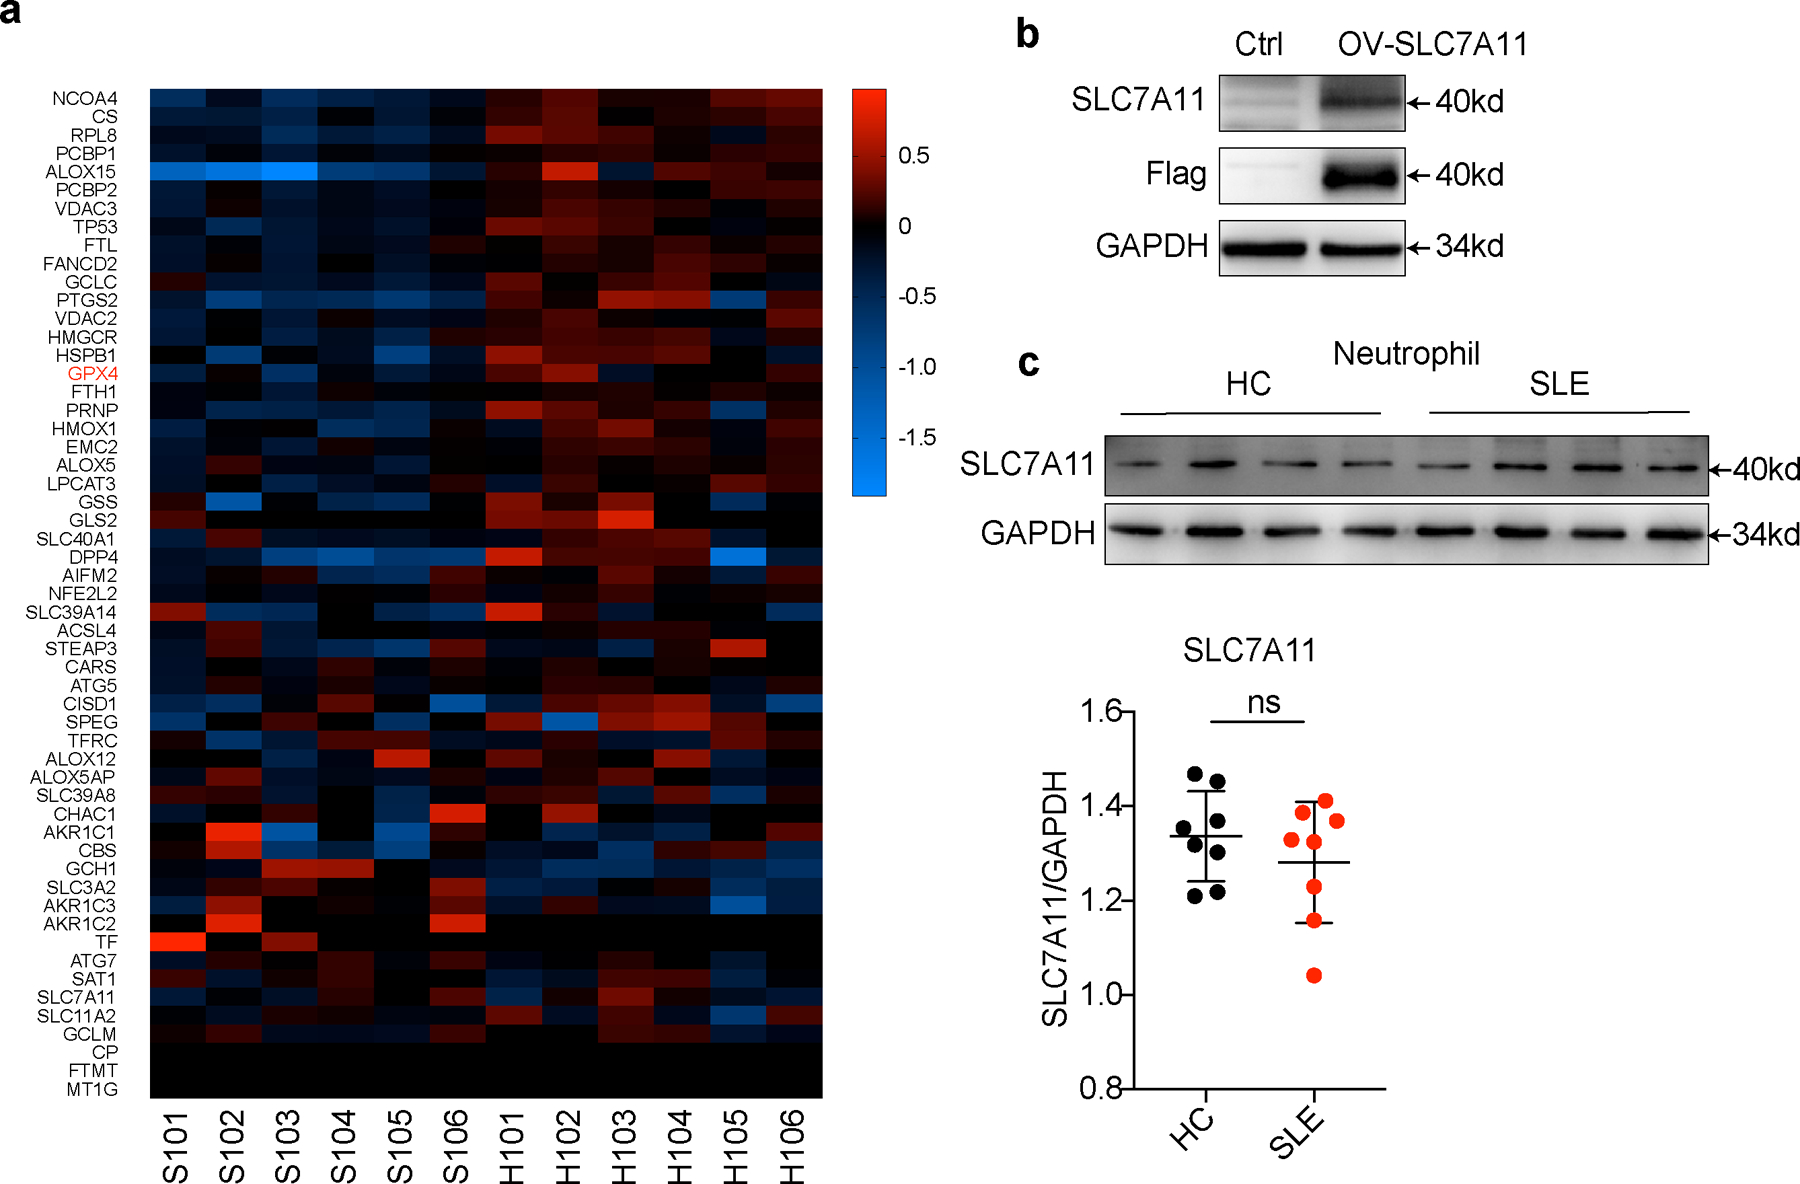
a. Heatmap visualization of RNA-seq analysis on differentially expressed ferroptosis-related genes (Standardized with GAPDH) in neutrophils between new onset treatment-naïve SLE patients (n=6) and HCs (n=6). b. Western blot validation for SLC7A11 antibody. 293T cells were transfected with Slc7a11 overexpression plasmid and cells without transfection were used as control. c. Western blot assay shows the expression of cystine transporter SLC7A11 in neutrophils from HCs (n=8) and SLE patients (n=8). Data are shown as mean ± SD. ns p > 0.05. Two-tailed unpaired Student’s t-test was applied.
Extended Data Fig. 6. GPX4 reduction was observed in neutrophils but not other immune cells in SLE.
a. Flow cytometry quantification of GPX4 expressions in HCs (n=16) and SLE (n=12) neutrophils. b. GPX4 expressions in neutrophils from treatment-naïve SLE patients correlated negatively with disease activities as measured by SLEDAI (n=12). c. Flow cytometry quantification of GPX4 expressions in lymphocytes (including CD4+T, CD8+T, and B cells) and monocytes from HCs (n=11) and SLE patients (n=9). d-e. Western blot analysis of GPX4 expressions in lymphocytes and monocytes from HCs (n=11) and SLE patients (n=10). f-g. Western blot analysis of GPX4 expression in HC neutrophils, monocytes, and lymphocytes (n=7). h-i. Western blot analysis of GPX4 expression in HC neutrophils, monocytes, and lymphocytes (n=7) cultured with 20% HC or SLE serum for 30 hours. j-k. Western blot analysis of GPX4 expression in HC neutrophils (n=3) when cultured with 20% HC serum or SLE serum supplemented with Cl-amidine (Cl, 100 μM), APX-115 (APX) (pan-NADPH oxidase (NOX) inhibitor, 20 μM), and GSK2795039 (GSK) (NOX2 inhibitor, 10 μM). Data are shown as mean ± SD. ns p > 0.05. Two-tailed unpaired Student’s t-test was applied.
Extended Data Fig. 7. FcγR3β is essential for the SLE IgG-mediated GPX4 downregulation in neutrophils.
a-b. Expression correlation analysis between different TLRs or FcRs with GPX4 based on RNA-seq data. In SLE neutrophils, (a) TLR signaling pathways are not associated with GPX4 reduction. (b) Fcγr3b but not other FcRs’ expression is negatively associated with GPX4 reduction. c. Different Fc receptor expressions in HCs (n=6) and SLE (n=6) analyzed by RNA-seq. d. Western blot analysis of FcγR3β expressions in neutrophils, monocytes and lymphocytes from HCs (n=3). e. GPX4 expressions in HL60 cells after overexpression of FcγR3β(n=4). Control referred to cells without transfection. Data are presented as mean ± SD or median with interquartile range. ns p > 0.05. one-tailed or two-tailed unpaired Student’s t-test or Mann Whitney test was applied.
Extended Data Fig. 8. Mice with Gpx4 haploinsufficiency in neutrophils developed spontaneous lupus-like disease, while Gpx4 fl/flLysMCre+ mice exhibited mild autoimmunity.
a-b. Flow cytometry quantification and western blot analysis of GPX4 in neutrophils (CD45+CD11b+Ly6G&Ly6C+) and non-neutrophils (including monocytes and lymphocytes) from Gpx4fl/fl (n=6) and Gpx4fl/wtLysMCre+ (n=9) mice. c-d. Flow cytometry analysis of peripheral neutrophils (CD45+CD11b+Ly6G&Ly6C+) and monocytes (CD45+CD11b+Ly6G&Ly6C−) from Gpx4fl/fl (c: n=6, d: n=10) and Gpx4fl/wtLysMCre+ (c: n=9, d: n=13) mice. e. Flow cytometry quantification of lipid-ROS and cell viability in neutrophils (n=6) from Gpx4fl/wtLysMCre+ mice cultured in complete RPMI 1640 basic medium in the presence or absence of LPX-1 (1μM). f. Skin lesions of Gpx4fl/wtLysMCre+ mice. g. Immunofluorescent images of glomeruli in Gpx4fl/fl mice and Gpx4fl/wtLysMCre+ mice. IgG (red), IgM (yellow), C1q (green), and DAPI (blue). h. Dot plots show the proteinuria of Gpx4fl/fl and Gpx4 fl/flLysMCre+ mice at 4 months of age assessed by BCA assay. i. ELISA assay shows the levels of serum complement 3 in Gpx4fl/fl (n=8) and Gpx4 fl/flLysMCre+ (n=8) mice at 6 months of age. j. ELISA assay shows the levels of serum anti-dsDNA antibodies in Gpx4fl/fl (n=8) and Gpx4 fl/flLysMCre+ (n=8) mice at 6 months of age. The scale bar represents 50 μm. Data are shown as mean ± SD, ns p > 0.05. Two-tailed unpaired or paired Student’s t-test was applied.
Extended Data Fig. 9. IFNα and SLE IgG enhanced ferroptosis by promoting binding of CREM to the Gpx4 promoter.
a. Western blot analysis of CREMα and CaMKIV in cytoplasm and nucleus of neutrophils from HCs and SLE patients. b. Dot plots show the CHIP analysis results on CREMα binding to the promoter of Gpx4 from neutrophils (n=6) with indicated treatment: IFN-α (10^5 U ml−1), anti-IFNAR (10 µg ml−1), SLE IgG (2.4 g L−1) or SLE sera with IgG depletion. c-d. Efficiency of CREMα knockdown by siRNA (n=3) or CREMα over-expression (n=4) in HL-60 cells validated by qPCR (c) and western blot (d). e. Effect of IFN-α or SLE IgG on GPX4 expressions in HL60 cells after knockdown or overexpression of CREMα. f. Efficiency of CREMα knockdown or overexpression on ferroptosis in HL60 cells (n=4), assessed by flow cytometry using BODIPY C11. Data are shown as mean ± SD, ns p > 0.05. Two-tailed unpaired or paired Student’s t-test was applied.
Extended Data Fig. 10.
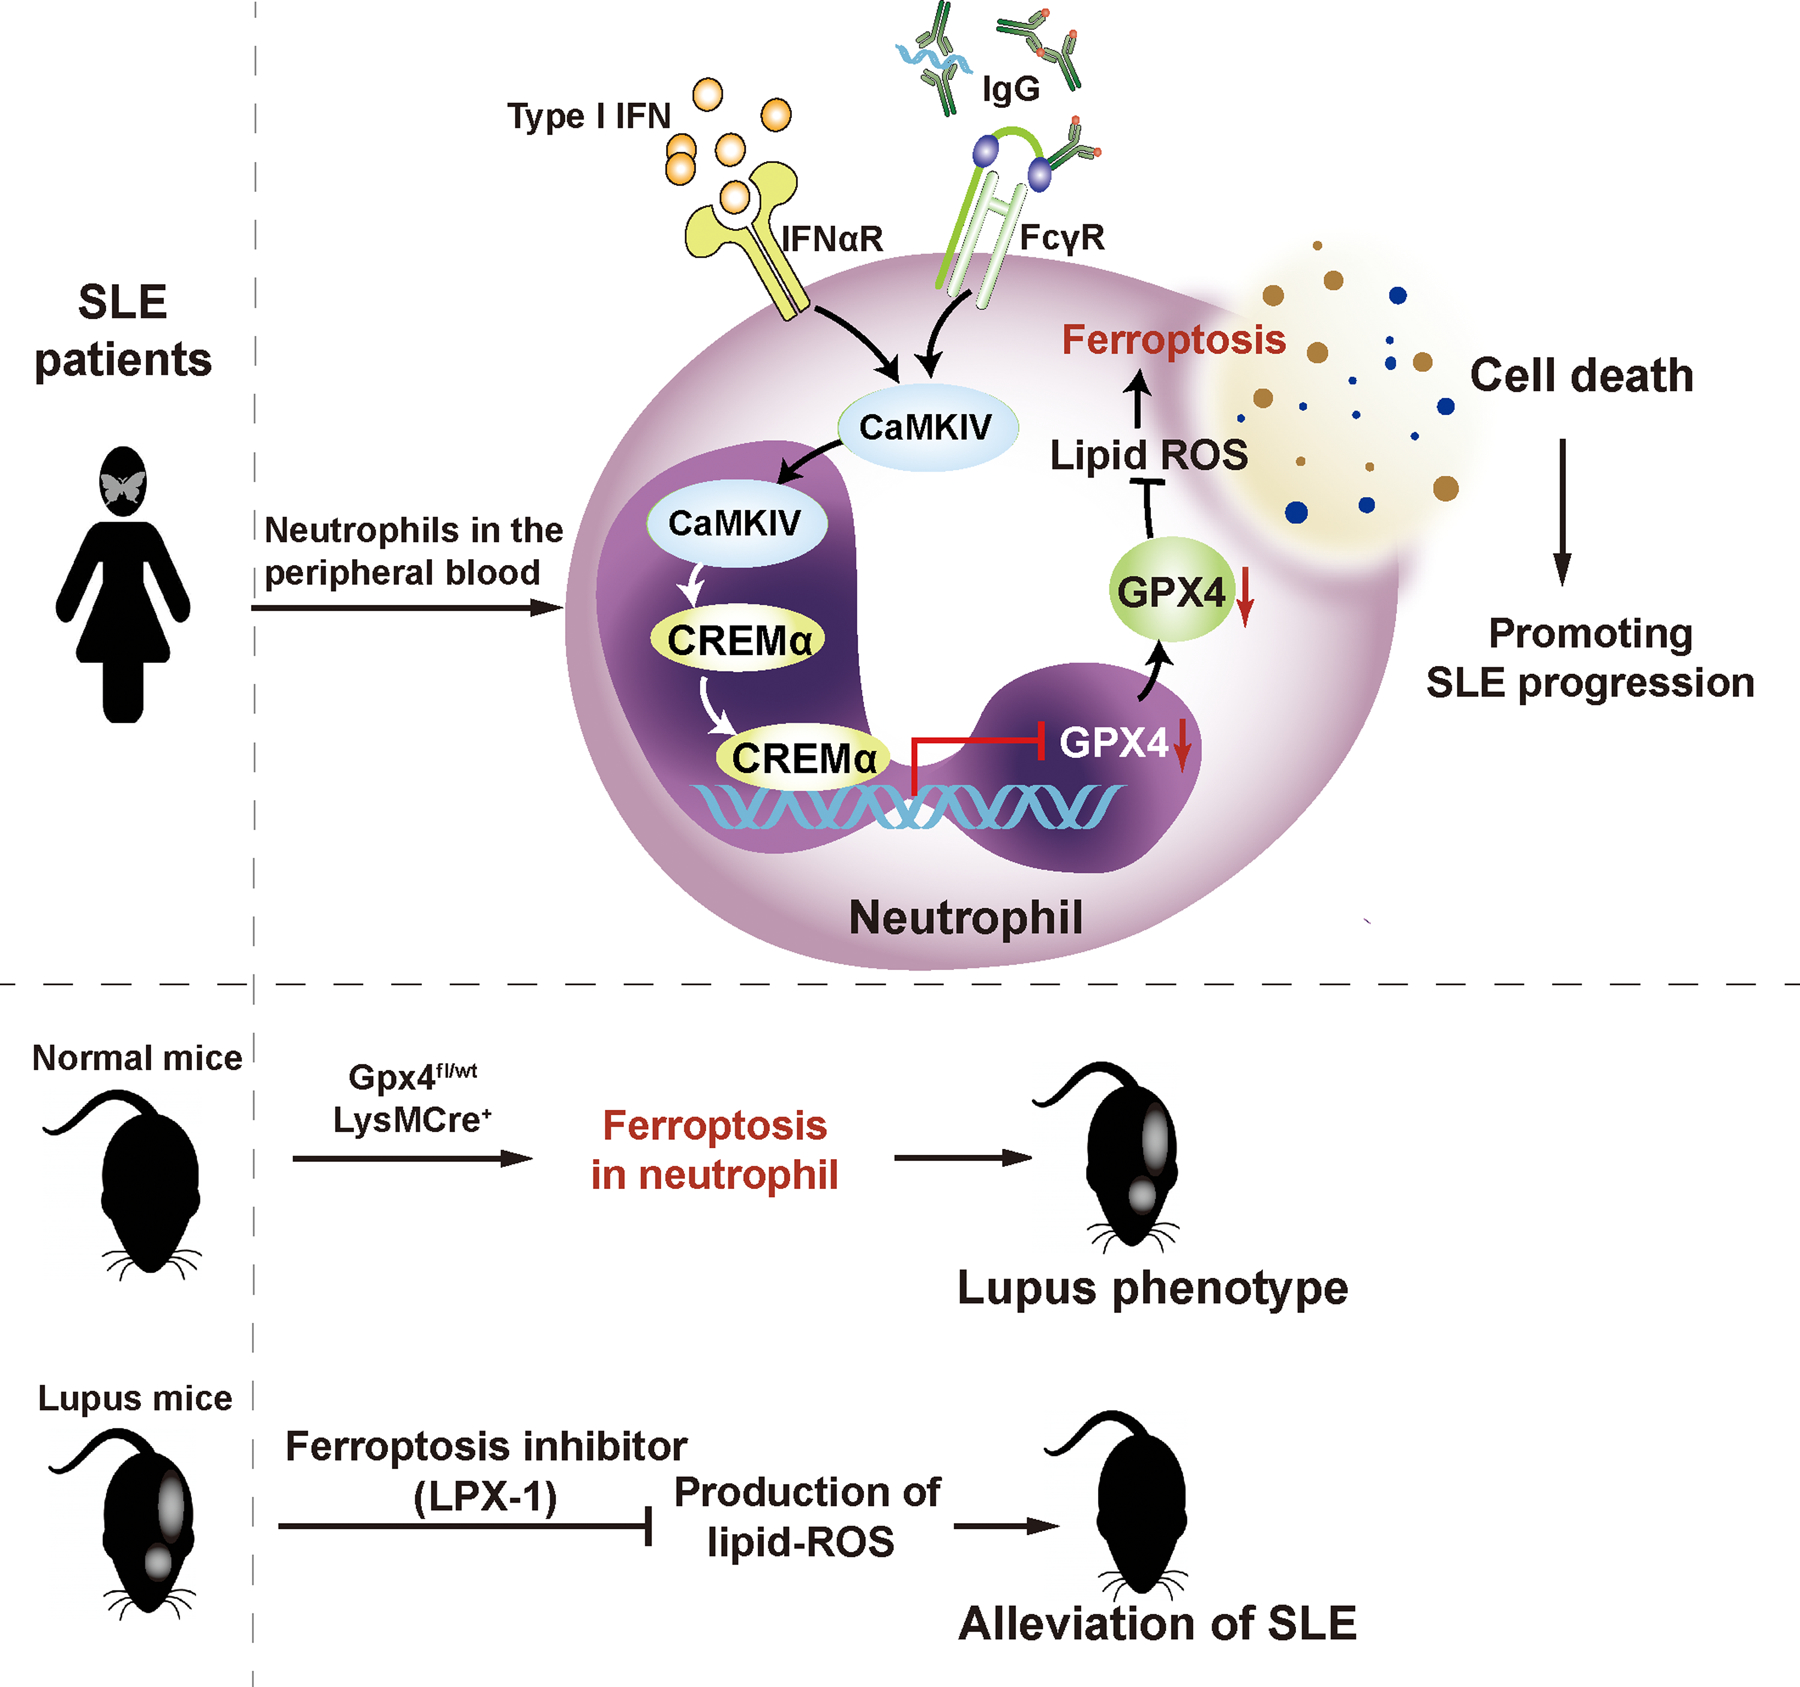
The hypothetical model for neutrophil ferroptosis in SLE pathogenesis.
Supplementary Material
ACKNOWLEDGEMENTS
This study was supported by National Natural Science Foundation of China grants 81788101 (to X.Z.), 81630044 (to X.Z.), Chinese Academy of Medical Science Innovation Fund for Medical Sciences grant CIFMS2016–12M-1–003 (to X.Z.), 2017–12M-1–008 (to X.Z.), 2017-I2M-3–011 (to X.Z.), 2016–12M-1–008 (to X.Z.), Capital’s Funds for Health Improvement and Research (2020–2-4019) (to X.Z.) and NIH grant R01AR064350 (to G.C.T) and R37AI049954 (to G.C.T). We thank Dr. Anne Davidson at Feinstein Institutes for Medical Research for providing the Adenovirus IFNα. We thank the staff of the Rheumatology and Immunology Laboratory and Medical Scientific Research Center in Peking Union Medical College Hospital (PUMCH) for providing experimental equipment. We thank the doctors in PUMCH, Anyang District Hospital of Henan Province, Xiangya Hospital, Huaian No.1 People’s Hospital, and People’s Hospital of Xinjiang Uygur Autonomous Region for patient recruitment.
Footnotes
COMPETING INTERESTS STATEMENT
PEL is an employee of AMPEL but has no conflict of interest with the content of this manuscript. All the authors declare no competing interests.
Data Availability
All raw source data for all experiments included in this study are provided. RNA sequencing data that support the finding of this study have been deposited with the Gene expression Omnibus (GEO) repository under accession number GSE153781. (https://www.ncbi.nlm.nih.gov/geo/query/acc.cgi?acc=GSE153781). Sequencing libraries were quantified using quality controlled (QC) by Agilent Bioanalyzer 2100 (Agilent Technologies, CA, USA). Correspondence and requests for materials should be addressed to zxpumch2003@sina.com.
References
- 1.Tsokos GC Systemic lupus erythematosus. N Engl J Med 365, 2110–2121 (2011). [DOI] [PubMed] [Google Scholar]
- 2.Lisnevskaia L, Murphy G & Isenberg D. Systemic lupus erythematosus. Lancet (London, England) 384, 1878–1888 (2014). [DOI] [PubMed] [Google Scholar]
- 3.Garcia-Romo GS et al. Netting neutrophils are major inducers of type I IFN production in pediatric systemic lupus erythematosus. Science translational medicine 3, 73ra20 (2011). [DOI] [PMC free article] [PubMed] [Google Scholar]
- 4.Bosch X. Systemic lupus erythematosus and the neutrophil. N Engl J Med 365, 758–760 (2011). [DOI] [PubMed] [Google Scholar]
- 5.Dixon SJ et al. Ferroptosis: an iron-dependent form of nonapoptotic cell death. Cell 149, 1060–1072 (2012). [DOI] [PMC free article] [PubMed] [Google Scholar]
- 6.Yang WS et al. Regulation of ferroptotic cancer cell death by GPX4. Cell 156, 317–331 (2014). [DOI] [PMC free article] [PubMed] [Google Scholar]
- 7.Alim I. et al. Selenium Drives a Transcriptional Adaptive Program to Block Ferroptosis and Treat Stroke. Cell 177, 1262–1279 e1225 (2019). [DOI] [PubMed] [Google Scholar]
- 8.Ingold I. et al. Selenium Utilization by GPX4 Is Required to Prevent Hydroperoxide-Induced Ferroptosis. Cell 172, 409–422 e421 (2018). [DOI] [PubMed] [Google Scholar]
- 9.Friedmann Angeli JP et al. Inactivation of the ferroptosis regulator Gpx4 triggers acute renal failure in mice. Nat Cell Biol 16, 1180–1191 (2014). [DOI] [PMC free article] [PubMed] [Google Scholar]
- 10.Do Van B. et al. Ferroptosis, a newly characterized form of cell death in Parkinson’s disease that is regulated by PKC. Neurobiology of Disease 94, 169–178 (2016). [DOI] [PubMed] [Google Scholar]
- 11.Matsushita M. et al. T cell lipid peroxidation induces ferroptosis and prevents immunity to infection. J Exp Med 212, 555–568 (2015). [DOI] [PMC free article] [PubMed] [Google Scholar]
- 12.van Vollenhoven RF et al. Efficacy and safety of ustekinumab, an IL-12 and IL-23 inhibitor, in patients with active systemic lupus erythematosus: results of a multicentre, double-blind, phase 2, randomised, controlled study. Lancet (London, England) 392, 1330–1339 (2018). [DOI] [PubMed] [Google Scholar]
- 13.ter Borg EJ, Horst G, Hummel EJ, Limburg PC & Kallenberg CG Measurement of increases in anti-double-stranded DNA antibody levels as a predictor of disease exacerbation in systemic lupus erythematosus. A long-term, prospective study. Arthritis and rheumatism 33, 634–643 (1990). [DOI] [PubMed] [Google Scholar]
- 14.Pisetsky DS Anti-DNA antibodies--quintessential biomarkers of SLE. Nature reviews. Rheumatology 12, 102–110 (2016). [DOI] [PubMed] [Google Scholar]
- 15.Lood C. et al. Neutrophil extracellular traps enriched in oxidized mitochondrial DNA are interferogenic and contribute to lupus-like disease. Nat Med 22, 146–153 (2016). [DOI] [PMC free article] [PubMed] [Google Scholar]
- 16.Papayannopoulos V, Metzler KD, Hakkim A & Zychlinsky A. Neutrophil elastase and myeloperoxidase regulate the formation of neutrophil extracellular traps. J Cell Biol 191, 677–691 (2010). [DOI] [PMC free article] [PubMed] [Google Scholar]
- 17.Stockwell BR et al. Ferroptosis: A Regulated Cell Death Nexus Linking Metabolism, Redox Biology, and Disease. Cell 171, 273–285 (2017). [DOI] [PMC free article] [PubMed] [Google Scholar]
- 18.Friedmann Angeli JP et al. Inactivation of the ferroptosis regulator Gpx4 triggers acute renal failure in mice. Nat Cell Biol 16, 1180–1191 (2014). [DOI] [PMC free article] [PubMed] [Google Scholar]
- 19.Sun Y, Zheng Y, Wang C & Liu Y. Glutathione depletion induces ferroptosis, autophagy, and premature cell senescence in retinal pigment epithelial cells. Cell Death Dis 9, 753 (2018). [DOI] [PMC free article] [PubMed] [Google Scholar]
- 20.Cohen PL & Eisenberg RA Lpr and gld: single gene models of systemic autoimmunity and lymphoproliferative disease. Annual review of immunology 9, 243–269 (1991). [DOI] [PubMed] [Google Scholar]
- 21.Dubois EL, Horowitz RE, Demopoulos HB & Teplitz R. NZB/NZW mice as a model of systemic lupus erythematosus. JAMA 195, 285–289 (1966). [PubMed] [Google Scholar]
- 22.Ginzler EM et al. Mycophenolate mofetil or intravenous cyclophosphamide for lupus nephritis. N Engl J Med 353, 2219–2228 (2005). [DOI] [PubMed] [Google Scholar]
- 23.Alim I. et al. Selenium Drives a Transcriptional Adaptive Program to Block Ferroptosis and Treat Stroke. Cell 177, 1262–1279.e1225 (2019). [DOI] [PubMed] [Google Scholar]
- 24.Ingold I. et al. Selenium Utilization by GPX4 Is Required to Prevent Hydroperoxide-Induced Ferroptosis. Cell 172, 409–422.e421 (2018). [DOI] [PubMed] [Google Scholar]
- 25.Clark SR et al. Platelet TLR4 activates neutrophil extracellular traps to ensnare bacteria in septic blood. Nat Med 13, 463–469 (2007). [DOI] [PubMed] [Google Scholar]
- 26.Speckmann B. et al. Induction of glutathione peroxidase 4 expression during enterocytic cell differentiation. The Journal of biological chemistry 286, 10764–10772 (2011). [DOI] [PMC free article] [PubMed] [Google Scholar]
- 27.De Cesare D, Fimia GM & Sassone-Corsi P. Signaling routes to CREM and CREB: plasticity in transcriptional activation. Trends in biochemical sciences 24, 281–285 (1999). [DOI] [PubMed] [Google Scholar]
- 28.Hedrich CM et al. cAMP response element modulator α controls IL2 and IL17A expression during CD4 lineage commitment and subset distribution in lupus. Proceedings of the National Academy of Sciences of the United States of America 109, 16606–16611 (2012). [DOI] [PMC free article] [PubMed] [Google Scholar]
- 29.Hedrich CM, Rauen T, Kis-Toth K, Kyttaris VC & Tsokos GC cAMP-responsive element modulator α (CREMα) suppresses IL-17F protein expression in T lymphocytes from patients with systemic lupus erythematosus (SLE). The Journal of biological chemistry 287, 4715–4725 (2012). [DOI] [PMC free article] [PubMed] [Google Scholar]
- 30.Juang YT et al. Systemic lupus erythematosus serum IgG increases CREM binding to the IL-2 promoter and suppresses IL-2 production through CaMKIV. The Journal of clinical investigation 115, 996–1005 (2005). [DOI] [PMC free article] [PubMed] [Google Scholar]
- 31.Triantafyllopoulou A. et al. Proliferative lesions and metalloproteinase activity in murine lupus nephritis mediated by type I interferons and macrophages. Proc Natl Acad Sci U S A 107, 3012–3017 (2010). [DOI] [PMC free article] [PubMed] [Google Scholar]
- 32.Zhuang H. et al. Toll-like receptor 7-stimulated tumor necrosis factor α causes bone marrow damage in systemic lupus erythematosus. Arthritis Rheumatol 66, 140–151 (2014). [DOI] [PMC free article] [PubMed] [Google Scholar]
- 33.Kolb JP, Oguin TH 3rd, Oberst A & Martinez J. Programmed Cell Death and Inflammation: Winter Is Coming. Trends Immunol 38, 705–718 (2017). [DOI] [PMC free article] [PubMed] [Google Scholar]
- 34.Tsokos GC, Lo MS, Costa Reis P & Sullivan KE New insights into the immunopathogenesis of systemic lupus erythematosus. Nature reviews. Rheumatology 12, 716–730 (2016). [DOI] [PubMed] [Google Scholar]
- 35.Ren Y. et al. Increased apoptotic neutrophils and macrophages and impaired macrophage phagocytic clearance of apoptotic neutrophils in systemic lupus erythematosus. Arthritis Rheum 48, 2888–2897 (2003). [DOI] [PubMed] [Google Scholar]
- 36.Shi J. et al. Cleavage of GSDMD by inflammatory caspases determines pyroptotic cell death. Nature 526, 660–665 (2015). [DOI] [PubMed] [Google Scholar]
- 37.Sun L. et al. Mixed lineage kinase domain-like protein mediates necrosis signaling downstream of RIP3 kinase. Cell 148, 213–227 (2012). [DOI] [PubMed] [Google Scholar]
- 38.Stockwell BR et al. Ferroptosis: A Regulated Cell Death Nexus Linking Metabolism, Redox Biology, and Disease. Cell 171, 273–285 (2017). [DOI] [PMC free article] [PubMed] [Google Scholar]
- 39.Maeshima E, Liang XM, Goda M, Otani H & Mune M. The efficacy of vitamin E against oxidative damage and autoantibody production in systemic lupus erythematosus: a preliminary study. Clin Rheumatol 26, 401–404 (2007). [DOI] [PubMed] [Google Scholar]
- 40.Legrand AJ, Konstantinou M, Goode EF & Meier P. The Diversification of Cell Death and Immunity: Memento Mori. Mol Cell 76, 232–242 (2019). [DOI] [PubMed] [Google Scholar]
- 41.Martin-Sanchez D. et al. Ferroptosis, but Not Necroptosis, Is Important in Nephrotoxic Folic Acid-Induced AKI. Journal of the American Society of Nephrology : JASN 28, 218–229 (2017). [DOI] [PMC free article] [PubMed] [Google Scholar]
- 42.Hu CL et al. Reduced expression of the ferroptosis inhibitor glutathione peroxidase-4 in multiple sclerosis and experimental autoimmune encephalomyelitis. J Neurochem 148, 426–439 (2019). [DOI] [PMC free article] [PubMed] [Google Scholar]
References
- 43.Hochberg MC Updating the American College of Rheumatology revised criteria for the classification of systemic lupus erythematosus. Arthritis and rheumatism 40, 1725 (1997). [DOI] [PubMed] [Google Scholar]
- 44.Uribe AG et al. The Systemic Lupus Activity Measure-revised, the Mexican Systemic Lupus Erythematosus Disease Activity Index (SLEDAI), and a modified SLEDAI-2K are adequate instruments to measure disease activity in systemic lupus erythematosus. J Rheumatol 31, 1934–1940 (2004). [PubMed] [Google Scholar]
- 45.Kay J & Upchurch KS ACR/EULAR 2010 rheumatoid arthritis classification criteria. Rheumatology (Oxford, England) 51 Suppl 6, vi5–9 (2012). [DOI] [PubMed] [Google Scholar]
- 46.van der Linden S, Valkenburg HA & Cats A. Evaluation of diagnostic criteria for ankylosing spondylitis. A proposal for modification of the New York criteria. Arthritis and rheumatism 27, 361–368 (1984). [DOI] [PubMed] [Google Scholar]
- 47.The International Criteria for Behçet’s Disease (ICBD): a collaborative study of 27 countries on the sensitivity and specificity of the new criteria. Journal of the European Academy of Dermatology and Venereology : JEADV 28, 338–347 (2014). [DOI] [PubMed] [Google Scholar]
- 48.Knight JS et al. Peptidylarginine deiminase inhibition disrupts NET formation and protects against kidney, skin and vascular disease in lupus-prone MRL/lpr mice. Ann Rheum Dis 74, 2199–2206 (2015). [DOI] [PMC free article] [PubMed] [Google Scholar]
- 49.Papayannopoulos V, Metzler KD, Hakkim A & Zychlinsky A. Neutrophil elastase and myeloperoxidase regulate the formation of neutrophil extracellular traps. J Cell Biol 191, 677–691 (2010). [DOI] [PMC free article] [PubMed] [Google Scholar]
Associated Data
This section collects any data citations, data availability statements, or supplementary materials included in this article.
Supplementary Materials
Data Availability Statement
All raw source data for all experiments included in this study are provided. RNA sequencing data that support the finding of this study have been deposited with the Gene expression Omnibus (GEO) repository under accession number GSE153781. (https://www.ncbi.nlm.nih.gov/geo/query/acc.cgi?acc=GSE153781). Sequencing libraries were quantified using quality controlled (QC) by Agilent Bioanalyzer 2100 (Agilent Technologies, CA, USA). Correspondence and requests for materials should be addressed to zxpumch2003@sina.com.