

Abstract
Despite the discovery of animal coronaviruses related to SARS-CoV-2, the evolutionary origins of this virus are elusive. We describe a meta-transcriptomic study of 411 bat samples collected from a small geographical region in Yunnan province, China, between May 2019 and November 2020. We identified 24 full-length coronavirus genomes, including four novel SARS-CoV-2-related and three SARS-CoV-related viruses. Rhinolophus pusillus virus RpYN06 was the closest relative of SARS-CoV-2 in most of the genome, although it possessed a more divergent spike gene. The other three SARS-CoV-2-related coronaviruses carried a genetically distinct spike gene that could weakly bind to the hACE2 receptor in vitro. Ecological modeling predicted the co-existence of up to 23 Rhinolophus bat species, with the largest contiguous hotspots extending from South Laos and Vietnam to southern China. Our study highlights the remarkable diversity of bat coronaviruses at the local scale, including close relatives of both SARS-CoV-2 and SARS-CoV.
Keywords: SARS-CoV-2, COVID-19, coronavirus, evolution, bats, phylogeny, spike protein, swine acute diarrhea syndrome, porcine epidemic diarrhea virus
Graphical abstract
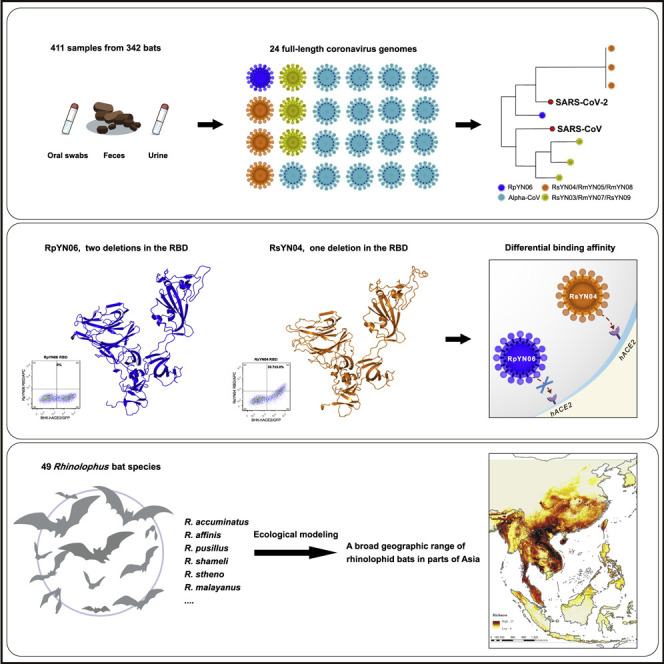
A study of 411 bat samples collected in Yunnan province, China between 2019 and 2020 yields 24 full-length coronavirus genomes, including four viruses highly related to SARS-CoV-2 and three to SARS. The closest relative to SARS-CoV-2 infects a species of bats that is found in regions that extend from South Laos and Vietnam to southern China.
Introduction
Most viral pathogens in humans have zoonotic origins, arising through occasional (e.g., coronavirus, Ebola virus) or frequent (e.g., avian influenza A virus) animal spillover infections. Bats (order Chiroptera) are the second most diverse mammalian order after Rodentia and currently comprise ~1,420 species, accounting for some 22% of all named mammalian species (Letko et al., 2020). Bats are well-known reservoir hosts for a variety of viruses that cause severe diseases in humans and have been associated with the spillovers of Hendra virus, Marburg virus, Ebola virus and, most notably, coronaviruses. Aside from bats and humans, coronaviruses can infect a wide range of domestic and wild animals, including pigs, cattle, mice, cats, dogs, chickens, deer, and hedgehogs (Chan et al., 2013; Su et al., 2016; Corman et al., 2018).
By 2019 there were six known human coronaviruses (HCoVs): HCoV-229E, HCoV-OC43, severe acute respiratory syndrome coronavirus (SARS-CoV), HCoV-NL63, HCoV-HKU1, and Middle East respiratory coronavirus (MERS-CoV) (Su et al., 2016; Forni et al., 2017). HCoV-229E, HCoV-NL63, SARS-CoV, and MERS-CoV were known to have zoonotic origins, with bats likely important reservoir hosts, although sometimes emergence in humans followed transmission through so-called “intermediate” hosts such as palm civets for SARS-CoV and dromedary camels for MERS-CoV (Corman et al., 2018; Ye et al., 2020). Similarly, it has been proposed that rodents may be the natural hosts of HCoV-OC43 and HCoV-HKU1, with cattle a possible intermediate host for HCoV-OC43 (Corman et al., 2018; Ye et al., 2020).
In early 2020, a novel coronavirus, SARS-CoV-2, was identified as the causative agent of a pneumonia outbreak in Wuhan, China, that eventually turned into a global pandemic (Zhu et al., 2020; Lu et al., 2020; Wu et al., 2020a). A combination of retrospective genome sequencing and ongoing sampling then identified SARS-CoV-2-related coronaviruses in wildlife. These included (1) the bat (Rhinolophus affinis) virus RaTG13 that shares the greatest sequence identity with SARS-CoV-2 across the viral genome as a whole (Zhou et al., 2020b); (2) the bat (R. malayanus)-derived coronavirus RmYN02 that is the closest relative of SARS-CoV-2 in the long ORF1ab gene and which contains a similar nucleotide insertion at the S1/S2 cleavage site of the spike gene (Zhou et al., 2020a); (3) viruses from the Malayan pangolin (Manis javanica) that comprised two lineages reflecting their Chinese province of collection by local customs authorities (Guangdong and Guangxi), with the pangolin viruses from Guangdong possessing identical amino acids at the six critical residues of the receptor binding domain (RBD) to human SARS-CoV-2 (Lam et al., 2020; Xiao et al., 2020); and (4) a more distant SARS-CoV-2 related coronavirus from a bat (R. cornutus) sampled in Japan (Murakami et al., 2020). More recently, two novel betacoronaviruses (STT182 and STT200) were described in R. shameli bats sampled from Cambodia in 2010 that share 92.6% nucleotide identity with SARS-CoV-2 as well as five of the six critical RBD sites observed in SARS-CoV-2 (Hul et al., 2021). In addition, a novel bat (R. acuminatus) coronavirus isolated from Thailand (RacCS203) in June 2020 was recently identified and found to be closely related to RmYN02 (Wacharapluesadee et al., 2021). Collectively, these studies indicate that bats across a broad swathe of Asia harbor coronaviruses that are closely related to SARS-CoV-2 and that the phylogenetic and genomic diversity of these viruses has likely been underestimated. Herein, we report the discovery of additional bat coronaviruses from Yunnan province, China that reveal more of the diversity and complex evolutionary history of these viruses, including both cross-species transmission and genomic recombination.
Results
Identification of novel bat coronaviruses
Between May 2019 and November 2020, a total of 283 fecal samples, 109 oral swabs, and 19 urine samples were collected from bats in a tropical botanical garden and adjacent areas in Mengla county, Yunnan province, southern China. The majority of samples were collected from horseshoe bats, comprising Rhinolophus malayanus (n = 88), R. stheno (n = 36), R. sinicus (n = 34), R. siamensis (n = 12), R. pusillus (n = 2), other Rhinolophus sp. (n = 11), and Hipposideros larvatus (n = 59) (Figures 1A and 1B, Table S1). These samples were pooled into 100 libraries (numbered p1 to p100) according to collection date and host species, with each library containing 1 to 11 samples. Meta-transcriptomic (i.e., total RNA) sequencing was performed and coronaviruses contigs were identified in 40 libraries (Table S2). Blastn searches of the de novo assemblies identified 26 long contigs (>23,000 nt in length) that mapped to coronavirus genomes present in 20 libraries, including 9 sarbecoviruses (i.e., from the genus Betacoronavirus) and 17 alphacoronaviruses. The number of read-pairs mapping to these long contigs ranged from 3,433 to 21,498,614, with the average depth ranging from 35.86 to 215,065.00 (Table S3). It should be noted that pool p1 comprising 11 fecal samples from R. malayanus was the same pool previously used to identify the viruses RmYN01 and RmYN02 (Zhou et al., 2020a). The remaining 24 genomes were named in the same manner, in which the first two letters represent an abbreviation of the bat species, YN denotes Yunnan, and the final number is a serial number ranging from 03 to 26. In addition, several short contigs related to SARS-CoV-2 were identified in two other libraries, p7 and p11 (Figure S1 , Table S2).
Figure 1.

Sampling information and detection of SARS-CoV-2-like viruses in individual bat fecal samples.
(A) Sample numbers of different bat species captured live in Yunnan province from May 2019 to November 2020. (B) Numbers of samples collected from different time points (orange column - feces; green - oral swab; light purple - urine). The numbers of individual bats are shown with black dots and relate to the y axis. The associated numbers are in the form sample numbers/number of individual bats. (C) Identification of SARS-CoV-2-like virus positive samples using qPCR. See also Tables S1 and S4.
Figure S1.

Detection of SARS-CoV-2 related reads and contigs from sequencing data. Related to Figure 2 and Table S2.
(A) Reads mapping to the four different SARS-CoV-2 related coronaviruses for which full-length genomes were obtained. (B) The blue blocks represent SARS-CoV-2 related contigs in the two libraries. The percentage value shown is the sequence identity between the contigs and the SARS-CoV-2 reference genome (NC_045512).
Further Blastn analyses revealed that four of the seven novel sarbecoviruses identified here (RpYN06, RsYN04, RmYN05, and RmYN08) were related to SARS-CoV-2, while the remaining three (RsYN03, RmYN07, and RsYN09) were more closely related to SARS-CoV. We next designed specific primers and a probe set of quantitative real-time PCR primers (qPCR) (Table S4) that targeted the conserved region of the 1a gene region to detect the presence of the four SARS-CoV-2-related viruses in individual bats (i.e., prior to sample pooling; Figure 1C). Pool p46 only contained a single positive fecal sample, no. 379, collected on May 25, 2020, and the virus was detected with a cycle threshold (Ct) value of 26.97 (Figure 1C). SARS-CoV-2-related viruses were also detected in three (sample nos. 362, 364, and 372) of the six, three (sample nos. 367, 391, and 397) of the eight, and two (sample nos. 448 and 450) of the seven samples in pool nos. p35, 44, and 62, respectively, with Ct values ranging from 26.10 to 32.82 (Figure 1C). Among these, samples 362, 364, 372, and 367 were collected on May 25, 2020, 391 and 397 were collected on June 3, 2020, while both 448 and 450 were collected on July 16, 2020. The 5′ and 3′ termini and the spike gene sequences of the four coronaviruses related to SARS-CoV-2 were verified using individual samples 379, 364, 367, and 450 with 5′ and 3′ RACE (Table S4) and Sanger sequencing. Results from the Sanger sequencing were consistent with those obtained from the meta-transcriptomic sequencing.
Sequence identities between SARS-CoV-2 and related viruses
At the scale of the whole genome, RpYN06 exhibited 94.48% sequence identity to SARS-CoV-2, making it, after RaTG13 (96.10%), the second closest relative of SARS-CoV-2 documented to date (Figure 2 ). However, because of extensive recombination, patterns of sequence similarity vary markedly across the virus genome, and RmYN02 shared 97.18% sequence identity with SARS-CoV-2 in the 1ab open reading frame (ORF), compared to 97.19% for RpYN06. In addition to the ORF1ab, RpYN06 shared the highest nucleotide identities with SARS-CoV-2 in the RdRp (RNA-dependent RNA polymerase; 98.36%), ORF7a (96.72%), ORF8 (97.54%), N (97.70%), and ORF10 (100%) (Figure 2). However, RpYN06 exhibited only 76.33% nucleotide identity to the SARS-CoV-2 spike gene and 60.91% in the receptor binding domain (RBD), in a manner similar to RmYN02, ZC45, ZXC21, and the Thailand coronavirus strains (Figure 2). Excluding the spike gene, the sequence identities of RpYN06, RmYN02, and RaTG13 to SARS-CoV-2 were 97.17%, 96.41%, and 96.49%, respectively.
Figure 2.

Sequence identities between SARS-CoV-2 and representative sarbecoviruses.
(A) Pairwise sequence identities between SARS-CoV-2 (reference genome: NC_045512) and SARS-CoV-2 related coronaviruses. The degree of sequence similarity is highlighted by the shading, with cells shaded red denoting the highest identities. (B) Whole genome sequence similarity plot of nine SARS-CoV-2 related coronaviruses using SARS-CoV-2 as a query. The analysis was performed using Simplot, with a window size of 1,000 bp and a step size of 100 bp. See also Tables S3 and S5.
In contrast, RsYN04, RmYN05, and RmYN08 exhibited >99.96% nucleotide identities to each other at the scale of the whole genome. Such strong similarity is indicative of viruses from the same species, even though they were sequenced on different lanes and the samples were collected from different bat species at different times. In addition, they shared relatively low sequence similarity with SARS-CoV-2 across the whole genome (76.5%), particularly in the spike gene, ORF3a, ORF6, ORF7a, ORF7b, and ORF8 with nucleotide identities <70% (Figure 2). Interestingly, when using RsYN04 as the query sequence, the closest hit in the Blastn search was the pangolin-derived coronavirus MP789 (MT121216.1) with 82.9% nucleotide identity. Also of note was that no complete ORF10 was found in RsYN04, RmYN05, RmYN08, and a number of other SARS-CoV-2-related coronaviruses due to premature termination (Figure 2A), consistent with a previous study suggesting that ORF10 is not essential to the replication cycle of SARS-CoV-2 (Pancer et al., 2020).
Evolutionary history of sarbecoviruses
Phylogenetic analysis of full-length genome sequences of representative sarbecoviruses revealed that SARS-CoV-2 was most closely related to RaTG13, while RmYN02 and the Thailand strains formed a slightly more divergent clade. Notably, RpYN06 was placed at the basal position of the clade containing SARS-CoV-2 and its closest relatives from bats and pangolins (Figure 3 A, Table S5). In contrast, RsYN04, RmYN05, and RmYN08 grouped together and clustered with the pangolin-derived viruses from Guangxi, although separated from them by a relatively long branch. Finally, three SARS-CoV-related coronaviruses (RsYN03, RmYN07, and RsYN09) fell within the SARS-CoV lineage, grouping with other bat viruses previously sampled in Yunnan (Figure 3A).
Figure 3.

Phylogenetic analysis of SARS-CoV-2 and representative sarbecoviruses.
Nucleotide sequence phylogenetic trees of (A) the full-length virus genome, (B) the RdRp gene, (C) the ORF1ab, and (D) the spike gene. The phylogenetic trees in panels A-C were rooted using the bat viruses Kenya_BtKY72 (KY352407) and Bulgaria_BM48_31_BGR (GU190215) as outgroups, whereas the tree in panel D was midpoint rooted. Phylogenetic analysis was performed using RAxML (Stamatakis 2014) with 1,000 bootstrap replicates, employing the GTR nucleotide substitution model. Branch lengths are scaled according to the number of nucleotide substitutions per site. Viruses are color-coded as follows: red - SARS-CoV-2; blue - new genomes generated in this study; green - recently published sequences from Thailand and Cambodia. See also Table S5.
A different topological pattern was observed in the phylogeny of the RdRp (Figure 3B). In particular, RpYN06 grouped with RmYN02 (although with weak bootstrap support), which together formed a clade with RaTG13, the two Cambodian strains, and SARS-CoV-2 (Figure 3B). The two bat-derived strains from Thailand formed a separate lineage. Perhaps more striking was that RsYN04, RmYN05, and RmYN08 now grouped with the Guangdong pangolin viruses (rather than those from Guangxi; Figure 3B). A different pattern again was observed in the phylogeny of the entire ORF1ab (Figure 3C). RpYN06 and RmYN02 now formed a clade and that was the direct sister-group to SARS-CoV-2, with RaTG13 a little more divergent (Figure 3C). In addition, RsYN04, RmYN05, and RmYN08 now clustered with the pangolin-derived strains from Guangxi (Figure 3C), consistent with the complete genome phylogeny.
In the spike gene phylogeny, SARS-CoV-2 and RaTG13 still grouped together, with both pangolin lineages falling as sister groups (Figure 3D). The two Cambodian bat viruses formed a separate and more divergent lineage. Strikingly, RpYN06 exhibited marked phylogenetic movement, this time clustering with two previously described bat viruses from Zhejiang province (ZC45 and ZXC21) whereas the Thailand bat virus clustered closely with RmYN02 (Figure 3D). In addition, RsYN04, RmYN05, and RmYN08 did not fall within the SARS-CoV and SARS-CoV-2 clades, but instead formed a separate and far more divergent lineage (Figure 3D). Finally, in the phylogeny of the RBD region, SARS-CoV-2 clustered with the pangolin viruses from Guangdong with the two Cambodian bat viruses the next most closely related viruses (Figure S2 A). RpYN06 fell within a lineage comprising several bat-derived betacoronaviruses, including ZC45, ZXC21, RsYN09, RsYN03, and RmYN07. As expected from the complete S gene tree, bat viruses RsYN04, RmYN05, and RmYN08 grouped together and formed a lineage characterized by a long branch (Figure S2A). A tanglegram of the representative sarbecoviruses clearly depicted the topological incongruence between the ORF1ab and spike gene phylogenies, particularly the SARS-CoV-2-related viruses, indicative of widespread recombination (Figure S2B).
Figure S2.

Phylogenetic analysis of the representative betacoronaviruses and alphacoronaviruses. Related to Figures 3 and 5.
(A) Phylogenetic analysis of the RBD regions of SARS-CoV-2 and representative betacoronaviruses (the tree is midpoint rooted for clarity only). (B) Tanglegram connecting the ORF1ab and Spike gene phylogenies of representative sarbecoviruses. TreeMap3 was used to visualize the tanglegram, displaying topological similarities and incongruences between the ORF1ab and Spike gene (employing the ‘untangle’ function). (C, D) Phylogenetic analysis of the ORF1ab and Spike gene sequences of representative alphacoronaviruses from different subgenera. Phylogenetic analysis was performed with the RAxML program employing 1,000 bootstrap replicates, employing the GTR model of nucleotide substitution. Branch lengths are scaled according to the number of nucleotide substitutions per site and the tree is rooted using two betacoronaviruses as outgroups; South_Africa_PML-PHE1/RSA/2011 (KC869678.4) and HCoV-MERS-EMC (NC_019843). (E) The Spike protein (amino acid) tree. Phylogenetic analysis was performed using RAxML with 1,000 bootstrap replicates, employing the PROTGAMMAJTT model of amino acid substitution. Branch lengths are scaled according to the number of substitutions per site and both trees were rooted using two betacoronaviruses as outgroups; South_Africa_PML-PHE1/RSA/2011 (KC869678.4) and HCoV-MERS-EMC (NC_019843).
Molecular characterization of the spike protein of the novel bat sarbecoviruses
At the six amino acid positions deemed critical for binding to the human angiotensin-converting enzyme 2 (hACE2) receptor, SARS-CoV-2 and the three bat-derived viruses identified here (RsYN04, RmYN05, and RmYN08) shared L455 and Y505. In contrast, despite being a closer overall relative, RpYN06 only possessed one identical amino acid with SARS-CoV-2: Y505 (Figure 4 A). At the S1/S2 cleavage site of the spike gene, none of the four SARS-CoV-2-related viruses reported here possessed a similar insertion/deletion (indel) pattern as SARS-CoV-2 (Garry et al., 2021) such that there was no furin cleavage site in these viruses (Figure 4A). Interestingly, however, the recently sampled bat virus from Thailand possessed a PVA three amino acid insertion at this site, similar to the PAA insertion found in RmYN02. The QTQTNS motif, proposed as the landing site for furin and other proteases, was similarly not observed in the newly described viruses (Figure 4A). In addition, two indel events have been identified in the RBD of many bat-associated coronaviruses (Holmes et al., 2021), and RpYN06 was characterized by indel patterns identical to those of ZC45 and ZXC21 (Figure 4A). There were no indel events in SARS-CoV-2 and the pangolin-derived coronaviruses in the RBD, and RsYN04, RmYN05, and RmYN08 possessed one unique indel event different to those observed in other sarbecoviruses (Figure 4A). In a similar manner to other bat-derived coronaviruses, the four novel SARS-CoV-2-related viruses possessed several indel events in the N-terminal domain, while RsYN04, RmYN05, and RmYN08 were again characterized by a unique indel pattern (Figure S3 A). Notably, RpYN06, ZC45, ZXC21, and the Guangdong pangolin virus shared the same indel pattern, with RpYN06 exhibiting high amino acid identity to these viruses in the N-terminal domain (85.29% to 99.02% at the amino acid level; Figure S3B).
Figure 4.

Molecular characterizations of the RBD and homology modeling of the S1 subunit of the novel sarbecoviruses.
(A) Sequence alignment of the RBD region of SARS-CoV-2 and representative betacoronavirus genomes (annotated following Holmes et al., 2021). The QTQTNS motif is adjacent to the furin cleavage site, and this concentration of polar amino acids may provide a favorable landing site for furin and other proteases. (B-C) Homology modeling and structural comparison of the S1 subunit between (B) RpYN06 and SARS-CoV-2, and (C) RsYN04 and SARS-CoV-2. (D) Structural similarity between the RpYN06:hACE2, RsYN04:hACE2 and SARS-CoV-2-RBD:hACE2 complexes. The three-dimensional structures of the S1 from RpYN06, RsYN04 and SARS-CoV-2 were modeled using the Swiss-Model program (Waterhouse et al., 2018) employing PDB: 7A94.1 as the template. The S1 domains of RpYN06, RsYN04 and SARS-CoV-2 are colored blue, orange and gray, respectively. The hACE2 are colored yellow. The deletions in RpYN06 and/or RsYN04 are highlighted. The NTD (black arrow heads) is marked. (E-G) BHK-21 cells transfected with hACE2 (BHK-hACE2/GFP) were stained with SARS-CoV-2 RBD (E), RpYN06 RBD (F) and RsYN04 RBD (G), respectively. All experiments were performed three times; one representative of each experiment was shown. (H-J) The supernatant of HEK293T cells containing hACE2-mFc was flowed through a CM5 chip, which was pre-immobilized with anti-mFc antibody, and then a gradient concentration of the indicated RBD was flowed through the chip. The RUs were recorded. (H) hACE2 binding to the SARS-CoV-2 RBD. (I) hACE2 binding to the RpYN06 RBD. (J) hACE2 binding to the RsYN04 RBD. The values shown are the mean ± SD of three independent experiments. See also Figures S3 and S4.
Figure S3.

Molecular characterization and pairwise comparison of SARS-CoV-2 and related coronaviruses. Related to Figures 2 and 4.
(A) Molecular characterization of the spike gene of SARS-CoV-2 and related coronavirus. The viruses in the red box denote the SARS-CoV-2 related coronaviruses identified in this study. The amino acid sites in the gray boxes represent regions with insertion or deletion events (following Holmes et al., 2021). The pale green region represents the N-terminal domain. The yellow box denotes the Receptor Binding Domain (RBD). (B) Pairwise sequence identities of the N-terminal domains between SARS-CoV-2 (reference genome: NC_045512) and SARS-CoV-2 related coronaviruses. The degree of sequence similarity is highlighted by the shading, with cells shaded red denoting the highest identities.
We predicted and compared the three-dimensional structures of RpYN06, RsYN04, and SARS-CoV-2 using homology modeling (Figures 4B-4D). In a similar manner to RmYN02 (Zhou et al., 2020a), the RBD of RpYN06 had two shorter loops than those observed in SARS-CoV-2, while RsYN04 had only one shorter loop (Figure 4D). In addition, near the S1/S2 cleavage sites, the conformational loop of RpYN06 and RsYN04 were different from those of SARS-CoV-2 (Figures 4B and 4C). Notably, RsYN04 exhibited greater amino acid identity (71.28%) and shared more structural similarity with the SARS-CoV-2 RBD than RpYN06 (63.08%). Importantly, the conformational variations caused by these amino acid substitutions and deletions were speculated to interfere with the binding of RpYN06 and RsYN04 RBD to hACE2 (Figure 4D). However, RsYN04 exhibited lower structural similarity with SARS-CoV-2 in the N-terminal domain (NTD) (36.32% amino acid identity; Figure 4C, black arrowheads) than RpYN06 (60.77% amino acid identity).
To determine to what extent the deletions in the RBD region might interfere with the binding of the RpYN06 and RsYN04 RBDs to hACE2, RBDs from SARS-CoV-2, RsYN04, and RpYN06 were prepared and analyzed using flow cytometry and surface plasmon resonance (SPR) assays. The SARS-CoV-2 RBD that readily binds to the BHK-21 cells expressing hACE2 was used as a positive control (Figures 4E, 4H, and S4A–S4C). The RsYN04 RBD caused the fluorescence shift to the BHK-21 cells with the expression of hACE2, whereas the RpYN06 RBD did not (Figures 4F, 4G, and S4A–S4C). The equilibrium dissociation constant (K D) of SARS-CoV-2 RBD binding to hACE2 was calculated to be 11.37 ± 0.57 nM (Figures 4H and S4 D), similar to previous results (Wu et al., 2020b). Consistent with the results from flow cytometry, no detectable binding was observed between the RpYN06 RBD and hACE2, even when the concentration of the RpYN06 RBD was increased to 100 μM (Figures 4I and S4D). However, RsYN04 RBD associated with hACE2, with the K D of 15.87 ± 3.12 μM (Figures 4J and S4D).
Figure S4.

FACS and SPR results of the binding between hACE2 and the RBDs of SARS-CoV-2, RsYN04, RpYN06. Related to Figure 4.
(A-C) BHK-21 cells transfected with hACE2 (BHK-hACE2/GFP) were stained with SARS-CoV-2 RBD (left), RpYN06 RBD (middle) and RsYN04 RBD (right) at a final concentration of 30 μg/mL. A, B and C indicate the results from three experiments. The proportion displayed in the upper right of each panel was calculated from the formulation Q2/(Q2+Q3). The three results were applied to calculate the value of mean ± SD that displayed in Figure 4E-G. (D) The supernatant of HEK293T cells containing hACE2-mFc was passed through a CM5 chip, which was pre-immobilized with anti-mFc antibody, and then a gradient concentration of the indicated RBD was flowed through the chip. The RUs were recorded. The gradient concentration of the samples used in each experiment and calculated ka, kd, and KD were listed. The results were applied to calculate the value of mean ± SD that displayed in Figure 4H-J.
Phylogenetic analysis of novel bat alphacoronaviruses
As well as betacoronaviruses, we identified 17 novel bat alphacoronaviruses. Phylogenetic analyses of the full-length genomes (Figure 5 A), the RdRp genes (Figure 5B), and ORF1ab (Figure S2C) of these 17 viruses and background representatives were consistent, with all trees revealing that the viruses newly identified here fell within four established subgenera: Decacovirus (n = 12), Pedacovirus (n = 1), Myotacovirus (n = 1), and Rhinacovirus (n = 2) (Figure 5). Of note were MlYN15 and RsYN25 isolated from Myotis laniger and R. stheno bats and closely related to swine acute diarrhea syndrome coronavirus (SADS-CoV) (Figure 5; Zhou et al., 2018) sharing nucleotide identities 87.55%–87.61%. In addition, HlYN18, isolated from a Hipposideros larvatus bat, fell within the subgenus Pedacovirus and was close to the porcine epidemic diarrhea virus (PEDV) lineage (Figure 5). Notably, the virus CpYN11 (isolated from Chaerephon plicatus) clustered with WA3607 (GenBank: MK472070; isolated from a bat from Australia), which together might represent an unclassified subgenus (Figure 5). Finally, RsYN14, RmYN17, McYN19, and RmYN24, although isolated from different bat species and sequenced on different lanes, were almost identical (with nucleotide identity >99.98% to each other) and might represent a novel species of subgenus Decacovirus.
Figure 5.

Phylogenetic analysis of 17 novel alphacoronaviruses and representative viruses from different subgenera.
Phylogenetic trees of (A) the full-length virus genome and (B) the RdRp gene of alphacoronaviruses. Phylogenetic analysis was performed using RAxML(Stamatakis 2014) with 1,000 bootstrap replicates, employing the GTR nucleotide substitution model. The two trees were rooted using two betacoronaviruses as outgroups - South_Africa_PML-PHE1/RSA/2011 (KC869678.4) and HCoV-MERS-EMC (NC_019843). Branch lengths are scaled according to the number of substitutions per site. See also Figure S2.
Although the phylogenetic trees of the spike gene (Figure S2D) and protein sequences (Figure S2E) were topologically similar to those of the full-length genome, RdRp, and ORF1ab, a number of notable differences were apparent and indicative of past recombination events. First, CpYN11 clustered with HKU8 rather than WA3607 in the spike gene tree where they formed a separate lineage. Second, the topology of the subgenus Decacovirus in the spike gene tree was different to those observed in other gene regions. Finally, the two viruses belonging to the subgenus Tegacovirus were placed into the subgenera Pedacovirus (GenBank: NC_028806) and a separate lineage (GenBank: DQ848678), respectively.
Ecological modeling of the distribution of Rhinolophus species in Asia
To better understand the ecology of bat coronaviruses, we modeled the distribution of 49 Rhinolophus species in Asia using the collated distribution data and several ecological measures (Figures 6 and S5 ). The models performed well with a mean area under curve (AUC) of 0.96 for training and 0.92 for testing, and all training AUCs were above 0.88. Continentality (reflecting the difference between continental and marine climates) was, on average, the most important factor, contributing an average of 14.91% (based on permutation importance), followed by temperature seasonality at 11.7% average contribution, mean diurnal temperature range at 5.69%, and annual potential evapotranspiration at 5.38%. Three additional ecological factors also contributed more than 5% on average: minimum precipitation at 5.25%, potential evapotranspiration seasonality at 5.17%, and Emberger’s pluviothermic quotient (a measure of climate type) at 5%. The next most important factor was the distance to bedrock (an indicator of potential caves and rock outcrops) at 4.46%. Thus, local climate, especially factors that influence diet availability across the year, is seemingly key to determining bat species distributions across the region.
Figure 6.

Ecological modeling the geographical distribution of 49 rhinolophid bat species.
(A) Models of 49 Rhinolophus bat species that predict their diversity in five regions covering mainland Southeast Asia, Philippines, Java-Sumatra, Borneo and Sulawesi-Moluccas. The map color represents species richness, with up to 23 species projected to co-exist. (B-F) Location distribution of (B) the RaTG13 host species R. affinis, (C) the RpYN06 host species R. pusillus, (D) the RmYN02 host species R. malayanus, (E) the RacCS203 host species R. accuminatus, and (F) the STT182 and STT200 host species R. shameli. The yellow region represents the predicted range of each species. See also Figure S5.
Figure S5.

Distribution maps of 44 additional Rhinolophus species in Southeast Asia regions. Related to Figure 6.
Although we could not accurately model diversity for Indonesia because of limited recently available data and likely high endemism, mainland Southeast Asia was well mapped (Figures 6 and S5). Most of mainland Southeast Asia’s remaining tropical forests showed a high diversity of rhinolophid bats, with a maximum of 23 species estimated to exist concurrently (Figure 6A). Rhinolophid hotspots occurred in forests throughout much of mainland Southeast Asia, with the largest contiguous hotspots extending from South Laos and Vietnam to Southern China (Figure 6A). Hotspots were also identified in the Hengduan mountains, and some parts of northern Myanmar and Nagaland in India (Figure 6A).
Interestingly, R. affinis (Figure 6B) and R. pusillus (Figure 6C) were widely distributed in Southeast Asia and southern China, and most bat species shared hotspots in Cambodia and peninsula Thailand. Several rhinolophid species extended their ranges northward into southern China reflecting the presence of forest (R. affinis and R. pusillus), whereas the geographic range of R. malayanus only just reached southern China (Figures 6D–6F). Ecological drivers for these species unsurprisingly showed some differences. Specifically, R. affinis was also influenced by temperature seasonality (16.59%), followed by Emberger’s pluviothermic quotient and mean diurnal range (8.79 and 8.7%), while R. malayanus (a smaller species) was mainly influenced by annual potential evapotranspiration mean (33.79%) and seasonality (14.57%). R. pusillus was influenced by temperature seasonality (12.44%) and continentality (9%), and R. shameli was largely influenced by annual potential evapotranspiration seasonality (34.81%) followed by annual evapotranspiration (9.79%). Overall, these factors control the range limits and food availability for these bat species.
It should be noted that the ecological modeling identified several other rhinolophid species with wide geographic distributions: R. huanensis, R. lepidus, R. luctus, R. macrotis, R. marshalli, R. microglobosus, R. pearsoni, R. rouxii, R. stheno, R. thomasi, and R. yunnanensis (Figure S5). Notably, R. stheno was found to host both SARS-CoV-2 and SARS-CoV-like coronaviruses.
Discussion
To reveal more of the diversity, ecology and evolution of bat coronaviruses, we collected bat samples in Yunnan province, China during 2019–2020. Overall, 40 of the 100 sequencing libraries contained coronaviruses, including seven libraries with contigs that could be mapped to SARS-CoV-2. In total, we assembled 24 novel coronavirus genomes from different bat species, including four SARS-CoV-2-like coronaviruses. Additional PCR-based tests revealed the presence of these four viruses in nine individual samples collected in Yunnan province between May and July 2020. Together with the SARS-CoV-2-related virus collected from Thailand in June 2020 (Wacharapluesadee et al., 2021), these results clearly demonstrate that viruses closely related to SARS-CoV-2 continue to circulate in bat populations, and in some regions might occur at a relatively high frequency.
Of particular note was that one of the novel bat coronavirus identified here—RpYN06—exhibited 94.5% sequence identity to SARS-CoV-2 across the genome as a whole and in some individual gene regions (ORF1ab, ORF7a, ORF8, N, and ORF10) was the closest relative of SARS-CoV-2 identified to date. However, much lower sequence identity in the spike gene, undoubtedly the product of a past recombination event, made it the second closest relative of SARS-CoV-2, next to RaTG13, at the genomic scale. Hence, aside from the spike gene, RpYN06 possessed a genomic backbone that is arguably the closest to SARS-CoV-2 identified to date.
Although several SARS-CoV-2-like viruses have been identified from different wildlife species that display high sequence similarity to SARS-CoV-2 in some genomic regions, none are highly similar (e.g., >95%) to SARS-CoV-2 in the spike gene in terms of both the overall sequence identity and the amino acid residues at critical receptor binding sites (Zhou et al., 2020a, 2020b; Lam et al., 2020; Xiao et al., 2020; Murakami et al., 2020; Hul et al., 2021; Wacharapluesadee et al., 2021). Indeed, the spike protein sequences of three of the novel coronaviruses described here (RsYN04, RmYN05, and RmYN08) formed an independent lineage separated from known sarbecoviruses by a relatively long branch. In this context, it is interesting that the recently identified bat coronavirus from Thailand carried a three-amino acid-insertion (PVA) at the S1/S2 cleavage site (Wacharapluesadee et al., 2021). Although this motif is different to that seen in SARS-CoV-2 (PRRA) and RmYN02 (PAA), this once again reveals the frequent occurrence of indel events in the spike proteins of naturally sampled betacoronaviruses (Garry et al., 2021; Holmes et al., 2021). Strikingly, RpYN06, RsYN04, RmYN05, and RmYN08 that only possessed one deletion in the RBD were able to bind to hACE2, albeit very weakly. Accordingly, it is possible that there might be another lineage of naturally circulating coronaviruses with spike gene sequences that confer a greater potential to infect humans. Collectively, these results highlight the high and underestimated genetic diversity of sarbecovirus spike proteins, which likely underpins their adaptive flexibility.
Rhinolophid bats are important hosts for coronaviruses (Fan et al., 2019; Latinne et al., 2020). They are adapted to dense forest environments, and the majority of species rarely fly significant distances outside forests as their wing morphology and call frequency is better suited to cluttered habitat conditions (Senawi and Kingston, 2019). Small body size in rhinolophids means that GPS tracking is not possible for the majority of species, although their adaptation to forest habitats makes long-distance migration unlikely. While our monitoring efforts suggest that some larger bat species from other genera may migrate, seasonal abundance changes in species such as R. malayanus, R. stheno, and to a lesser extent R. chaseni, R. thomasi, and R. sinicus, with all showing peaks from April (start of the breeding season), likely reflect seasonal roost changes within the region. While long-distance migration is unlikely to cause the spread of CoVs across the region, the possibility of novel communities of bats of highly similar species forming during key periods such as breeding or following the loss and degradation of roosts could drive host shifts between rhinolophids.
Previous studies have revealed frequent host switching of coronaviruses among bats (Latinne et al., 2020). Indeed, we identified nearly 100% identical coronaviruses from multiple different bat species, indicative of the frequent cross-species virus transmission. As noted above, this in part likely reflects their roosting behavior and propensity to share the same or close habitats. In this context it is noteworthy that three of the newly identified SARS-CoV-2-related coronaviruses grouped with the pangolin-derived coronaviruses from Guangxi in the whole genome phylogeny. Although the associated branch lengths are relatively long such that other hosts may be involved, and there are topological differences between gene trees, this is suggestive of virus transmission between pangolins and bats. Recently, a new SARS-CoV-2-related coronavirus was identified from a pangolin from Yunnan (GISAID ID EPI_ISL_610156). Whether pangolin-derived coronaviruses have established a distinct lineage clearly warrants further investigation.
Our ecological modeling revealed a high richness of rhinolophids across much of Southeast Asia and southern China, with up to 23 species projected to co-exist from the 49 species included in analysis. The largest expanses of high bat diversity habitat stretch from South Vietnam into southern China (Hughes et al., 2012; Allen et al., 2017). Indeed, it is striking that all the bat viruses described here, as well as RmYN01 and RmYN02 described previously (Zhou et al., 2020a), were identified in a small area (~1,100 hectare) in Yunnan province. This highlights the remarkable phylogenetic and genomic diversity of bat coronaviruses in a tiny geographic area and to which humans may be routinely exposed. Importantly, in addition to rhinolophids, this broad geographic region in Asia is rich in many other bat families (Anthony et al., 2017) and other wildlife species (Olival et al., 2017) that have been shown to be susceptible to SARS-CoV-2 in vitro (Conceicao et al., 2020; Wu et al., 2020b; Sang et al., 2020; Yan et al., 2021). It is therefore essential that further surveillance efforts should cover a broader range of wild animals in this region to help track ongoing spillovers of relatives of SARS-CoV-2 and SARS-CoV, as well as other pathogenic viruses from animals to humans.
Limitations of the Study
This study presents the identification of four SARS-CoV-2 related coronaviruses in bats, including one virus displaying high sequence identity to SARS-CoV-2 in most genomic regions. However, the direct evolutionary progenitor of SARS-CoV-2 remains unclear, and our sampling only considers a small number of bat species from a restricted geographic region. In addition, we did not consider other potential mammalian hosts for SARS-CoV-2 related coronaviruses that may also shed light on virus origins.
STAR★Methods
Key resources table
| REAGENT or RESOURCE | SOURCE | IDENTIFIER |
|---|---|---|
| Antibodies | ||
| APC anti-His Tag antibody | BioLegend | Cat# 362605; RRID: AB_2715818 |
| Viruses | ||
| bat/Yunnan/RmYN01/2019 | Zhou et al., 2020a | GISAID: EPI_ISL_412976 |
| bat/Yunnan/RmYN02/2019 | Zhou et al., 2020a | GISAID: EPI_ISL_412977 |
| RsYN03 | This paper | BioProject: PRJNA707649 |
| RsYN04 | This paper | BioProject: PRJNA707649 |
| RmYN05 | This paper | BioProject: PRJNA707649 |
| RpYN06 | This paper | BioProject: PRJNA707649 |
| RmYN07 | This paper | BioProject: PRJNA707649 |
| RmYN08 | This paper | BioProject: PRJNA707649 |
| RsYN09 | This paper | BioProject: PRJNA707649 |
| HlYN10 | This paper | BioProject: PRJNA707649 |
| CpYN11 | This paper | BioProject: PRJNA707649 |
| RsYN12 | This paper | BioProject: PRJNA707649 |
| HpYN13 | This paper | BioProject: PRJNA707649 |
| RsYN14 | This paper | BioProject: PRJNA707649 |
| MlYN15 | This paper | BioProject: PRJNA707649 |
| MmYN16 | This paper | BioProject: PRJNA707649 |
| RmYN17 | This paper | BioProject: PRJNA707649 |
| HlYN18 | This paper | BioProject: PRJNA707649 |
| McYN19 | This paper | BioProject: PRJNA707649 |
| MlYN20 | This paper | BioProject: PRJNA707649 |
| RmYN21 | This paper | BioProject: PRJNA707649 |
| RmYN22 | This paper | BioProject: PRJNA707649 |
| HlYN23 | This paper | BioProject: PRJNA707649 |
| RmYN24 | This paper | BioProject: PRJNA707649 |
| RsYN25 | This paper | BioProject: PRJNA707649 |
| HcYN26 | This paper | BioProject: PRJNA707649 |
| Biological Samples | ||
| Samples are described in Table S1 | This paper | N/A |
| Chemicals, Peptides, and Recombinant Proteins | ||
| RNAlater Stabilization Solution | Invitrogen | Cat#AM7021 |
| ReverTra Ace qPCR RT Kit | TOYOBO | Cat#FSQ-101 |
| Pro Taq HS Premix Probe qPCR Kit | AG | Cat#AG11704 |
| 2 x Accurate Taq Master Mix (dye plus) | AG | Cat#AG11019 |
| E. coli DH5α Competent Cells | Takara | Cat#9057 |
| DMEM basic | Thermo Fisher Scientific | Cat# C11995500BT |
| Fetal bovine serum | GIBCO | Cat# 10270106 |
| PEI | Alfa | A04043896-1g |
| Recombinant SARS-CoV-2 RBD proteins, residues 319-541, GISAID: EPI_ISL_402119 | This paper | N/A |
| Recombinant MERS RBD proteins, residues 367-606, GenBank: JX869050 | This paper | N/A |
| Recombinant RsYN04 RBD protein, residues 309-527, GISAID: EPI_ISL_1699444 | This paper | N/A |
| Recombinant RpYN06 RBD protein, residues 315-518, EPI_ISL_1699446 | This paper | N/A |
| Recombinant hACE2 proteins fused with mFc, residues 19-740, GenBank: NP_001358344 | This paper | N/A |
| Critical Commercial Assays | ||
| RNAprep pure Cell/Bacteria Kit | TianGen | Cat#DP430 |
| 3′-Full RACE Core Set with PrimeScript RTase | Takara | Cat#6106 |
| SMARTer RACE 5′/3′ Kit | Clontech | Cat#634858 |
| pMD19-T Vector Cloning Kit | Takara | Cat#6013 |
| Mouse Antibody Capture Kit | GE Healthcare | Cat# BR-1008-38 |
| Series S Sensor Chip CM5 | GE Healthcare | Cat# 10270238 |
| HisTrap HP 5 mL column | GE Healthcare | Cat# 17524802 |
| HiLoad 16/600 Superdex 200PG | GE Healthcare | Cat# 28989335 |
| Deposited Data | ||
| Raw and analyzed data | This paper | SRA: SRR14381416-SRR14381434 |
| Genome sequences of seven beta-CoVs | This paper | GISAID: EPI_ISL_1699443-EPI_ISL_1699449/ GenBank: MZ081376-MZ081382 |
| Genome sequences of 17 alpha-CoVs | This paper | GenBank: MZ081383-MZ081399 |
| SARS-CoV-2 reference genome sequences taken from databases are listed in Table S5 | GenBank/GISAID | N/A |
| Oligonucleotides | ||
| Primer sequences are provided in the Table S4 | This paper | N/A |
| Experimental models: cell lines | ||
| HEK293T cells | ATCC | ATCC CRL-3216 |
| BHK cells | ATCC | Cat# CRL-6282 |
| Recombinant DNA | ||
| pCAGGS | MiaoLingPlasmid | Cat# P0165 |
| pCAGGS-SARS-CoV-2-RBD-His, residues 319-541 | This paper | GISAID: EPI_ISL_402119 |
| pCAGGS-MERS-RBD-His, residues 367-606 | This paper | GenBank: JX869050 |
| pCAGGS-RsYN04-RBD-His, residues 309-527 | This paper | GISAID: EPI_ISL_1699444 |
| pCAGGS-RpYN06-RBD-His, residues 315-518 | This paper | GISAID: EPI_ISL_1699446 |
| pCAGGS-SARS-CoV-2-hACE2-mFc, residues 1-740 | This paper | GenBank: NP_001358344 |
| pEGFP-N1 | MiaoLingPlasmid | Cat# P0133 |
| pEGFP-N1-hACE2 | This paper | GenBank: NP_001358344 |
| Software and Algorithms | ||
| Bowtie2 v2.4.1 | Langmead and Salzberg, 2012 | http://bowtiebio.sourceforge.net/bowtie2 |
| Kraken v2.0.9 | Wood et al., 2019 | https://ccb.jhu.edu/software/kraken/ |
| Geneious v2021.0.1 | The Biomatters development team | https://www.geneious.com/ |
| MAFFT v7.450 | Nakamura et al., 2018 | https://mafft.cbrc.jp/alignment/software/ |
| Clustal Omega v1.2.2 | Sievers et al., 2011 | http://www.clustal.org/omega/ |
| BLAST | Camacho et al., 2009 | https://blast.ncbi.nlm.nih.gov/Blast.cgi |
| SAMtools v1.10 | Li et al., 2009 | http://samtools.sourceforge.net/ |
| Figtree v1.4.4 | http://tree.bio.ed.ac.uk/software/figtree/ | |
| MEGAHIT v1.2.9 | Li et al., 2015 | https://github.com/voutcn/megahit |
| coronaSPAdes v3.15.0 | Meleshko et al., 2021 | https://cab.spbu.ru/software/coronaspades/ |
| RAxML v8.1.6 | Stamatakis, 2014 | https://cme.h-its.org/exelixis/web/software/raxml/index.html |
| TreeMap 3b | Charleston, 2011 | http://sites.google.com/ site/cophylogeny |
| Simplot v3.5.1 | Lole et al., 1999 | https://www.mybiosoftware.com/simplot-3-5-1-sequence-similarityplotting.html |
| Biacore Insight Evaluation, version 1.0.5.11069 | GE Healthcare | N/A |
| Graphpad Prism 8.0 | GraphPad Software | https://www.graphpad.com/ |
| FlowJo V7.6 | FLOWJO | https://www.flowjo.com/solutions/flowjo/downloads |
| SWISS-MODEL | Waterhouse et al., 2018 | https://swissmodel.expasy.org/ |
| PyMOL v2.4.0a0 | https://pymol.org/2/ | |
| Other | ||
| Sequencing systems | Illumina | NovaSeq 6000 |
Resource availability
Lead Contact
Further information and requests for resources and reagents should be directed to and will be fulfilled by the lead contact, Weifeng Shi (shiwf@ioz.ac.cn).
Materials availability
Materials used and generated in this study are available from the Lead Contact on request with a completed Materials Transfer Agreement.
Data and code availability
The raw reads generated from the 19 libraries in this study have been deposited in the NCBI Sequence Read Archive (SRA) database under the BioProject accession number PRJNA707649 (SRA accession numbers: SRR14381416-SRR14381434). The genome sequences of the seven betacoronavirus and 17 alphacoronavirus generated in this study have also been deposited in the GenBank and assigned accession numbers MZ081376-MZ081399. The seven betacoronavirus genomes are also available from GISAID with accession numbers EPI_ISL_1699443-EPI_ISL_1699449. Sequence data can also be downloaded from the China National Microbiological Data Center (bioproject accession number: NMDC10017765, MSRA accession numbers: NMDC40004798- NMDC40004821 and sequence accession numbers: NMDC60018441- NMDC60018464). Additional Supplemental Items are also available at Mendeley Data: https://doi.org/10.17632/txkvffh2sm.1.
Experimental model and subject details
A total of 23 different bat species were tested in this study (Table S1). Samples were collected between May 2019 and November 2020 from Mengla County, Yunnan Province in southern China (101.271563 E, 21.918897 N; 101.220091 E, 21.593202 N and 101.297471 E, 21.920934 N). The Xishuangbanna Tropical Botanical Garden has an ethics committee that provided permission for trapping and bat surveys within this study.
Method details
Sample collection
A total of 411 samples from 342 bats were collected from the Xishuangbanna Tropical Botanical Garden and its adjacent areas, Mengla County, Yunnan Province in southern China between May 2019 and November 2020. Bats were trapped using harp traps and a variety of samples were collected from each individual bat including feces (n = 283), oral swab (n = 109) and urine (n = 19). Fecal and swab samples were collected and stored in RNAlater (Invitrogen), and urine samples were directly collected in the RNase-free tubes. These bats were primarily identified according to morphological criteria and found to belong to 23 different species, with the majority representing horseshoe bats (n = 183) including Rhinolophus malayanus, R. stheno, R. sinicus, R. siamensis, R. pusillus and other R. genus bats, as well as Hipposideros larvatus (n = 59) (Table S1). All bats were sampled alive and subsequently released. All samples were transported on ice and then kept at −80°C until use.
Next generation sequencing
All bat samples were merged into 100 pools to generate sequencing libraries, based on the sample types, bat species and collection date. Of these bat libraries, 18 libraries have been described previously (Zhou et al., 2020a), including the library from which the viruses RmYN01 and RmYN02 were identified. These 18 libraries were combined with 82 additional libraries newly obtained here. Total RNA from samples was extracted using RNAprep pure Cell/Bacteria Kit (TianGen) and aliquots of the RNA solutions were then pooled in equal volume. Libraries were constructed using the NEBNext Ultra Directional RNA Library Prep Kit for Illumina (NEB). Ribosomal (r) RNA of fecal, oral swab and urine was removed using the TransNGS rRNA Depletion (Bacteria) Kit (TransGen) and rRNA of tissues was removed using TransNGS rRNA Depletion (Human/Mouse/Rat) Kit (TransGen), respectively. Paired-end (150 bp) sequencing of each RNA library was performed on the NovaSeq 6000 platform (Illumina) with the S4 Reagent Kit, and performed by the Novogene Bioinformatics Technology (Beijing, China).
Genome assembly and annotation
Clean reads from the next generation sequencing were classified with Kraken (v2.0.9) based on all microbial sequences from the NCBI nucleotide database. Paired-end reads classified as from coronaviruses were extracted from the Kraken output. To further verify the existence of coronaviruses, reads classified as coronaviruses were assembled with MEGAHIT (v1.2.9). The contigs from MEGAHIT were searched by BLASTn based on the NCBI nt database. Sequencing libraries with contigs identified as representing coronavirus were de novo assembled with coronaSPAdes (v3.15.0). The near complete genomes of coronavirus were then identified from the results of coronaSPAdes by BLASTn searching.
The newly assembled coronavirus genomes were validated by read mapping using Bowtie2 (v2.4.1). The coverage and depth of coronavirus genomes were calculated with SAMtools (v1.10) based on SAM files from Bowtie2. To further improve the quality of the genome annotations, SAM files of the reads mapping to SARS-CoV-2 were checked manually with Geneious (v2021.0.1), extending the ends as much as possible. The open reading frames (ORFs) of the verified genome sequences were annotated using Geneious (v2021.0.1) and then checked with closed references from NCBI. The taxonomy of these newly assembled coronavirus genome were determined by online BLAST (https://blast.ncbi.nlm.nih.gov/Blast.cgi).
Coronavirus contigs produced by MEGAHIT (v1.2.9) were analyzed to evaluate the existence of coronavirus sequences in each library. To mitigate the possibility of false positives due to index hopping, coronavirus contigs from different libraries within the same chip and same lane were compared, and if a shorter contig shared > 99% nucleotide sequence identity with a longer contig from another library, the shorter one was removed.
Sanger sequencing
The assembled genome sequences of the beta-CoVs identified here were further confirmed by quantitative real-time PCR (qPCR), PCR amplification and Sanger sequencing. A TaqMan-based qPCR was first performed to test the feces of pools p19, p35, p44, p46, p52 and p62, as these contained beta-CoVs according to the metagenomic analysis. cDNA synthesis was performed using the ReverTra Ace qPCR RT Kit (TOYOBO). The qPCR reaction was undertaken using a set of probe and primer pairs (Table S4) in the Pro Taq HS Premix Probe qPCR Kit (AG) with a LightCycler 96 Real-Time PCR System (Roche).
Rapid amplification of cDNA ends (RACE)
The sequences of the 5ʹ and 3ʹ termini were obtained by RACE using the SMARTer RACE 5′/3′ Kit and 3′-Full RACE Core Set (Takara), according to the manufacturer’s instructions with some minor modifications. Two sets of gene-specific primers (GSPs) and nested-GSPs (NGSPs) for the 5ʹ and one set for the 3ʹ RACE PCR amplification were designed based on the assembled genome sequences of six beta-CoVs (Table S3). The first round of amplification was performed by touchdown PCR, while the second round comprised regular PCR. The PCR amplicons of ~1,000 bp fragments of the two regions were obtained separately and sequenced with the amplified primer or gel purified followed by ligation with the pMD18-T Simple Vector (Takara) and transformation into competent Escherichia coli DH5α (Takara). Insertion products were sequenced with M13 forward and reverse primers.
Amplification of beta-CoVs S gene and the host COI gene
Based on the spike gene and the adjacent sequences of RsYN04, RmYN05, RmYN08 and RpYN06, 9 primer pairs were designed for Sanger sequencing (Table S4). The cDNAs reverse transcribed above were used as templates. The thermal cycling parameters for PCR amplification were as follows: 5 min at 95°C, followed by 30 s at 95°C, 30 s at 50°C (an exception of 55°C for primers 379SF5/379SR5), 1 min at 72°C for 30 cycles, and 10 min at 72°C. A second round PCR was performed under the same conditions with the corresponding PCR products used as templates. Further confirmation of host species was based on analysis of the cytochrome b (cytb) gene obtained from the assembled contigs. We also amplified and sequenced the fragment of cytochrome c oxidase subunit I (COI) gene using primers VF1/VR1 (Ivanova et al., 2007). Briefly, the following touchdown PCR conditions were used: 30 s at 95°C, 30 s at 52°C to 45°C, 45 s at 72°C for 14 cycles; and followed by 30 s at 95°C, 30 s at 45°C, 45 s at 72°C for 30 cycles.
Bioinformatics analyses
Phylogenetic analysis. Multiple sequence alignment of the alphacoronavirus and betacoronavirus nucleotide sequences was performed using MAFFT (v7.450). Phylogenetic analysis of the complete genome and major genes were performed using the maximum likelihood (ML) method available in RAxML (v8.2.11) with 1,000 bootstrap replicates, employing the GTR nucleotide substitution model and a gamma distribution of rate variation among sites. The resulting phylogenetic trees were visualized using Figtree (v1.4.4). Based on the trees from RAxML, a tanglegram between ORF1ab and Spike gene phylogenies was constructed. This tanglegram was visualized in TreeMap3 (Charleston 2011), displaying connections between the ORF1ab and Spike gene phylogenies of each virus (employing the ‘untangle’ function).
Sequence identity and recombination analysis. Pairwise sequence identities of the complete viral genome and genes between SARS-CoV-2 and representative sarbecoviruses were calculated using Geneious (v2021.0.1). A whole genome sequence similarity plot was performed using Simplot (v3.5.1), with a window size of 1000bp and a step size of 100bp.
Site and structural analysis of the spike gene. The three-dimensional structures of the S1 protein from RpYN06, RsYN04 and SARS-CoV-2 were modeled using the Swiss-Model program (Waterhouse et al., 2018) employing PDB: 7A94.1 as the template. Molecular images were generated with an open-source program - PyMOL. Multiple sequence alignment of spike gene amino acid sequences was performed using Clustal Omega (v1.2.2).
RBD:hACE2 binding assays
Protein expression and purification. The recombinant RBDs of SARS-CoV-2, RsYN04, RpYN06 were expressed in HEK293F cells. A pCAGGS plasmid containing these RBD sequences, together with a C-terminal His tag, was transiently transfected into cells. After 6 d expression, supernatants were collected, centrifuged, and filtered through 0.22 μm filters. The soluble proteins were purified by metal affinity chromatography using a HisTrap HP 5 mL column (GE Healthcare). The samples were then pooled and further purified via size exclusion chromatography with a Superdex 200 column (GE Healthcare) in a buffer composed of 20 mM Tris-HCl (pH 8.0) and 150 mM NaCl.
To prepare the mFc-tagged hACE2, the pCAGGS plasmid containing the coding sequence of the hACE2 ectodomain (residues from 1 to 740; accession number, BAJ21180) was transiently transfected into HEK293T cells. 48 h later, supernatant containing the indicated protein were collected, concentrated and then used for SPR assays.
Flow cytometry. For the binding test, the plasmid containing hACE2 that was fused with eGFP were transfected into BHK-21 cells using PEI (Alfa) according to the manufacturer’s instructions. 2 × 10⁵ cells were collected 24 h after transfection, suspended in PBS (with 0.5% FBS) and incubated with the purified individual His-tagged proteins at a final concentration of 30 μg/mL at 37°C for 30 min, followed by washing with PBS twice and further incubation with anti-His/APC antibodies (1:500, Miltenyi Biotec). After washing, the cells were analyzed using a BD FACSCanto. The analysis was performed using Flowjo7.0 software.
SPR analysis. We tested the binding affinities between the mFc-tagged hACE2 and RBDs of SARS-CoV-2, RsYN04, RpYN06 proteins by SPR using a BIAcore 8K (GE Healthcare) performed at 25°C in single-cycle mode. The HBS-EP buffer (20 mM HEPES, pH 7.4, 150 mM NaCl, and 0.005% (v/v) Tween 20) was used as the running buffer, and RBDs of SARS-CoV-2, RsYN04, RpYN06 proteins were changed into this buffer, respectively, by gel filtration before use. First, the anti-mFc antibodies were immobilized on the CM5 biosensor chip (GE Healthcare) using amine-coupling chemistry protocol (GE Healthcare). Then, the supernatant containing mFc-tagged hACE2 was injected and captured at ~500-900 response units. The RBDs of SARS-CoV-2, RsYN04 and RpYN06 were serially diluted and passed through the chip surface and the binding response was measured. Briefly, 100, 50, 25, 12.5 and 6.25 μM of RsYN04 or RpYN06 RBD proteins were used. For the SARS-CoV-2 RBD, 200, 100, 50, 25 and 12.5 nM were used. The anti-mFc antibody was regenerated with 10 mM Glycine-HCl (pH 1.7). The equilibrium dissociation constants (K D) of each pair of interaction were calculated using BIAcore® 8K Evaluation Software (GE Healthcare) by fitting to a 1:1 Langmuir binding model.
Ecological modeling
Data was collated using a combination of that from Hughes (2019), various online repositories (Table S6), and additional GBIF data collated between 2017 and 2021. Further data was downloaded for Indonesia since 1990, even though wide-scale deforestation means that most species are to still likely to occupy only small parts of their range. This provided sufficient data to model 49 rhinolophid species based on 8418 occurrence points (once any duplicate points of species recorded repeatedly at the same location had been removed), with almost all records collected since 1998. Maxent 3.4.4 was used to cross-reference a selection of variables (Table S7) with recorded locality data and hence determine the relationships necessary to predict species ranges. Maxent is a correlative model that applies increasingly complex statistics based on the number of species occurrences point per species. These statistics range from purely “linear” regression analysis for the smallest sample sizes to “hinge features” at higher sample-sizes that use a cumulative-logistic feature to assay the probability of occurrence for each species by analyzing the relationship between species occurrences and each environmental variable (Elith et al., 2011; Phillips et al., 2017).
Variables were selected to provide a good simulation of the environmental conditions that may shape species distributions, while minimizing the number of variables to allow modeling of species with few occurrence records. Variables were selected based on our former analyses (Hughes et al., 2012; Hughes 2017), which helped refine influential variables and remove highly correlated variables which jackknife analysis showed to provide relatively little novel information (such as isothermality and daily-temperature range). To model a suite of species models needed to provide enough information to simulate relevant ecological factors across species in very different conditions across much of Asia, while retaining as few variables as could usefully be used (to maximize the statistical strength of models). Variables included a number of bioclimatic parameters (1,2,4,5,11,12,13,14,15: http://worldclim.org/version2) in addition to productivity and other climate metrics (NDVI, a surrogate of Net primary productivity), seasonality, actual evapotranspiration, potential evapotranspiration seasonality and mean annual potential evapotranspiration, aridity, Emberger’s pluviothermic quotient, continentality, thermicity, maximum temperature of the coldest month - http://envirem.github.io/ - and both NDVI seasonality and mean). These provide metrics of thermal stability and variability that may be particularly important for small bodied species, or those reliant on seasonal resources. Further information is available in Table S7 including a full justification of variable selection. In addition, we included some topographic variables including soil pH, distance to bedrock, average tree height and tree density. All variables were clipped to a mask of tropical Southeast Asia and southern China at a resolution of 0.008 decimal degrees (approximately 1km2) in ArcMap 10.3, then converted to asci format for modeling.
Models of rhinolophid diversity were run in Maxent 3.4.4. Five replicates were run for each species, and the average taken before reclassifying with the 10th percentile cumulative logistic threshold to form binary maps for each species (Hughes et al., 2012). AUC for training and testing was 0.96 and 0.92 respectively, and all training AUCs were above 0.88, indicating that the models perform well based on testing data. Using model averages between replicates also prevents stochasticity between models. Maxent also assays the importance of each variable using a number of approaches. Permutation importance was used to assess the importance of different variables on species distributions (Elith et al., 2011).
Because of complex regional biogeography, optimal species habitat can exist in areas that have not been colonized. Therefore, we downloaded mapped ranges for 39 of the 49 species modeled from the IUCN (https://www.iucnredlist.org/resources/spatial-data-download). Bats were extracted from this data, clipped to match the study area. We then divided the IUCN data into five regions; mainland Southeast Asia, Philippines, Java-Sumatra, Borneo and Sulawesi-Moluccas, using shapefiles of each region to clip out bats listed there. This was collated to form a spreadsheet listing each zone each species was listed in, and then the appropriate shapefiles used to determine the ranges of each species (although only 39 of the 49 species could be treated in this way, as the remaining species are not mapped in IUCN, and so no zonal filter could be developed). Each species was then re-mosaiced with the mask to provide a binary distribution map, removing any potentially suitable areas that were outside the species biogeographic range. Stricter filters were not used because for the majority of species there is not a clear analysis of genuine delineations of species ranges of if these species are migratory. These binary mosaicked maps were then summed with the other ten species using the mosaic tool to generate a map of richness for the region.
Quantification and statistical analysis
Binding studies
KD values for SPR experiments were obtained with BIAcore® 8K Evaluation Software (GE Healthcare), using a 1:1 binding model. The values shown are the mean ± SD of three independent experiments.
Flow cytometry analysis
All the experiments were performed three times. One representative of each experiment is shown in Figure 4.
Acknowledgments
This work was supported by the Academic Promotion Programme of Shandong First Medical University (2019QL006), the Key research and development project of Shandong province (2020SFXGFY01 and 2020SFXGFY08), the National Science and Technology Major Project (2020YFC0840800 and 2018ZX10101004-002), the National Major Project for Control and Prevention of Infectious Disease in China (2017ZX10104001-006), the Strategic Priority Research Programme of the Chinese Academy of Sciences (XDB29010102 and XDA20050202), the Chinese National Natural Science Foundation (32041010 and U1602265), and the High-End Foreign Experts Program of Yunnan Province (Y9YN021B01). W.S. was supported by the Taishan Scholars Programme of Shandong Province. Y.B. is supported by the NSFC Outstanding Young Scholars (31822055) and Youth Innovation Promotion Association of CAS (2017122). E.C.H. is supported by an ARC Australian Laureate Fellowship (FL170100022). We thank all the scientists who kindly shared their genomic sequences of the coronaviruses used in this study.
Author contributions
W.S., E.C.H. and A.C.H. designed and supervised research. X.C., Y.C. and A.C.H. collected the samples. H.Z., Y.B., M.C. and Y.Z. processed the samples. H.Z. performed the 5′ and 3′ RACE, Sanger sequencing and molecular detection. J.J., J.L. and T.H. performed the genome assembly and annotation. J.J., H.Z. and J.L. performed the genome analysis and interpretation. J.L. and H.S. performed the homology modeling. Q.W. and R.Z. performed the RBD:hACE2 binding analysis. A.C.H. performed the ecological modeling. X.C. and Y.B. assisted in data interpretation and edited the paper. W.S., E.C.H. and A.C.H. wrote the paper.
Declaration of interests
The authors declare no competing interests.
Published: June 9, 2021
Footnotes
Supplemental information can be found online at https://doi.org/10.1016/j.cell.2021.06.008.
Supplemental information
Table S1. Summary of the number of individual bats and samples collected in the present study and the libraries used for next generation sequencing. Related to Figure 1. Table S2. Coronavirus and SARS-CoV-2 related sequence detection. Related to Figure S1 and the “Genome assembly and annotation” section of the STAR Methods. Table S3. Coronavirus genome assembly and taxonomy. Related to Figures 3 and 5. Table S4. Primers used for the detection and amplification of the S gene, and 5′ and 3′ terminal sequences of the four SARS-CoV-2 related genomes. Related to Figure 1 and the “Sanger sequencing” section of the STAR Methods. Table S6. Data resources for ecological modeling of the distribution of 49 Rhinolophus species in Asia. Related to Figures 6 and S5.
References
- Allen T., Murray K.A., Zambrana-Torrelio C., Morse S.S., Rondinini C., Di Marco M., Breit N., Olival K.J., Daszak P. Global hotspots and correlates of emerging zoonotic diseases. Nat. Commun. 2017;8:1124–1133. doi: 10.1038/s41467-017-00923-8. [DOI] [PMC free article] [PubMed] [Google Scholar]
- Anthony S.J., Johnson C.K., Greig D.J., Kramer S., Che X., Wells H., Hicks A.L., Joly D.O., Wolfe N.D., Daszak P., et al. PREDICT Consortium Global patterns in coronavirus diversity. Virus Evol. 2017;3:vex012. doi: 10.1093/ve/vex012. [DOI] [PMC free article] [PubMed] [Google Scholar]
- Camacho C., Coulouris G., Avagyan V., Ma N., Papadopoulos J., Bealer K., Madden T.L. BLAST+: architecture and applications. BMC Bioinformatics. 2009;10:421–429. doi: 10.1186/1471-2105-10-421. [DOI] [PMC free article] [PubMed] [Google Scholar]
- Chan J.F., To K.K., Tse H., Jin D.Y., Yuen K.Y. Interspecies transmission and emergence of novel viruses: lessons from bats and birds. Trends Microbiol. 2013;21:544–555. doi: 10.1016/j.tim.2013.05.005. [DOI] [PMC free article] [PubMed] [Google Scholar]
- Charleston M.A. 2011. TreeMap 3b.http://sites.google.com/ site/cophylogeny accessed 14 Jul 2019. [Google Scholar]
- Conceicao C., Thakur N., Human S., Kelly J.T., Logan L., Bialy D., Bhat S., Stevenson-Leggett P., Zagrajek A.K., Hollinghurst P., et al. The SARS-CoV-2 Spike protein has a broad tropism for mammalian ACE2 proteins. PLoS Biol. 2020;18:e3001016. doi: 10.1371/journal.pbio.3001016. [DOI] [PMC free article] [PubMed] [Google Scholar]
- Corman V.M., Muth D., Niemeyer D., Drosten C. Hosts and Sources of Endemic Human Coronaviruses. Adv. Virus Res. 2018;100:163–188. doi: 10.1016/bs.aivir.2018.01.001. [DOI] [PMC free article] [PubMed] [Google Scholar]
- Elith J., Phillips S.J., Hastie T., Dudik M., Chee Y.E., Yates C.J. A statistical explanation of MaxEnt for ecologists. Divers. Distrib. 2011;17:43–57. [Google Scholar]
- Fan Y., Zhao K., Shi Z.L., Zhou P. Bat Coronaviruses in China. Viruses. 2019;11:210–223. doi: 10.3390/v11030210. [DOI] [PMC free article] [PubMed] [Google Scholar]
- Forni D., Cagliani R., Clerici M., Sironi M. Molecular Evolution of Human Coronavirus Genomes. Trends Microbiol. 2017;25:35–48. doi: 10.1016/j.tim.2016.09.001. [DOI] [PMC free article] [PubMed] [Google Scholar]
- Garry R.F., Andersen K.G., Gallaher W.R., Lam T.T., Gangaparapu K., Latif A.A., Beddingfield B.J., Rambaut A., Holmes E.C. 2021. Spike protein mutations in novel SARS-CoV-2 ‘variants of concern’ commonly occur in or near indels.https://virological.org/t/spike-protein-mutations-in-novel-sars-cov-2-variants-of-concern-commonly-occur-in-or-near-indels/605/1 [Google Scholar]
- Holmes E.C., Andersen K.G., Rambaut A., Garry R.F. 2021. Spike protein sequences of Cambodian, Thai and Japanese bat sarbecoviruses provide insights into the natural evolution of the Receptor Binding Domain and S1/S2 cleavage site.https://virological.org/t/spike-protein-sequences-of-cambodian-thai-and-japanese-bat-sarbecoviruses-provide-insights-into-the-natural-evolution-of-the-receptor-binding-domain-and-s1-s2-cleavage-site/622 [Google Scholar]
- Hughes A.C. Mapping priorities for conservation in Southeast Asia. Biol. Conserv. 2017;209:395–405. [Google Scholar]
- Hughes A.C. Understanding and minimizing environmental impacts of the Belt and Road Initiative. Conserv. Biol. 2019;33:883–894. doi: 10.1111/cobi.13317. [DOI] [PubMed] [Google Scholar]
- Hughes A.C., Satasook C., Bates P.J., Bumrungsri S., Jones G. The projected effects of climatic and vegetation changes on the distribution and diversity of Southeast Asian bats. Glob. Change Biol. 2012;18:1854–1865. [Google Scholar]
- Hul V., Delaune D., Karlsson E.A., Hassanin A., Ou Tey P., Baidaliuk A., Gámbaro F., Tan Tu V., Keatts L., Mazet J., et al. A novel SARS-CoV-2 related coronavirus in bats from Cambodia. bioRxiv. 2021 doi: 10.1101/2021.01.26.428212. [DOI] [PMC free article] [PubMed] [Google Scholar]
- Ivanova N.V., Zemlak T.S., Hanner R.H., Hebert P.D.N. Universal primer cocktails for fish DNA barcoding. Mol. Ecol. Notes. 2007;7:544–548. [Google Scholar]
- Lam T.T., Jia N., Zhang Y.W., Shum M.H., Jiang J.F., Zhu H.C., Tong Y.G., Shi Y.X., Ni X.B., Liao Y.S., et al. Identifying SARS-CoV-2-related coronaviruses in Malayan pangolins. Nature. 2020;583:282–285. doi: 10.1038/s41586-020-2169-0. [DOI] [PubMed] [Google Scholar]
- Langmead B., Salzberg S.L. Fast gapped-read alignment with Bowtie 2. Nat. Methods. 2012;9:357–359. doi: 10.1038/nmeth.1923. [DOI] [PMC free article] [PubMed] [Google Scholar]
- Latinne A., Hu B., Olival K.J., Zhu G., Zhang L., Li H., Chmura A.A., Field H.E., Zambrana-Torrelio C., Epstein J.H., et al. Origin and cross-species transmission of bat coronaviruses in China. Nat. Commun. 2020;11:4235–4249. doi: 10.1038/s41467-020-17687-3. [DOI] [PMC free article] [PubMed] [Google Scholar] [Retracted]
- Letko M., Seifert S.N., Olival K.J., Plowright R.K., Munster V.J. Bat-borne virus diversity, spillover and emergence. Nat. Rev. Microbiol. 2020;18:461–471. doi: 10.1038/s41579-020-0394-z. [DOI] [PMC free article] [PubMed] [Google Scholar]
- Li H., Handsaker B., Wysoker A., Fennell T., Ruan J., Homer N., Marth G., Abecasis G., Durbin R., 1000 Genome Project Data Processing Subgroup The Sequence Alignment/Map format and SAMtools. Bioinformatics. 2009;25:2078–2079. doi: 10.1093/bioinformatics/btp352. [DOI] [PMC free article] [PubMed] [Google Scholar]
- Li D., Liu C.M., Luo R., Sadakane K., Lam T.W. MEGAHIT: an ultra-fast single-node solution for large and complex metagenomics assembly via succinct de Bruijn graph. Bioinformatics. 2015;31:1674–1676. doi: 10.1093/bioinformatics/btv033. [DOI] [PubMed] [Google Scholar]
- Lole K.S., Bollinger R.C., Paranjape R.S., Gadkari D., Kulkarni S.S., Novak N.G., Ingersoll R., Sheppard H.W., Ray S.C. Full-length human immunodeficiency virus type 1 genomes from subtype C-infected seroconverters in India, with evidence of intersubtype recombination. J. Virol. 1999;73:152–160. doi: 10.1128/jvi.73.1.152-160.1999. [DOI] [PMC free article] [PubMed] [Google Scholar]
- Lu R., Zhao X., Li J., Niu P., Yang B., Wu H., Wang W., Song H., Huang B., Zhu N., et al. Genomic characterisation and epidemiology of 2019 novel coronavirus: implications for virus origins and receptor binding. Lancet. 2020;395:565–574. doi: 10.1016/S0140-6736(20)30251-8. [DOI] [PMC free article] [PubMed] [Google Scholar]
- Meleshko D., Hajirasouliha I., Korobeynikov A. coronaSPAdes: from biosynthetic gene clusters to RNA viral assemblies. bioRxiv. 2021 doi: 10.1101/2020.07.28.224584. [DOI] [PMC free article] [PubMed] [Google Scholar]
- Murakami S., Kitamura T., Suzuki J., Sato R., Aoi T., Fujii M., Matsugo H., Kamiki H., Ishida H., Takenaka-Uema A., et al. Detection and Characterization of Bat Sarbecovirus Phylogenetically Related to SARS-CoV-2, Japan. Emerg. Infect. Dis. 2020;26:3025–3029. doi: 10.3201/eid2612.203386. [DOI] [PMC free article] [PubMed] [Google Scholar]
- Nakamura T., Yamada K.D., Tomii K., Katoh K. Parallelization of MAFFT for large-scale multiple sequence alignments. Bioinformatics. 2018;34:2490–2492. doi: 10.1093/bioinformatics/bty121. [DOI] [PMC free article] [PubMed] [Google Scholar]
- Olival K.J., Hosseini P.R., Zambrana-Torrelio C., Ross N., Bogich T.L., Daszak P. Host and viral traits predict zoonotic spillover from mammals. Nature. 2017;546:646–650. doi: 10.1038/nature22975. [DOI] [PMC free article] [PubMed] [Google Scholar]
- Pancer K., Milewska A., Owczarek K., Dabrowska A., Kowalski M., Łabaj P.P., Branicki W., Sanak M., Pyrc K. The SARS-CoV-2 ORF10 is not essential in vitro or in vivo in humans. PLoS Pathog. 2020;16:e1008959. doi: 10.1371/journal.ppat.1008959. [DOI] [PMC free article] [PubMed] [Google Scholar]
- Phillips S.J., Anderson R.P., Dudik M., Schapire R.E., Blair M.E. Opening the black box: an open-source release of Maxent. Ecography. 2017;40:887–893. [Google Scholar]
- Sang E.R., Tian Y., Gong Y., Miller L.C., Sang Y. Integrate structural analysis, isoform diversity, and interferon-inductive propensity of ACE2 to predict SARS-CoV2 susceptibility in vertebrates. Heliyon. 2020;6:e04818. doi: 10.1016/j.heliyon.2020.e04818. [DOI] [PMC free article] [PubMed] [Google Scholar]
- Senawi J., Kingston T. Clutter negotiating ability in an ensemble of forest interior bats is driven by body mass. J. Exp. Biol. 2019;222:jeb203950. doi: 10.1242/jeb.203950. [DOI] [PubMed] [Google Scholar]
- Sievers F., Wilm A., Dineen D., Gibson T.J., Karplus K., Li W., Lopez R., McWilliam H., Remmert M., Söding J., et al. Fast, scalable generation of high-quality protein multiple sequence alignments using Clustal Omega. Mol. Syst. Biol. 2011;7:539–544. doi: 10.1038/msb.2011.75. [DOI] [PMC free article] [PubMed] [Google Scholar]
- Stamatakis A. RAxML version 8: a tool for phylogenetic analysis and post-analysis of large phylogenies. Bioinformatics. 2014;30:1312–1313. doi: 10.1093/bioinformatics/btu033. [DOI] [PMC free article] [PubMed] [Google Scholar]
- Su S., Wong G., Shi W., Liu J., Lai A.C.K., Zhou J., Liu W., Bi Y., Gao G.F. Epidemiology, Genetic Recombination, and Pathogenesis of Coronaviruses. Trends Microbiol. 2016;24:490–502. doi: 10.1016/j.tim.2016.03.003. [DOI] [PMC free article] [PubMed] [Google Scholar]
- Wacharapluesadee S., Tan C.W., Maneeorn P., Duengkae P., Zhu F., Joyjinda Y., Kaewpom T., Chia W.N., Ampoot W., Lim B.L., et al. Evidence for SARS-CoV-2 related coronaviruses circulating in bats and pangolins in Southeast Asia. Nat. Commun. 2021;12:972–980. doi: 10.1038/s41467-021-21240-1. [DOI] [PMC free article] [PubMed] [Google Scholar]
- Waterhouse A., Bertoni M., Bienert S., Studer G., Tauriello G., Gumienny R., Heer F.T., de Beer T.A.P., Rempfer C., Bordoli L., et al. SWISS-MODEL: homology modelling of protein structures and complexes. Nucleic Acids Res. 2018;46(W1):W296–W303. doi: 10.1093/nar/gky427. [DOI] [PMC free article] [PubMed] [Google Scholar]
- Wood D.E., Lu J., Langmead B. Improved metagenomic analysis with Kraken 2. Genome Biol. 2019;20:257–269. doi: 10.1186/s13059-019-1891-0. [DOI] [PMC free article] [PubMed] [Google Scholar]
- Wu F., Zhao S., Yu B., Chen Y.M., Wang W., Song Z.G., Hu Y., Tao Z.W., Tian J.H., Pei Y.Y., et al. A new coronavirus associated with human respiratory disease in China. Nature. 2020;579:265–269. doi: 10.1038/s41586-020-2008-3. [DOI] [PMC free article] [PubMed] [Google Scholar]
- Wu L., Chen Q., Liu K., Wang J., Han P., Zhang Y., Hu Y., Meng Y., Pan X., Qiao C., et al. Broad host range of SARS-CoV-2 and the molecular basis for SARS-CoV-2 binding to cat ACE2. Cell Discov. 2020;6:68–79. doi: 10.1038/s41421-020-00210-9. [DOI] [PMC free article] [PubMed] [Google Scholar]
- Xiao K., Zhai J., Feng Y., Zhou N., Zhang X., Zou J.J., Li N., Guo Y., Li X., Shen X., et al. Isolation of SARS-CoV-2-related coronavirus from Malayan pangolins. Nature. 2020;583:286–289. doi: 10.1038/s41586-020-2313-x. [DOI] [PubMed] [Google Scholar]
- Yan H., Jiao H., Liu Q., Zhang Z., Xiong Q., Wang B.J., Wang X., Guo M., Wang L.F., Lan K., et al. ACE2 receptor usage reveals variation in susceptibility to SARS-CoV and SARS-CoV-2 infection among bat species. Nat. Ecol. Evol. 2021;5:600–608. doi: 10.1038/s41559-021-01407-1. [DOI] [PubMed] [Google Scholar]
- Ye Z.W., Yuan S., Yuen K.S., Fung S.Y., Chan C.P., Jin D.Y. Zoonotic origins of human coronaviruses. Int. J. Biol. Sci. 2020;16:1686–1697. doi: 10.7150/ijbs.45472. [DOI] [PMC free article] [PubMed] [Google Scholar]
- Zhou P., Fan H., Lan T., Yang X.L., Shi W.F., Zhang W., Zhu Y., Zhang Y.W., Xie Q.M., Mani S., et al. Fatal swine acute diarrhoea syndrome caused by an HKU2-related coronavirus of bat origin. Nature. 2018;556:255–258. doi: 10.1038/s41586-018-0010-9. [DOI] [PMC free article] [PubMed] [Google Scholar]
- Zhou H., Chen X., Hu T., Li J., Song H., Liu Y., Wang P., Liu D., Yang J., Holmes E.C., et al. A Novel Bat Coronavirus Closely Related to SARS-CoV-2 Contains Natural Insertions at the S1/S2 Cleavage Site of the Spike Protein. Curr. Biol. 2020;30:2196–2203.e3. doi: 10.1016/j.cub.2020.05.023. [DOI] [PMC free article] [PubMed] [Google Scholar]
- Zhou P., Yang X.L., Wang X.G., Hu B., Zhang L., Zhang W., Si H.R., Zhu Y., Li B., Huang C.L., et al. A pneumonia outbreak associated with a new coronavirus of probable bat origin. Nature. 2020;579:270–273. doi: 10.1038/s41586-020-2012-7. [DOI] [PMC free article] [PubMed] [Google Scholar]
- Zhu N., Zhang D., Wang W., Li X., Yang B., Song J., Zhao X., Huang B., Shi W., Lu R., et al. China Novel Coronavirus Investigating and Research Team A Novel Coronavirus from Patients with Pneumonia in China, 2019. N. Engl. J. Med. 2020;382:727–733. doi: 10.1056/NEJMoa2001017. [DOI] [PMC free article] [PubMed] [Google Scholar]
Associated Data
This section collects any data citations, data availability statements, or supplementary materials included in this article.
Supplementary Materials
Table S1. Summary of the number of individual bats and samples collected in the present study and the libraries used for next generation sequencing. Related to Figure 1. Table S2. Coronavirus and SARS-CoV-2 related sequence detection. Related to Figure S1 and the “Genome assembly and annotation” section of the STAR Methods. Table S3. Coronavirus genome assembly and taxonomy. Related to Figures 3 and 5. Table S4. Primers used for the detection and amplification of the S gene, and 5′ and 3′ terminal sequences of the four SARS-CoV-2 related genomes. Related to Figure 1 and the “Sanger sequencing” section of the STAR Methods. Table S6. Data resources for ecological modeling of the distribution of 49 Rhinolophus species in Asia. Related to Figures 6 and S5.
Data Availability Statement
The raw reads generated from the 19 libraries in this study have been deposited in the NCBI Sequence Read Archive (SRA) database under the BioProject accession number PRJNA707649 (SRA accession numbers: SRR14381416-SRR14381434). The genome sequences of the seven betacoronavirus and 17 alphacoronavirus generated in this study have also been deposited in the GenBank and assigned accession numbers MZ081376-MZ081399. The seven betacoronavirus genomes are also available from GISAID with accession numbers EPI_ISL_1699443-EPI_ISL_1699449. Sequence data can also be downloaded from the China National Microbiological Data Center (bioproject accession number: NMDC10017765, MSRA accession numbers: NMDC40004798- NMDC40004821 and sequence accession numbers: NMDC60018441- NMDC60018464). Additional Supplemental Items are also available at Mendeley Data: https://doi.org/10.17632/txkvffh2sm.1.