

Abstract
Melanoma is the most aggressive type of skin cancer and a relevant health problem due to its poor treatment response with high morbidity and mortality rates. This study, aimed to investigate the tissue changes of an improved photodynamic therapy (PDT) response when combined with optical clearing agent (OCA) in the treatment of cutaneous melanoma in mice. Photodithazine (PDZ) was administered intraperitoneally and a solution of OCA was topically applied before PDT irradiation. Due to a resultant refractive index matching, OCA-treated tumors are more optically homogenous, improving the PDT response. Raman analysis revealed, when combined with OCA, the PDT response was more homogenous down to 725 µm-depth in thickness.
1. Introduction
Melanoma is a pigmented tumor that originates from the melanocytes. According to the National Cancer Database (NCDB-US) the most prevalent type of melanoma is the cutaneous form (91.2%), followed by ocular, mucosal and other tissues [1]. Cutaneous melanoma is the most aggressive type of skin cancer. It is characterized by pigmented lesions with a high rate of tissue invasion and metastasis [2]. It accounts for about 80% to 85% of all skin cancer-related deaths [3].
The main therapy approach for cutaneous melanoma is surgery, with wide excision of the cutaneous lesion, lymphatic mapping, sentinel lymph node biopsy and lymph node dissection [4,5]. The width of the surgical excision of melanoma is related to the Breslow index, a thickness tumor measurement, indicating the depth of the melanoma from the skin surface down through to its deepest point. The present recommendations for definitive wide local excision of primary cutaneous melanoma are melanoma in situ: 5-10 mm margins, invasive melanoma (pT1) ≤ 1.0 mm thick: 1 cm margins, invasive melanoma (pT2) 1.01-2.00 mm thick: 1-2 cm margins, invasive melanoma (pT3) 2.01-4.00 mm thick: 1-2 cm margins and invasive melanoma (pT4) > 4.0 mm thick: 2 cm margins [6–8]. A typical Breslow index (thickness) of melanomas, when diagnosed by dermatologists, varies slightly, with the majority being diagnosed with <1 mm of thickness and with a high chance of cure (70%), but there are cases where melanoma is diagnosed with a thickness > 1 mm with poor survival rates [9]. Adjuvant immunotherapy, palliative chemotherapy, and radiotherapy are also used, but they have limited effect on patients’ life expectancy [10–12]. Because of the lack of effective therapeutic options and the increased incidence of melanoma, the development of new non-invasive diagnostic techniques, as well as of novel treatments is required.
Photodynamic therapy (PDT) is based on the interaction between light and photosensitizer (PS), in the presence of molecular oxygen, to induce cell death. PDT has been widely used for localized treatment of several types of cancer, such as cervical [13], esophageal [14], stomach [15,16], bladder [15,17], and nonmelanoma skin [18–20]. PDT clinical trials in basal cell carcinoma (BCC) show a complete response rate around 85% [18–21]. More recently, this success rate has been approaching 93% in a single visit PDT protocol for superficial and nodular BCC lesions [22]. For cutaneous melanoma, the few reported clinical trials have shown that PDT reduces the volume of the lesion but does not eliminate it, due to its significant resistance [23–27].
The main limitation of PDT for melanoma treatment is related to the high light absorption of melanin (the pigment produced by melanosomes) at the visible range of the electromagnetic spectrum. Melanin accumulates within cells in different sized granules, which implies not only in light absorption but also results in high light scattering. These characteristics limit the propagation of light in depth, restricting any optical technique to the most superficial layers of the tumor [23,28]. Additionally, melanin presents an antioxidative effect [29], and the melanoma cells show an effective mechanism for drug efflux [30–32], both characteristics that reduce the PDT response.
One approach to increase PDT response would be to change the optical characteristics of melanoma, improving light distribution within the lesion, mostly its penetration in depth. One strategy to achieve this is by using optical clearing agent (OCA). These coumpounds are non-toxic hyperosmotic agents such as glycerol, polyethylene glycol 400 (PEG-400), sucrose, dimethyl sulfoxide (DMSO), and others with a similar refractive index of the skin one, around 1.4 [33–35]. These agents also promote local osmotic dehydration that occurs as a result of water exiting the cell more rapidly than the OCA enter after application [34]. Consequently, water is extracted from the cells and/or collagen fibers. These processes provide an additional effect of matching the refractive index of skin with OCA due to the reduction of the water content in the interstitial space, in addition to reducing the overall thickness of the tissue and making it denser. Thus, when applied to the skin, it effectively decreases the high light scattering caused by tissue microinterfaces and increases the tissue-light penetration [33–36].
Our research group pioneered the association between OCA and PDT. In that study, full-depth eradication of pigmented melanoma was achieved when the OCA was combined with the dual-photosensitizer PDT [37]. However, the mechanisms involved in the improved response are still not completely elucidated. Previous results showed that topical application of OCA reduces the light scattering at the cutaneous melanoma model increasing the light penetration in depth which was demonstrated by diffuse reflectance spectroscopy and optical coherence tomography (OCT) [38]. In this study we aimed to investigate i) the OCA effect in the PDT immediate and mediate response, and ii) if there is any biochemical change in the tumor treated with subdose PDT, with or without OCA.
2. Materials and methods
2.1. Cell line and animal model
B16F10 murine melanoma cells were purchased from the American Type Cell Collection (ATCC) and were cultured in Dulbecco's Modified Eagle Medium (DMEM) with 10% fetal bovine serum and 1% penicillin-streptomycin maintained at 37 °C in an incubator with 5% CO2. For the cutaneous animal model, one million cells were intradermally injected in the flanks of 6-week old BALB/c nude mice. All animal procedures were approved by the Ethics Committee for Animal Use of the São Carlos Institute of Physics (IFSC, from the University of São Paulo, São Carlos, SP-Brazil), document number 5500080618. The animals were examined daily for lethargy, abnormal posture, weight-loss and tumor volume, being euthanized if necessary.
2.2. Optical clearing agents
Our group has previously investigated [39] the optical clearing effect on skin and melanoma of several OCA mixtures such as glycerol at different concentrations and mixing solutions of PEG-400 and 1,2-propanediol at the investigated animal model. The mixture between PEG-400 and 1,2-propanediol in the ratio of 19:1, respectively, presented the best results and was chosen for use in all the present PDT experiments. They were acquired from the company Sigma-Aldrich.
2.3. Photodynamic therapy
The animals were anesthetized with inhaled isoflurane 5% for induction and 2% for maintenance. When the pigmented melanoma lesions achieved 1 mm in diamenter, chlorin e6 (Photodithazine, VETAGRAND Company, Russia) was injected intraperitoneally at a dose of 9.0 mg/kg. The drug-light interval was 2 h 30 min, as determined in a preliminary study of Photodithazine concentration at the melanoma lesion. OCA were applied topically (approximately 300 µL) 15 minutes before the irradiation with a gentle massage to improve its penetration through the skin. PDT irradiation was performed using a 660 nm diode laser, delivering a total fluence of 100 J/cm2 in 17 minutes.
During PDT irradiation, an aluminum foil mask was used to avoid illumination of adjacent normal tissues. Four experimental groups (N=3) were assessed: i) control (no OCA and no PDT), ii) tumor with OCA only, iii) tumor with PDT only and iv) tumor with PDT + OCA. Using a USB2000 spectrophotometer (Ocean Optics, USA), the presence of PDZ and its relative concentration in the tumor was monitored by laser-induced fluorescence spectroscopy before and after the treatment with excitation at 532 nm (see Fig. S1). Mice cohorts were sacrificed immediately and at 7days-post-PDT and the tumor was removed for ex vivo analysis. The tumors were embedded in Tissue Tek Optimal Cutting-Temperature media (Sakura Finetek, Torrance, Canada) and frozen in liquid nitrogen for cryosection. Longitudinal cuts were prepared for analysis of the skin and tumor overall profile (top to bottom).
2.4. Raman microspectroscopy
Raman spectra of the 60 µm-thick cryosections were measured using a confocal Raman microscope (WITec Alpha 300 RAS, Ulm, Germany) with excitation wavelength at 785 nm and the detection range at 100–3200 cm−1. The approximate diameter of the laser beam at the focus point is 0.65 µm. The spectra were collected with a 20x objective lens (Zeiss, Jena, Germany) with an integration time of 30 s and 3 accumulations for each spectrum (see Fig. S2). The duration of the Raman measurement for each sample was around 2 h, and since the tumor samples were cut through cryosectioning protocol, minimal biochemical changes are expected to occur during this analysis period. Three spectra were acquired for each depth within the tumor; measurements were taken between 25 and 2000µm, at 100 µm steps (Fig. 1). The data were processed using the Project-FOUR-4.1 (WITec, Ulm, Germany) and Origin (OriginLab Corporation, Northampton, Massachusetts, USA) softwares.
Fig. 1.
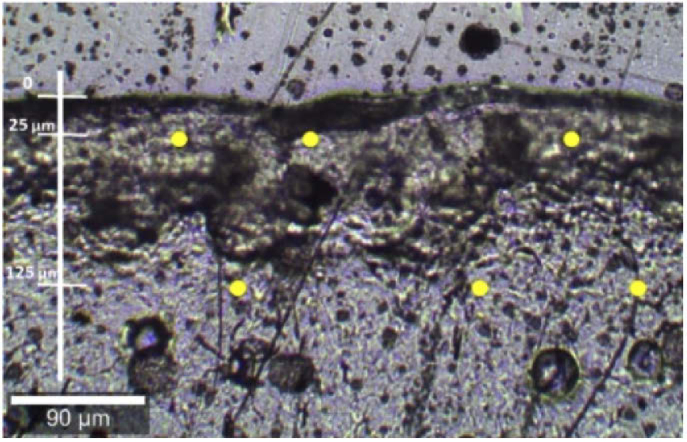
Bright-field image of the tumor slide at the Raman confocal microscope. The spectra were reproduced in triplicate, at 3 different points at the same depth (yellow dots). The first measurement was at 25 µm, with increments of 100 µm, down to a 2000 µm-depth.
3. Results and discussion
3.1. Raman analysis of tumors with and without OCAs
There is still no complete knowledge of the action of skin-clearing agents in vivo nor in melanoma. For this reason, it was initially investigated if it was possible to detect OCA-induced modifications through Raman signal, and if so, to track the depth achieved by OCA in the tissue. Figure 2 shows the Raman spectrum of the used clearing agent mixture of PEG-400 and 1,2-propanediol, which is in agreement with the ones reported in the literature [40].
Fig. 2.
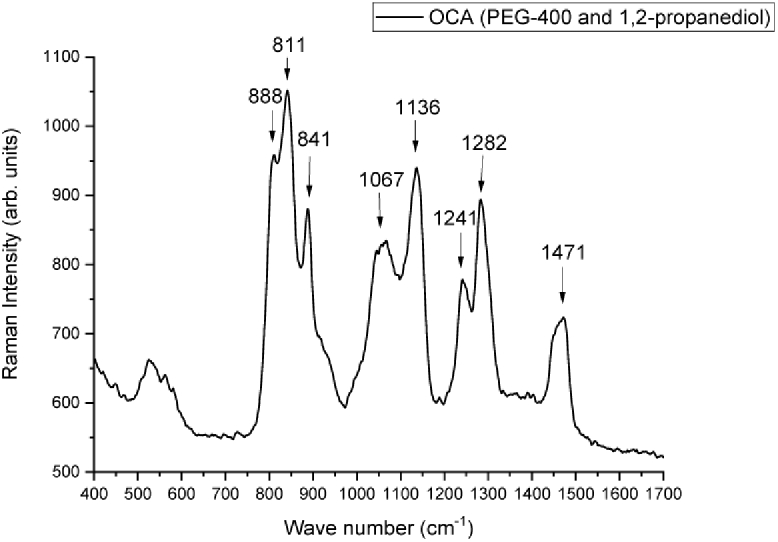
Raman spectrum of optical clearing agents (PEG-400 and 1,2-propanediol).
Raman spectra from melanoma tumor slides with and without OCA treatment were recorded. Three main regions of the tumor were chosen for Raman analysis: 25-125 µm considering the most superficial region of the melanoma; 225-325 µm for the central region of the tumor and 525-725 µm for the deepest and internal region of the tumor. This choice was made in order to verify to what depth the OCA could permeate through the tumor, as well as to what depth the agents would cause biochemical changes to the melanoma.
Examples of the spectra obtained at different depths of the melanoma with and without OCA are presented in Fig. 3. The Raman peaks of OCA are in the same region as the spectrum of the tumor tissue with some peaks overlapping the same wavenumbers. Therefore, it was not possible to directly observe the OCA Raman peaks at the OCA-treated melanoma, neither a clear modification of the melanoma Raman spectrum after the OCA treatment (Fig. 3).
Fig. 3.

Raman spectra of melanoma at different depths: 25-125 µm, 225-325 µm, and 525-725 µm after OCA application compared to the melanoma without OCA topical application.
In general, the Raman spectra from tissues show noisy patterns and bands with low signal amplitude, instead of sharp clearly defined. The most characteristic peaks of both the control and the tumor with OCA for the most superficial region (25-125 µm) are presented in Table 1. In the spectrum of normal skin, the most characteristic peaks referred mainly to actin, collagen, and elastin are 857, 939, 1004, 1248, 1271, and 1452 cm−1 [32]. There are also related peaks in the region of 400 to 1000 cm−1, but with low amplitudes. The 1270-1300 cm−1 band and the peak 1452 cm−1 can be attributed to the saturated fatty acid of the epidermis ceramides and the cell membrane phospholipids [32]. Other peaks of unsaturated lipids appear as 1092,1271,1301,1452 and 1658 cm−1 [32]. Comparing the spectra of normal skin and melanoma, it is possible to infer that some peaks in the region of 800-1000 cm−1 and 1200- 1400 cm−1 are slightly shifted, with different intensities [32,41]. The melanoma peaks are more similar to the normal skin in the most superficial region. Stremersch et al. [42] obtained Raman spectra using surface enhanced Raman spectroscopy (SERS) of B16-F10 melanoma cells, with gold nanoparticles. Brauchle et al. [43] used Raman Spectroscopy to distinguish different types of melanoma cells from melanocytes. Both in the Stremersch and Brauchle studies, the spectra of melanoma cells showed similar peaks better defined in 780, 980, 1000, 1050, and 1236 cm−1 in the studies with nanoparticles [42,43]. The tumor Raman spectra in our experiments, on the other hand, present the peaks previously mentioned, but with the presence of noise, since no enhancement was used, and because there is a great variety of molecules present in the tumor that contribute to the Raman signal. The resulting signal collected is composed of all biomolecules present in the tissue (cells and extracellular matrix), in addition to the light-tissue interactions being much more complex when compared than those occurring in cells or solutions.
Table 1. Raman peaks and their referenced band assignments for 25-125 µm, 225-325 µm and 525-725 µm.
| Raman peaks (cm−1) | Band assignments | Depth µm | ||
|---|---|---|---|---|
| 25-125 | 225-325 | 525-725 | ||
| 488 | Glycogen polysaccharide [42,44] | + | ||
| 728 | C-C bond of collagen proline and the amino acid alanine [43,44] | + | + | |
| 780 | Breathing modes of the base rings in the DNA / RNA [43,44] | + | ||
| 850-854 | Single-link stretch vibrations of amino acids, and polysaccharides; tyrosine and the breathing of its ring (proteins); stretch C-C of the proline ring; (C-O-C) skeletal mode of anomers [44] | + | + | + |
| 928 | C-C bond of amino acids such as proline and valine [44] | + | ||
| 1000-1004 | Phenylalanine bonds. At 1004 cm-1 is the C-C bond in the ring, mainly collagen [43–46] | + | + | + |
| 1031 | Phenylalanine C-H bond; collagen residues; C-N binding of proteins [44] | + | + | |
| 1032 | Collagen and phospholipid CH2CH3 bonds [42–44] | + | ||
| 1083 | C-N binding of proteins and lipids [44] | + | + | |
| 1100 | C-C bonds of lipids and fatty acids [44] | + | ||
| 1124 | C-C bonds of lipids and fatty acids [42,44] | + | ||
| 1206 | Hydroxyproline and tyrosine [44] | + | ||
| 1224 | β sheet amide III [44,47] | + | ||
| 1236 | Amide III [47] | + | ||
| 1241 | Asymmetric phosphate PO2 originated from the nucleic acid phosphodiester groups in malignant tissues [44,47] | + | ||
| 1250 | Amide III ((β-sheet and random coil conformations); guanine and cytosine (NH2) [44,46,47] | + | ||
| 1261 | Amide III and lipid CH2 binding [44,47] | + | ||
| 1296 | CH2 strain [44] | + | + | |
| 1298 | Deformation and twist of the lipid CH2 bond [43,44,47] | + | ||
| 1443 | CH2 deformation of lipids and proteins; triglycerides (fatty acids) and cholesterol [42,44,47] | + | + | |
The highest change after OCA addition occurred in the 850-1130 cm−1 region, where the Raman peaks of the C-C backbone of proteins and lipids are located [44], indicating that the vibrations of the protein and lipid skeleton and the conformation of proteins (collagen) are among the most affected by the optical clearing.
In the region of the tumor between 225 and 325 µm (Fig. 2), several Raman peaks also changed their amplitudes in the presence of OCA. No clear distinction was observed when comparing the intensities of the same peaks of tumor with and without OCA. The differences in intensities between the peaks occur in proteins, lipids, and nucleic acids (according to Table 1 references) and may be due to conformational changes in collagen, with the number of alpha-helices being changed and the proportion of beta-sheet and random coil conformations as well [48]. The OCA appears to cause dissociation of collagen fibrils into microfibrils, thus changing the packaging of collagen in the tumor [35,36,49]. Collagen fibers are complex and highly scattering structures, and the main bonding force that unites triple helices is hydrogen bonds [35,49]. OCA, which have several hydroxyl groups, destabilize the ordered structure of the fibers, dissociating them, but this can be easily reversible because the interactions are non-covalent bonds between the fibers [35]. Yeh et al. observed this fact in an in vitro experiment immersing a tissue in glycerol and later in phosphate-buffered saline (PBS) [50]. R. Millon et al. also studied the effect of some OCA like PBS and DMSO in vivo on a squamous epithelium [34]. Because OCA dehydrate the tissue, there is an increase in the osmolarity of the interstitial fluid, causing the water to escape from the cells and collagen fibers. This results in a decrease of tissue thickness, leading to a denser tissue with more orderly architecture [33,35,36,49]. Sdobnov et al. [51] performed a quantitative analysis of the ratio of the collagen Raman peaks intensity after the application of two types of OCA, glycerol, and iohexol (Omnipaque). The authors observed that the intensity of the peaks increased with the application of both agents to the pig skin dermis, which may result from a more compact structure of collagen fibers [51]. Nguyen et al. used Raman spectroscopy to verify the behavior of collagen with water, differentiating the age of the skin [52]. It was verified that there is a variation in the Raman signal, mainly due to the difference in intensity of some peaks related to the hydration marking of the biological sample [52,53]. Therefore, it is expected that the application of OCA in tumors will generate a change in the Raman signal of collagen.
Finally, in the region between 525 µm and 725 µm (Fig. 3), other peaks, that were not previously seen nor identified presented greater intensity. They correspond to proline, tyrosine and valine amino acids, amide III, proteins, lipids, and phosphate from nucleic acids [43–47].
Deeper than 725 µm, the spectra of the tumor with OCA showed little difference between the tumors with and without OCA. Since the difference between spectra is insignificant, this may indicate that the clearing agents did not penetrate above this depth and had little or no effect in the tumor and, consequently, on the light penetration. Yanina et al. [54] investigated different concentrations of glycerol solutions as OCA in an ex vivo model of pig skin. Maximum penetration, evaluated by confocal Raman microspectroscopy, down to the depth of 80 µm was achieved with a 60% glycerol and 40% water for 45 min of application. Sdobnov and collaborators [55] reported the increased depth Raman spectral changes of the hydrogen bound water, at the ex vivo porcine skin, with increased OCA treatment time, both for glycerol and Omnipaque clearing solutions. Our results are in agreement with these reported results on the decrease of light attenuation effect of the OCAs in skin, even though a direct comparison of the at-depth response is not possible, since distinct OCA compositions were used; and ex vivo and in vivo skin presents different OCA diffusion patterns. Lin et al. [56] compared the optical clearing effect of 3 different agents (glycerol, iohexol and polyethylene glycol) and serial concentrations at in vivo human skin. They report that the three investigated agents enhanced the optical clearing effect on skin, and that the dehydration mechanism, which occurs at the initial treatment period between 10-20 min, reduces the OC. In our in vivo cutaneous melanoma model, we have indirectly observed the enhanced optical clearing through the improved PDT response. This result is in agreement with our previous study where we investigated the use of OCA using optical coherence tomography at the same cutaneous melanoma model. Using the OCA previous to the OCT resulted in improved imaging up to 750 µm [38].
To check if it was possible to determine the maximum penetration depth of OCA in melanoma, a mathematical analysis of the spectra taken from melanoma slides with and without previous OCA treatment was performed. First, normalization was performed at the wavenumber of the highest amplitude of all spectra. Melanoma spectrum obtained from the most superficial region of the tumor (25-125 µm) was summed to the OCA spectrum. Each final spectrum was then compared with the spectrum taken at melanoma treated with the OCA. It was analyzed which peaks increased their intensities and whether it was possible to verify the presence of OCA by Raman spectroscopy. It was observed that some peaks, such as 850, 1082, and 1240 cm−1 showed higher intensities, probably due to OCA presence. The main region of increased amplitude was over 1003 cm−1, in which the peaks are more pronounced than in the melanoma without OCA. Even though these changes could be observed at the comparison between the processed spectra and the spectra from melanoma with OCA, they were not evident enough to directly detect the presence of OCA, mainly because melanoma itself already shows Raman peaks at the same region.
3.2. Raman analysis of tumors with and without OCAs right after PDT
Representative spectra (Fig. 4) taken at the melanoma lesion at different depths after PDT treatment with and without OCA.
Fig. 4.

Raman spectra of the 25-125 µm, 225-325 µm, and 525-725 µm regions of PDT-treated melanoma lesions with and without OCA. For the 525-725 µm region, two spectra are presented for the PDT group due to the dual behavior of the observed response: one with a more similar spectrum comparing to the ones collected at the superficial regions, while the other, similar to a non-treated tumor.
At the more superficial region (25-125 µm), there was no difference in the spectra of tumors treated with PDT and with and without OCA topical application (Fig. 4). The spectra taken at this depth were similar within the same treatment group and also inter-groups, highly noisy and with a relevant decrease in the Raman signal when compared to the non-treated melanoma. This is probably a result of PDT destruction of the biomolecules and tumor structure in this region. Similar results between the groups can be explained by the fact that at the superficial layers of the tumor, no relevant light attenuation is observed, resulting in a homogenous PDT effect within this tumor volume and no changes in the response are observed with the OCA combination.
When evaluating the region between 225 µm and 325 µm (Fig. 4), the spectra from tumors treated only with PDT or PDT + OCA showed mostly changes in the intensity profile, no new Raman peaks nor relevant displacements were present. It is possible to observe that all the peaks showed their intensity decreased when the OCA was applied before PDT. The spectrum from the PDT group without OCA is more similar to the ones measured from non-treated tumors. The PDT + OCA spectrum is similar to the spectra collected at the most superficial part of the tumor. Based on these results, there is an indication that the OCA use has minimized the effect of light attenuation at the melanoma depth of 225-325 µm, resulting in a more effective PDT response similar to the superficial tumor region.
The spectra from the region between 525 µm and 725 µm (Fig. 4) of the PDT group, showed a dual behavior where there were spectra similar to the spectrum of a non-treated tumor and a tumor showing PDT response. On the other hand, the spectra from the PDT + OCA group at this depth were similar to the ones measured at the superficial region, i.e. with the PDT response. The variation in the shape of the spectra is due to the tumor heterogeneity, but also the heterogeneity of the photodynamic response at greater depths. Heterogeneous PDT response within the tumor means that non-treated regions with viable melanoma may result in tumor regrowth.
More similar spectra after PDT + OCA treatment at the studied depths down to 750 µm are indicative that a more homogeneous and effective PDT response was achieved. We hypothesize that the OCA, by improving the refractive index matching resulted and making tumors more optically homogeneous, lead to a more effective photodynamic response. This is a relevant result since the heterogeneity of tumor irradiation is one of the most important reasons that result in treatment failed, since islands of tumor cells remain viable. Based on these results, we hypothesize that OCA would also be beneficial to other pigmented lesions, as pigmented basal cell carcinoma, and also to thicker tumors, the last case, if other delivery methods are developed to increase OCA depth distribution.
3.3. Raman analysis of tumors with and without OCAs 7 days after PDT
In order to evaluate if the addition of the OCA to the subdose PDT treatment would result in a modified tumor regrowth, Raman spectra were also recorded at 7 days post-PDT. Figure 5 shows Raman spectra recorded from these regrown melanomas. No relevant changes were observed in the spectra from different depths and treated groups when compared to the non-treated tumors. In this sense, when a partial response is achieved after OCA are used in combination with PDT, which was planned for this study, the resulted regrown tumor did not show biochemical changes evident by Raman spectroscopy. This behavior should be also investigated by other methods such as immunohistochemistry and longer follow up period, but Raman spectroscopy provides a preliminary indicative.
Fig. 5.

Raman spectra of the 25-125 µm, 225-325 µm and 525-725 µm regions of melanoma with and without OCA 7 days after PDT-treatment.
4. Conclusions
PDT shows a limited effect on pigmented lesions, since it highly relies on a homogenous light distribution within the tumor to result in an effective response. Cutaneous melanoma commonly shows heterogenous micro-regional tissue characteristics, and, consequently, heterogeneous optical properties. In the present study, we evaluated the melanoma changes after the treatment of OCA and PDT. The main biochemical changes detected through Raman spectroscopy in the treated tumor were in proteins, lipids and nucleic acids. Due to the refractive index matching, light penetration and distribution was increased in the OCA-treated tumors. OCA topical application before tumor irradiation resulted in more homogenous, deeper and improved PDT treatment down to 750 µm in cutaneous pigmented melanoma.
Funding
Conselho Nacional de Desenvolvimento Científico e Tecnológico10.13039/501100003593 (131695/2018-5, 305795/2016-3, 465360/2014-9); Fundação de Amparo à Pesquisa do Estado de São Paulo10.13039/501100001807 (2013/07276-1, 2014/50857-8).
Disclosures
The authors declare that there are no conflicts of interest related to this article.
See Supplement 1 (1MB, pdf) for supporting content.
References
- 1.Chang A. E., Karnell L. H., Menck H. R., “The National Cancer Data Base Report on Cutaneous and Noncutaneous Melanoma,” Cancer 83(8), 1664–1678 (1998). [DOI] [PubMed] [Google Scholar]
- 2.Aladowicz E., Ferro L., Vitali G. C., Venditti E., Fornasari L., Lanfrancone L., “Molecular networks in melanoma invasion and metastasis,” Futur. Oncol. 9(5), 713–726 (2013). 10.2217/fon.13.9 [DOI] [PubMed] [Google Scholar]
- 3.Pinheiro A. M. C., Friedman H., Cabral A. L. S. V., Rodrigues H. A., “Melanoma cutâneo: características clínicas, epidemiológicas e histopatológicas no Hospital Universitário de Brasília entre janeiro de 1994 e abril de 1999,” An. Bras. Dermatol. 78(2), 179–186 (2003). 10.1590/S0365-05962003000200005 [DOI] [Google Scholar]
- 4.Zalaudek I., Ferrara G., Argenziano G., Ruocco V., Soyer H. P., “Diagnosis and treatment of cutaneous melanoma: a practical guide,” SKINmed: Dermatology for the Clinician 2(1), 20–33 (2003). 10.1111/j.1540-9740.2003.01761.x [DOI] [PubMed] [Google Scholar]
- 5.Eggermont A. M. M., Spatz A., Robert C., “Cutaneous melanoma,” in The Lancet (Lancet Publishing Group, 2014), 383(9919), pp. 816–827. [DOI] [PubMed] [Google Scholar]
- 6.Breslow A., “Thickness, Cross-Sectional Areas and Depth of Invasion in the Prognosis of Cutaneous Melanoma,” Ann. Surg. 172(5), 902–908 (1970). 10.1097/00000658-197011000-00017 [DOI] [PMC free article] [PubMed] [Google Scholar]
- 7.Marine A., Walter B., Non-Invasive Determination of Breslow Index (Intech, n.d.). [Google Scholar]
- 8.Sladden M. J., Nieweg O. E., Howle J., Coventry B. J., Thompson J. F., “Updated evidence-based clinical practice guidelines for the diagnosis and management of melanoma: Definitive excision margins for primary cutaneous melanoma,” Med. J. Aust. 208(3), 137–142 (2018). 10.5694/mja17.00278 [DOI] [PubMed] [Google Scholar]
- 9.Berwick M., Erdei E., Hay J., “Melanoma Epidemiology and Public Health,” Dermatol. Clin. 27(2), 205–214 (2009). 10.1016/j.det.2008.12.002 [DOI] [PMC free article] [PubMed] [Google Scholar]
- 10.Sullivan R. J., Atkins M. B., Kirkwood J. M., Agarwala S. S., Clark J. I., Ernstoff M. S., Fecher L., Gajewski T. F., Gastman B., Lawson D. H., Lutzky J., McDermott D. F., Margolin K. A., Mehnert J. M., Pavlick A. C., Richards J. M., Rubin K. M., Sharfman W., Silverstein S., Slingluff C. L., Sondak V. K., Tarhini A. A., Thompson J. A., Urba W. J., White R. L., Whitman E. D., Hodi F. S., Kaufman H. L., “An update on the Society for Immunotherapy of Cancer consensus statement on tumor immunotherapy for the treatment of cutaneous melanoma: Version 2.0,” J. Immunother. Cancer 6(1), 44 (2018). 10.1186/s40425-018-0362-6 [DOI] [PMC free article] [PubMed] [Google Scholar]
- 11.Eggermont A. M. M., Testori A., Maio M., Robert C., “AntiCTLA-4 antibody adjuvant therapy in melanoma,” Semin. Oncol. 37(5), 455–459 (2010). 10.1053/j.seminoncol.2010.09.009 [DOI] [PubMed] [Google Scholar]
- 12.Di Giacomo A. M., Danielli R., Guidoboni M., Calabrò L., Carlucci D., Miracco C., Volterrani L., Mazzei M. A., Biagioli M., Altomonte M., Maio M., “Therapeutic efficacy of ipilimumab, an anti-CTLA-4 monoclonal antibody, in patients with metastatic melanoma unresponsive to prior systemic treatments: Clinical and immunological evidence from three patient cases,” Cancer Immunol. Immunother. 58(8), 1297–1306 (2009). 10.1007/s00262-008-0642-y [DOI] [PMC free article] [PubMed] [Google Scholar]
- 13.Brown S. B., Brown E. A., Walker I., “The present and future role of photodynamic therapy in cancer treatment,” Lancet Oncol. 5(8), 497–508 (2004). 10.1016/S1470-2045(04)01529-3 [DOI] [PubMed] [Google Scholar]
- 14.Moghissi K., Dixon K., “Photodynamic therapy (PDT) in esophageal cancer: A surgical view of its indications based on 14 years experience,” Technol. Cancer Res. Treat. 2(4), 319–326 (2003). 10.1177/153303460300200406 [DOI] [PubMed] [Google Scholar]
- 15.Agostinis P., Berg K., Cengel K. A., Foster T. H., Girotti A. W., Gollnick S. O., Hahn S. M., Hamblin M. R., Juzeniene A., Kessel D., Korbelik M., Moan J., Mroz P., Nowis D., Piette J., Wilson B. C., Golab J., “Photodynamic therapy of cancer: An update,” CA. Cancer J. Clin. 61(4), 250–281 (2011). 10.3322/caac.20114 [DOI] [PMC free article] [PubMed] [Google Scholar]
- 16.Hayata Y., Kato H., Okitsu H., Kawaguchi M., Konaka C., “Photodynamic therapy with hematoporphyrin derivative in cancer of the upper gastrointestinal tract,” Semin. Surg. Oncol. 1(1), 1–11 (1985). 10.1002/ssu.2980010103 [DOI] [PubMed] [Google Scholar]
- 17.Shumaker’ B. P., Hetzel F. W., “Clinical laser Photodynamic Therapy in the Treatment of Bladder Carcinoma,” Photochem. Photobiol. 46(5), 899–901 (1987). 10.1111/j.1751-1097.1987.tb04866.x [DOI] [PubMed] [Google Scholar]
- 18.Dougherty T. J., Gomer C. J., Henderson B. W., Jori G., Kessel D., Korbelik M., Moan J., Peng Q., “Photodynamic Therapy,” J. Natl. Cancer Inst. 90(12), 889–905 (1998). 10.1093/jnci/90.12.889 [DOI] [PMC free article] [PubMed] [Google Scholar]
- 19.Felsher D. W., “Cancer revoked: oncogenes as therapeutic targets,” Nat. Rev. Cancer 3(5), 375–379 (2003). 10.1038/nrc1070 [DOI] [PubMed] [Google Scholar]
- 20.Ramirez D. P., Kurachi C., Inada N. M., Moriyama L. T., Salvio A. G., Vollet Filho J. D., Pires L., Buzzá H. H., de Andrade C. T., Greco C., Bagnato V. S., “Experience and BCC subtypes as determinants of MAL-PDT response: Preliminary results of a national Brazilian project,” Photodiagn. Photodyn. Ther. 11(1), 22–26 (2014). 10.1016/j.pdpdt.2013.11.001 [DOI] [PubMed] [Google Scholar]
- 21.Calin M. A., Parasca S. V., “Photodynamic therapy in oncology,” in Journal of Optoelectronics and Advanced Materials (National Institute of Optoelectronics, 2006), 8(3), pp. 1173–1179. [Google Scholar]
- 22.Ramirez D. P., Moriyama L. T., de Oliveira E. R., Inada N. M., Bagnato V. S., Kurachi C., Salvio A. G., “Single visit PDT for basal cell carcinoma – A new therapeutic protocol,” Photodiagn. Photodyn. Ther. 26, 375–382 (2019). 10.1016/j.pdpdt.2019.04.016 [DOI] [PubMed] [Google Scholar]
- 23.Mroz P., Huang Y., Szokalska A., Zhiyentayev T., Janjua S., Nifli A., Sherwood M. E., Ruzié C., Borbas K. E., Fan D., Krayer M., Balasubramanian T., Yang E., Kee H. L., Kirmaier C., Diers J. R., Bocian D. F., Holten D., Lindsey J. S., Hamblin M. R., “Stable synthetic bacteriochlorins overcome the resistance of melanoma to photodynamic therapy,” FASEB J. 24(9), 3160–3170 (2010). 10.1096/fj.09-152587 [DOI] [PMC free article] [PubMed] [Google Scholar]
- 24.Pucelik B., Arnaut L. G., Stochel G., Dabrowski J. M., “Design of Pluronic-Based Formulation for Enhanced Redaporfin-Photodynamic Therapy against Pigmented Melanoma,” ACS Appl. Mater. Interfaces 8(34), 22039–22055 (2016). 10.1021/acsami.6b07031 [DOI] [PubMed] [Google Scholar]
- 25.Wagner M., Suarez E. R., Theodoro T. R., Machado Filho C. D. A. S., Gama M. F. M., Tardivo J. P., Paschoal F. M., Pinhal M. A. S., “Methylene blue photodynamic therapy in malignant melanoma decreases expression of proliferating cell nuclear antigen and heparanases,” Clin. Exp. Dermatol. 37(5), 527–533 (2012). 10.1111/j.1365-2230.2011.04291.x [DOI] [PubMed] [Google Scholar]
- 26.Tardivo J. P., Del Giglio A., Paschoal L. H. C., Ito A. S., Baptista M. S., “Treatment of melanoma lesions using methylene blue and RL50 light source,” Photodiagn. Photodyn. Ther. 1(4), 345–346 (2004). 10.1016/S1572-1000(05)00005-0 [DOI] [PubMed] [Google Scholar]
- 27.Baldea I., Filip A., “Photodynamic Therapy in Melanoma-An Update,” Journal of Physiology and Pharmacology. 63(2), 109 (2012). [PubMed] [Google Scholar]
- 28.Huang Y.-Y., Vecchio D., Avci P., Yin R., Garcia-Diaz M., Hamblin M. R., “Melanoma resistance to photodynamic therapy: new insights,” Biol. Chem. 394(2), 239–250 (2013). 10.1515/hsz-2012-0228 [DOI] [PMC free article] [PubMed] [Google Scholar]
- 29.Wang Z., Dillon J., Gaillard E. R., “Antioxidant Properties of Melanin in Retinal Pigment Epithelial Cells,” Photochem. Photobiol. 82(2), 474 (2006). 10.1562/2005-10-21-RA-725 [DOI] [PubMed] [Google Scholar]
- 30.Ramachandran C., Kang Yuan Z., Huang X. L., Krishan A., “Doxorubicin Resistance in Human Melanoma Cells: MDR-I and Glutathione S-Transferase n Gene Expression,” Biochem. Pharmacol. 45(3), 743–751 (1993). 10.1016/0006-2952(93)90150-U [DOI] [PubMed] [Google Scholar]
- 31.Kalal B. S., Upadhya D., Pai V. R., “Chemotherapy resistance mechanisms in advanced skin cancer,” Oncol. Rev. 11(1), 19–25 (2017). [DOI] [PMC free article] [PubMed] [Google Scholar]
- 32.Bodanese B., Silveira F. L., Zĝngaro R. A., Pacheco M. T. T., Pasqualucci C. A., Silveira L., “Discrimination of basal cell carcinoma and melanoma from normal skin biopsies in vitro through raman spectroscopy and principal component analysis,” Photomed. Laser Surg. 30(7), 381–387 (2012). 10.1089/pho.2011.3191 [DOI] [PMC free article] [PubMed] [Google Scholar]
- 33.Larin K. V., Ghosn M. G., Bashkatov A. N., Genina E. A., Trunina N. A., Tuchin V. V., “Optical Clearing for OCT Image Enhancement and In-Depth Monitoring of Molecular Diffusion,” IEEE J. Sel. Top. Quantum Electron. 18(3), 1244–1259 (2012). 10.1109/JSTQE.2011.2181991 [DOI] [Google Scholar]
- 34.Millon S. R., Roldan-Perez K. M., Riching K. M., Palmer G. M., Ramanujam N., “Effect of optical clearing agents on the in vivo optical properties of squamous epithelial tissue,” Lasers Surg. Med. 38(10), 920–927 (2006). 10.1002/lsm.20451 [DOI] [PubMed] [Google Scholar]
- 35.Zhu D., Larin K. V., Luo Q., Tuchin V. V., “Recent progress in tissue optical clearing,” Laser Photonics Rev. 7(5), 732–757 (2013). 10.1002/lpor.201200056 [DOI] [PMC free article] [PubMed] [Google Scholar]
- 36.Genina E. A., Bashkatov A. N., Sinichkin Y. P., Tuchin V. V., “Optical clearing of skin under action of glycerol: Ex vivo and in vivo investigations,” Opt. Spectrosc. 109(2), 225–231 (2010). 10.1134/S0030400X10080126 [DOI] [Google Scholar]
- 37.Pires L., Demidov V., Wilson B. C., Salvio A. G., Moriyama L., Bagnato V. S., Vitkin I. A., Kurachi C., “Dual-agent photodynamic therapy with optical clearing eradicates pigmented melanoma in preclinical tumor models,” Cancers 12(7), 1956 (2020). 10.3390/cancers12071956 [DOI] [PMC free article] [PubMed] [Google Scholar]
- 38.Pires L., Demidov V., Vitkin I. A., Bagnato V., Kurachi C., Wilson B. C., “Optical clearing of melanoma in vivo: characterization by diffuse reflectance spectroscopy and optical coherence tomography,” J. Biomed. Opt. 21(8), 081210 (2016). 10.1117/1.JBO.21.8.081210 [DOI] [PubMed] [Google Scholar]
- 39.Pires L., “Optical strategies for diagnosis and treatment of melanoma,” Universidade de São Paulo; (2018). [Google Scholar]
- 40.Rachmawati H., Haryadi B. M., Anggadiredja K., Suendo V., “Intraoral Film Containing Insulin-Phospholipid Microemulsion: Formulation and In Vivo Hypoglycemic Activity Study,” AAPS PharmSciTech 16(3), 692–703 (2015). 10.1208/s12249-014-0258-9 [DOI] [PMC free article] [PubMed] [Google Scholar]
- 41.Gniadecka M., Philipsen P. A., Wessel S., Gniadecki R., Wulf H. C., Sigurdsson S., Nielsen O. F., Christensen D. H., Hercogova J., Rossen K., Thomsen H. K., Hansen L. K., “Melanoma Diagnosis by Raman Spectroscopy and Neural Networks: Structure Alterations in Proteins and Lipids in Intact Cancer Tissue,” J. Invest. Dermatol. 122(2), 443–449 (2004). 10.1046/j.0022-202X.2004.22208.x [DOI] [PubMed] [Google Scholar]
- 42.Stremersch S., Marro M., El Pinchasik B., Baatsen P., Hendrix A., De Smedt S. C., Loza-Alvarez P., Skirtach A. G., Raemdonck K., Braeckmans K., “Identification of individual exosome-like vesicles by surface enhanced raman spectroscopy,” Small 12(24), 3292–3301 (2016). 10.1002/smll.201600393 [DOI] [PubMed] [Google Scholar]
- 43.Brauchle E., Noor S., Holtorf E., Garbe C., Schenke-Layland K., Busch C., “Raman spectroscopy as an analytical tool for melanoma research,” Clin. Exp. Dermatol. 39(5), 636–645 (2014). 10.1111/ced.12357 [DOI] [PubMed] [Google Scholar]
- 44.Movasaghi Z., Rehman S., Rehman I. U., “Raman spectroscopy of biological tissues,” Appl. Spectrosc. Rev. 42(5), 493–541 (2007). 10.1080/05704920701551530 [DOI] [Google Scholar]
- 45.Feng X., Moy A. J., Nguyen H. T. M., Zhang J., Fox M. C., Sebastian K. R., Reichenberg J. S., Markey M. K., Tunnell J. W., “Raman active components of skin cancer,” Biomed. Opt. Express 8(6), 2835 (2017). 10.1364/BOE.8.002835 [DOI] [PMC free article] [PubMed] [Google Scholar]
- 46.de Oliveira A. F., de A I. D., Santos O., Cartaxo S. B., Bitar R. A., Enokihara M. M. S. e. S., da Silva Martinho H., Martin A. A., Ferreira L. M., “Differential diagnosis in primary and metastatic cutaneous melanoma by FT-Raman spectroscopy,” Acta Cir. Bras. 25(5), 434–439 (2010). 10.1590/S0102-86502010000500009 [DOI] [PubMed] [Google Scholar]
- 47.Kourkoumelis N., Balatsoukas I., Moulia V., Elka A., Gaitanis G., Bassukas I. D., “Advances in the in vivo Raman spectroscopy of malignant skin tumors using portable instrumentation,” Int. J. Mol. Sci. 16(12), 14554–14570 (2015). 10.3390/ijms160714554 [DOI] [PMC free article] [PubMed] [Google Scholar]
- 48.Yorucu C., Lau K., Mittar S., Green N. H., Raza A., Rehman I. U., MacNeil S., “Raman spectroscopy detects melanoma and the tissue surrounding melanoma using tissue-engineered melanoma models,” Appl. Spectrosc. Rev. 51(4), 263–277 (2016). 10.1080/05704928.2015.1126840 [DOI] [PMC free article] [PubMed] [Google Scholar]
- 49.Sdobnov A. Y., Darvin M. E., Genina E. A., Bashkatov A. N., Lademann J., Tuchin V. V., “Recent progress in tissue optical clearing for spectroscopic application,” Spectrochim. Acta, Part A 197, 216–229 (2018). 10.1016/j.saa.2018.01.085 [DOI] [PubMed] [Google Scholar]
- 50.Yeh A. T., Hirshburg J., “Molecular interactions of exogenous chemical agents with collagen—implications for tissue optical clearing,” J. Biomed. Opt. 11(1), 014003 (2006). 10.1117/1.2166381 [DOI] [PubMed] [Google Scholar]
- 51.Sdobnov A. Y., Tuchin V. V., Lademann J., Darvin M. E., “Confocal Raman microscopy supported by optical clearing treatment of the skin - Influence on collagen hydration,” J. Phys. D: Appl. Phys. 50(28), 285401 (2017). 10.1088/1361-6463/aa77c9 [DOI] [Google Scholar]
- 52.Nguyen T. T., Happillon T., Feru J., Brassart-Passco S., Angiboust J. F., Manfait M., Piot O., “Raman comparison of skin dermis of different ages: Focus on spectral markers of collagen hydration,” J. Raman Spectrosc. 44(9), 1230–1237 (2013). 10.1002/jrs.4355 [DOI] [Google Scholar]
- 53.Lucassen G. W., Caspers P. J., Puppels G. J., “Water content and water profiles in skin measured by FTIR and Raman spectroscopy,” in Tuchin V. V., ed. (2000), pp. 39–45. [Google Scholar]
- 54.Yanina I. Y., Schleusener J., Lademann J., Tuchin V. V., Darvin M. E., “The Effectiveness of Glycerol Solutions for Optical Clearing of the Intact Skin as Measured by Confocal Raman Microspectroscopy,” Opt. Spectrosc. 128(6), 759–765 (2020). 10.1134/S0030400X20060259 [DOI] [Google Scholar]
- 55.Sdobnov A. Y., Darvin M. E., Schleusener J., Lademann J., Tuchin V. V., “Hydrogen bound water profiles in the skin influenced by optical clearing molecular agents—Quantitative analysis using confocal Raman microscopy,” J. Biophotonics 12(5), e201800283 (2019). 10.1002/jbio.201800283 [DOI] [PubMed] [Google Scholar]
- 56.Lin Q., Lazareva E. N., Kochubey V. I., Duan Y., Tuchin V. V., “Kinetics of optical clearing of human skin studied in vivo using portable Raman spectroscopy,” Laser Phys. Lett. 17(10), 105601 (2020). 10.1088/1612-202X/abae6d [DOI] [Google Scholar]