Abstract
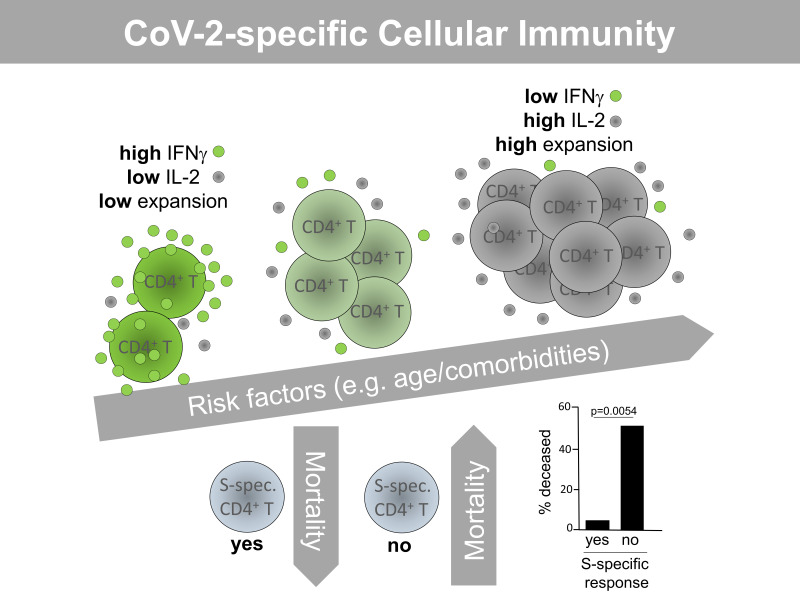
Coronavirus disease 2019 (COVID-19) has emerged as a global pandemic caused by severe acute respiratory syndrome coronavirus 2 (SARS–CoV-2). So far, viral targets of cellular immunity and factors determining successful mounting of T cell responses are poorly defined. We therefore analyzed cellular responses to membrane, nucleocapsid, and spike proteins in individuals suffering from moderate or severe infection and in individuals who recovered from mild disease. We demonstrate that the CoV-2–specific CD4+ T helper cell response is directed against all 3 proteins with comparable magnitude, ex vivo proliferation, and portions of responding patients. However, individuals who died were more likely to have not mounted a cellular response to the proteins. Higher patient age and comorbidity index correlated with increased frequencies of CoV-2–specific CD4+ T cells, harboring higher portions of IL-2–secreting, but lower portions of IFN-γ–secreting, cells. Diminished frequencies of membrane protein–reactive IFN-γ+ T cells were particularly associated with higher acute physiology and chronic health evaluation II scores in patients admitted to intensive care. CoV-2–specific T cells exhibited elevated PD-1 expression in patients with active disease as compared with those individuals who recovered from previous mild disease. In summary, our data suggest a link between individual patient predisposition with respect to age and comorbidity and impairment of CoV-2–specific Th1-type cellular immunity, thereby supporting a concept of altered T cell function in at-risk patients.
Keywords: COVID-19
Keywords: Antigen, T cells
Introduction
Currently, the zoonotic coronavirus disease 2019 (COVID-19), caused by severe acute respiratory syndrome coronavirus 2 (SARS–CoV-2), is dramatically challenging global health systems. COVID-19 exhibits a diverse spectrum of clinical manifestations, ranging from a moderate course of infection with no or mild symptoms to viral pneumonia and hospitalization particularly in patients at risk, ultimately requiring intensive care unit (ICU) admission in case of acute respiratory distress syndrome (ARDS) (1, 2). Factors determining clinical outcome include patient age, chronic pulmonary and heart disease, as well as excessive production of the inflammatory mediators interleukin 6 (IL-6) and 8 (IL-8) (3, 4). With respect to the latter ones, the mechanisms driving such exacerbation of innate immunity are poorly understood. Similarly, the exact immunological correlates of protection from COVID-19 remain obscure. Despite pioneering data from a simian CoV-2 infection model (5), the relative contribution of humoral and cellular responses to overall immunity has not been elucidated. Particularly, data on the SARS–CoV-2–specific T cell response is limited, including its viral targets, functional features, and an association with clinical parameters. T cell–mediated immunity against SARS-CoV 2002–03, exhibiting high homology to CoV-2 (6), has been shown to be preferentially directed against viral spike protein (7), which is also the target of potent neutralizing antibodies (8). Furthermore, rodent models suggested a critical contribution of both SARS-CoV–specific CD8 and CD4 responses to viral clearance (9–11). Recent bioinformatic approaches have predicted T cell epitopes in membrane (M), nucleocapsid (N), and spike (S) proteins of SARS–CoV-2 (12–15). We therefore phenotypically and functionally characterized the SARS–CoV-2–specific CD4+ T cell response to all 3 proteins in patients with moderate and severe acute disease and in mildly affected individuals after their recovery. Our study provides what we believe is important new information on the composition of anti–CoV-2 T cell immunity, suggesting that patient-specific risk factors such as age and comorbidities predetermine the CoV-2–specific T cell response both quantitatively and functionally.
Results
Study subjects.
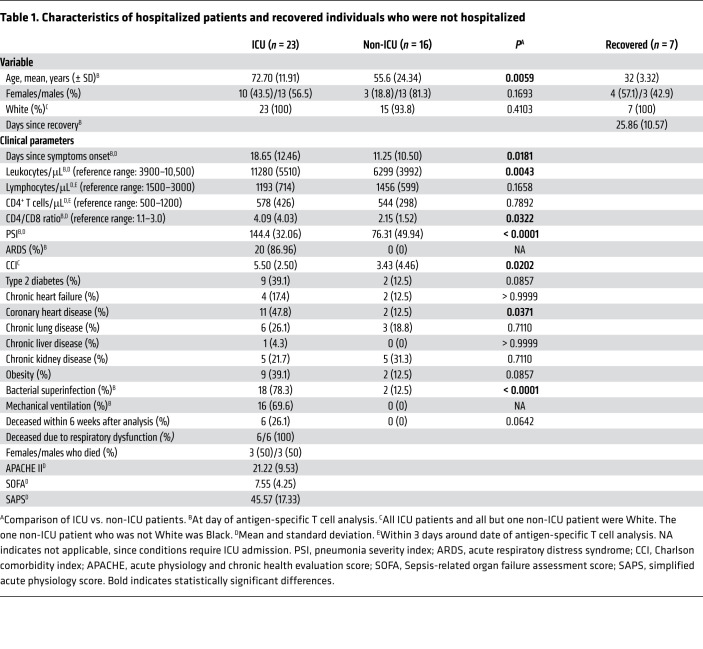
The study cohort consisted of 39 hospitalized, acutely CoV-2–infected individuals from whom 23 with severe disease were in intensive care and 16 with a moderate disease course were in nonintensive care. Details of their characteristics are listed in Table 1. Both groups did not show differences with respect to sex and ethnic background. However, patients in the ICU were significantly older, largely suffered from ARDS, showed significantly higher pneumonia severity index (PSI) and Charlson comorbidity index (CCI) scores, experienced more frequent bacterial superinfections, and were characterized by a longer infection history as reflected by number of days since symptom onset. Furthermore, individuals treated in the ICU exhibited significantly elevated absolute counts of peripheral leukocytes and an increased CD4+ to CD8+ T cell ratio on the day of antigen-specific T cell analysis. Based on clinical routine, absolute lymphocyte and CD4+ T cell counts were collected within 3 days around the date of specific T cell analysis, being below or close to the lower limit of the reference range, respectively, in both ICU and non-ICU patients.
Table 1. Characteristics of hospitalized patients and recovered individuals who were not hospitalized.
We further included a group of 7 convalescent individuals into this cross-sectional study to examine CoV-2–specific immunity in the non-acute/memory phase. Based on recruitment routines, these subjects all presented with a previous mild disease course, principally bearing the potential to identify functional qualities associated with uncomplicated recovery.
Detection, quantification, and functional characterization of SARS–CoV-2–specific T cells in patients with active COVID-19.
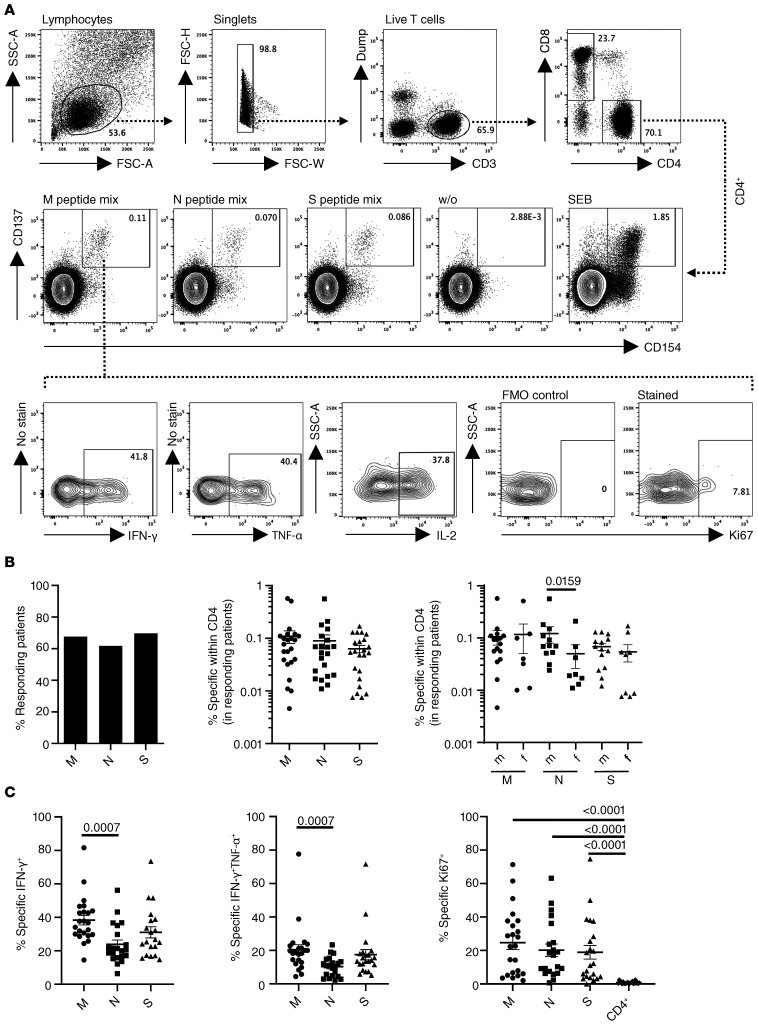
To identify SARS–CoV-2 reactive T cells, PBMCs were individually stimulated with overlapping peptide pools spanning membrane glycoprotein, nucleocapsid phosphoprotein, or spike glycoprotein with the capacity to activate both CD4+ and CD8+ T cells irrespective of HLA-type (16). After pregating on live CD3+dump– lymphocytes, antigen-reactive CD4+ Th cells were identified based on coexpression of CD154 and CD137, as demonstrated previously (17), allowing sensitive detection with low background, followed by subsequent analysis of cytokine expression and ex vivo proliferation based on Ki67 staining (Figure 1A). A T cell response was considered positive when SARS–CoV-2 peptide mix–stimulated cultures contained at least 2-fold higher frequencies of CD154+CD137+CD4+ T cells as compared with the unstimulated control with at least 10 events. Based on limitations in cell numbers or immediate availability of reagents at the peak of the pandemic, not all analyses were conducted for all patients.
Figure 1. Identification of SARS–CoV-2–specific T cells in patients with COVID-19.
(A) PBMCs were stimulated or not with M, N, or S peptide mix or SEB for 16 hours as indicated. Live single CD14–CD19–CD3+–specific CD4+ Th cells were identified based on coexpression of CD154 and CD137. Specific CD4+CD154+CD137+ T cells were further analyzed for expression of IFN-γ, TNF-α, IL-2, and Ki67, with the latter including a fluorescence-minus-one (FMO) control. (B) Percentage of all patients with a positive CD4+ T cell response (M: n = 34; N: n = 34; S: n = 33), frequencies of antigen-reactive CD4+ T cells in responding patients (Kruskal-Wallis test), and frequency distribution in males versus females (M: n = 23; N: n = 21; S: n = 23) (Mann-Whitney test). (C) Frequencies of antigen-specific CD4+ T cells expressing IFN-γ (Kruskal-Wallis test), IFN-γ + TNF-α (Kruskal-Wallis test), or Ki67 (in comparison with the total CD4+ population; Kruskal-Wallis test) (M: n = 23; N: n = 21; S: n = 20). Where applicable, graphs show mean ± SEM.
The overall portion of all acutely infected hospitalized donors displaying specific CD4+ T cell responses was similar for both M , N, and S peptide mixes, ranging from 60% (N protein) to 70% (S protein) (Figure 1B). Within the group of responding patients, mean frequencies of antigen-reactive CD4+CD154+CD137+ T cells were not significantly different for M , N , or S antigen (Figure 1B); however, males showed a higher relative magnitude of responses to N protein than females after relative quantification (Figure 1B). With respect to their functionality, N-specific T cells comprised lower frequencies of IFN-γ+ and IFN-γ+TNF-α+ bifunctional T cells than those specific for S and M protein with the latter comparisons being highly significant (Figure 1C, left and middle). T cells reactive to M, N, or S protein showed high levels of ex vivo proliferation based on Ki67 expression, as compared with the total CD4+ population (Figure 1C).
Features associated with nonresponders to CoV-2 antigen–specific stimulation.
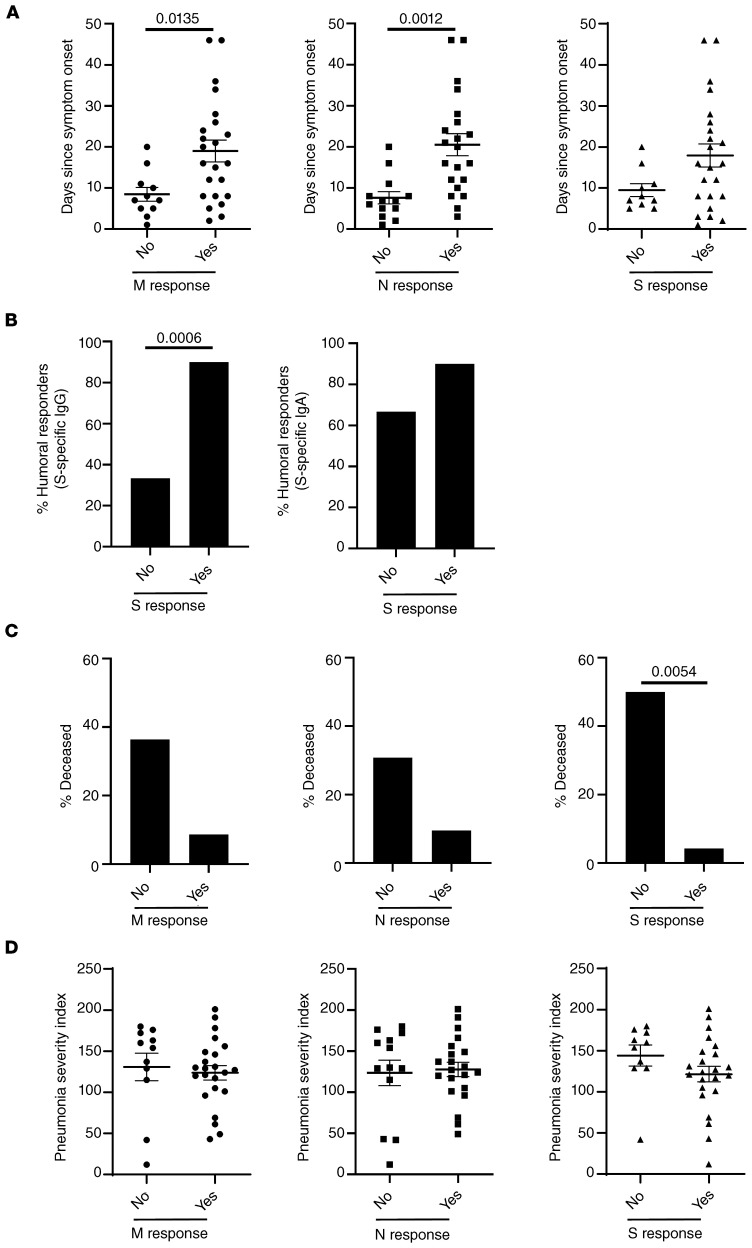
Stratifying patients for their capacity to mount a T cell response or not, we found that nonresponders exhibited a shorter infection history (as estimated by days since symptom onset). This observation was statistically significant for M and N responses and showed a trend for S responses (Figure 2A). Next, we analyzed CoV-2 spike-protein–specific IgG and IgA responses in cellular responders and nonresponders to the same antigen. Whereas a positive IgG response could be detected in 92% of cellular responders, the majority of cellular nonresponders were characterized by a lack of detectable anti–spike IgG responses. Though this difference was highly significant, we did not observe such interdependence for anti–spike IgA responses (Figure 2B). Patients who died during the study period (that is, within 6 weeks from the time point of cellular analysis) were more frequently cellular nonresponders. However, based on patient numbers, this observation was only significant with respect to responses against spike protein, where 5 of 10 patients in the nonresponder group died, as compared with only 1 of 23 patients in the cellular responder group (Figure 2C). We then interrogated whether nonresponders were characterized by a distinct degree of acute pneumonia. We did not observe a significant association of pneumonia severity index (PSI) with nonresponsiveness toward any of the 3 antigens (Figure 2D).
Figure 2. Features of cellular nonresponders to CoV-2–specific stimulation.
(A–D) All patients were stratified according to their capacity to mount a specific CD4+ T cell response or not after M, N, or S protein stimulation with n as in the legend to Figure 1B. In responders and nonresponders, the number of days since symptom onset was analyzed by (A) t test or (B) the percentage of patients showing spike-protein–specific IgG (left; Fisher’s exact test) or IgA (right; Fisher′s exact test) responses. (C) The percentage of individuals who died within 6 weeks after analysis (Fisher’s exact test) and (D) the severity of pneumonia (t test) were examined. Where applicable, graphs show mean ± SEM.
Impact of patient age and comorbidities on CoV-2–specific cellular immunity.
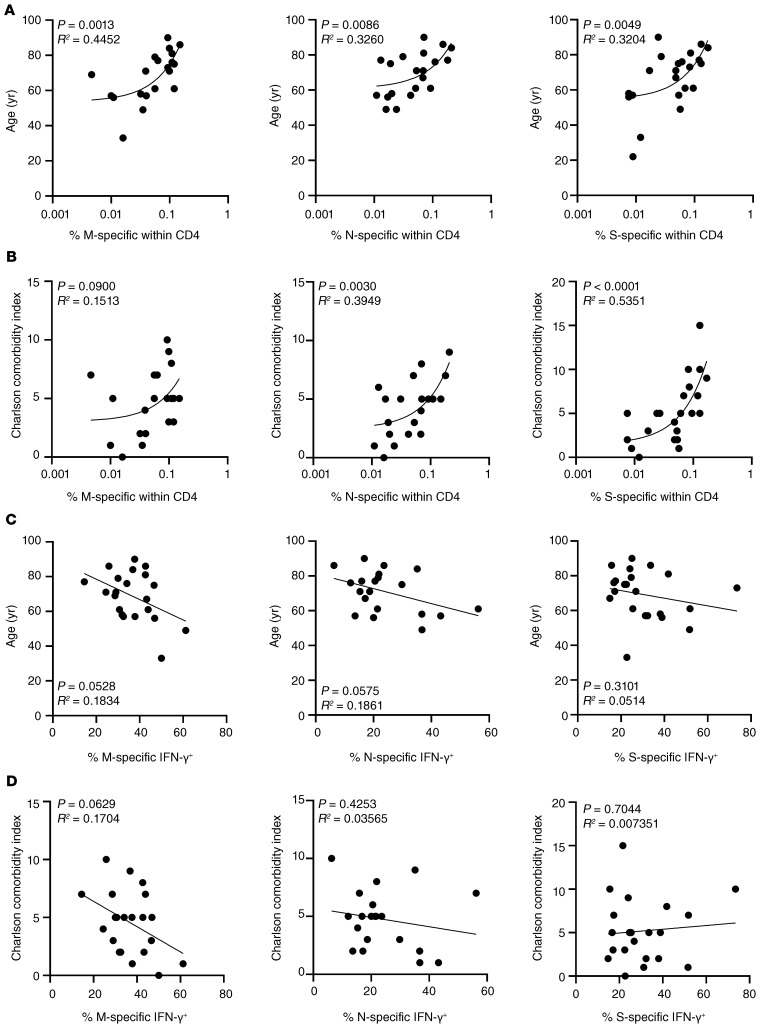
To decipher which factors influence quantitative and qualitative characteristics of CoV-2–specific T helper responses, frequencies of CD154+CD137+ CD4+ cells as well as portions of IFN-γ+ cells were correlated with age and comorbidities. Interestingly, advanced patient age and comorbidity significantly correlated with an increased relative magnitude of M, N, and S responses, with the exception of responses to membrane protein, which only showed a trend with respect to CCI (Figure 3, A and B).
Figure 3. Correlation of the CoV-2–specific CD4+ T cell response with patient age and comorbidities.
Frequencies of M, N, or S protein–specific CD4+ T cells were correlated with patient age (A) or comorbidities (B) with n as in the legend to Figure 1B. Frequencies of M-, N-, or S-specific IFN-γ–secreting T cells with n as in the legend to Figure 1C were correlated with patient age (C) or comorbidities (D). Simple linear regression analysis was performed throughout.
Intriguingly, as opposed to their impact on the magnitude of specific T cell responses, advanced patient age and higher CCI appeared to be associated with lower frequencies of antigen-specific IFN-γ–secreting cells after stimulation with membrane protein. This association was similarly pronounced, albeit equally just not reaching significance, for cytokine production toward N antigen stimulation in relation to age (Figure 3, C and D).
CoV-2–specific T cell responses in patients admitted to intensive care.
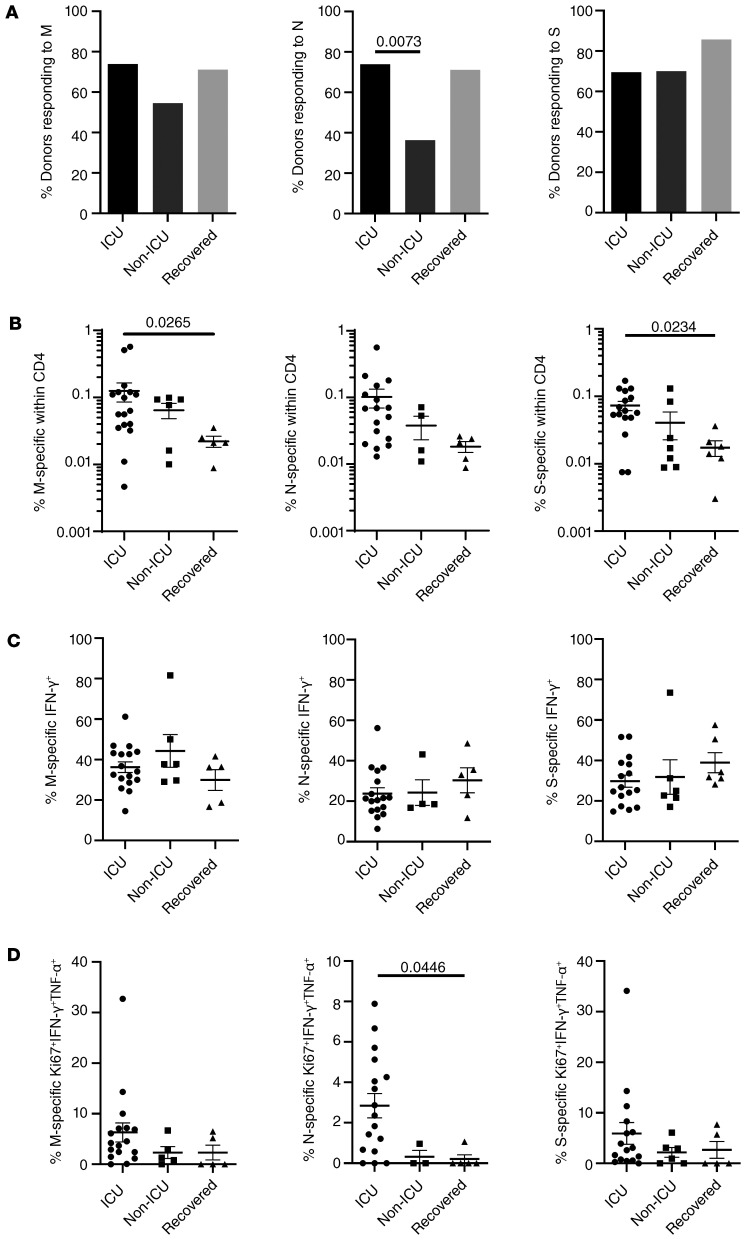
To address whether patients with COVID-19 with severe clinical manifestations requiring intensive care (from whom the majority had developed ARDS, Table 1) showed distinct antigen-specific T cell responses, we compared them with non-ICU patients and to donors who were not hospitalized with mild symptoms on average 26 days after recovery. ICU and non-ICU patients were characterized by significant differences with respect to acute disease based on PSI as well as comorbidities (Table 1). We further noted that non-ICU patients responded less frequently to stimulation with M and N antigen than ICU-treated individuals, with the latter comparison reaching significance; both patient groups harbored almost identical portions of responders to spike protein stimulation (Figure 4A).
Figure 4. Characteristics of the CoV-2–specific T cell response in patients admitted to intensive care.
(A) Patients were stratified according to ICU (M, N, S: n = 23, respectively) or non-ICU treatment (M: n = 11; N: n = 11; S: n = 10) and compared with recovered individuals who were not hospitalized (n = 7) for the percentage of donors showing specific CD4 responses (χ2 test), (B) frequencies of antigen-specific CD4+ T cells in cellular responders (M: n = 17, N: n = 17, S: n = 16 [ICU]; M: n = 6, N: n = 4, S: n = 7 [non-ICU]; M: n = 5, N: n = 5, S: n = 6 [recovered]), (C) frequencies of antigen-specific CD4+ T cells secreting IFN-γ, or (D) ex vivo proliferating Ki67+ coexpressing IFN-γ and TNF-α (with n as in B and analyzed by Kruskal-Wallis test, respectively). Where applicable, graphs show mean ± SEM.
With respect to cellular responses, patients treated in the ICU exhibited higher frequencies of antigen-specific T cells as compared with non-ICU patients and recovered individuals; however, only the latter comparison reached significance for M and S antigen stimulation (Figure 4B). Interestingly, we did not observe substantial differences of mean frequencies of specific IFN-γ–secreting T cells among groups (Figure 4C). However, patients in the ICU had higher frequencies of ex vivo proliferating Ki67+ cells coexpressing IFN-γ and TNF-α as compared with non-ICU patients and recovered individuals, with the latter showing significance only for responses to nucleocapsid protein (Figure 4D). CoV-2–specific responses in patients in the ICU were subsequently correlated with acute physiology and chronic health (APACHE) II scores predicting ICU mortality. Importantly, higher APACHE scores were significantly associated with lower frequencies of IFN-γ+ T cells specific for membrane protein, but not for nucleocapsid or spike protein (Figure 5).
Figure 5. Correlation of CoV-2–specific IFN-γ secretion and APACHE II scores in patients treated in the ICU.
Frequencies of antigen-specific IFN-γ–expressing CD4+ T cells after M, N, or S protein stimulation were determined in responding patients treated in the ICU and correlated with the individual APACHE II score values as indicated (M: n = 17; N: n = 17; S: n = 16) by simple linear regression analysis.
To examine whether patients with COVID-19 exhibited a general impairment of cytokine production, T cell responses were analyzed after activation with the polyclonal stimulus staphylococcus aureus enterotoxin B (SEB). The overall magnitude of the SEB-specific T cell response is largely predetermined by T cell receptor β chain usage and HLA haplotype for a given individual (18), thereby not allowing specific conclusions (Supplemental Figure 1A; supplemental material available online with this article; https://doi.org/10.1172/JCI140965DS1). However, with respect to functionality, we observed significantly higher frequencies of IFN-γ+ and IFN-γ+TNF-α+CD4+ T cells in recovered individuals who experienced a mild disease course as compared with patients in the ICU, and a trend toward more cytokine-positive cells in recovered versus non-ICU patients (Supplemental Figure 1B).
IL-2 secretion capacity, exhaustion, and differentiation status of CoV-2–specific T cells.
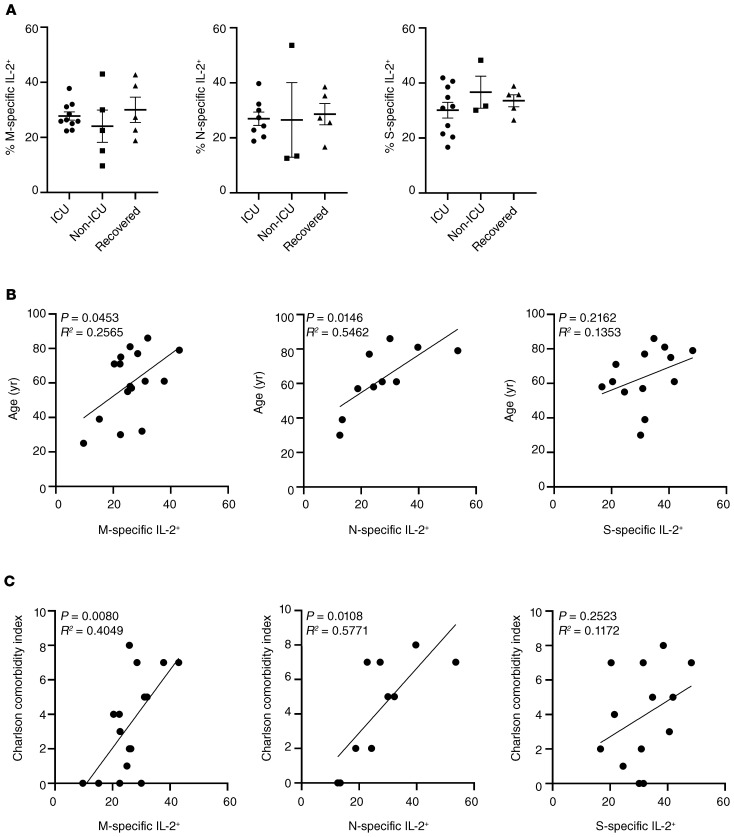
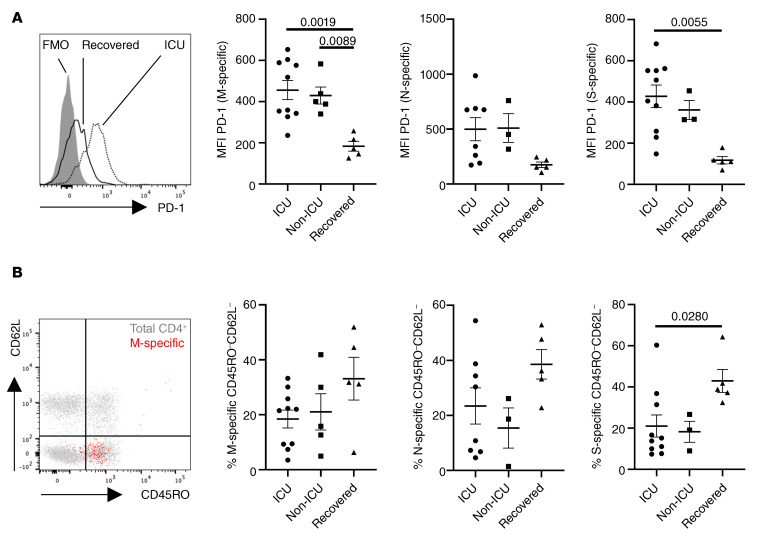
Since patients with active COVID-19 showed increased relative portions of ex vivo proliferating T cells, expression of the pan T cell growth factor IL-2 was examined in a limited number of study subjects. In analogy to our findings for IFN-γ secretion, we did not observe differences in frequencies of specific T cells secreting IL-2 between groups (Figure 6A). However, higher frequencies of IL-2+ T cells significantly correlated with patient age and comorbidity for M- and N-specific, but not for S-specific, T cells (Figure 6, B and C). Since impaired effector cytokine production, including IFN-γ, might be based on functional exhaustion, expression of the coinhibitory molecule PD-1 was characterized on CoV-2–specific T cells. Of note, patients with active COVID-19, regardless of being in ICU care or not, showed higher PD-1 expression levels as compared with recovered individuals based on mean fluorescence intensity (MFI), reaching significance for M- and S-specific T cells (Figure 7A). Interestingly, when comparing the differentiation status of antigen-specific T cells according to CD45RO and CD62L expression, we noted a trend toward higher frequencies of CD45RO–CD62L– effector-like T cells specific for M and N protein in recovered individuals that reached significance for T cells reactive to S protein (Figure 7B and Supplemental Figure 2A). CoV-2–specific T cells consistently expressed CD28, were largely CD57–, and contained only a few cells expressing the cytotoxic molecule granzyme B, as exemplarily demonstrated in Supplemental Figure 2, B and C.
Figure 6. CoV-2–specific IL-2 secretion and its correlation with patient predisposition.
Frequencies of antigen-specific IL-2–expressing CD4+ T cells after M, N, or S protein stimulation were (A) determined in patients stratified according to ICU or non-ICU care or in recovered individuals who were not hospitalized (M: n = 10, N: n = 8, S: n = 10 [ICU]; M: n = 5, N: n = 3, S: n = 3 [non-ICU]; M: n = 5, N: n = 5, S: n = 5 [recovered]). Analysis by ANOVA. Frequencies of specific IL-2–secreting T cells were further correlated in patients with active COVID-19 with (B) age or (C) comorbidity (M: n = 16; N: n = 10; S: n = 13) and analyzed by simple linear regression. Bar graphs show mean ± SEM.
Figure 7. Exhaustion and memory phenotype of CoV-2–specific T cells.
(A) Exemplary PD-1 expression in S-specific CD4+ T cells in a recovered individual versus a patient in ICU care with FMO control (left) and MFI of PD-1 in M-specific (ANOVA analysis), N-specific (ANOVA-analysis), and S-specific (Kruskal-Wallis analysis) T cells in patients stratified as indicated (right). (B) Memory subset distribution of CoV-2–specific T cells was determined based on CD45RO and CD62L expression. Exemplary subset identification in total (gray) and M-specific (red) CD4+ T cells (ICU patient, left) as well as frequencies of M-specific (ANOVA analysis), N-specific (ANOVA analysis), and S-specific (Kruskal-Wallis analysis) CD45RO–CD62L– T cells (right) in patients stratified as indicated in A and B (M: n = 10, N: n = 8, S: n = 10 [ICU]; M: n = 5, N: n = 3, S: n = 3 [non-ICU]; M: n = 5, N: n = 5, S: n = 5 [recovered]). Bar graphs show mean ± SEM.
We did not observe significant differences in frequencies of IFN-γ+TNF-α+IL-2+ polyfunctional CoV-2–specific T cells between patient groups and recovered individuals (Supplemental Figure 3A). Furthermore, portions of polyfunctional T cells did not significantly correlate with COVID-19 patient age or CCI (Supplemental Figure 3, B and C).
Discussion
In this study, by applying a highly sensitive flow cytometry based assay, we characterized fundamental features and clinical correlations of the CoV-2–specific T helper cell response against 3 viral proteins formerly predicted to contain multiple T cell epitopes (12–15). In addition to providing what we believe are important new data on the overall relative magnitude and quality of the antiviral response in acute CoV-2 infection, we identify both advanced patient age and higher comorbidity as patient-related risk factors associated with increasing frequencies of antigen-specific CD4+ T cells, including those secreting IL-2, but decreasing portions of IFN-γ secreting T cells, particularly in response to membrane protein stimulation. We further extend the latter observation by demonstrating that patients in the ICU show significantly reduced frequencies of M-specific IFN-γ+ T cells, with increasing mortality risk based on the APACHE scoring system.
Several lines of evidence point toward an overall impairment of innate and adaptive immunity in patients with COVID-19. In that respect, Th and cytotoxic T cells show significantly higher ex vivo expression levels of PD-1 and TIM-3, suggesting a state of functional exhaustion (19). Consequently, 2 recent reports verified that patients with COVID-19 exhibit a trend toward lower frequencies IFN-γ+ cells after unspecific stimulation (20, 21), an observation that could be confirmed by using the polyclonal stimulus SEB. More importantly, our data substantially extend the emerging concept of impaired cellular immunity by demonstrating that CoV-2–specific Th cells in patients with active COVID-19 upregulate PD-1, accompanied by diminished frequencies of cells expressing the prototypic Th1 cytokine IFN-γ in relation to their predisposing risk factors, entailing possible implications for antiviral defense. Importantly, the latter observation could be overlooked when solely comparing mean frequencies of IFN-γ+ cells in ICU- and non- ICU–treated individuals. Interestingly, both risk factors overlap with those identified to generally predict mortality in a recent retrospective study (22).
So far, the contribution of Th cells to CoV-2–specific immunity is largely obscure, considering that only a few reports addressed specific T cell responses against multiple antigens (23, 24). Although our analysis relies only on a small patient cohort, we identified a significantly increased number of patients who died within the nonresponder group, in particular, those who did not have a cellular response against S protein. Because cellular nonresponders less frequently developed antiviral IgG titers, we can only speculate whether Th cells exert direct effects against CoV-2, e.g., by cytokine release, beyond provision of B cell help for immunoglobulin production. The more detailed characterization of anti–SARS-CoV 2002–03–specific immunity proved that transfer of virus-specific CD4+ T cells into SCID mice mediated protection from lethal SARS-CoV challenge in the absence of humoral immunity (9). To account for the predominance of advanced age individuals suffering from severe SARS-CoV disease, a mouse model reflecting such senescent state was created in which Th cells were equally instrumental for viral control (25). With respect to the precise role of cytokine secretion, a very recent study identified airway-resident, CoV nucleocapsid–specific Th cells as a critical source for IFN-γ production, since its neutralization was associated with significantly decreased survival after viral challenge (11). Assuming that virus-induced IFN-γ production by T cells might equally support anti–CoV-2 immunity in humans, it remains to be determined which factors contribute to diminished frequencies of cytokine producers in patients with COVID-19 holding risk factors such as advanced age or high comorbidity and APACHE scores. Pioneering data suggest that lymphocyte functionality might be impaired by the overall inflammatory state prevailing in patients who are severely affected by COVID-19. This has been exemplarily shown for high IL-6 levels being associated with reduced natural killer (NK) cell functionality that was restored after in vivo IL-6 blockade with tocilizumab (21). Excessive production of innate cytokines, including IL-6, could be synergistically triggered in patients at risk by inflamm-aging (as reviewed in ref. 26), bearing, for example, the potential to enhance PD-1 expression on T cells (27), with subsequent implications for altered Th1 cytokine production. Irrespective of the role of IL-6 in this process, the impact of increasing age on impaired IFN-γ production has already been demonstrated for human CMV-specific T cells (8) and is likely based on interlinked changes in both innate immunity (e.g., due to modifications in pattern recognition receptor signaling as reviewed in ref. 28) and adaptive components. However, given that CoV-2 induces acute rather than long-lasting chronic infection, it is comprehensible that we did not detect typical T cell features associated with immunosenescence, such as downregulation of CD28, acquisition of granzyme B, or CD57 expression, being hallmarks of extremely long-lived individuals (29) and potentially resulting from chronic antigen exposure (e.g., caused by persistent CMV infection) (30, 31). Future studies need to assess immune components beyond T cells for age-dependent modifications in patients with COVID-19. Innate inflammation as a driver for functional T cell exhaustion might also be fueled by mechanical ventilation (32) being applied to the majority of ICU patients included herein, since experimental data suggest an upregulation of IL-6 by this invasive treatment (33). An initial hyperinflammatory phase is also a hallmark of severe sepsis that is often followed by immuno-depression, resulting, for example, in elevated PD-1 expression (34) along with reduced IFN-γ secretion by T cells (35), thus providing a possible link to our findings.
Based on the experimental limitations imposed by human samples, only animal models will allow us to decipher at what stage of COVID-19 patients might benefit from pro- or antiinflammatory interventions. Such interventions, including the evaluation of the PD-1/PD-1L pathway as a therapeutic target, are currently being controversially discussed (36, 37).
We observed a pronounced positive correlation between the relative magnitude of the CoV-2–specific T cell response and age or comorbidity index. This relative cellular expansion might be mechanistically linked to an increased bioavailability of the T cell growth factor IL-2 perhaps acting in an autocrine fashion (38), since we uncover a positive correlation of IL-2+ M- and N-specific T cells with both risk factors. In line with this, antigen-specific T cells derived from patients acutely infected with COVID-19 contained a substantial fraction that proliferated ex vivo as indicated by Ki67 expression. In addition, the small population of proliferating Ki67+ cells coexpressing IFN-γ and TNF-α was highest in ICU patients as compared with non-ICU patients and recovered individuals who were not hospitalized.
Data from model infections indicate that the magnitude of the T cell response might reflect initial viral load. This relation has been verified in humans for live attenuated yellow fever vaccine, where viral load could be easily and repeatedly monitored in vaccinees’ plasma and correlated to specific cellular immunity (39). Although precise viral load was not routinely assessed in our patients, 2 recent reports indeed observed an elevated viral burden in patients with COVID-19 with advanced age (40) and/or severe disease (41), thereby supporting the notion of antigen load–dependent expansion of CoV-2–specific T cells. Evidence from HIV-infected individuals suggests that IL-2 secretion as a cofactor for cellular expansion of specific T cells might be less sensitive to inhibition via the PD-1/PD-1L pathway, as opposed to IFN-γ secretion (42), permitting another explanation for the inverse correlation of IL-2 versus IFN-γ with patient risk factors in our study.
In summary, we provide here what we believe is pioneering quantitative and functional data on the interrelation of CoV-2–specific cellular immunity and patient-immanent features shaping this response. Furthermore, our data on nonresponders imply a crucial role of cellular immunity for antiviral protection. Given the limitations of the cross-sectional design, future studies clearly need to address T cell dynamics in individual patients over time, both during infection and in the memory phase, along with outcome correlations, thereby more accurately allowing evaluation of the individual impact of specific T cell and humoral responses on host protection. Such monitoring should also assess the role of CoV-2–specific CD45RO–CD62L– effector-type T cells for viral clearance, being accumulated in convalescent individuals and also making a contribution to the anti–SARS-CoV 2002–03 T cell response in recovered individuals (43). Given that lymphopenia was found to be associated with severe CoV-2 infection (1, 44) and that total CD4 counts can predict disease progression (44), absolute quantification of antigen-specific T cells might allow a deeper understanding of the remarkably different clinical COVID-19 courses observed. We did not conduct such extended examination, since absolute counts were not routinely available for the day of specific T cell analysis. Although ICU- and non-ICU patients showed similar absolute CD4+ T cell counts within 3 days around the date of our relative quantifications, a side-by-side comparison of both measures, such as has been extensively performed in HIV infection, has the potential to identify patient subgroups (45, 46).
Finally, an analysis of the antigen-specific T cell infiltrate (e.g., from broncho-alveolar lavage samples) will provide important information as to how our observations are representative of the local response against CoV-2.
Methods
Study subjects.
Details of individuals enrolled are summarized in Table 1. The CCI, which predicts survival of patients with multiple comorbidities, was used as described for patients upon hospitalization (47). The PSI was used to assess the morbidity and mortality risk for community-acquired pneumonia (48); values represent the day of blood sampling. To classify the severity of disease of ICU patients upon admission, the APACHE II score (49), the sepsis-related organ failure assessment score (SOFA) (50) and the simplified acute physiology score (SAPS) II (51) were used. SARS–CoV-2 infection was verified by PCR-based detection of viral RNA in nasopharyngeal swabs. SARS–CoV-2 spike protein–specific IgG and IgA antibodies were detected in serum samples (collected on the day of T cell analysis) by ELISA (Euroimmun). A positive humoral response was determined according to the manufacturer’s guideline.
SARS–CoV-2 antigens.
Stimulations were conducted with overlapping peptide pools consisting of 15-mers, with an 11 amino acid overlap encompassing the full sequence of the SARS–CoV-2 (GenBank MN908947.3) membrane glycoprotein, nucleocapsid phosphoprotein, and partial domains of spike glycoprotein (amino acids 304-338, 421-475, 492-519, 683-707, 741-770, 785-802, and 885-1273). All peptide pools were designed by and purchased from Miltenyi Biotec (PepTivator), diluted in sterile water, and used at a final concentration of 1 μg/mL for each peptide.
Cell isolation and stimulation.
Serum was collected and immediately cryopreserved. PBMCs were isolated from heparinized blood by Ficoll-Paque density gradient centrifugation and freshly stimulated. For antigen-specific T cell stimulation, 3 × 10⁶ to 5 × 10⁶ PMBCs were cultured in RPMI 1640 media containing 0.3 mg/mL glutamine, 100 U/mL penicillin, 0.1 mg/mL streptomycin, and 10% human AB serum (all from Biochrom) in the presence of M, N, or S peptide pools for 16 hours. SEB (MilliporeSigma) served as positive control and was used at 1 μg/mL. In all stimulations, Brefeldin A (10 μg/mL, MilliporeSigma) was added after 2 hours, allowing intracellular molecule detection. Based on cell number limitations, SEB stimulation was not conducted for all individuals.
Flow cytometric analysis.
For surface stainings, antibodies against CD3 (SK7, BioLegend), CD4 (SK3, Becton Dickinson), CD8 (SK1, Ebioscience), CD45RO (UCHL1, BioLegend), CD62L (DREG-56, BioLegend), PD-1 (EH12.1, Becton Dickinson), CD28 (CD28.2, Becton Dickinson), and CD57 (QA17A04, BioLegend) were used. Unwanted cells were excluded via a “dump channel” containing CD14+ (M5E2, BioLegend), CD19+ (HIB19, BioLegend), and dead cells (fixable live/dead, BioLegend). After stimulation, cells were fixed in FACS Lysing Solution (Becton Dickinson), permeabilized with FACS Perm II Solution (Becton Dickinson) and intracellularly stained with anti-CD154 (24-31, BioLegend), anti-CD137 (4B4-1, BioLegend), anti–TNF-α (MAb11, BioLegend), anti–IFN-γ (4SB3, Ebioscience), anti–IL-2 (MQ1-17H12, BioLegend), anti-Ki67 (B56, Becton Dickinson), and anti–granzyme B (GB11, Becton Dickinson). Cells were analyzed on a FACS Fortessa X20 (Becton Dickinson) flow cytometer.
Data analysis.
FACS data were analyzed with FlowJo 10 (Becton Dickinson). The gating strategy for analysis of antigen-specific T cells is depicted in Figure 1A. A T cell response was considered positive when SARS–CoV-2 peptide mix stimulated cultures contained at least twofold higher frequencies of CD154+CD137 CD4+ T cells as compared with the unstimulated control with at least 10 events. Some patients were excluded from sub-analyses when event numbers in the respective gates were low. Coexpression was assessed via Boolean gating.
Statistics.
Statistical analysis and graph composition were executed using GraphPad Prism 8.0 (GraphPad). The Kolmogorov-Smirnov test was used to evaluate the distribution of each parameter. Depending on normality distribution, ANOVA (with Holm-Šidák′s post hoc) or Kruskal-Wallis test (with Dunn post hoc) were chosen for multiple comparisons. For 2-group comparisons, unpaired t test or Mann-Whitney test was used. The relationship between 2 variables was examined by simple linear regression analysis. For analysis of contingency tables, Fisher’s exact or χ2 test was used. In all tests, a value of P less than 0.05 was considered significant. Nonsignificant results were not annotated unless indicated.
Study approval.
The study protocol was approved by the ethics committee of the Charité – Universitätsmedizin Berlin (EA2/066/20 and EA2/035/16) and carried out in compliance with its guidelines. All participants gave written informed consent in accordance with the Declaration of Helsinki. A protocol for the Berlin patient cohort was recently published (52).
Author contributions
AS designed the study, performed research, analyzed data, and wrote the manuscript. SA designed the study, analyzed data, and wrote the manuscript. HS, KMH, DK, and ST analyzed data. FH and MEK designed the study. KK designed the study and wrote the manuscript. The order of the co–first authors was determined by consensus.
Supplementary Material
Acknowledgments
This study was supported by a grant from the Sonnenfeldstiftung, Berlin, Germany (to AS and KK).
Version 1. 08/24/2020
In-Press Preview
Version 2. 11/03/2020
Electronic publication
Version 3. 12/01/2020
Print issue publication
Footnotes
Conflict of interest: The authors have declared that no conflict of interest exists.
Copyright: © 2020, American Society for Clinical Investigation.
Reference information: J Clin Invest. 2020;130(12):6477–6489.https://doi.org/10.1172/JCI140965.
See the related Commentary at Are T cells helpful for COVID-19: the relationship between response and risk.
Contributor Information
Arne Sattler, Email: arne.sattler@charite.de.
Stefan Angermair, Email: stefan.angermair@charite.de.
Helena Stockmann, Email: helena.stockmann@charite.de.
Katrin Moira Heim, Email: katrin-moira.heim@charite.de.
Dmytro Khadzhynov, Email: Dmytro.Khadzhynov@charite.de.
Sascha Treskatsch, Email: sascha.treskatsch@charite.de.
Fabian Halleck, Email: fabian.halleck@charite.de.
Martin E. Kreis, Email: martin.kreis@charite.de.
Katja Kotsch, Email: katja.kotsch@charite.de.
References
- 1.Huang C, et al. Clinical features of patients infected with 2019 novel coronavirus in Wuhan, China. Lancet. 2020;395(10223):497–506. doi: 10.1016/S0140-6736(20)30183-5. [DOI] [PMC free article] [PubMed] [Google Scholar]
- 2.Li J, et al. Clinical features of familial clustering in patients infected with 2019 novel coronavirus in Wuhan, China. Virus Res. 2020;286:198043. doi: 10.1016/j.virusres.2020.198043. [DOI] [PMC free article] [PubMed] [Google Scholar]
- 3.Wu J, et al. Clinical features of maintenance hemodialysis patients with 2019 novel coronavirus-infected pneumonia in Wuhan, China. Clin J Am Soc Nephrol. 2020;15(8):1139–1145. doi: 10.2215/CJN.04160320. [DOI] [PMC free article] [PubMed] [Google Scholar]
- 4.Cummings MJ, et al. Epidemiology, clinical course, and outcomes of critically ill adults with COVID-19 in New York City: a prospective cohort study. Lancet. 2020;395(10239):1763–1770. doi: 10.1016/S0140-6736(20)31189-2. [DOI] [PMC free article] [PubMed] [Google Scholar]
- 5.Chandrashekar A, et al. SARS-CoV-2 infection protects against rechallenge in rhesus macaques. Science. 2020;369(6505):812–817. doi: 10.1126/science.abc4776. [DOI] [PMC free article] [PubMed] [Google Scholar]
- 6.Xu J, et al. Systematic comparison of two animal-to-human transmitted human coronaviruses: SARS-CoV-2 and SARS-CoV. Viruses. 2020;12(2):E244. doi: 10.3390/v12020244. [DOI] [PMC free article] [PubMed] [Google Scholar]
- 7.Li CK, et al. T cell responses to whole SARS coronavirus in humans. J Immunol. 2008;181(8):5490–5500. doi: 10.4049/jimmunol.181.8.5490. [DOI] [PMC free article] [PubMed] [Google Scholar]
- 8.Ouyang Q, Wagner WM, Zheng W, Wikby A, Remarque EJ, Pawelec G. Dysfunctional CMV-specific CD8(+) T cells accumulate in the elderly. Exp Gerontol. 2004;39(4):607–613. doi: 10.1016/j.exger.2003.11.016. [DOI] [PubMed] [Google Scholar]
- 9.Zhao J, Zhao J, Perlman S. T cell responses are required for protection from clinical disease and for virus clearance in severe acute respiratory syndrome coronavirus-infected mice. J Virol. 2010;84(18):9318–9325. doi: 10.1128/JVI.01049-10. [DOI] [PMC free article] [PubMed] [Google Scholar]
- 10.Channappanavar R, Fett C, Zhao J, Meyerholz DK, Perlman S. Virus-specific memory CD8 T cells provide substantial protection from lethal severe acute respiratory syndrome coronavirus infection. J Virol. 2014;88(19):11034–11044. doi: 10.1128/JVI.01505-14. [DOI] [PMC free article] [PubMed] [Google Scholar]
- 11.Zhao J, et al. Airway memory CD4(+) T cells mediate protective immunity against emerging respiratory coronaviruses. Immunity. 2016;44(6):1379–1391. doi: 10.1016/j.immuni.2016.05.006. [DOI] [PMC free article] [PubMed] [Google Scholar]
- 12.Baruah V, Bose S. Immunoinformatics-aided identification of T cell and B cell epitopes in the surface glycoprotein of 2019-nCoV. J Med Virol. 2020;92(5):495–500. doi: 10.1002/jmv.25698. [DOI] [PMC free article] [PubMed] [Google Scholar]
- 13.Ahmed SF, Quadeer AA, McKay MR. Preliminary identification of potential vaccine targets for the COVID-19 coronavirus (SARS-CoV-2) based on SARS-CoV immunological studies. Viruses. 2020;12(3):E254. doi: 10.3390/v12030254. [DOI] [PMC free article] [PubMed] [Google Scholar]
- 14.Grifoni A, Sidney J, Zhang Y, Scheuermann RH, Peters B, Sette A. A sequence homology and bioinformatic approach can predict candidate targets for immune responses to SARS-CoV-2. Cell Host Microbe. 2020;27(4):671–680.e2. doi: 10.1016/j.chom.2020.03.002. [DOI] [PMC free article] [PubMed] [Google Scholar]
- 15.Kiyotani K, Toyoshima Y, Nemoto K, Nakamura Y. Bioinformatic prediction of potential T cell epitopes for SARS-Cov-2. J Hum Genet. 2020;65(7):569–575. doi: 10.1038/s10038-020-0771-5. [DOI] [PMC free article] [PubMed] [Google Scholar]
- 16.Betts MR, et al. Analysis of total human immunodeficiency virus (HIV)-specific CD4(+) and CD8(+) T-cell responses: relationship to viral load in untreated HIV infection. J Virol. 2001;75(24):11983–11991. doi: 10.1128/JVI.75.24.11983-11991.2001. [DOI] [PMC free article] [PubMed] [Google Scholar]
- 17.Weist BJ, Schmueck M, Fuehrer H, Sattler A, Reinke P, Babel N. The role of CD4(+) T cells in BKV-specific T cell immunity. Med Microbiol Immunol. 2014;203(6):395–408. doi: 10.1007/s00430-014-0348-z. [DOI] [PubMed] [Google Scholar]
- 18.Llewelyn M, Sriskandan S, Terrazzini N, Cohen J, Altmann DM. The TCR Vbeta signature of bacterial superantigens spreads with stimulus strength. Int Immunol. 2006;18(10):1433–1441. doi: 10.1093/intimm/dxl076. [DOI] [PubMed] [Google Scholar]
- 19.Diao B, et al. Reduction and functional exhaustion of T cells in patients with coronavirus disease 2019 (COVID-19) Front Immunol. 2020;11:827. doi: 10.3389/fimmu.2020.00827. [DOI] [PMC free article] [PubMed] [Google Scholar]
- 20.Chen G, et al. Clinical and immunological features of severe and moderate coronavirus disease 2019. J Clin Invest. 2020;130(5):2620–2629. doi: 10.1172/JCI137244. [DOI] [PMC free article] [PubMed] [Google Scholar]
- 21.Mazzoni A, et al. Impaired immune cell cytotoxicity in severe COVID-19 is IL-6 dependent. J Clin Invest. 2020;130(9):4694–4703. doi: 10.1172/JCI138554. [DOI] [PMC free article] [PubMed] [Google Scholar]
- 22.Zhou F, et al. Clinical course and risk factors for mortality of adult inpatients with COVID-19 in Wuhan, China: a retrospective cohort study. Lancet. 2020;395(10229):1054–1062. doi: 10.1016/S0140-6736(20)30566-3. [DOI] [PMC free article] [PubMed] [Google Scholar]
- 23.Grifoni A, et al. Targets of T cell responses to SARS-CoV-2 coronavirus in humans with COVID-19 disease and unexposed individuals. Cell. 2020;181(7):1489–1501.e15. doi: 10.1016/j.cell.2020.05.015. [DOI] [PMC free article] [PubMed] [Google Scholar]
- 24. doi: 10.1126/science.abd3871. Mateus J, et al. Selective cross-reactive SARS-CoV-2 T cell epitopes in unexposed humans [published online August 4, 2020]. Science . [DOI] [PMC free article] [PubMed]
- 25.Chen J, et al. Cellular immune responses to severe acute respiratory syndrome coronavirus (SARS-CoV) infection in senescent BALB/c mice: CD4+ T cells are important in control of SARS-CoV infection. J Virol. 2010;84(3):1289–1301. doi: 10.1128/JVI.01281-09. [DOI] [PMC free article] [PubMed] [Google Scholar]
- 26.Rea IM, Gibson DS, McGilligan V, McNerlan SE, Alexander HD, Ross OA. Age and age-related diseases: role of inflammation triggers and cytokines. Front Immunol. 2018;9:586. doi: 10.3389/fimmu.2018.00586. [DOI] [PMC free article] [PubMed] [Google Scholar]
- 27.Jin YH, Hou W, Kang HS, Koh CS, Kim BS. The role of interleukin-6 in the expression of PD-1 and PDL-1 on central nervous system cells following infection with Theiler’s murine encephalomyelitis virus. J Virol. 2013;87(21):11538–11551. doi: 10.1128/JVI.01967-13. [DOI] [PMC free article] [PubMed] [Google Scholar]
- 28.Molony RD, Malawista A, Montgomery RR. Reduced dynamic range of antiviral innate immune responses in aging. Exp Gerontol. 2018;107:130–135. doi: 10.1016/j.exger.2017.08.019. [DOI] [PMC free article] [PubMed] [Google Scholar]
- 29.Hashimoto K, et al. Single-cell transcriptomics reveals expansion of cytotoxic CD4 T cells in supercentenarians. Proc Natl Acad Sci U S A. 2019;116(48):24242–24251. doi: 10.1073/pnas.1907883116. [DOI] [PMC free article] [PubMed] [Google Scholar]
- 30.Pourgheysari B, Khan N, Best D, Bruton R, Nayak L, Moss PA. The cytomegalovirus-specific CD4+ T-cell response expands with age and markedly alters the CD4+ T-cell repertoire. J Virol. 2007;81(14):7759–7765. doi: 10.1128/JVI.01262-06. [DOI] [PMC free article] [PubMed] [Google Scholar]
- 31.Hassouneh F, et al. Differential effect of cytomegalovirus infection with age on the expression of CD57, CD300a, and CD161 on T-cell subpopulations. Front Immunol. 2017;8:649. doi: 10.3389/fimmu.2017.00649. [DOI] [PMC free article] [PubMed] [Google Scholar]
- 32.Hegeman MA, et al. Ventilator-induced endothelial activation and inflammation in the lung and distal organs. Crit Care. 2009;13(6):R182. doi: 10.1186/cc8168. [DOI] [PMC free article] [PubMed] [Google Scholar]
- 33.Dhanireddy S, et al. Mechanical ventilation induces inflammation, lung injury, and extra-pulmonary organ dysfunction in experimental pneumonia. Lab Invest. 2006;86(8):790–799. doi: 10.1038/labinvest.3700440. [DOI] [PubMed] [Google Scholar]
- 34.Spec A, et al. T cells from patients with Candida sepsis display a suppressive immunophenotype. Crit Care. 2016;20:15. doi: 10.1186/s13054-016-1182-z. [DOI] [PMC free article] [PubMed] [Google Scholar]
- 35.Boomer JS, et al. Immunosuppression in patients who die of sepsis and multiple organ failure. JAMA. 2011;306(23):2594–2605. doi: 10.1001/jama.2011.1829. [DOI] [PMC free article] [PubMed] [Google Scholar]
- 36.Jamilloux Y, et al. Should we stimulate or suppress immune responses in COVID-19? Cytokine and anti-cytokine interventions. Autoimmun Rev. 2020;19(7):102567. doi: 10.1016/j.autrev.2020.102567. [DOI] [PMC free article] [PubMed] [Google Scholar]
- 37.Bersanelli M. Controversies about COVID-19 and anticancer treatment with immune checkpoint inhibitors. Immunotherapy. 2020;12(5):269–273. doi: 10.2217/imt-2020-0067. [DOI] [PMC free article] [PubMed] [Google Scholar]
- 38.Redeker A, et al. The quantity of autocrine IL-2 governs the expansion potential of CD8+ T cells. J Immunol. 2015;195(10):4792–4801. doi: 10.4049/jimmunol.1501083. [DOI] [PubMed] [Google Scholar]
- 39.Akondy RS, et al. Initial viral load determines the magnitude of the human CD8 T cell response to yellow fever vaccination. Proc Natl Acad Sci U S A. 2015;112(10):3050–3055. doi: 10.1073/pnas.1500475112. [DOI] [PMC free article] [PubMed] [Google Scholar]
- 40.To KK, et al. Temporal profiles of viral load in posterior oropharyngeal saliva samples and serum antibody responses during infection by SARS-CoV-2: an observational cohort study. Lancet Infect Dis. 2020;20(5):565–574. doi: 10.1016/S1473-3099(20)30196-1. [DOI] [PMC free article] [PubMed] [Google Scholar]
- 41.Zheng S, et al. Viral load dynamics and disease severity in patients infected with SARS-CoV-2 in Zhejiang province, China, January-March 2020: retrospective cohort study. BMJ. 2020;369:m1443. doi: 10.1136/bmj.m1443. [DOI] [PMC free article] [PubMed] [Google Scholar]
- 42.Porichis F, et al. Differential impact of PD-1 and/or interleukin-10 blockade on HIV-1-specific CD4 T cell and antigen-presenting cell functions. J Virol. 2014;88(5):2508–2518. doi: 10.1128/JVI.02034-13. [DOI] [PMC free article] [PubMed] [Google Scholar]
- 43.Yang LT, et al. Long-lived effector/central memory T-cell responses to severe acute respiratory syndrome coronavirus (SARS-CoV) S antigen in recovered SARS patients. Clin Immunol. 2006;120(2):171–178. doi: 10.1016/j.clim.2006.05.002. [DOI] [PMC free article] [PubMed] [Google Scholar]
- 44.Li Q, et al. A simple algorithm helps early identification of SARS-CoV-2 infection patients with severe progression tendency. Infection. 2020;48(4):577–584. doi: 10.1007/s15010-020-01446-z. [DOI] [PMC free article] [PubMed] [Google Scholar]
- 45.Hulgan T, et al. Absolute count and percentage of CD4+ lymphocytes are independent predictors of disease progression in HIV-infected persons initiating highly active antiretroviral therapy. J Infect Dis. 2007;195(3):425–431. doi: 10.1086/510536. [DOI] [PubMed] [Google Scholar]
- 46.Pirzada Y, Khuder S, Donabedian H. Predicting AIDS-related events using CD4 percentage or CD4 absolute counts. AIDS Res Ther. 2006;3:20. doi: 10.1186/1742-6405-3-20. [DOI] [PMC free article] [PubMed] [Google Scholar]
- 47.Deyo RA, Cherkin DC, Ciol MA. Adapting a clinical comorbidity index for use with ICD-9-CM administrative databases. J Clin Epidemiol. 1992;45(6):613–619. doi: 10.1016/0895-4356(92)90133-8. [DOI] [PubMed] [Google Scholar]
- 48.Fine MJ, et al. A prediction rule to identify low-risk patients with community-acquired pneumonia. N Engl J Med. 1997;336(4):243–250. doi: 10.1056/NEJM199701233360402. [DOI] [PubMed] [Google Scholar]
- 49.Knaus WA, Draper EA, Wagner DP, Zimmerman JE. APACHE II: a severity of disease classification system. Crit Care Med. 1985;13(10):818–829. doi: 10.1097/00003246-198510000-00009. [DOI] [PubMed] [Google Scholar]
- 50.Vincent JL, et al. The SOFA (sepsis-related organ failure assessment) score to describe organ dysfunction/failure. On behalf of the Working Group on Sepsis-Related Problems of the European Society of Intensive Care Medicine. Intensive Care Med. 1996;22(7):707–710. doi: 10.1007/BF01709751. [DOI] [PubMed] [Google Scholar]
- 51.Le Gall JR, Lemeshow S, Saulnier F. A new simplified acute physiology score (SAPS II) based on a European/North American multicenter study. JAMA. 1993;270(24):2957–2963. doi: 10.1001/jama.270.24.2957. [DOI] [PubMed] [Google Scholar]
- 52.Kurth F, et al. Studying the pathophysiology of coronavirus disease 2019: a protocol for the Berlin prospective COVID-19 patient cohort (Pa-COVID-19) Infection. 2020;48(4):619–626. doi: 10.1007/s15010-020-01464-x. [DOI] [PMC free article] [PubMed] [Google Scholar]
Associated Data
This section collects any data citations, data availability statements, or supplementary materials included in this article.


