

Abstract
Diabetes is associated with increased mortality from severe acute respiratory syndrome coronavirus-2 (SARS-CoV-2). Given literature suggesting a potential association between SARS-CoV-2 infection and diabetes induction, we examined pancreatic expression of angiotensin-converting enzyme 2 (ACE2), the key entry factor for SARS-CoV-2 infection. Specifically, we analyzed five public scRNA-seq pancreas datasets and performed fluorescence in situ hybridization, western blotting, and immunolocalization for ACE2 with extensive reagent validation on normal human pancreatic tissues across the lifespan, as well as those from coronavirus disease 2019 (COVID-19) cases. These in silico and ex vivo analyses demonstrated prominent expression of ACE2 in pancreatic ductal epithelium and microvasculature, but we found rare endocrine cell expression at the mRNA level. Pancreata from individuals with COVID-19 demonstrated multiple thrombotic lesions with SARS-CoV-2 nucleocapsid protein expression that was primarily limited to ducts. These results suggest SARS-CoV-2 infection of pancreatic endocrine cells, via ACE2, is an unlikely central pathogenic feature of COVID-19-related diabetes.
Keywords: SARS-CoV-2, COVID-19, type 1 diabetes, type 2 diabetes, pancreas, ACE2, TMPRSS2, islet, CD34, insulin
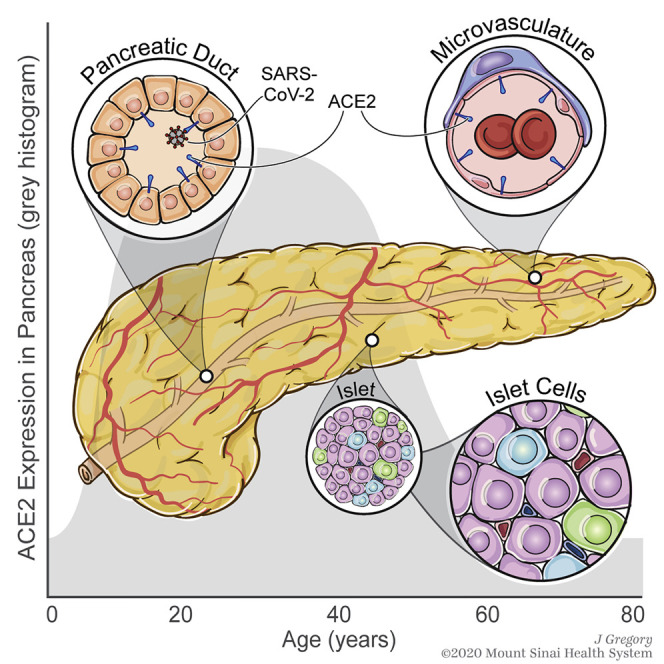
Graphical Abstract
Highlights
-
•
ACE2 mRNA and protein are expressed in human pancreatic ducts and microvasculature
-
•
ACE2 mRNA was rarely detected and at low levels in human pancreatic endocrine cells
-
•
Pancreatic ACE2 protein expression changes across the lifespan and correlates with BMI
-
•
SARS-CoV-2 NP was detected in ducts, but not endocrine cells, of COVID-19 pancreata
Kusmartseva et al. demonstrate preferential ACE2 expression in pancreatic microvascular and ductal structures, suggesting these constitute a more likely target than islet endocrine cells in SARS-CoV-2 infection. This notion was supported by detection of SARS-CoV-2 nucleocapsid protein in ductal epithelium, but not endocrine cells, of pancreata from individuals with COVID-19.
Introduction
The coronavirus disease 2019 (COVID-19) pandemic caused by severe acute respiratory syndrome coronavirus-2 (SARS-CoV-2) has created a global healthcare crisis (Mercatelli and Giorgi, 2020). With infections continuing to rise in many countries and the potential for continuing viral persistence in the absence of a vaccine, there is an urgent need to better understand SARS-CoV-2-mediated pathology. Key to this are efforts examining human tissues potentially susceptible to infection.
While initial reports primarily focused on pulmonary and cardiovascular manifestations, other organs including the kidney, brain, and intestines, as well as the pancreas, have since been noted as affected by this disorder’s pathophysiology (Connors and Levy, 2020; Fox et al., 2020; Hanley et al., 2020; Lee et al., 2020b; Liu et al., 2020; Menter et al., 2020; Rapkiewicz et al., 2020; Varga et al., 2020; Wang et al., 2020; Wichmann et al., 2020). Indeed, recent reports have raised the question of whether SARS-CoV-2 might infect the pancreas and possibly potentiate or exacerbate diabetes in either of its predominant forms, type 1 or type 2 diabetes (T1D or T2D, respectively). These studies noted elevated serum levels of the exocrine pancreatic enzymes, amylase and lipase, as well as development or worsening of hyperglycemia in SARS-CoV-2-positive individuals (Wang et al., 2020), high prevalence of diabetic ketoacidosis in people hospitalized with COVID-19 (Goldman et al., 2020; Li et al., 2020), and increased COVID-19-induced mortality in those with T1D and T2D (Barron et al., 2020; Holman et al., 2020). Reports also include increased incidence of new-onset T1D in specific geographic clusters (Unsworth et al., 2020), case reports linking the timing of T1D onset to COVID-19 (Marchand et al., 2020), and pancreatic expression of angiotensin-converting enzyme 2 (ACE2) through which SARS-CoV-2 could gain access to cells (Chen and Hao, 2020), potentially including insulin-producing β cells (Lee et al., 2020b; Yang et al., 2020). Such reports have collectively led to the hypothesis that SARS-CoV-2 expression in β cells may potentiate or exacerbate T1D or T2D. However, ACE2 expression in the human pancreas is only partially characterized, with conflicting results in both the endocrine and exocrine compartments (Fignani et al., 2020; Hikmet et al., 2020; Lee et al., 2020b; Yang et al., 2010, 2020). Indeed, the most cited report (Yang et al., 2010) utilized a single unspecified antibody, was limited in the number of tissue samples and cases, and lacked reagent validation.
To better understand the potential impact of SARS-CoV-2 on diabetes, we performed an extensive investigation of the human pancreas, with particular focus on its endocrine component, the islet of Langerhans. Specifically, we carried out an integration analysis of publicly available single-cell RNA sequencing (scRNA-seq) data from isolated human islets, coupled these findings with direct visualization of gene and protein expression of ACE2 using single molecular fluorescence in situ hybridization (smFISH), chromogen-based immunohistochemistry (IHC), and multicolor immunofluorescence (IF) in human tissue. Importantly, we employed a multi-center approach to the selection, testing, and validation of four commercially available ACE2 antibodies by IHC and immunoblot using known ACE2-positive tissues in addition to the pancreas. Finally, we analyzed SARS-CoV-2 nucleocapsid protein (NP) expression in autopsy-derived tissues from individuals with COVID-19 to assess whether the virus was detected in pancreatic islet endocrine cells.
Results and Discussion
ACE2 and TMPRSS2 Gene Expression Is Low in Human Pancreatic Endocrine Cells
Diabetes, obesity, and advanced age increase the risk of COVID-19 mortality (Zhou et al., 2020). Autopsy studies of individuals infected with SARS-CoV-2 demonstrate systemic viral dissemination with persistence in multiple organs, including the lungs and kidneys (Hanley et al., 2020; Liu et al., 2020; Menter et al., 2020; Wichmann et al., 2020), but there was an apparent limitation of pronounced inflammatory alterations to the lung and reticulo-endothelial system (Dorward et al., 2020). Recent studies (Barron et al., 2020; Fignani et al., 2020; Goldman et al., 2020; Holman et al., 2020; Li et al., 2020; Marchand et al., 2020; Unsworth et al., 2020; Wang et al., 2020) spurred interest in ACE2 expression in the pancreas, particularly the endocrine compartment, to address a potential relationship between diabetes and COVID-19, including the potential for either direct β cell infection or β cell damage via indirect mechanisms. To date, studies of ACE2 expression in the pancreas have been limited and contradictory, and analysis of autopsy specimens from COVID-19 cases have not been published, likely due to challenges associated with tissue procurement and post-mortem autolysis.
SARS-CoV-2 entry into cells via the ACE2 receptor requires S protein priming by the mucosal serine proteases (Lee et al., 2020b; Zang et al., 2020). We thus investigated expression patterns of ACE2 and several proteases linked with SARS-CoV-2 processing by conducting an integrated analysis of scRNA-seq data from five public datasets including 22 non-diabetic and 8 T2D individuals (Baron et al., 2016; Grün et al., 2016; Lawlor et al., 2017; Muraro et al., 2016; Segerstolpe et al., 2016). This analysis revealed a low frequency of ACE2-expressing cells and low ACE2 expression levels in the majority of islet cell subsets (Figures 1A and 1B). In islets from donors without diabetes, ACE2 was expressed in <2% of endocrine, endothelial, and select innate immune cells. ACE2 was detectable in 4.11% of acinar cells and 5.54% of ductal cells in non-diabetic donors as compared to 8.07% of acinar and 8.13% of ductal cells in donors with T2D (Figures 1A and 1B; Table S1). Expression levels of ACE2 were not different between non-diabetic donors and those with T2D in any of the islet cell subtypes (Figure 1A).
Figure 1.

SARS-CoV-2-Associated Gene Expression in Isolated Human Pancreatic Islets
(A) Bar graph showing the percentage of cells with detectable ACE2 in islets from pancreata of donors with (n = 2,705 cells) and without type 2 diabetes (n = 12,185 cells).
(B) Violin plot showing the distribution of ACE2 normalized expression in islet cells from pancreata of donors without diabetes.
(C) Bar graph showing the percentage of cells with detectable TMPRSS2 in islets isolated from pancreata of donors with (n = 2,705 cells) and without type 2 diabetes (n = 12,185 cells); ∗adjusted p < 0.05, paired Student’s t test for indicated comparisons.
(D) Violin plot showing the distribution of TMPRSS2 normalized expression in islets cells from pancreata of donors without diabetes; ∗∗∗adjusted p < 0.001, Wilcoxon rank-sum tests. Bonferroni corrections were used to adjust for multiple comparisons.
(E) Dot plot of ACE2 and TMPRSS2 expression compared with cell-type-enriched genes in islets from pancreata of donors without type 2 diabetes (n = 12,185 cells). The size of each dot indicates the percentage of cells in a given population expressing the indicated gene. The dot color represents the scaled average expression.
(F) Violin plot showing the relative expression of ACE2 and TMPRSS2 in islet α cells from pancreata of donors without diabetes (n = 3,770 cells) compared with select α cell-enriched genes.
(G)Violin plot showing the relative expression of ACE2 and TMPRSS2 in islet β cells from pancreata of donors without diabetes (n = 2,985 cells) compared with select β cell-enriched genes.
We next investigated the expression patterns of the serine protease TMPRSS2, which is thought to be the main serine protease required for SARS-CoV-2 infectivity. TMPRSS2 was detectable in 53.73% of acinar and 50.55% of ductal cells in donors without diabetes, and 71.43% of acinar and 58.74% of ductal cells in donors with T2D (Figure 1C; Table S1). Apart from α cells, which demonstrated 16.55% positivity in non-diabetic donors and 32.07% positivity in donors with T2D, TMPRSS2 expression was low in the majority of other endocrine cell subsets (Figure 1C). TMPRSS2 was detectable in 5.46% of β cells, and neither ACE2 nor TMPRSS2 expression differed significantly in β cells from non-diabetic versus T2D donors (Figures 1A, 1C, S1A, and S1B). TMPRSS2 showed higher relative expression levels in ductal and acinar cells compared to β cells (adjusted p = 1.31 × 10−291 and p < 1 × 10−300, respectively), and was detectable in an elevated proportion of these cells in non-diabetic donors (p < 0.05) (Figures 1C and 1D). The frequency and expression of ACE2 and TMPRSS2 relative to a subset of cellular identity marker genes across each of the analyzed cell populations highlight, in general, the low expression of ACE2 and TMPRSS2 across pancreatic cells (Figure 1E). We also analyzed ACE2 and TMPRSS2 levels relative to an expanded list of highly expressed genes in α and β cells, including GCG, TTR, SCG2, INS, IAPP, and PDX1 (Figures 1F and 1G).
Because the expression of ACE2 in combination with an associated protease appears to be required for cellular entry (Lee et al., 2020b; Zang et al., 2020), we calculated the percentage of each cell type that expressed both ACE2 and TMPRSS2. Notably, only 0.24% and 0.10% of α cells and β cells were positive for ACE2 and TMPRSS2 in islets from donors without diabetes, while no α or β cells from donors with T2D expressed both (Table S2). Fewer than 4% of acinar and ductal cells in donors without diabetes were positive for ACE2 and TMPRSS2, while co-expression was observed in 8.07% and 6.10% of acinar and ductal cells, respectively, in donors with T2D (Table S2).
We also investigated expression patterns for other SARS-CoV-2-associated proteases, including TMPRSS4, CTSL, ADAM17, and TMPRSS11D (Table S1; Figures S1C–S1H). In addition, we quantitated the percentage of cells that co-expressed ACE2 and each of these proteases (Table S2). TMPRSS4 was expressed in a similar proportion of α and β cells; however, relative expression levels tended to be low in the endocrine pancreas (Figures S1C and S1D). CTSL and ADAM17 were detected at higher levels in α and β cells (Figures S1E and S1F). The relative expression of TMPRSS11D was low in most cell types examined (Figure S1G). Within the β cells, only CTSL showed higher expression in donors with T2D compared to donors without diabetes (adjusted p = 8.94 × 10⁻³²; Figure S1H). Notably, less than 1% of β cells expressed ACE2 in combination with any of these identified proteases (Table S2).
To visualize ACE2 and TMPRSS2 mRNA expression patterns in situ, we used smFISH on non-diabetic, SARS-CoV-2-negative, “normal” human pancreata from seven donors across a wide age-span (Table S3) with duodenum, ileum, and kidney used as positive controls (Figures S2A and S2B). ACE2 mRNA was observed in pancreatic ducts, acinar tissue, and CD34+ endothelial cells (Figures 2A and 2B), but was observed to a much lesser extent in the islet endocrine cells (Figure 2C). TMPRSS2 mRNA showed a similar pattern but was expressed at higher frequency (Figure 2). We observed limited expression of TMPRSS2 and/or ACE2 in insulin-positive β cells (Figure 2C, inset), which was consistent with quantification of ACE2 and TMPRSS2 expression and co-expression from scRNA-seq data (Table S2). smFISH analysis of other SARS-CoV-2-associated proteases revealed TMPRSS4 mRNA in the exocrine pancreas, with rare TMPRSS4 expression within the islet, while CTSL, ADAM17, and TMPRSS11D expression was observed in both the endocrine and exocrine pancreas (Figures S2C–S2F).
Figure 2.

Single Molecular Fluorescent In Situ Hybridization-Based Validation of SARS-CoV-2-Associated Gene Expression in Human Pancreas
(A) Representative images of smFISH for ACE2 and TMPRSS2 mRNA in human pancreatic tissue sections counterstained for insulin. Inset highlights mRNA distribution in pancreatic ducts; scale bars, 20 μm. The lower image is high magnification of the boxed region in the merged panel.
(B) Representative smFISH images showing the presence of ACE2 and TMPRSS2 in CD34-positive cells in human pancreatic tissue sections; scale bars, 10 μm. The lower image is high magnification of the boxed region in the merged panel.
(C) Representative images of smFISH for ACE2 and TMPRSS2 mRNA in human pancreatic tissue sections counterstained for insulin. Inset highlights distribution in the endocrine pancreas; scale bars, 20 μm. The lower image is high magnification of the boxed region in the merged panel.
Related to Figure S2.
Extensive Reagent Validation Confirms High Level of ACE2 Protein Expression in the Human Pancreas
Information regarding ACE2 protein expression in pancreatic tissue sections remains limited and unfortunately contradictory. A 2010 study on SARS-CoV and its relationship with diabetes interrogated ACE2 expression in a single donor (43 years of age), with an unspecified antibody, and reported weak ACE2 staining in exocrine tissues but pronounced expression in pancreatic islets (Yang et al., 2010). Fignani et al. (2020) recently described heterogenous ACE2 expression across donors, pancreatic lobes, and islets, and identified three main ACE2-expressing cell types in formalin fixed, paraffin embedded (FFPE) pancreatic sections from seven donors (aged 22–59 years) probed with three ACE2 antibodies (MAB933, ab15348, and ab108252): endothelial cells and pericytes, ductal cells, and in an analysis of 128 islets, β cells that often presented with a granular staining pattern, partially overlapping with insulin. In contrast, an analysis of tissue microarrays containing pancreatic FFPE sections from 10 donors (aged 30–79 years) utilizing two ACE2 antibodies (MAB933 and HPA000288) reported ACE2 expression restricted to endothelial cells and pericytes and interlobular ducts while ACE2 was not detectable in islets, acinar glandular cells, intercalated ducts, or intralobular ducts (Hikmet et al., 2020). This study, together with a publicly available preprint employing six ACE2 antibodies (Lee et al., 2020a), is noteworthy for the broad range of major human tissues and organs investigated as well as the delineation of mostly shared but, also, some distinctive ACE2 antibody staining properties. In light of these diverging observations, it is imperative to utilize multiple ACE2 antibodies on larger donor cohorts to gather a comprehensive description of ACE2 expression in the pancreas.
We selected four widely referenced, commercially available antibodies recognizing specific epitopes and both the short and long isoforms of the ACE2 protein (Figure 3 A) (Blume et al., 2020; Ng et al., 2020; Onabajo et al., 2020) to evaluate by immunoblot (Figures 3B, S3A, and S3B) using protein extracts from three non-diabetic, SARS-CoV-2-negative, “normal” pancreas donors (Table S3). ACE2 is an 805 amino acid protein (UniProt Q9BYF1) with a theoretical molecular mass of 94.2 kDa but an actual mass of ∼120 kDa due to glycosylation at N terminus sites (Tipnis et al., 2000). Accordingly, a pronounced ∼120 kDa band was readily visualized by AF933 and ab108252 while ab15348 and especially MAB933 revealed a much weaker band (Figures 3B and S3A). Nevertheless, in our efforts, all four antibodies demonstrated robust and essentially commensurate staining in human duodenum and kidney FFPE sections (Figure S3C), consistent with two recent reports (Hikmet et al., 2020; Lee et al., 2020a).
Figure 3.

ACE2 Protein Is Readily Detected in Normal Human Pancreas with Its Expression Largely Restricted to Ductal and Microvascular Structures
(A) ACE2 protein structure illustrating the location of respective antibody directed antigen sites. SP, signal peptide; TM, transmembrane domain; CD, cytoplasmic domain.
(B) Immunoblot analysis of four commercially available ACE2 antibodies using total pancreas lysates from three control organ donors (p1–p3) with accompanying Actin labeling. 120 and 37 indicate the molecular weight (in kDa) of ACE2 and Actin, respectively.
(C) Representative IHC images of human pancreas tissue sections stained for ACE2 and insulin using four commercially available ACE2 antibodies. Scale bars, 200 μm. d, duct; mv, microvasculature.
Related to Table S3 and Figures S3 and S4.
We next visualized ACE2 via chromogen-based IHC in FFPE pancreata from non-diabetic, SARS-CoV-2-negative, “normal” donors using all four antibodies and consistently observed positive staining in the microvasculature and ductal epithelium (Figure 3C). To further validate specificity, we utilized a peptide-blocking assay wherein ab108252 was pre-incubated with an ACE2 peptide prior to IHC staining (Figure S3D). Taking western blot and IHC validation into account, ab108252 produced a clearly detectable 120 kDa band (Figures 3B and S3A) and crisp in situ staining (Figures 3C and S3C) that was completely blocked by pre-incubation with the ACE2 peptide (Figure S3D). This is a monoclonal antibody, which offers a high degree of specificity and consistency between lots. Hence, we elected to use ab108252 in subsequent IHC and IF assays.
Human Pancreatic Expression of ACE2 Protein Is Primarily Detected in the Duct Epithelium and Microvasculature Across the Lifespan and Positively Associated with Obesity
To quantitatively evaluate pancreatic ACE2 protein expression, an FFPE tissue cross-section from each of 36 SARS-CoV-2-negative donors without diabetes (aged 0–72 years; Table S3) was stained for insulin and ACE2 (ab108252) and scanned to produce a whole-slide image. Co-localization of ACE2 protein with insulin was not observed (Figures 3C and S4A). The tissue area staining positive for ACE2 was analyzed using the HALO area quantification algorithm (Figure 4 A). Body mass index (BMI)-matched donors were binned into six age groups: neonate (0–0.25 years, n = 6), infant and toddler (0.25–2 years, n = 6), child (2–11 years, n = 6), adolescent (11–15 years, n = 6), young adult (20–33 years, n = 6), and senior adult (51–72 years, n = 6). Collectively, these data demonstrated the percentage of tissue staining positive for ACE2 increased steadily from birth throughout childhood, peaking in adolescence and maintained through early adulthood, followed by a decline in persons over 50 years of age (Figure 4B). The ACE2-positive area did not appear different for male versus female subjects (Figure 4B), but with n = 6 per age group, statistical analysis was not performed and will be the subject of future efforts.
Figure 4.

ACE2 Protein Expression Is Evident in Normal Pancreata throughout the Human Lifespan and Correlates with BMI
(A) Scheme of the experimental setup illustrating human pancreatic tissue processing, whole-stained slide imaging, and machine learning algorithm application for the generation of ACE2 protein expression data.
(B) Quantification of ACE2 protein expression in the pancreas of male (blue) and female (orange) control organ donors with ages ranging from birth to 72 years shows progressive developmental changes. Data were analyzed by one-way ANOVA and Tukey’s post hoc test for multiple comparisons and are presented as a percentage, ∗p < 0.05.
(C) Quantification of ACE2 protein expression in the pancreas of male (blue) and female (orange) control organ donors with BMI ranging from normal to obese; r = 0.81, n = 22, p < 0.001.
(D) Representative confocal images (from n = 14) of ACE2 protein expression in pancreatic ducts of control donors across the different age groups indicated. Scale bars (left to right), 100, 200, 200, 300, 300, and 300 μm.
(E) Representative immunofluorescence images (n = 14) show ACE2 protein expression in pancreatic microvasculature from control donors across different age groups. Scale bars, 100 μm.
(F) Representative immunofluorescence images (n = 14) of pancreatic islets showing ACE2 protein expression restricted to the islet’s microvasculature in pancreata from control organ donors across different age groups. Scale bars, 50 μm.
Obesity is associated with an increased risk of COVID-19-associated morbidity and mortality (Hussain et al., 2020; Nakeshbandi et al., 2020; Tartof et al., 2020). Taneera et al. (2020) observed no relationship between ACE2 and BMI in isolated pancreatic islets analyzed by microarray. To analyze this in situ, we examined ACE2 protein expression in the aforementioned six young adult donors together with pancreata from 16 additional donors (20–33 years of age, SARS-CoV-2 negative, no diabetes, for a total n = 22) with BMI ranging from normal (19.5 kg/m2) to obese (35.6 kg/m2) (Table S3). Notably, we observed a positive correlation between ACE2-positive area and BMI (Figure 4C).
To more precisely visualize pancreatic ACE2 localization, we performed IF staining for ACE2 (again using ab108252) in conjunction with insulin and glucagon (Figures 4D–4F and S4B) or with CD34 (Figure S4C). Across all ages, we observed ACE2 expression in the pancreatic ductal epithelium (Figure 4D), but not major blood vessels (Figure S4B), based on their morphology and geographic positioning. ACE2 was highly expressed in the microvasculature within acinar and islet regions, with no evidence of α cells or β cells expressing ACE2 protein (Figures 4E, 4F, S4A, and S4C). Our data corroborate findings by two groups (Coate et al., 2020; Hikmet et al., 2020), yet contrast with two others (Fignani et al., 2020; Yang et al., 2010). Moreover, our IHC analyses do not support the notion that islet endocrine cells may preferentially express a recently described short ACE2 isoform (Fignani et al., 2020). Beyond this, we note that this isoform lacks the SARS-CoV-2-binding domain (Blume et al., 2020; Ng et al., 2020; Onabajo et al., 2020) and, thus, would not render endocrine cells susceptible to infection. These disparate results may be influenced by technical (e.g., tissue processing, antigen retrieval, reagent), material (e.g., isolated islets versus tissue sections), or donor differences. However, in aggregate, our analysis of 52 donors across a wide age and BMI range provides a comprehensive perspective on pancreatic ACE2 protein distribution that demonstrates limited to no ACE2 expression by pancreatic endocrine cell types, including β cells (Figures 3 and 4), corroborating scRNA-seq and smFISH gene expression data (Figures 1 and 2).
SARS-CoV-2 NP Is Localized to Pancreatic Ductal Epithelium from COVID-19 Cases With and Without T2D
Following autopsy, we reviewed pancreatic pathology by H&E-stained sections in three individuals with fatal COVID-19 (aged 45–72 years; Figures 5A–5C), two of whom had a previous diagnosis of T2D (Table S4). Case 1 was an individual without history of diabetes. The major findings included severe fatty replacement of acinar cell mass and moderate arteriosclerosis (Figure 5A). Lobules contained fibrotic centers with residual acinar cells and islets surrounding ductules (Figure 5A, insert). Islets were observed primarily within fibrotic regions. Case 2 was an individual with T2D whose pancreas had moderate fatty replacement and limited centrolobular fibrosis (Figure 5B). Dystrophic calcification of adipocytes was rare. We observed numerous islets and one microthrombus without adjacent hemorrhage (Figure 5B, insert). The pancreas of another individual with T2D (Case 3) showed mild to moderate arteriosclerosis with acinar regions containing mild centrolobular fibrosis (Figure 5C). Moderate numbers of islets were present of varying sizes (Figure 5C, insert). None of these individuals showed islet amyloidosis or acute polymorphonuclear cell infiltrates. These histopathological findings were compatible with the normal range of expected lesions within the exocrine compartment in pancreata from aged persons and those with T2D.
Figure 5.

Pathological Changes in Pancreata of Individuals with COVID-19
(A) Pancreas tissue section from COVID-19 Case 1 stained for H&E. Inset highlights fibrotic center with residual acinar cells and islet surrounding ductules. Scale bars, 3 mm; inset, 200 μm.
(B) Pancreas tissue section from COVID-19 Case 2 stained for H&E. Inset highlights microthrombus without adjacent hemorrhages. Scale bars, 3 mm; inset, 200 μm.
(C) Pancreas tissue section of COVID-19 Case 3 stained for H&E. Inset highlights a large, irregularly shaped pancreatic islet surrounded by fibrotic tissue. Scale bars, 3 mm; inset, 200 μm.
(D) Representative pancreas tissue sections from three COVID-19 cases stained for ACE2, insulin (INS), and glucagon (GCG). Scale bars, 200 μm.
(E) SARS-CoV-2 NP observed in intralobular ducts (d) near an islet in the pancreas of COVID-19 Case 1. Scale bars, 10 μm.
(F) Representative image of multiple ducts showing SARS-CoV-2 NP positivity in the pancreas of COVID-19 Case 1. d; duct. Scale bar, 20 μm.
Related to Table S4 and Figures S5C and S5D.
IHC showed islets containing insulin-positive (INS+) β cells with mostly spherical profiles, small to medium sizes, and varying proportions of β to α cells in all three cases (Figure 5D). We observed numerous single and clustered INS+ and glucagon-positive (GCG+) cells in ductules of fibrotic foci. The endothelium showed moderate ACE2 staining intensity within both endocrine and exocrine compartments. The ductal epithelium showed low to moderate ACE2 staining intensity throughout the cytoplasm (Figure S5A), similar to that observed in non-diabetic pancreas donors (Figure 3C).
IHC for SARS-CoV-2 NP was also conducted to investigate the cellular distribution of the virus. A lung sample from a person with COVID-19 pneumonia was used to optimize staining conditions. Immunopositive alveolar epithelial cells and macrophages were observed with numerous viral inclusions (Figure S5B). In COVID-19 Case 1, SARS-CoV-2 NP was present in some intralobular and interlobular ductal epithelial cells shown near an islet and widely scattered throughout the exocrine regions (Figures 5E, 5F, S5C, and S5D). Pancreata from Cases 2 and 3, who had T2D, showed little to no immunopositivity for SARS-CoV-2 NP.
We believe these data provide an important foundation for considerations of pancreatic SARS-CoV-2 infection as a potential trigger for diabetes. Indeed, the notion of ACE2 expression on pancreatic β cells as a potential mechanism linking the two conditions may, in our view, promote a quasi-dogmatic perspective (Koch et al., 2020) that is grounded in limited experimental evidence (Yang et al., 2010). However, the histopathology data presented herein do not support a simple model of direct and widespread islet endocrine, including β cell infection via the ACE2 receptor. Rather, preferential ACE2 gene and protein expression in microvascular and ductal structures suggests these cells constitute a more likely target for viral infection, a notion that is in principle supported by our observation of very limited SARS-CoV-2 NP expression in ductal epithelium, but not islet endocrine cells, of pancreata from individuals with COVID-19. While scarce ACE2 protein expression and limited SARS-CoV-2 propagation, as most recently documented for the lung (Hönzke et al., 2020), do not preclude extensive tissue damage mediated by innate immune responses in particular, the absence of polymorphonuclear infiltrations in the three COVID-19 pancreata interrogated here indicates a very limited degree of inflammation consistent with that reported for many tissues other than the lung and reticulo-endothelial system (Dorward et al., 2020). More detailed investigations of pancreatic tissue from fatal COVID-19 cases, to date a very limited resource, will be necessary to answer outstanding questions about the potential pathological involvement of the pancreas in COVID-19.
Limitations of Study
Our delineation, localization, and quantification of pancreatic ACE2 is largely based on in silico and ex vivo in situ analyses of gene (public scRNA-seq data, smFISH) and protein (IHC, IF) expression in pancreata of a broad cohort of organ donors without diabetes and a more limited number of organs collected from COVID-19 autopsy subjects. As such, our pancreatic tissue analyses can only provide approximate predictions regarding ACE2 protein expression in isolated islets and islet cells or their susceptibility to in vitro SARS-CoV-2 infection. Although the aggregate scRNA-seq data demonstrate relatively little ACE2 mRNA in endocrine cells, Yang et al., in a wide-ranging report on the development of a stem cell-based platform for SARS-CoV-2 infection studies, recently demonstrated both ACE2 protein expression by endocrine cells in isolated human islets and their productive infection with SARS-CoV-2 (Yang et al., 2020). Without question and in addition to stem cell-derived endocrine cells and islet organoids, isolated human islets constitute an important model system for research discovery. Further work will be needed to precisely quantify the fractions and expression levels of ACE2 by islet endocrine cells in these islet preparations, to evaluate possible modulation of ACE2 by the prolonged and varied islet handling requirements (e.g., isolation, culture under different conditions, dispersion), to define the exact role of ACE2 in mediating SARS-CoV-2 infection in vitro and in vivo using extended islet xenotransplantation approaches, and to interrogate the precise relation of scarce ACE2 expression and immunopathology as most recently demonstrated for the lung in a manuscript available for public review (Hönzke et al., 2020). Beyond this, contrasting epidemiological reports from the United Kingdom and Germany (Tittel et al., 2020; Unsworth et al., 2020) not only underscore the requirement for data on diabetes incidence and SARS-CoV-2 infection rates in defined populations over time, but in addition raise the need for studying pancreatic tissues from donor cohorts of different demographics, ethnicities, and geographic populations. Indeed, it is possible that COVID-19 may cause an upregulation of ACE2 in endocrine or other cell types, but as of yet, gene and protein expression levels cannot be reliably quantified from autopsy tissues due to pancreatic autolysis and the relative scarcity of high-quality pancreas tissues obtained from SARS-CoV-2-infected individuals. Only in the larger context of expanded investigations into pancreatic histopathology of individuals with COVID-19, with carefully controlled in vitro infection studies, judicious use of animal models to directly test the ability of SARS-CoV-2 to infect the endocrine pancreas, and crucially, a balanced assessment of emerging and future epidemiological studies (DiMeglio et al., 2020) can we provide a complete framework for an informed assessment of diabetes risk and potential prevention in the wake of SARS-CoV-2 infection.
STAR★Methods
Key Resources Table
| REAGENT or RESOURCE | SOURCE | IDENTIFIER |
|---|---|---|
| Antibodies | ||
| Rabbit monoclonal IgG anti-ACE2 (clone EPR4435(2)) | Abcam | Cat# ab108252; RRID: AB_10864415 |
| Rabbit polyclonal anti-ACE2 | Abcam | Cat# ab15348; RRID: AB_301861 |
| Mouse monoclonal IgG2A anti-human ACE2 (clone 171606) | R&D Systems | Cat# MAB933; RRID: AB_2223153 |
| Goat polyclonal anti-human ACE2 | R&D Systems | Cat# AF933; RRID: AB_355722 |
| Biotinylated goat anti-rabbit IgG | Vector Laboratories | Cat# BA-1000; RRID: AB_2313606 |
| Biotinylated horse anti-mouse IgG (H+L) | Vector Laboratories | Cat# BA-2000; RRID: AB_2313581 |
| Biotinylated rabbit anti-goat IgG (H+L) | Vector Laboratories | Cat# BA-5000; RRID: AB_2336126 |
| Mouse monoclonal IgG1k anti-CD34 (clone QBEnd/10) | Novus Biologicals | Cat# NBP2-32932; RRID: AB_2861355 |
| Rabbit monoclonal IgG anti-insulin (clone EPR17359) | Abcam | Cat# ab181547; RRID: AB_2716761 |
| FLEX guinea pig polyclonal anti-insulin, ready-to-use antibody | Agilent | Cat# IR002; RRID: AB_2800361 |
| Mouse monoclonal IgG1k anti-cytokeratin 19 (clone RCK108) | Agilent | Cat# M0888; RRID: AB_2234418 |
| Goat anti-rabbit IgG (H+L), Alexa Fluor 594 | Invitrogen | Cat# A-11037; RRID: AB_2534095 |
| Goat anti-mouse IgG (H+L), Alexa Fluor 488 | Invitrogen | Cat# A-11029; RRID: AB_2534088 |
| Goat anti-rabbit IgG (H+L), Alexa Fluor 555 | Invitrogen | Cat# A-21428; RRID: AB_2535849 |
| Goat anti-guinea pig IgG (H+L), Alexa Fluor 647 | Invitrogen | Cat# A21450; RRID: AB_2735091 |
| Mouse monoclonal IgG1 anti-SARS/SARS-CoV-2 Coronavirus Nucleocapsid protein (clone B46F) | Invitrogen | Cat# MA-1-7404; RRID: AB_1018422 |
| Mouse monoclonal IgG1 anti-glucagon (clone K79bB10) | Abcam | Cat# Ab10988; RRID: AB_297642 |
| Mouse monoclonal IgG1 anti-b-actin (AC-15) | Sigma-Aldrich | Cat# A1978; RRID: AB_476692 |
| Goat anti-guinea pig IgG (H+L), Alexa Fluor 488 | Invitrogen | Cat# A-11073; RRID: AB_2534117 |
| Donkey anti-mouse IgG (H+L), Alexa Fluor 488 | Invitrogen | Cat# A-21202; RRID: AB_141607 |
| IRDye 800CW Goat anti-rabbit IgG | LI-COR Biosciences | Cat# 926-32211; RRID: AB_621843 |
| IRDye 800CW Goat anti-mouse IgG | LI-COR Biosciences | Cat# 926-32210; RRID: AB_621842 |
| IRDye 800CW Donkey anti-goat IgG | LI-COR Biosciences | Cat# 926-32214; RRID: AB_621846 |
| IRDye 680LT Donkey anti-mouse IgG | LI-COR Biosciences | Cat# 926-68022; RRID: AB_10715072 |
| Biological Samples | ||
| Human control organ donor duodenum blocks | nPOD; https://www.jdrfnpod.org/ | Table S3 |
| Human control organ donor kidney blocks | nPOD; https://www.jdrfnpod.org/ | Table S3 |
| Human control organ donor pancreas blocks | nPOD; https://www.jdrfnpod.org/ | Table S3 |
| Human COVID-19 autopsy pancreas blocks | Department of Pathology, Louisiana State University; https://www.medschool.lsuhsc.edu/pathology/ | Table S4 |
| Chemicals, Peptides, and Recombinant Proteins | ||
| ACE2 peptide | Abcam | Cat# ab198988 |
| Antibody diluent reagent | Life Technologies | Cat# 003118 |
| ImmpactDAB | Vector Laboratories | Cat# SK-4105 |
| VECTASHIELD Antifade Mounting Medium with DAPI | Vector Laboratories | Cat# H-1200 |
| Borg Decloaker RTU | BioCare Medical | Cat# BD1000G1 |
| Background Sniper | BioCare Medical | Cat# BS966L |
| Protease inhibitor cocktail | Thermo Fisher Scientific | Cat# 78430 |
| Phosphatase inhibitor cocktail | Thermo Fisher Scientific | Cat# 78428 |
| Intercept Blocking Buffer | LI-COR Biosciences | Cat# 927-60001 |
| Intercept Antibody Diluent | LI-COR Biosciences | Cat# 927-65001 |
| ProLong Gold Antifade Mountant | Thermo Fisher Scientific | Cat# P36934 |
| Precision Plus Protein All Blue Prestained Protein Standard | Bio-Rad | Cat# 1610373 |
| Critical Commercial Assays | ||
| Avidin/Biotin blocking kit | Vector Laboratories | Cat# SP-2001 |
| Elite standard detection kit | Vector Laboratories | Cat# PK-6100 |
| MACH 2 Double Stain Kit 1 - Anti-Mouse AP/Anti-Rabbit HRP | BioCare Medical | Cat# MRCT523L |
| MACH 2 Double Stain Kit 2 - Anti-Mouse HRP/ Anti-Rabbit AP | BioCare Medical | Cat# MRCT525L |
| Betazoid DAB Chromogen Kit | BioCare Medical | Cat# BDB2004L |
| Warp Red Chromogen Kit | BioCare Medical | Cat# WR806 |
| Ferangi Blue Chromogen Kit | BioCare Medical | Cat# FB813S |
| RNAscope Multiplex Fluorescent V2 Kit | Advanced Cell Diagnostics | Cat# 323100 |
| TSA Plus Cyanine 3 Fluorescence Kit | Perkin Elmer | Cat# NEL744001KT |
| TSA Plus Cyanine 5 Fluorescence Kit | Perkin Elmer | Cat# NEL745001KT |
| Pierce BCA Assay kit | Thermo Fisher Scientific | Cat# 23227 |
| 4-20% gradient Mini-PROTEAN TGX Stain-Free gel | Bio-Rad | Cat# 456-8095 |
| Deposited Data | ||
| Raw scRNaseq data generated using inDrop | Gene Expression Omnibus Repository; Baron et al., 2016 | Table S1; GEO: GSE84133 |
| Raw scRNaseq data generated using Celseq | Gene Expression Omnibus Repository; Grün et al., 2016 | Table S1; GEO: GSE81076 |
| Raw scRNaseq data generated using Celseq2 | Gene Expression Omnibus Repository; Muraro et al., 2016 | Table S1; GEO: GSE85241 |
| Raw scRNaseq data generated using Fluidigm C1 | Gene Expression Omnibus Repository; Lawlor et al., 2017 | Table S1; GEO: GSE86469 |
| Raw scRNaseq data generated using SMART-Seq2 | ArrayExpress; Segerstolpe et al., 2016 | Table S1; E-MTAB-5061 |
| Raw and analyzed histology data | This paper | https://aperioeslide.ahc.ufl.edu |
| Oligonucleotides | ||
| RNAscope Probe- Hs-ACE2 | Advanced Cell Diagnostics | Cat# 848151 |
| RNAscope Probe- Hs-TMPRSS2-C2 | Advanced Cell Diagnostics | Cat# 470341-C2 |
| RNAscope Probe- Hs-TMPRSS4-C2 | Advanced Cell Diagnostics | Cat# 565301 |
| RNAscope Probe- Hs-TMPRSS11D-C2 | Advanced Cell Diagnostics | Cat# 870841-C4 |
| RNAscope Probe- Hs-CTSL-C2 | Advanced Cell Diagnostics | Cat# 858611 |
| RNAscope Probe- Hs-ADAM 17-C2 | Advanced Cell Diagnostics | Cat# 468141 |
| Software and Algorithms | ||
| Open-source Single-cell R Toolkit, Seurat v.3 | Satija Lab; Butler et al., 2018 | http://satijalab.org/seurat/ |
| HALO v3.0.311.262 | Indica Labs | https://indicalab.com/halo/ |
| Other | ||
| Nitrocellulose membranes | LI-COR Biosciences | Cat# 926-31092 |
Resource Availability
Lead Contact
Further information and requests for reagents may be directed to and will be fulfilled by the lead contact/corresponding author, Mark A. Atkinson (atkinson@ufl.edu).
Materials Availability
This study did not generate new unique reagents. Tissues used in this study were obtained from the Network for Pancreatic Organ donors with Diabetes (nPOD) and from autopsies performed on deceased individuals with COVID-19. nPOD tissues are freely available to approved investigators following successful application to the nPOD Tissue Prioritization Committee (TPC).
Data and Code Availability
This study did not generate code. Single cell sequencing data were obtained from the Gene Expression Omnibus (GEO) Repository: GSE84133 (Baron et al., 2016), GSE81076 (Grün et al., 2016), GSE85241 (Muraro et al., 2016), and GSE86469 (Lawlor et al., 2017), as well as from ArrayExpress: accession number E-MTAB-5061 (Segerstolpe et al., 2016). Original histology and additional de-identified organ donor data are available from nPOD at the nPOD online digital pathology database and from the corresponding author upon reasonable request.
Experimental Model and Subject Details
nPOD Donors and Sample Processing
Transplant-quality pancreas, duodenum, and kidney were recovered by JDRF nPOD (https://www.jdrfnpod.org/) from 56 COVID-19 negative organ donors without diabetes (Table S3) according to established protocols and procedures (Campbell-Thompson et al., 2012), as approved by the University of Florida Institutional Review Board (201400486), the United Network for Organ Sharing (UNOS), and according to federal guidelines with informed consent obtained from each donor’s legal representative. Organs were shipped in transport media on ice via organ courier to the nPOD Organ Pathology and Processing Core (OPPC) at the University of Florida where tissues were processed (Campbell-Thompson et al., 2012). Medical chart and medical-social questionnaire reviews were performed, and T1D-associated autoantibodies measured by ELISA (Wasserfall et al., 2016) to confirm non-diabetic health status. Donor demographics, hospitalization duration, and organ transport time were determined from hospital records or UNOS. This study was not powered to statistically assess associations between ACE2 localization and donor sex.
Autopsy Subjects and Sample Processing
Pancreas was recovered from three individuals who tested positive for SARS-CoV-2 by reverse transcription polymerase chain reaction (RT-PCR) test within 24-48 h of death at the University Medical Center New Orleans (New Orleans, LA), which is equipped with an autopsy suite that meets U.S. Centers for Disease Control and Prevention standards for autopsy of persons with COVID-19 (Table S4). Consent for autopsy without restriction was given by next of kin, and the studies within this report were determined to be exempt from oversight by the Institutional Review Board at Louisiana State University Health Sciences Center.
Method Details
Single-Cell RNA-Sequencing Data Analysis
Five human islet scRNA-seq datasets were obtained from publicly available repositories. These included four datasets from the Gene Expression Omnibus (GEO) Repository: GSE84133 (inDrop) (Baron et al., 2016), GSE81076 (Celseq) (Grün et al., 2016), GSE85241 (CelSeq2) (Muraro et al., 2016), and GSE86469 (Fluidigm C1) (Lawlor et al., 2017). In addition, we analyzed an ArrayExpress database under the accession number E-MTAB-5061 (SMART-Seq2) (Segerstolpe et al., 2016). For all scRNA-seq datasets, the same initial normalization was performed: gene expression values for each cell were divided by the total number of transcripts and multiplied by 10,000. Following log-transformation, cells were filtered that expressed fewer than 500 genes/cell (InDrops), 1,750 genes/cell (CelSeq), or 2,500 genes/cell (CelSeq2, Fluidigm C1, and SMART-Seq2) in accordance with the methods employed in the original corresponding publications, leaving 14,890 cells in total for the combined analysis. Pancreatic islet cell subtypes were identified using methods outlined in Butler et al. (2018).
To integrate scRNA-seq data, we applied canonical correlation analysis (CCA) in Seurat v.3 (Butler et al., 2018) using “FindIntegrationAnchors” and “IntegrateData” functions. We chose the top 2,000 variable genes from each dataset to calculate the correlation components (CCs) and “FindClusters” was utilized for shared nearest neighbor (SNN) graph-based clustering. Clusters were visualized with t-distributed stochastic neighbor embedding (t-SNE) by running dimensionality reduction with “RunTSNE” and “TSNEPlot.” To compare the average gene expression within the same cluster between cells of different samples, we applied the AverageExpression function. Statistical analyses are further described in Quantification and Statistical Analysis below. Violin plots (VlnPlot) were used to visualize gene expression levels (Figures 1B, 1D, 1F, 1G, and S1). The “DotPlot” function was used to visualize ACE2 and TMPRSS2 expression levels compared with cell type-enriched genes (Figure 1E).
Single Molecular Fluorescent In Situ Hybridization
To define mRNA expression patterns of SARS-CoV-2 associated genes in human pancreata, smFISH was performed using the RNAscope Multiplex Fluorescent V2 kit (Advanced Cell Diagnostics, Newark, CA) in FFPE tissue cross-sections (5mm) from seven non-diabetic, SARS-CoV-2 negative human organ donors from nPOD (Table S3; Figures 2A–2C and S2C–S2F). Slides were baked at 60°C for 1 h, followed by dehydration with xylene for 5 min x 2 and 100% ethanol for 2 min at room temperature (RT). Next, slides were air-dried at 60°C for 5 min, treated with hydrogen peroxide for 10 min at RT, and washed 4 times with ddH2O, followed by antigen-retrieval at 99°C for 15 min. After another wash with ddH2O at RT for 15 s, slides were incubated at 100% ethanol for 3 min, air-dried and then treated with protease plus for 30 min at 40°C. Next, slides were hybridized with RNAscope Probes for TMPRSS2, TMPRSS4, TMPRSS11D, CTSL, ADAM17 and ACE2 mRNA, and detected using secondary TSA plus fluorophores (1:1500 dilution) according to the manufacture’s protocol (Perkin Elmer, Waltham, MA). Slides were immediately washed with 1X PBS and PBS containing 2% FBS for 5 min, blocked with donkey serum for 30 min, and incubated with ready to use (RTU) guinea pig polyclonal anti-insulin (no dilution; Agilent Santa Clara, CA) and/or mouse monoclonal anti-CD34 antibody (1:1,000 dilution, Novus Biologicals) overnight. The following morning, slides were washed with 1X PBS and PBS containing 2% FBS for 5 min and probed using either Alexa Fluor (AF)-488 goat anti-guinea pig IgG (1:500 dilution, Invitrogen, Carlsbad, CA) or AF-488 donkey anti-mouse IgG (1:1,000 dilution, Invitrogen) secondary antibodies. Finally, the slides were washed with PBS, counterstained with DAPI, and mounted with a coverslip using ProLong Gold antifade mounting media (Thermo Fisher, Rockford, IL). Images were acquired using an LSM800 confocal microscope (Carl Zeiss, Germany).
Tissue Homogenization
Pancreas tissues were homogenized in modified radioimmunoprecipitation (RIPA) buffer (50 mM Tris-HCl pH 7.4, 150 mM NaCl, 5 mM EDTA, 1 mM EGTA, 1% NP-40, 0.5% sodium deoxycholate and 0.1% SDS) with freshly prepared protease and phosphatase inhibitor cocktails (Thermo Fisher Scientific) using a Tissue Tearor (BioSpec, Bartlesville, OK). After homogenization, tissue was further disrupted with a Vibra-Cell sonicator (Sonics & Materials, Newtown, CT) for 15 s, placed on ice for 15 min, then sonicated again and placed on ice for another 15 min. The tissue homogenates were centrifuged at 14,000 x g for 20 min at 4°C, and the supernatants were assayed for total protein concentration using a Pierce BCA Assay kit (Thermo Fisher Scientific) and stored at −80°C until use.
Western Blotting
Fifty micrograms of protein lysates in Laemmli’s buffer containing 2.5% b-mercaptoethanol were boiled at 100°C for 5 min prior to loading into a 4%–20% gradient Mini-PROTEAN TGX Stain-Free gel (Bio-Rad, Hercules, CA). After protein separation, gels were activated using a Gel DOC EZ imager (Bio-Rad), then transferred onto nitrocellulose membranes (LI-COR Biosciences, Lincoln, NE). Following protein transfer, membranes were scanned with the Gel DOC EZ imager, and total protein staining was visualized and quantified using Image Lab software version 5.2.1 (Bio-Rad). Then, membranes were washed and blocked for 1 h at RT with Intercept Blocking Buffer (LI-COR Biosciences). Thereafter, the membranes were incubated at 4°C overnight with one of four primary antibodies (rabbit monoclonal anti-ACE2 (1:1,000 dilution, Abcam, Cambridge, MA), rabbit polyclonal anti-ACE2 (1:500 dilution, Abcam), mouse monoclonal anti-ACE2 (1:1,000 dilution, R&D Systems), goat polyclonal anti-ACE2 (1:500 dilution, R&D Systems, Minneapolis, MN)) and mouse monoclonal anti-b-actin (1:10,000 dilution; Sigma-Aldrich, St. Louis, MO) in Intercept Antibody Diluent (LI-COR Biosciences). The membranes were then washed with Tris-buffered saline containing 0.1% Tween 20 (TBST) three times at 5 min intervals, incubated with secondary antibodies (IRDye 800CW goat anti-rabbit IgG (1:30,000 dilution), IRDye 800CW goat anti-mouse IgG (1:30,000 dilution), IRDye 800CW donkey anti-goat IgG (1:30,000 dilution), or IRDye 680LT donkey anti-mouse (1:40,000 dilution), all from LI-COR Biosciences) for 1 h at RT. The membranes were washed three times with TBST at 5-min intervals. Immunoreactive bands were visualized and densitometrically analyzed using Odyssey infrared scanner and Image Studio software version 3.1 (LI-COR Biosciences) (Figures 3B, S3A, and S3B).
Immunohistochemistry
FFPE pancreas, duodenum, and kidney tissues were sectioned (4mm), deparaffinized, rehydrated by serially passing through changes of xylene and graded ethanol, subjected to heat induced antigen retrieval in 10mM Citra pH 6, and blocked with avidin, biotin, and goat serum. For single-stained kidney and duodenum tissue sections (Figure S3C) and for SARS-CoV-2 NP single stained lung and pancreas sections (Figures 5E, 5F, S5B, and S5C), slides were incubated overnight at 4°C with one of four primary antibodies against ACE2 (rabbit monoclonal anti-ACE2, 1:200 dilution (Abcam); rabbit polyclonal anti-ACE2, 1:2,000 dilution (Abcam); mouse monoclonal anti-human ACE2, 1:100 dilution, (R&D Systems); goat polyclonal anti-ACE2, 1:100 dilution, (R&D Systems)) or a primary antibody against SARS-CoV-2 NP (mouse monoclonal anti-SARS-CoV-2 NP, 1:50 dilution, Invitrogen). Slides were washed, then incubated for 30 min at RT with biotinylated secondary antibodies (biotinylated goat anti-rabbit IgG, 1:200 dilution (Vector Laboratories, Burlingame, CA); biotinylated horse anti-mouse IgG, 1:200 dilution (Vector Laboratories); biotinylated rabbit anti-goat, 1:200 dilution (Vector Laboratories)), and developed with ImmpactDAB (Vector Laboratories) followed by hematoxylin counterstain.
For peptide blocking experiments (Figure S3D) the primary antibody (monoclonal rabbit anti-ACE2, 1:100 dilution (Abcam)) was incubated with 1mg/mL ACE2 peptide (Abcam) for 1 h at RT, before applying to pancreas slides for overnight incubation at 4°C. Thereafter, IHC methodology was carried out as described for single stained sections.
For double- and triple-stained slides, FFPE pancreas slides were prepared for heat induced antigen retrieval in Borg Decloaker RTU (BioCare Medical, Pacheco, CA) followed by 3% H2O2. After washing, tissues were blocked with Background Sniper (BioCare Medical) followed by staining. For insulin and ACE2 double-staining (Figures 3C, 4A, and S4B), blocked slides were incubated for 20 min at RT with the first primary antibody (rabbit monoclonal anti-ACE2, 1:200 dilution (Abcam)), then washed and incubated with MACH 2 Double Stain Kit 1 (BioCare Medical) for 20 min at RT. Slides were washed and developed using DAB Chromogen solution (BioCare Medical), then subjected to a second round of heat-induced antigen retrieval in Borg Decloaker RTU, followed by 3% H2O2. After washing, slides were again blocked with Background Sniper, washed, and incubated with the second primary antibody (rabbit monoclonal anti-insulin, 1:2,000 dilution (Abcam)) for 30 min at RT. After washing, slides were incubated with MACH 2 Double Stain Kit 2 for 30 min at RT, washed, and developed with Warp Red Chromogen solution (BioCare Medical) followed by Hematoxylin counterstain. For SARS-CoV-2 NP and cytokeratin 19 double-staining (Figure S5D), slides were incubated with primary antibody against SARS-CoV-2 NP (mouse monoclonal anti-SARS-CoV-2 NP, 1:50 dilution, Invitrogen overnight. Slides were washed, then incubated for 30 min at RT with biotinylated secondary horse anti-mouse IgG, 1:200 dilution (Vector Laboratories) and developed with ImmpactDAB (Vector Laboratories). Next, slides were subjected to a second round of heat-induced antigen retrieval in Borg Decloaker RTU, followed by 3% H2O2. After washing, slides were again blocked with Background Sniper, washed, and incubated with the second primary antibody (mouse monoclonal anti-cytokeratin 19, 1:50 dilution, Agilent) for 3 min at RT. After washing, slides were incubated with MACH 2 Double Stain Kit 1 for 20 min at RT, washed, and developed with Ferangi Blue Chromogen solution (BioCare Medical).
For ACE2, insulin and glucagon triple-staining (Figure 5D), blocked slides were incubated for 20 min at RT with a primary antibody cocktail (mouse monoclonal anti-glucagon, 1:1,000 dilution (Abcam) plus rabbit monoclonal anti-ACE2, 1:200 dilution (Abcam)), then washed and incubated with MACH 2 Double Stain Kit 1 (BioCare Medical) for 20 min at RT. Slides were washed and developed using DAB Chromogen solution for ACE2 visualization followed by Ferangi Blue Chromogen solution (BioCare Medical) for glucagon visualization. Slides were then subjected to a second round of heat-induced antigen retrieval in Borg Decloaker RTU, followed by 3% H2O2. After washing, slides were again blocked with Background Sniper, washed, and incubated with the third primary antibody (rabbit monoclonal anti-insulin, 1:2,000 dilution (Abcam)) for 30 min at RT. After washing, slides were incubated with MACH 2 Double Stain Kit 2 for 30 min at RT, washed, and developed with Warp Red Chromogen solution (BioCare Medical) followed by Hematoxylin counterstain.
Following single-, double-, or triple-IHC staining, whole slides were scanned at an absolute magnification of 20x using an Aperio CS2 Scanscope (Leica/Aperio, Vista, CA), and stored in the nPOD online digital pathology database (eSLIDE version 12.4.0.5043, Leica/Aperio). Images were taken using Aperio ImageScope v12.4.3 or a Keyence BZ-X700 microscope.
Immunofluorescence
For immunofluorescence staining, FFPE pancreas sections were sectioned (4mm), deparaffinized, and rehydrated with antigen retrieval in 10mM Citra pH 6 and blocking as described above for IHC. Slides were incubated overnight at 4°C with primary antibodies: a) monoclonal rabbit anti-ACE2 (1:100 dilution; Abcam), polyclonal guinea pig anti-insulin RTU antibody (undiluted; Agilent), and monoclonal mouse anti-glucagon (dilution; 1:20,000 Abcam) (Figures 4D–4F) or b) monoclonal rabbit anti-ACE2 (1:100 dilution; Abcam) and monoclonal mouse anti-CD34 (dilution 1:1,000; Novus Biologicals, Centennial, CO) (Figure S4C). Slides were washed, then incubated for 45 min at RT in the dark with secondary antibodies: a) goat anti-rabbit IgG-AF555, goat anti-mouse IgG-AF488, and goat anti-guinea pig IgG-AF647, or b) goat anti-rabbit IgG-AF594 and goat anti-mouse IgG-AF488 (all from Invitrogen). Slides were washed, then counterstained with DAPI and viewed using a Keyence BZ-X700 automated fluorescence microscope.
H&E Staining
H&E staining was performed on FFPE pancreas tissues sections (4mm) from the three COVID-19 autopsy subjects according to standard methodology. Whole slides were scanned using an Aperio CS2 Scanscope (Leica/Aperio, Vista, CA), and stored in the nPOD online digital pathology database (eSLIDE version 12.4.0.5043, Leica/Aperio). Images were taken using Aperio ImageScope v12.4.3.
Quantification and Statistical Analysis
For scRNA-seq analysis, n represents the number of cells as indicated in the figure legends. Analyses were performed in R as described in Method Details above. Differences in the average gene expression levels between pancreatic cell subsets or within each cell subset from non-diabetic donors versus donors with T2D were compared using Wilcoxon rank sum tests, requiring a minimum 1.19-fold change between the two groups and expression in at least 10% of cells from either group. Bonferroni corrections were used to adjust for multiple comparisons. Paired Student’s t tests were used to compare proportions of cells with detectable gene expression. p values < 0.05 were considered significant. Violin plot limits show maxima and minima, and the dots represent individual data points. smFISH data were not quantitatively evaluated. For the quantification of ACE2 protein expression throughout the human lifespan and for the analysis of correlation between ACE2 protein expression and BMI, digitized images of ACE2 and insulin co-stained slides were analyzed using the HALO quantitative image analysis platform V3.0.311.262 (Indica Labs, Corrales, NM) (Figure 4A). The annotation pen tool was used to outline the tissue section to determine total tissue area (mm2). The Area quantification algorithm v2.1.3 based on red, blue, green (RBG) spectra was employed to detect ACE2 positive tissue area stained for 3,3′-Diaminobenzidine (DAB, brown). The algorithm detected DAB IHC positivity and calculated percentage of ACE2 positive area per total tissue area. For the ACE2 expression as factor of age study, BMI-matched donors (n = 36) were binned into six age groups representing major stages of human life: neonatal (0-0.25 years), infant and toddler (0.25-2 years), childhood (2-11 years), puberty (11-15 years), young adult (20-33 years), and senior adult (51-72 years). Data were analyzed in GraphPad Prism v8.3 (GraphPad Software, San Diego, CA) by one-way ANOVA followed by Tukey’s post hoc test for multiple comparisons with significance defined as p < 0.05 and graphed with the median percent ACE2 area shown for each group in a box and whisker plot. To assess for an association between ACE2 expression and BMI, we reviewed the 34 nPOD donors aged 20-33 years without diabetes with samples available and selected those without significant underlying pancreatic pathology. This resulted in evaluation of 22 adult organ donors with BMI ranging from 19.5-35.6 kg/m2; data were analyzed in R using Spearman’s correlation test. All image analysis data were collected in blinded fashion. The remaining IF and IHC data were not quantitatively evaluated.
Acknowledgments
We thank the families of the organ donors and autopsy subjects for the gift of tissues. We also thank Jill K. Gregory, CMI (Icahn School of Medicine at Mount Sinai, New York, NY) for preparing the graphical abstract. These efforts were supported by NIH P01 AI042288 and UC4 DK108132 (M.A.A.); JDRF (M.A.A.); NIH R01 DK122160 (M.C.-T.); NIH R01 AI134971 and P30 DK020541 (D.H.); JDRF 3-PDF-2018-575-A-N (V.V.D.H.); R01 DK093954, R21 DK119800-01A1, UC4 DK104166, and U01 DK127786 (C.E.-M.); VA Merit Award I01BX001733 (C.E.-M.); Imaging Core of NIH/NIDDK P30 DK097512 (C.E.-M.); gifts from the Sigma Beta Sorority, the Ball Brothers Foundation, and the George and Frances Ball Foundation (C.E.-M.); the Network for Pancreatic Organ Donors with Diabetes (nPOD; RRID: SCR_014641) (5-SRA-2018-557-Q-R); and The Leona M. & Harry B. Helmsley Charitable Trust (2018PG-T1D053). The authors also wish to acknowledge the Islet and Physiology Core of the Indiana Diabetes Research Center (P30DK097512). The funders had no role in study design, data collection and interpretation, or the decision to submit the work for publication.
Author Contributions
I.K. researched data, generated figures, and wrote the manuscript; W.W., F.S., V.V.D.H., M.J., P.J., X.T., E.C.-J., and C.Y. researched data and reviewed and edited the manuscript; H.N. generated Figure 2A, contributed to discussion, and reviewed and edited the manuscript; J.L.H. and J.D.P. reviewed pathology and reviewed and edited the manuscript; A.L.P. contributed to discussion and wrote the manuscript; R.L., S.C., and A.P. contributed to discussion and reviewed and edited the manuscript; R.S.V.H. procured COVID-19 autopsy tissues, reviewed pathology, and reviewed and edited the manuscript; M.C.-T. reviewed pathology and wrote the manuscript; and C.E.-M., D.H., and M.A.A. conceived of the study and wrote the manuscript.
Declaration of Interests
The authors declare no competing interests.
Published: November 13, 2020
Footnotes
Supplemental Information can be found online at https://doi.org/10.1016/j.cmet.2020.11.005.
Supplemental Information
References
- Baron M., Veres A., Wolock S.L., Faust A.L., Gaujoux R., Vetere A., Ryu J.H., Wagner B.K., Shen-Orr S.S., Klein A.M. A single-cell transcriptomic map of the human and mouse pancreas reveals inter- and intra-cell population structure. Cell Syst. 2016;3:346–360.e4. doi: 10.1016/j.cels.2016.08.011. [DOI] [PMC free article] [PubMed] [Google Scholar]
- Barron E., Bakhai C., Kar P., Weaver A., Bradley D., Ismail H., Knighton P., Holman N., Khunti K., Sattar N. Associations of type 1 and type 2 diabetes with COVID-19-related mortality in England: a whole-population study. Lancet Diabetes Endocrinol. 2020;8:813–822. doi: 10.1016/S2213-8587(20)30272-2. [DOI] [PMC free article] [PubMed] [Google Scholar]
- Blume C., Jackson C.L., Spalluto C.M., Legebeke J., Nazlamova L., Conforti F., Perotin-Collard J.-M., Frank M., Crispin M., Coles J. A novel isoform of ACE2 is expressed in human nasal and bronchial respiratory epithelia and is upregulated in response to RNA respiratory virus infection. bioRxiv. 2020 doi: 10.1101/2020.07.31.230870. [DOI] [PubMed] [Google Scholar]
- Butler A., Hoffman P., Smibert P., Papalexi E., Satija R. Integrating single-cell transcriptomic data across different conditions, technologies, and species. Nat. Biotechnol. 2018;36:411–420. doi: 10.1038/nbt.4096. [DOI] [PMC free article] [PubMed] [Google Scholar]
- Campbell-Thompson M., Wasserfall C., Kaddis J., Albanese-O’Neill A., Staeva T., Nierras C., Moraski J., Rowe P., Gianani R., Eisenbarth G. Network for Pancreatic Organ Donors with Diabetes (nPOD): developing a tissue biobank for type 1 diabetes. Diabetes Metab. Res. Rev. 2012;28:608–617. doi: 10.1002/dmrr.2316. [DOI] [PMC free article] [PubMed] [Google Scholar]
- Chen L., Hao G. The role of angiotensin-converting enzyme 2 in coronaviruses/influenza viruses and cardiovascular disease. Cardiovasc. Res. 2020;116:1932–1936. doi: 10.1093/cvr/cvaa093. [DOI] [PMC free article] [PubMed] [Google Scholar]
- Coate K.C., Cha J., Shrestha S., Wang W., Gonçalves L.M., Almaça J., Kapp M.E., Fasolino M., Morgan A., Dai C. SARS-CoV-2 cell entry factors ACE2 and TMPRSS2 are expressed in the microvasculature and ducts of human pancreas but are not enriched in β cells. Cell Metab. 2020 doi: 10.1016/j.cmet.2020.11.006. Published online November 13, 2020. [DOI] [PMC free article] [PubMed] [Google Scholar]
- Connors J.M., Levy J.H. COVID-19 and its implications for thrombosis and anticoagulation. Blood. 2020;135:2033–2040. doi: 10.1182/blood.2020006000. [DOI] [PMC free article] [PubMed] [Google Scholar]
- DiMeglio L.A., Albanese-O’Neill A., Muñoz C.E., Maahs D.M. COVID-19 and children with diabetes-updates, unknowns, and next steps: first, do no extrapolation. Diabetes Care. 2020;43:2631–2634. doi: 10.2337/dci20-0044. [DOI] [PubMed] [Google Scholar]
- Dorward D., Russell C., Um I., Elshani M., Armstrong S., Penrice-Randal R., Millar T., Lerpiniere C., Tagliavini G., Hartley C. Tissue-specific tolerance in fatal Covid-19. medRxiv. 2020 doi: 10.1101/2020.07.02.20145003. [DOI] [PMC free article] [PubMed] [Google Scholar]
- Fignani D., Licata G., Brusco N., Nigi L., Grieco G.E., Marselli L., Overbergh L., Gysemans C., Colli M.L., Marchetti P. SARS-CoV-2 receptor angiotensin I-converting enzyme type 2 (ACE2) is expressed in human pancreatic β-cells and in the human pancreas microvasculature. Front. Endocrinol. 2020 doi: 10.3389/fendo.2020.596898. [DOI] [PMC free article] [PubMed] [Google Scholar]
- Fox S.E., Akmatbekov A., Harbert J.L., Li G., Quincy Brown J., Vander Heide R.S. Pulmonary and cardiac pathology in African American patients with COVID-19: an autopsy series from New Orleans. Lancet Respir. Med. 2020;8:681–686. doi: 10.1016/S2213-2600(20)30243-5. [DOI] [PMC free article] [PubMed] [Google Scholar]
- Goldman N., Fink D., Cai J., Lee Y.N., Davies Z. High prevalence of COVID-19-associated diabetic ketoacidosis in UK secondary care. Diabetes Res. Clin. Pract. 2020;166:108291. doi: 10.1016/j.diabres.2020.108291. [DOI] [PMC free article] [PubMed] [Google Scholar]
- Grün D., Muraro M.J., Boisset J.C., Wiebrands K., Lyubimova A., Dharmadhikari G., van den Born M., van Es J., Jansen E., Clevers H. De novo prediction of stem cell identity using single-cell transcriptome data. Cell Stem Cell. 2016;19:266–277. doi: 10.1016/j.stem.2016.05.010. [DOI] [PMC free article] [PubMed] [Google Scholar]
- Hanley B., Lucas S.B., Youd E., Swift B., Osborn M. Autopsy in suspected COVID-19 cases. J. Clin. Pathol. 2020;73:239–242. doi: 10.1136/jclinpath-2020-206522. [DOI] [PubMed] [Google Scholar]
- Hikmet F., Méar L., Edvinsson Å., Micke P., Uhlén M., Lindskog C. The protein expression profile of ACE2 in human tissues. Mol. Syst. Biol. 2020;16:e9610. doi: 10.15252/msb.20209610. [DOI] [PMC free article] [PubMed] [Google Scholar]
- Holman N., Knighton P., Kar P., O’Keefe J., Curley M., Weaver A., Barron E., Bakhai C., Khunti K., Wareham N.J. Risk factors for COVID-19-related mortality in people with type 1 and type 2 diabetes in England: a population-based cohort study. Lancet Diabetes Endocrinol. 2020;8:823–833. doi: 10.1016/S2213-8587(20)30271-0. [DOI] [PMC free article] [PubMed] [Google Scholar]
- Hönzke K., Obermayer B., Mache C., Fatykhova D., Kessler M., Dökel S., Wyler E., Hoffmann K., Schulze J., Mieth M. Human lungs show limited permissiveness for SARS-CoV-2 due to scarce ACE2 levels but strong virus-induced immune activation in alveolar macrophages. Cell Press Sneak Peek. 2020 doi: 10.2139/ssrn.3687020. [DOI] [Google Scholar]
- Hussain A., Mahawar K., Xia Z., Yang W., El-Hasani S. Obesity and mortality of COVID-19. Meta-analysis. Obes. Res. Clin. Pract. 2020;14:295–300. doi: 10.1016/j.orcp.2020.07.002. [DOI] [PMC free article] [PubMed] [Google Scholar] [Retracted]
- Koch M., Holmes D., Bennet N., The Lancet Diabetes Endocrinology COVID-19 and diabetes: a co-conspiracy? Lancet Diabetes Endocrinol. 2020;8:801. [Google Scholar]
- Lawlor N., George J., Bolisetty M., Kursawe R., Sun L., Sivakamasundari V., Kycia I., Robson P., Stitzel M.L. Single-cell transcriptomes identify human islet cell signatures and reveal cell-type-specific expression changes in type 2 diabetes. Genome Res. 2017;27:208–222. doi: 10.1101/gr.212720.116. [DOI] [PMC free article] [PubMed] [Google Scholar]
- Lee I.T., Nakayama T., Wu C.T., Goltsev Y., Jiang S., Gall P.A., Liao C.K., Shih L.C., Schürch C.M., McIlwain D.R. Robust ACE2 protein expression localizes to the motile cilia of the respiratory tract epithelia and is not increased by ACE inhibitors or angiotensin receptor blockers. medRxiv. 2020 doi: 10.1101/2020.05.08.20092866. [DOI] [Google Scholar]
- Lee J.J., Kopetz S., Vilar E., Shen J.P., Chen K., Maitra A. Relative abundance of SARS-CoV-2 entry genes in the enterocytes of the lower gastrointestinal tract. Genes (Basel) 2020;11:645. doi: 10.3390/genes11060645. [DOI] [PMC free article] [PubMed] [Google Scholar]
- Li J., Wang X., Chen J., Zuo X., Zhang H., Deng A. COVID-19 infection may cause ketosis and ketoacidosis. Diabetes Obes. Metab. 2020 doi: 10.1111/dom.14057. Published online April 20, 2020. [DOI] [PMC free article] [PubMed] [Google Scholar]
- Liu Q., Wang R.S., Qu G.Q., Wang Y.Y., Liu P., Zhu Y.Z., Fei G., Ren L., Zhou Y.W., Liu L. Gross examination report of a COVID-19 death autopsy. Fa Yi Xue Za Zhi. 2020;36:21–23. doi: 10.12116/j.issn.1004-5619.2020.01.005. [DOI] [PubMed] [Google Scholar]
- Marchand L., Pecquet M., Luyton C. Type 1 diabetes onset triggered by COVID-19. Acta Diabetol. 2020;57:1265–1266. doi: 10.1007/s00592-020-01570-0. [DOI] [PMC free article] [PubMed] [Google Scholar]
- Menter T., Haslbauer J.D., Nienhold R., Savic S., Hopfer H., Deigendesch N., Frank S., Turek D., Willi N., Pargger H. Postmortem examination of COVID-19 patients reveals diffuse alveolar damage with severe capillary congestion and variegated findings in lungs and other organs suggesting vascular dysfunction. Histopathology. 2020;77:198–209. doi: 10.1111/his.14134. [DOI] [PMC free article] [PubMed] [Google Scholar]
- Mercatelli D., Giorgi F.M. Geographic and genomic distribution of SARS-CoV-2 mutations. Front. Microbiol. 2020;11:1800. doi: 10.3389/fmicb.2020.01800. [DOI] [PMC free article] [PubMed] [Google Scholar]
- Muraro M.J., Dharmadhikari G., Grün D., Groen N., Dielen T., Jansen E., van Gurp L., Engelse M.A., Carlotti F., de Koning E.J., van Oudenaarden A. A single-cell transcriptome atlas of the human pancreas. Cell Syst. 2016;3:385–394.e3. doi: 10.1016/j.cels.2016.09.002. [DOI] [PMC free article] [PubMed] [Google Scholar]
- Nakeshbandi M., Maini R., Daniel P., Rosengarten S., Parmar P., Wilson C., Kim J.M., Oommen A., Mecklenburg M., Salvani J. The impact of obesity on COVID-19 complications: a retrospective cohort study. Int. J. Obes. 2020;44:1832–1837. doi: 10.1038/s41366-020-0648-x. [DOI] [PMC free article] [PubMed] [Google Scholar]
- Ng K., Attig J., Bolland W., Young G.R., Major J., Wack A., Kassiotis G. Tissue-specific and interferon-inducible expression of non-functional ACE2 through endogenous retrovirus co-option. bioRxiv. 2020 doi: 10.1101/2020.07.24.219139. [DOI] [PMC free article] [PubMed] [Google Scholar]
- Onabajo O.O., Banday A.R., Stanifer M.L., Yan W., Obajemu A., Santer D.M., Florez-Vargas O., Piontkivska H., Vargas J.M., Ring T.J. Interferons and viruses induce a novel truncated ACE2 isoform and not the full-length SARS-CoV-2 receptor. Nat. Genet. 2020 doi: 10.1038/s41588-020-00731-9. Published online October 19, 2020. [DOI] [PMC free article] [PubMed] [Google Scholar]
- Rapkiewicz A.V., Mai X., Carsons S.E., Pittaluga S., Kleiner D.E., Berger J.S., Thomas S., Adler N.M., Charytan D.M., Gasmi B. Megakaryocytes and platelet-fibrin thrombi characterize multi-organ thrombosis at autopsy in COVID-19: a case series. EClinicalMedicine. 2020;24:100434. doi: 10.1016/j.eclinm.2020.100434. [DOI] [PMC free article] [PubMed] [Google Scholar]
- Segerstolpe Å., Palasantza A., Eliasson P., Andersson E.M., Andréasson A.C., Sun X., Picelli S., Sabirsh A., Clausen M., Bjursell M.K. Single-cell transcriptome profiling of human pancreatic islets in health and type 2 diabetes. Cell Metab. 2016;24:593–607. doi: 10.1016/j.cmet.2016.08.020. [DOI] [PMC free article] [PubMed] [Google Scholar]
- Taneera J., El-Huneidi W., Hamad M., Mohammed A.K., Elaraby E., Hachim M.Y. Expression profile of SARS-CoV-2 host receptors in human pancreatic islets revealed upregulation of ACE2 in diabetic donors. Biology (Basel) 2020;9:215. doi: 10.3390/biology9080215. [DOI] [PMC free article] [PubMed] [Google Scholar]
- Tartof S.Y., Qian L., Hong V., Wei R., Nadjafi R.F., Fischer H., Li Z., Shaw S.F., Caparosa S.L., Nau C.L. Obesity and mortality among patients diagnosed with COVID-19: results from an integrated health care organization. Ann. Intern. Med. 2020 doi: 10.7326/M20-3742. Published online August 12, 2020. [DOI] [PMC free article] [PubMed] [Google Scholar]
- Tipnis S.R., Hooper N.M., Hyde R., Karran E., Christie G., Turner A.J. A human homolog of angiotensin-converting enzyme. Cloning and functional expression as a captopril-insensitive carboxypeptidase. J. Biol. Chem. 2000;275:33238–33243. doi: 10.1074/jbc.M002615200. [DOI] [PubMed] [Google Scholar]
- Tittel S.R., Rosenbauer J., Kamrath C., Ziegler J., Reschke F., Hammersen J., Mönkemöller K., Pappa A., Kapellen T., Holl R.W., DPV Initiative Did the COVID-19 lockdown affect the incidence of pediatric type 1 diabetes in Germany? Diabetes Care. 2020;43:e172–e173. doi: 10.2337/dc20-1633. [DOI] [PMC free article] [PubMed] [Google Scholar]
- Unsworth R., Wallace S., Oliver N.S., Yeung S., Kshirsagar A., Naidu H., Kwong R.M.W., Kumar P., Logan K.M. New-onset type 1 diabetes in children during COVID-19: multicenter regional findings in the U.K. Diabetes Care. 2020;43:e170–e171. doi: 10.2337/dc20-1551. [DOI] [PubMed] [Google Scholar]
- Varga Z., Flammer A.J., Steiger P., Haberecker M., Andermatt R., Zinkernagel A.S., Mehra M.R., Schuepbach R.A., Ruschitzka F., Moch H. Endothelial cell infection and endotheliitis in COVID-19. Lancet. 2020;395:1417–1418. doi: 10.1016/S0140-6736(20)30937-5. [DOI] [PMC free article] [PubMed] [Google Scholar]
- Wang F., Wang H., Fan J., Zhang Y., Wang H., Zhao Q. Pancreatic injury patterns in patients with coronavirus disease 19 pneumonia. Gastroenterology. 2020;159:367–370. doi: 10.1053/j.gastro.2020.03.055. [DOI] [PMC free article] [PubMed] [Google Scholar]
- Wasserfall C., Montgomery E., Yu L., Michels A., Gianani R., Pugliese A., Nierras C., Kaddis J.S., Schatz D.A., Bonifacio E., Atkinson M.A. Validation of a rapid type 1 diabetes autoantibody screening assay for community-based screening of organ donors to identify subjects at increased risk for the disease. Clin. Exp. Immunol. 2016;185:33–41. doi: 10.1111/cei.12797. [DOI] [PMC free article] [PubMed] [Google Scholar]
- Wichmann D., Sperhake J.P., Lütgehetmann M., Steurer S., Edler C., Heinemann A., Heinrich F., Mushumba H., Kniep I., Schröder A.S. Autopsy findings and venous thromboembolism in patients with COVID-19: a prospective cohort study. Ann. Intern. Med. 2020;173:268–277. doi: 10.7326/M20-2003. [DOI] [PMC free article] [PubMed] [Google Scholar]
- Yang J.K., Lin S.S., Ji X.J., Guo L.M. Binding of SARS coronavirus to its receptor damages islets and causes acute diabetes. Acta Diabetol. 2010;47:193–199. doi: 10.1007/s00592-009-0109-4. [DOI] [PMC free article] [PubMed] [Google Scholar]
- Yang L., Han Y., Nilsson-Payant B.E., Gupta V., Wang P., Duan X., Tang X., Zhu J., Zhao Z., Jaffré F. A human pluripotent stem cell-based platform to study SARS-CoV-2 tropism and model virus infection in human cells and organoids. Cell Stem Cell. 2020;27:125–136.e7. doi: 10.1016/j.stem.2020.06.015. [DOI] [PMC free article] [PubMed] [Google Scholar]
- Zang R., Gomez Castro M.F., McCune B.T., Zeng Q., Rothlauf P.W., Sonnek N.M., Liu Z., Brulois K.F., Wang X., Greenberg H.B. TMPRSS2 and TMPRSS4 promote SARS-CoV-2 infection of human small intestinal enterocytes. Sci. Immunol. 2020;5:eabc3582. doi: 10.1126/sciimmunol.abc3582. [DOI] [PMC free article] [PubMed] [Google Scholar]
- Zhou F., Yu T., Du R., Fan G., Liu Y., Liu Z., Xiang J., Wang Y., Song B., Gu X. Clinical course and risk factors for mortality of adult inpatients with COVID-19 in Wuhan, China: a retrospective cohort study. Lancet. 2020;395:1054–1062. doi: 10.1016/S0140-6736(20)30566-3. [DOI] [PMC free article] [PubMed] [Google Scholar]
Associated Data
This section collects any data citations, data availability statements, or supplementary materials included in this article.
Supplementary Materials
Data Availability Statement
This study did not generate code. Single cell sequencing data were obtained from the Gene Expression Omnibus (GEO) Repository: GSE84133 (Baron et al., 2016), GSE81076 (Grün et al., 2016), GSE85241 (Muraro et al., 2016), and GSE86469 (Lawlor et al., 2017), as well as from ArrayExpress: accession number E-MTAB-5061 (Segerstolpe et al., 2016). Original histology and additional de-identified organ donor data are available from nPOD at the nPOD online digital pathology database and from the corresponding author upon reasonable request.