

This cohort study quantitatively describes molecular viral shedding in asymptomatic and symptomatic patients with SARS-CoV-2 infection.
Key Points
Question
Are there viral load differences between asymptomatic and symptomatic patients with severe acute respiratory syndrome coronavirus 2 (SARS-CoV-2) infection?
Findings
In this cohort study that included 303 patients with SARS-CoV-2 infection isolated in a community treatment center in the Republic of Korea, 110 (36.3%) were asymptomatic at the time of isolation and 21 of these (19.1%) developed symptoms during isolation. The cycle threshold values of reverse transcription–polymerase chain reaction for SARS-CoV-2 in asymptomatic patients were similar to those in symptomatic patients.
Meaning
Many individuals with SARS-CoV-2 infection remained asymptomatic for a prolonged period, and viral load was similar to that in symptomatic patients; therefore, isolation of infected persons should be performed regardless of symptoms.
Abstract
Importance
There is limited information about the clinical course and viral load in asymptomatic patients infected with severe acute respiratory syndrome coronavirus 2 (SARS-CoV-2).
Objective
To quantitatively describe SARS-CoV-2 molecular viral shedding in asymptomatic and symptomatic patients.
Design, Setting, and Participants
A retrospective evaluation was conducted for a cohort of 303 symptomatic and asymptomatic patients with SARS-CoV-2 infection between March 6 and March 26, 2020. Participants were isolated in a community treatment center in Cheonan, Republic of Korea.
Main Outcomes and Measures
Epidemiologic, demographic, and laboratory data were collected and analyzed. Attending health care personnel carefully identified patients’ symptoms during isolation. The decision to release an individual from isolation was based on the results of reverse transcription–polymerase chain reaction (RT-PCR) assay from upper respiratory tract specimens (nasopharynx and oropharynx swab) and lower respiratory tract specimens (sputum) for SARS-CoV-2. This testing was performed on days 8, 9, 15, and 16 of isolation. On days 10, 17, 18, and 19, RT-PCR assays from the upper or lower respiratory tract were performed at physician discretion. Cycle threshold (Ct) values in RT-PCR for SARS-CoV-2 detection were determined in both asymptomatic and symptomatic patients.
Results
Of the 303 patients with SARS-CoV-2 infection, the median (interquartile range) age was 25 (22-36) years, and 201 (66.3%) were women. Only 12 (3.9%) patients had comorbidities (10 had hypertension, 1 had cancer, and 1 had asthma). Among the 303 patients with SARS-CoV-2 infection, 193 (63.7%) were symptomatic at the time of isolation. Of the 110 (36.3%) asymptomatic patients, 21 (19.1%) developed symptoms during isolation. The median (interquartile range) interval of time from detection of SARS-CoV-2 to symptom onset in presymptomatic patients was 15 (13-20) days. The proportions of participants with a negative conversion at day 14 and day 21 from diagnosis were 33.7% and 75.2%, respectively, in asymptomatic patients and 29.6% and 69.9%, respectively, in symptomatic patients (including presymptomatic patients). The median (SE) time from diagnosis to the first negative conversion was 17 (1.07) days for asymptomatic patients and 19.5 (0.63) days for symptomatic (including presymptomatic) patients (P = .07). The Ct values for the envelope (env) gene from lower respiratory tract specimens showed that viral loads in asymptomatic patients from diagnosis to discharge tended to decrease more slowly in the time interaction trend than those in symptomatic (including presymptomatic) patients (β = −0.065 [SE, 0.023]; P = .005).
Conclusions and Relevance
In this cohort study of symptomatic and asymptomatic patients with SARS-CoV-2 infection who were isolated in a community treatment center in Cheonan, Republic of Korea, the Ct values in asymptomatic patients were similar to those in symptomatic patients. Isolation of asymptomatic patients may be necessary to control the spread of SARS-CoV-2.
Introduction
Since the first cases of severe acute respiratory syndrome coronavirus 2 (SARS-CoV-2) infection were detected in Wuhan, China, in December 2019,1 a total of 4 789 205 laboratory-confirmed cases and 318 789 deaths have been documented globally as of May 20, 2020.2 An explosive outbreak among a religious group in Daegu, Republic of Korea (ROK), in February 2020 led to a vigorous containment strategy, including massive testing and active contact tracing. As the number of cases surpassed the capacity of the health care system, the Ministry of Health and Welfare of Korea decided to isolate asymptomatic and pauci-symptomatic patients in community treatment centers (CTCs),3 temporary facilities. The potential for transmission from asymptomatic people has been cited as an important factor in controlling the spread of novel coronavirus disease 2019 (COVID-19),4 but there is limited information about the clinical course and viral loads of asymptomatic people with SARS-CoV-2 infection. Using an asymptomatic patient cohort in a CTC, we describe the clinical course of asymptomatic infection and quantitatively compare the molecular viral load of SARS-CoV-2 between asymptomatic and symptomatic patients.
Methods
Study Design and Participants
A retrospective cohort study was conducted at a CTC in Cheonan, ROK, between March 6 and March 26, 2020. In total, 303 patients with SARS-CoV-2 infection were included from Daegu. The CTC was previously a dormitory building for public officials owned by the government. Patients with confirmed infection were isolated in solitary (92%) or shared spaces with separate rooms (8%). Health care personnel included 8 physicians, 12 nurses, and 8 nurse assistants. Physicians took charge of symptom monitoring via daily telephone calls and collection of specimens from patients. Body temperature was monitored twice daily. Patients could be seen by a physician on demand. The clean zone, where health care workers worked, was separated from the patient zone. One negative-pressure container for a portable radiograph imaging facility was located next to the entrance. The Korea Centers for Disease Control and Prevention has recommended the end of isolation after consecutive negative results 24 hours apart after 1 to 2 weeks from isolation. Reverse transcription–polymerase chain reaction (RT-PCR) assay from upper respiratory tract (URT) specimens (nasopharynx and oropharynx swab) and lower respiratory tract (LRT) specimens (sputum) for SARS-CoV-2 were tested on days 8, 9, 15, and 16 of isolation. On days 10, 17, 18, and 19, RT-PCR assays from URT or LRT samples were performed at the discretion of the physician. A negative conversion of RT-PCR assay for SARS-CoV-2 was defined as negative results from both URT and LRT specimens, and the median time of first negative conversion was calculated from the date of diagnosis. Data on demographic characteristics, comorbidities, symptoms, and signs and the results of RT-PCR assay for SARS-CoV-2 were investigated. Asymptomatic patients were defined as those with no symptoms or signs of infection with SARS-CoV-2 during the study period from the date of diagnosis. Presymptomatic patients were defined as asymptomatic from diagnosis to isolation placement with subsequent development of symptoms during observation. This study was approved by the Institutional Review Board (IRB) of Soonchunhyang University, Seoul Hospital (IRB No. 2020-04-007). The IRB waived the requirement for patient informed consent owing to the retrospective nature of the study and its impracticability. This study followed the Strengthening the Reporting of Observational Studies in Epidemiology (STROBE) reporting guideline.
Specimen Collection and RT-PCR for SARS-CoV-2
The URT specimens were collected from both nasopharyngeal and oropharyngeal swabs obtained by trained medical staffs (physicians and nurses). For LRT specimens, participants were given instructions the night before to collect a first morning sputum (after gargling) in a specimen cup; RT-PCR assays for SARS-CoV-2 were performed using Allplex 2020-nCoV assay (Seegene, Seoul, ROK) to determine the presence of virus through the identification of 3 genetic markers: envelope (env) gene, RNA-dependent RNA polymerase (RdRp) gene, and nucleocapsid protein (N) gene. The cycle threshold (Ct) during RT-PCR testing refers to when the detection of viral amplicons occurs, it is inversely correlated with the amount of RNA present. A lower Ct value indicates large quantities of viral RNA. It was considered positive when the Ct values of all genes were less than 40 cycles.
Statistical Analyses
Categorical variables were expressed as counts and frequencies, and continuous variables were expressed as medians and interquartile ranges (IQRs) or means and SDs or SEs. Proportions for categorical variables were compared using χ2 or Fisher exact test. Continuous variables were analyzed using the Mann-Whitney U test method. The proportions of negative conversion were estimated using survival analysis, Kaplan-Meier plot, and log-rank test to determine the difference in median time of the first negative conversion from diagnosis between asymptomatic and symptomatic (including presymptomatic) patients. To estimate marginal effects and linear time interaction by group, generalized estimating equations were used to compare appropriacy of dynamics of Ct values between asymptomatic and symptomatic (including presymptomatic) patients. All statistical analyses were performed using SPSS software, version 26.0 (IBM Corporation). Statistical significance was set as P < .05.
Results
Clinical Characteristics and Prognosis of Asymptomatic Patients
As shown in the Table, the median (IQR) age of patients was 25 (22-36) years, and 201 (66.3%) were women. Only 12 (3.9%) patients had comorbidities (10 had hypertension, 1 had cancer, and 1 had asthma). The median (IQR) time from diagnosis to date of isolation was 6 (6-9) days. Of 303 enrolled patients, 110 (36.3%) were asymptomatic at the time of isolation. Of asymptomatic patients, 21 (19.1%) developed symptoms during isolation. The median (IQR) interval time from diagnosis to symptom onset in presymptomatic patients was 15 (13-20) days. The most common symptoms among 193 symptomatic patients at the time of isolation were cough (108 [56.0%]), rhinorrhea/nasal congestion (88 [45.6%]), and sputum production (53 [27.5%]), followed by sore throat (52 [26.9%]), dysosmia (20 10.4%), diarrhea (10 [5.2%]), dysgeusia (7, [3.6%]), abdominal pain (4 [2.1%]), and vomiting (1 [0.5%]). On March 10, 2020, one symptomatic patient was transferred to the hospital because of severe vomiting. From March 15 to March 16, 2020, a total of 26 asymptomatic patients and 58 symptomatic patients were released from isolation based on the results of RT-PCR from March 13, 14, and 15.
Table. Baseline Characteristics of Patients Infected With Severe Acute Respiratory Syndrome Coronavirus 2 .
| Characteristic | Patients, No. (%) | P value | ||
|---|---|---|---|---|
| Asymptomatic (n = 89) | Presymptomatic (n = 21) | Symptomatic (n = 193) | ||
| Sex | ||||
| Female | 55 (61.8) | 10 (47.6) | 136 (70.5) | .07a |
| Male | 34 (38.2) | 11 (52.4) | 57 (29.5) | |
| Age | ||||
| Median (IQR), y | 22 (22.0-38.5) | 28 (22.5-40.5) | 24 (21.0-31.5) | .30b |
| <20 | 8 (9.0) | 2 (9.5) | 13 (6.7) | |
| 20-29 | 54 (60.7) | 9 (42.9) | 115 (59.6) | |
| 30-39 | 11 (12.4) | 5 (23.8) | 20 (10.4) | |
| 40-49 | 11 (12.4) | 1 (4.8) | 24 (12.4) | |
| ≥50 | 5 (5.6) | 4 (19.0) | 21 (10.9) | |
| Comorbidity | ||||
| Hypertension | 2 (2.2) | 0 | 8 (4.1) | .77b |
| Asthma | 0 | 0 | 1 (0.5) | >.99b |
| Cancer | 0 | 0 | 1 (0.5) | >.99b |
Abbreviation: IQR, interquartile range.
P value by χ2 test.
P value by Fisher exact test.
Comparison of Ct Values of RT-PCR Assay for SARS-CoV-2 Between Asymptomatic and Symptomatic Patients
In total, 1886 RT-PCR assays for SARS-CoV-2 were performed. There were 567 (30.1%) tests performed for asymptomatic patients and 1319 (69.9%) tests performed for symptomatic (including presymptomatic) patients. The mean (SD) number of tests was 6.4 (2.1) per person for the 89 asymptomatic patients and 6.2 (2.3) tests for the 214 symptomatic patients. According to the Kaplan-Meier plot, the proportions of participants with a negative conversion at days 14 and 21 from diagnosis were 33.7% and 75.2% in asymptomatic patients and 29.6% and 69.9% in symptomatic (including presymptomatic) patients, respectively (Figure 1). The median (SE) time from diagnosis to first negative conversion was 17 (1.07) days in asymptomatic patients and 19.5 (0.63) days in symptomatic (including presymptomatic) patients (P = .07) (Figure 1).
Figure 1. Proportion of Negative Conversion in Asymptomatic and Symptomatic (Including Presymptomatic) Patients.

Kaplan-Meier curves for negative conversion ratio between asymptomatic and symptomatic (including presymptomatic) patients. Days since diagnosis means from diagnosis to the first negative conversion. There was no significant difference between the 2 groups (P = .07).
The Ct value dynamics of the RdRp gene from URT specimens showed that viral loads of symptomatic (including presymptomatic) patients tended to decrease more slowly in the time interaction trend than those of asymptomatic patients (β = 0.040 [SE, 0.020]; P = .048) (Figure 2). As shown in Figure 3, the Ct value dynamics of env genes from LRT specimens showed that viral loads of asymptomatic patients tended to decrease more slowly in the time interaction trend than those of symptomatic (including presymptomatic) patients (β = −0.065 [SE, 0.023]; P = .005). There were no significant differences in Ct values of env (β = −0.012 [SE, 0.035]; P = .73) and N genes (β = 0.011 [SE, 0.016]; P = .49), from URT specimens and RdRp (β = −0.015 [SE, 0.026]; P = .57) and N genes (β = −0.006 [SE, 0.018]; P = .75), from LRT specimens between asymptomatic and symptomatic (including presymptomatic) patients.
Figure 2. The Cycle Threshold Value Dynamics of env, RdRp, and N Genes From Upper Respiratory Tract Specimens.
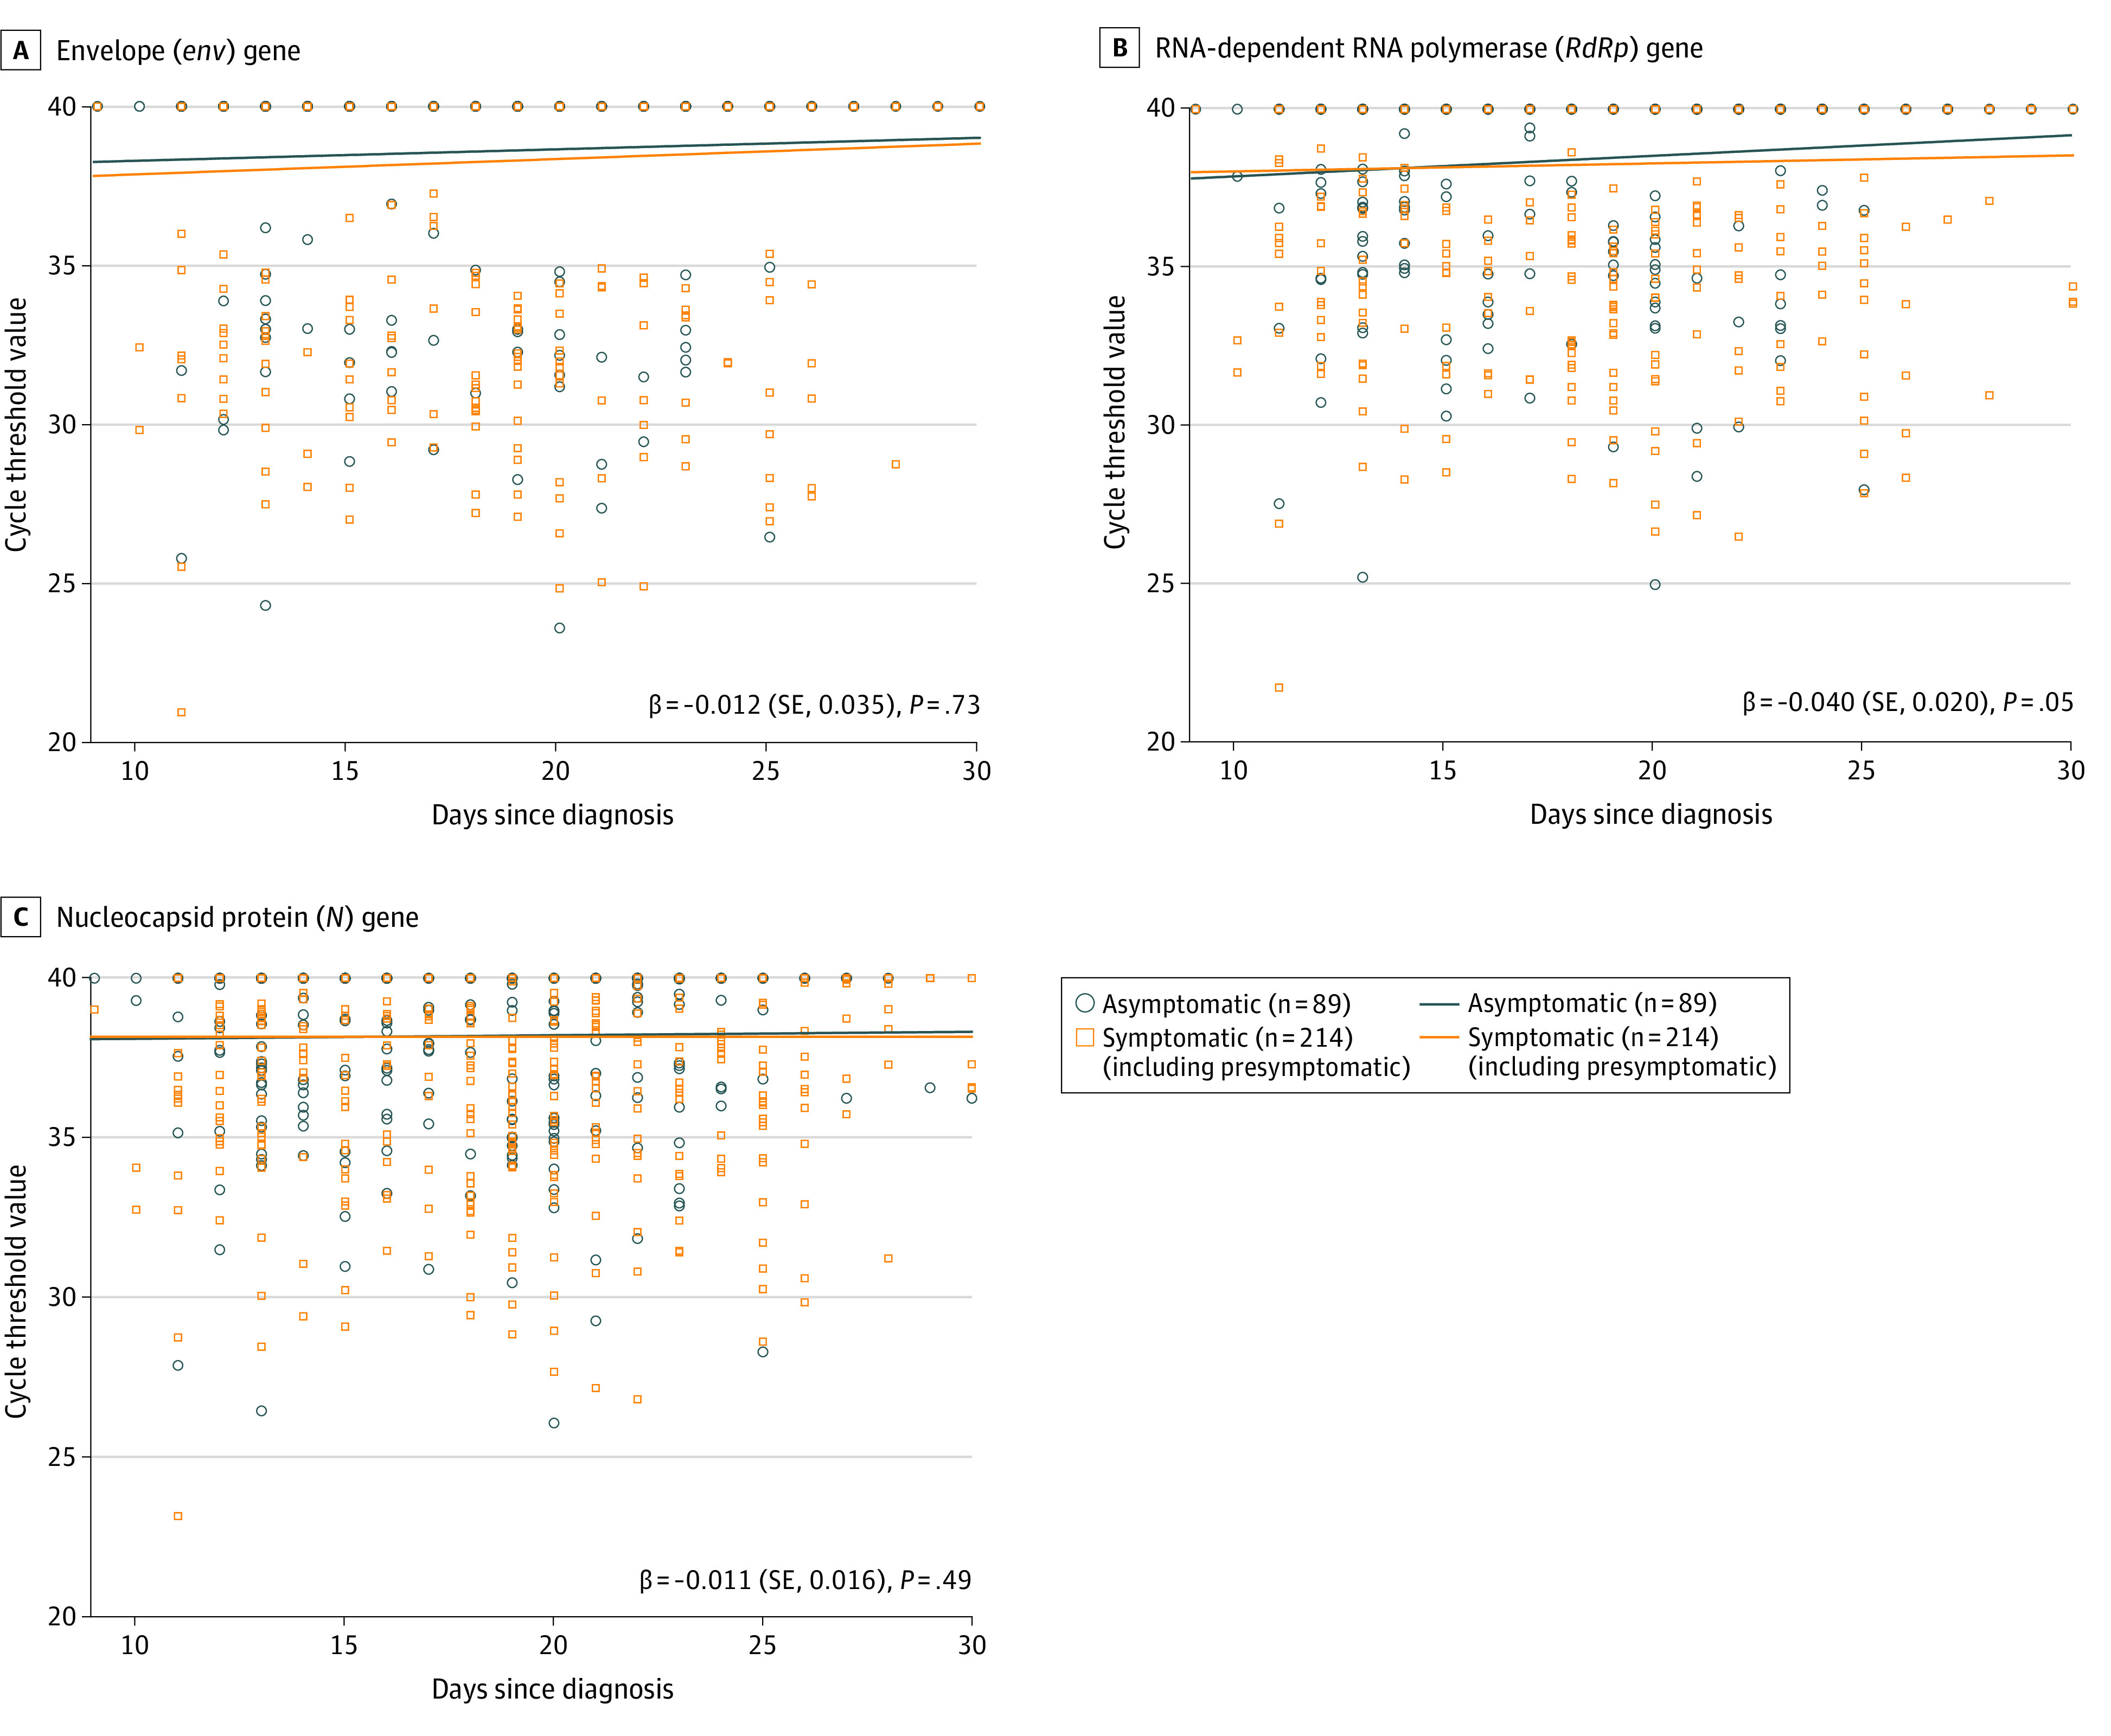
Scatterplots for dynamics of cycle threshold values between asymptomatic and symptomatic (including presymptomatic) patients for the env gene (A), RdRp gene (B), and N gene (C). Beta value represents a slope of decline. There is a significant difference in the RdRp gene between the 2 groups (β = 0.040 [SE, 0.020]; P = .048).
Figure 3. The Cycle Threshold Value Dynamics of env, RdRp, and N Genes From Lower Respiratory Tract Specimens.
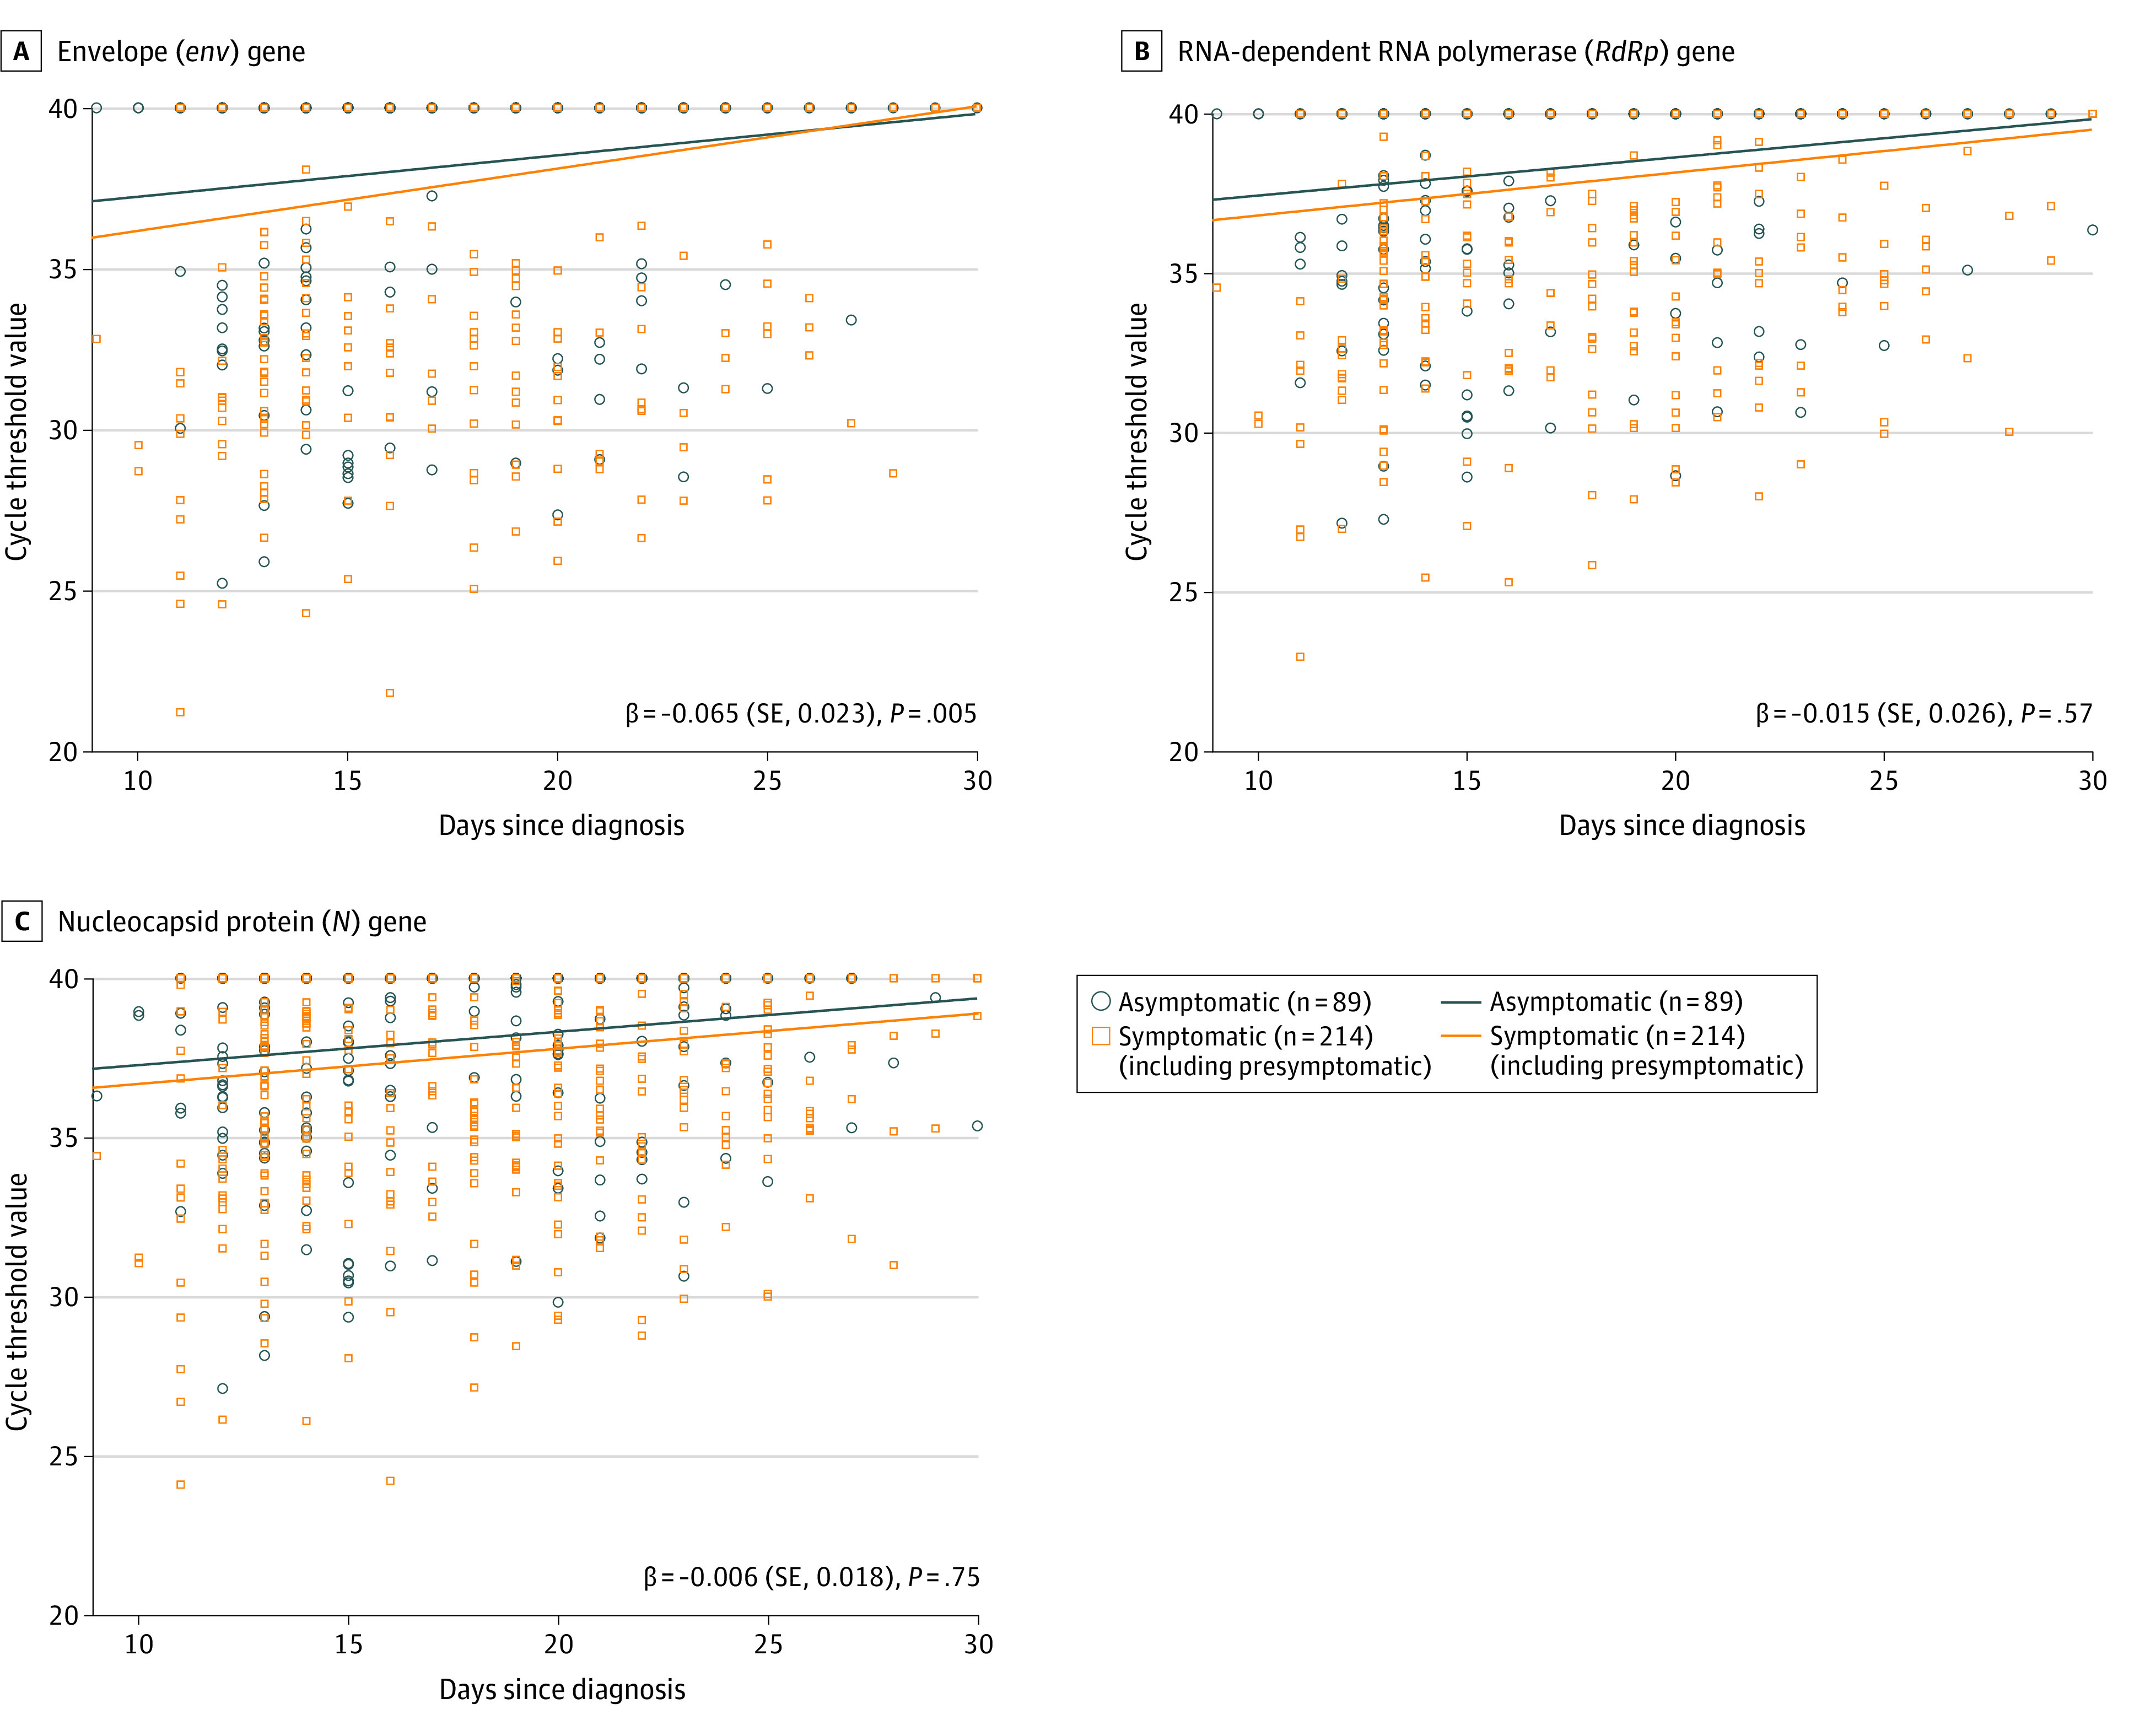
Scatterplots for dynamics of cycle threshold values between asymptomatic and symptomatic (including presymptomatic) patients for the env gene (A), RdRp gene (B), and N gene (C). Beta value represents a slope of decline. There is a significant difference in the env gene between the 2 groups (β = −0.065 [SE, 0.023]; P = .005).
Discussion
The findings demonstrate that 80.9% (95% CI, 77.2%-84.6%) of patients with SARS-CoV-2 who were asymptomatic at the time of detection of a positive RT-PCR remained asymptomatic during a median (IQR) of 24 (20-26) days from diagnosis, and the Ct values in asymptomatic patients were similar to those in symptomatic patients. A previous study in a long-term care facility showed that 56.5% of patients with SARS-CoV-2 infection were asymptomatic at the time of diagnosis, and 23.1% remained asymptomatic during 7 days.5 As mathematically estimated in Diamond Princess cruise ship patients, the proportion of asymptomatic cases was 17.9%.6 In a population-based study in Iceland, 43% of 1221 participants who tested positive were asymptomatic initially, although symptoms developed later.7 In these previous reports, presymptomatic patients were also considered asymptomatic cases because the clinical course of asymptomatic cases was not observed. In our study, asymptomatic patients who were required to be isolated in a CTC according to government policy were fully observed by health care personnel. An important implication of our findings is that there may be substantial underreporting of infected patients using the current symptom-based surveillance and screening.
Little is known about the infectiveness of asymptomatic patients. Our findings, given a recent report of SARS-CoV-2 transmission from an asymptomatic person to 4 family members,8 nevertheless offer biological plausibility to such reports of transmission by asymptomatic people. A previous study9 analyzing a small number of patients also reported that viral load of asymptomatic SARS-CoV-2 patients was as high as that of symptomatic patients. Although the high viral load we observed in asymptomatic patients raises a distinct possibility of a risk for transmission, our study was not designed to determine this. In this study, Ct values of env genes from LRT specimens in asymptomatic patients tended to decrease more gradually than those of symptomatic patients. It appears that the env target signal was aberrant owing to fragmented or degraded genomes. The genetic material of dead viral particles remaining within epithelial cells can be detected as epithelial cells are desquamated.10 In a recent study, viral shedding from sputum has been shown to extend beyond symptom duration.11 It is important to note that detection of viral RNA does not equate infectious virus being present and transmissible. For a better understanding of the viral shedding and potential transmissibility of asymptomatic infection, large rigorous epidemiologic and experimental studies are needed.
Limitations
This study has limitations. First, it is possible that the asymptomatic patients in our cohort were not representative of all asymptomatic patients in the community because false negatives would not have been included in our sample. This may have been in contrast to symptomatic patients, where the false-negative rate was lower. Unfortunately, without widespread testing in the community with different methods, we have no way of knowing if this was the case. Second, we did not determine the role that molecular viral shedding played in transmission from asymptomatic patients. An epidemiologic investigation with this objective was not conducted, and we did not obtain information about the date of exposure and symptom onset prior to isolation. However, had we obtained this information, inferences would still be uncertain because of difficulty validating exposures and determining which exposure was a causal relationship. Third, our findings cannot be generalized to the entire population, because our cohort consisted of young, healthy patients. Fourth, we could not evaluate the adequacy of sputum specimens because of biosafety issues and equipment availability.
Conclusions
In this cohort study of symptomatic and asymptomatic patients with SARS-CoV-2 infection who were isolated in a community treatment center in Cheonan, ROK, the Ct values in asymptomatic patients were similar to those in symptomatic patients. Viral molecular shedding was prolonged. Because transmission by asymptomatic patients with SARS-CoV-2 may be a key factor in community spread, population-based surveillance and isolation of asymptomatic patients may be required.
References
- 1.Zhu N, Zhang D, Wang W, et al. ; China Novel Coronavirus Investigating and Research Team . A novel coronavirus from patients with pneumonia in China, 2019. N Engl J Med. 2020;382(8):727-733. doi: 10.1056/NEJMoa2001017 [DOI] [PMC free article] [PubMed] [Google Scholar]
- 2.World Health Organization Coronavirus disease (COVID-19) pandemic. Accessed May 20, 2020. https://www.who.int/emergencies/diseases/novel-coronavirus-2019
- 3.Park PG, Kim CH, Heo Y, Kim TS, Park CW, Kim CH. Out-of-hospital cohort treatment of coronavirus disease 2019 patients with mild symptoms in Korea: an experience from a single community treatment center. J Korean Med Sci. 2020;35(13):e140. doi: 10.3346/jkms.2020.35.e140 [DOI] [PMC free article] [PubMed] [Google Scholar]
- 4.Li R, Pei S, Chen B, et al. Substantial undocumented infection facilitates the rapid dissemination of novel coronavirus (SARS-CoV-2). Science. 2020;368(6490):489-493. doi: 10.1126/science.abb3221 [DOI] [PMC free article] [PubMed] [Google Scholar]
- 5.Kimball A, Hatfield KM, Arons M, et al. ; Public Health – Seattle & King County; CDC COVID-19 Investigation Team . Asymptomatic and presymptomatic SARS-CoV-2 infections in residents of a long-term care skilled nursing facility—King County, Washington, March 2020. MMWR Morb Mortal Wkly Rep. 2020;69(13):377-381. doi: 10.15585/mmwr.mm6913e1 [DOI] [PMC free article] [PubMed] [Google Scholar]
- 6.Mizumoto K, Kagaya K, Zarebski A, Chowell G. Estimating the asymptomatic proportion of coronavirus disease 2019 (COVID-19) cases on board the Diamond Princess cruise ship, Yokohama, Japan, 2020. Euro Surveill. 2020;25(10). doi: 10.2807/1560-7917.ES.2020.25.10.2000180 [DOI] [PMC free article] [PubMed] [Google Scholar]
- 7.Gudbjartsson DF, Helgason A, Jonsson H, et al. Spread of SARS-CoV-2 in the Icelandic population. N Engl J Med. 2020;382(24):2302-2315. doi: 10.1056/NEJMoa2006100 [DOI] [PMC free article] [PubMed] [Google Scholar]
- 8.Bai Y, Yao L, Wei T, et al. Presumed asymptomatic carrier transmission of COVID-19. JAMA. 2020;323(14):1406-1407. doi: 10.1001/jama.2020.2565 [DOI] [PMC free article] [PubMed] [Google Scholar]
- 9.Zou L, Ruan F, Huang M, et al. SARS-CoV-2 viral load in upper respiratory specimens of infected patients. N Engl J Med. 2020;382(12):1177-1179. doi: 10.1056/NEJMc2001737 [DOI] [PMC free article] [PubMed] [Google Scholar]
- 10.Rawlins EL, Hogan BL. Ciliated epithelial cell lifespan in the mouse trachea and lung. Am J Physiol Lung Cell Mol Physiol. 2008;295(1):L231-L234. doi: 10.1152/ajplung.90209.2008 [DOI] [PMC free article] [PubMed] [Google Scholar]
- 11.Wölfel R, Corman VM, Guggemos W, et al. Virological assessment of hospitalized patients with COVID-2019. Nature. 2020;581(7809):465-469. doi: 10.1038/s41586-020-2196-x [DOI] [PubMed] [Google Scholar]