

SUMMARY
Post-transcriptional mechanisms have the potential to influence complex changes in gene expression, yet their role in cell fate transitions remain largely unexplored. Here, we show that suppression of the RNA helicase DDX6 endows human and mouse primed embryonic stem cells (ESCs) with a differentiation-resistant, “hyper-pluripotent” state, which readily reprograms to a naïve state resembling the preimplantation embryo. We further demonstrate that DDX6 plays a key role in adult progenitors where it controls the balance between self-renewal and differentiation in a context-dependent manner. Mechanistically, DDX6 mediates the translational suppression of target mRNAs in P-bodies. Upon loss of DDX6 activity, P-bodies dissolve and release mRNAs encoding fate-instructive transcription and chromatin factors that re-enter the ribosome pool. Increased translation of these targets impacts cell fate by rewiring the enhancer, heterochromatin and DNA methylation landscapes of undifferentiated cell types. Collectively, our data establish a link between P-body homeostasis, chromatin organization and stem cell potency.
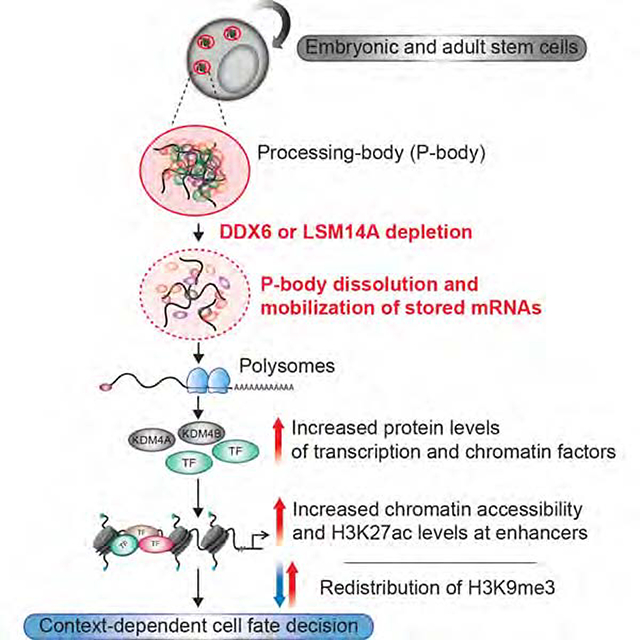
Graphical Abstract
ETOC
P-bodies are cytoplasmic RNP granules whose role in stem cells remains largely elusive. Di Stefano et al. show that the disruption of P-bodies upon loss of DDX6 perturbs the self-renewal and differentiation of various stem cell populations through translational upregulation of cell fate regulators and profound rewiring of chromatin landscapes.
INTRODUCTION
Pluripotent stem cells (PSCs), such as embryonic stem cells (ESCs) and induced pluripotent stem cells (iPSCs), serve as valuable in vitro systems to study stem cell self-renewal and cell fate commitment (Apostolou and Hochedlinger, 2013; Weinberger et al., 2016; Wu and Izpisua Belmonte, 2016). Differentiation of PSCs requires exit from the pluripotent state, which involves the dissolution of the transcriptional network that maintains self-renewal and the induction of gene expression programs that drive lineage specification during early development (Kalkan and Smith, 2014; Martello and Smith, 2014; Smith, 2017). A significant body of work in mouse ESCs has established the powerful role of transcription factors (TFs) and chromatin regulators in these processes (Betschinger et al., 2013; Cirera-Salinas et al., 2017; Kalkan et al., 2019; Leeb et al., 2014; Martello et al., 2012; Tian et al., 2019; Waghray et al., 2015; Wray et al., 2011). However, the mechanisms by which these factors are regulated during exit from pluripotency and their potential role across other stem cell types and species are understudied.
Post-transcriptional control of gene expression is mediated by noncoding RNAs (Flynn and Chang, 2014; Greve et al., 2013) and RNA binding proteins (RBPs) (Guallar and Wang, 2014; Ye and Blelloch, 2014), which influence gene expression at multiple levels of RNA processing, including splicing, alternative polyadenylation, cellular localization, stability and translation (Brumbaugh et al., 2018; Keene, 2007; Ye and Blelloch, 2014). The biological function of RBPs has been predominantly studied in non-mammalian cells or cancer cell lines, even though RBPs are widely expressed across tissues and cell types where they are thought to play critical roles. Previous reports examining RBPs in mouse ESCs focused on regulators of alternative splicing, polyadenylation and RNA modifications (Batista et al., 2014; Bertero et al., 2018; Brumbaugh et al., 2018; Conway et al., 2016; Geula et al., 2015; Guallar et al., 2018; Han et al., 2013; Lackford et al., 2014; Lu et al., 2013; Wilbert et al., 2012; Yeo et al., 2009) while other RNA processes such as RNA decay, storage and translational control remain largely unexplored. Thus, there is a need to define the role of additional, ubiquitously expressed RBPs and associated mechanisms in the context of human pluripotent as well non-pluripotent stem cell populations.
In addition to individual RBPs, Processing-bodies (P-bodies) have been implicated in the control of post-transcriptional processes. P-bodies are membrane-less cytoplasmic organelles that form via phase-separation once RNAs and nearby RBPs assemble into ribonuclear particle (RNP) granules (Boeynaems et al., 2018; Luo et al., 2018b; Standart and Weil, 2018). While earlier studies suggested that P-bodies function in both the decay and translational repression of mRNAs, subsequent evidence supported the conclusion that P-bodies primarily control the storage of untranslated mRNAs by sequestering them from the translational machinery (Brengues et al., 2005; Decker and Parker, 2012). Consistent with the latter notion, mRNAs stored in P-bodies were recently shown to re-enter the ribosome pool in response to changing cellular conditions (Hubstenberger et al., 2017). These results emphasize the importance of P-bodies in post-transcriptional gene regulation in non-mammalian cells and cancer cell lines. However, their potential function in developmental transitions remains unclear.
In this study, we discovered that the RNA helicase DDX6, which is essential for eukaryotic P-body assembly, is a critical regulator of human and mouse stem cell potency. Mechanistically, DDX6 influences cell fate in a context-dependent manner by controlling the translation of specific mRNAs via P-body assembly. The affected transcripts encode fate-instructive transcription and chromatin factors. Our results further reveal a connection between P-body homeostasis and chromatin organization, which underlie the observed cell fate changes across different lineages.
RESULTS
Exit from pluripotency is initiated by a post-transcriptional mechanism
It remains unclear whether exit from pluripotency is initiated by epigenetic, transcriptional or post-transcriptional mechanisms. To address this question, we compared changes to chromatin accessibility by ATAC-seq and pluripotency transcript levels by qRT-PCR upon treatment of hESCs with the TGFβ-pathway inhibitor A8301 (TGFβi), which triggers exit from pluripotency. We used ATAC-seq as a proxy for TF activity since changes in TF binding typically underlie changes in chromatin accessibility. After 48 hours of TGFβi treatment, the transcriptional downregulation of key pluripotency genes, including NANOG, OCT4 (POU5F1) and PRDM14 was evident (Figure S1A). By contrast, we did not observe significant changes to chromatin accessibility at regulatory regions for these and other pluripotency genes (Figure S1B), suggesting that the initial dissolution of the pluripotency circuitry is not due to altered TF binding at stem cell-associated loci. We therefore hypothesized that other, post-transcriptional factors could be key molecular determinants of early stem cell differentiation by modulating the expression of pluripotency genes.
To identify post-transcriptional regulators that may control exit from pluripotency, we analyzed previous loss-of-function screens conducted in mouse and human ESCs. These screens were designed to identify factors that are essential for PSC differentiation (Betschinger et al., 2013; Gonzales et al., 2015; Leeb et al., 2014; Li et al., 2018; Yang et al., 2012) and the vast majority of reported hits remain unexplored. We first focused on a comprehensive exit from pluripotency screen in hESCs (Gonzales et al., 2015) by searching for RBPs whose suppression confers resistance to differentiation induced with either of two potent commitment stimuli, TGFβi treatment or withdrawal of the self-renewal factors bFGF and TGFβ. Intriguingly, siRNAs targeting DDX6 emerged as the strongest and most consistent suppressor of exit from pluripotency across multiple replicates and conditions (Figure S1C). Ddx6 hairpins also scored highly in two similar screens in mouse (Li et al., 2018; Yang et al., 2012), suggesting that DDX6’s role in ESC differentiation is conserved across species (Figure S1D). DDX6 encodes an RNA helicase, which is expressed in most human tissues (Figure S1E) and has been implicated in the assembly and maintenance of P-bodies based on previous studies in yeast and cancer cell lines (Decker and Parker, 2012; Luo et al., 2018a; Parker and Sheth, 2007). However, its role in pluripotent cells remains unexplored.
DDX6 is required for exit from the pluripotent state
To investigate the functional role of DDX6 in hPSCs, we utilized a transgenic CRISPR interference (CRISPRi) system in hiPSCs (Mandegar et al., 2016) that facilitates efficient and temporal transcriptional silencing of DDX6 (Figure 1A, Figure S1F). We found that all DDX6-specific sgRNAs were highly effective at gene suppression (>70%), with sgDDX6 #5 being the most effective (~90%) (Figure 1A, B and Figure S1G, H). Notably, DDX6 silencing completely abrogated P-body assembly in hPSCs based on staining for the P-body marker EDC4, confirming a previous report in HeLa cells (Ayache et al., 2015) and extending this observation to human PSCs (Figure 1C). We then induced differentiation of sgDDX6 and control cells before measuring NANOG expression by flow cytometry and immunofluorescence. While control cells rapidly downregulated NANOG levels, sgDDX6 hiPSCs maintained its expression, consistent with resistance to differentiation (Figure 1D, E and Figure S1I). In addition, DDX6 suppression impaired the silencing of other pluripotency-related transcripts such as OCT4, KLF4 and DPPA3 after induction of differentiation (Figure S1J). To corroborate these results using an independent cell line and method, we transduced hESCs carrying an OCT4-GFP reporter (Hockemeyer et al., 2011) with lentiviral vectors expressing small hairpin RNAs (shRNAs) against DDX6 (shDDX6 #1 and #2) (Figure S2A). Similar to our observation in CRISPRi hiPSCs, shRNA-mediated DDX6 depletion in hESCs impaired downregulation of the OCT4-GFP reporter, NANOG protein and additional pluripotency-associated transcripts after TGFβi treatment or withdrawal of bFGF and TGFβ (Figure S2B–D). Taken together, these data demonstrate that DDX6 is crucial for exit from pluripotency in human PSCs.
Figure 1. DDX6 depletion endows hPSCs with a differentiation-resistant, “hyper-pluripotent” state.
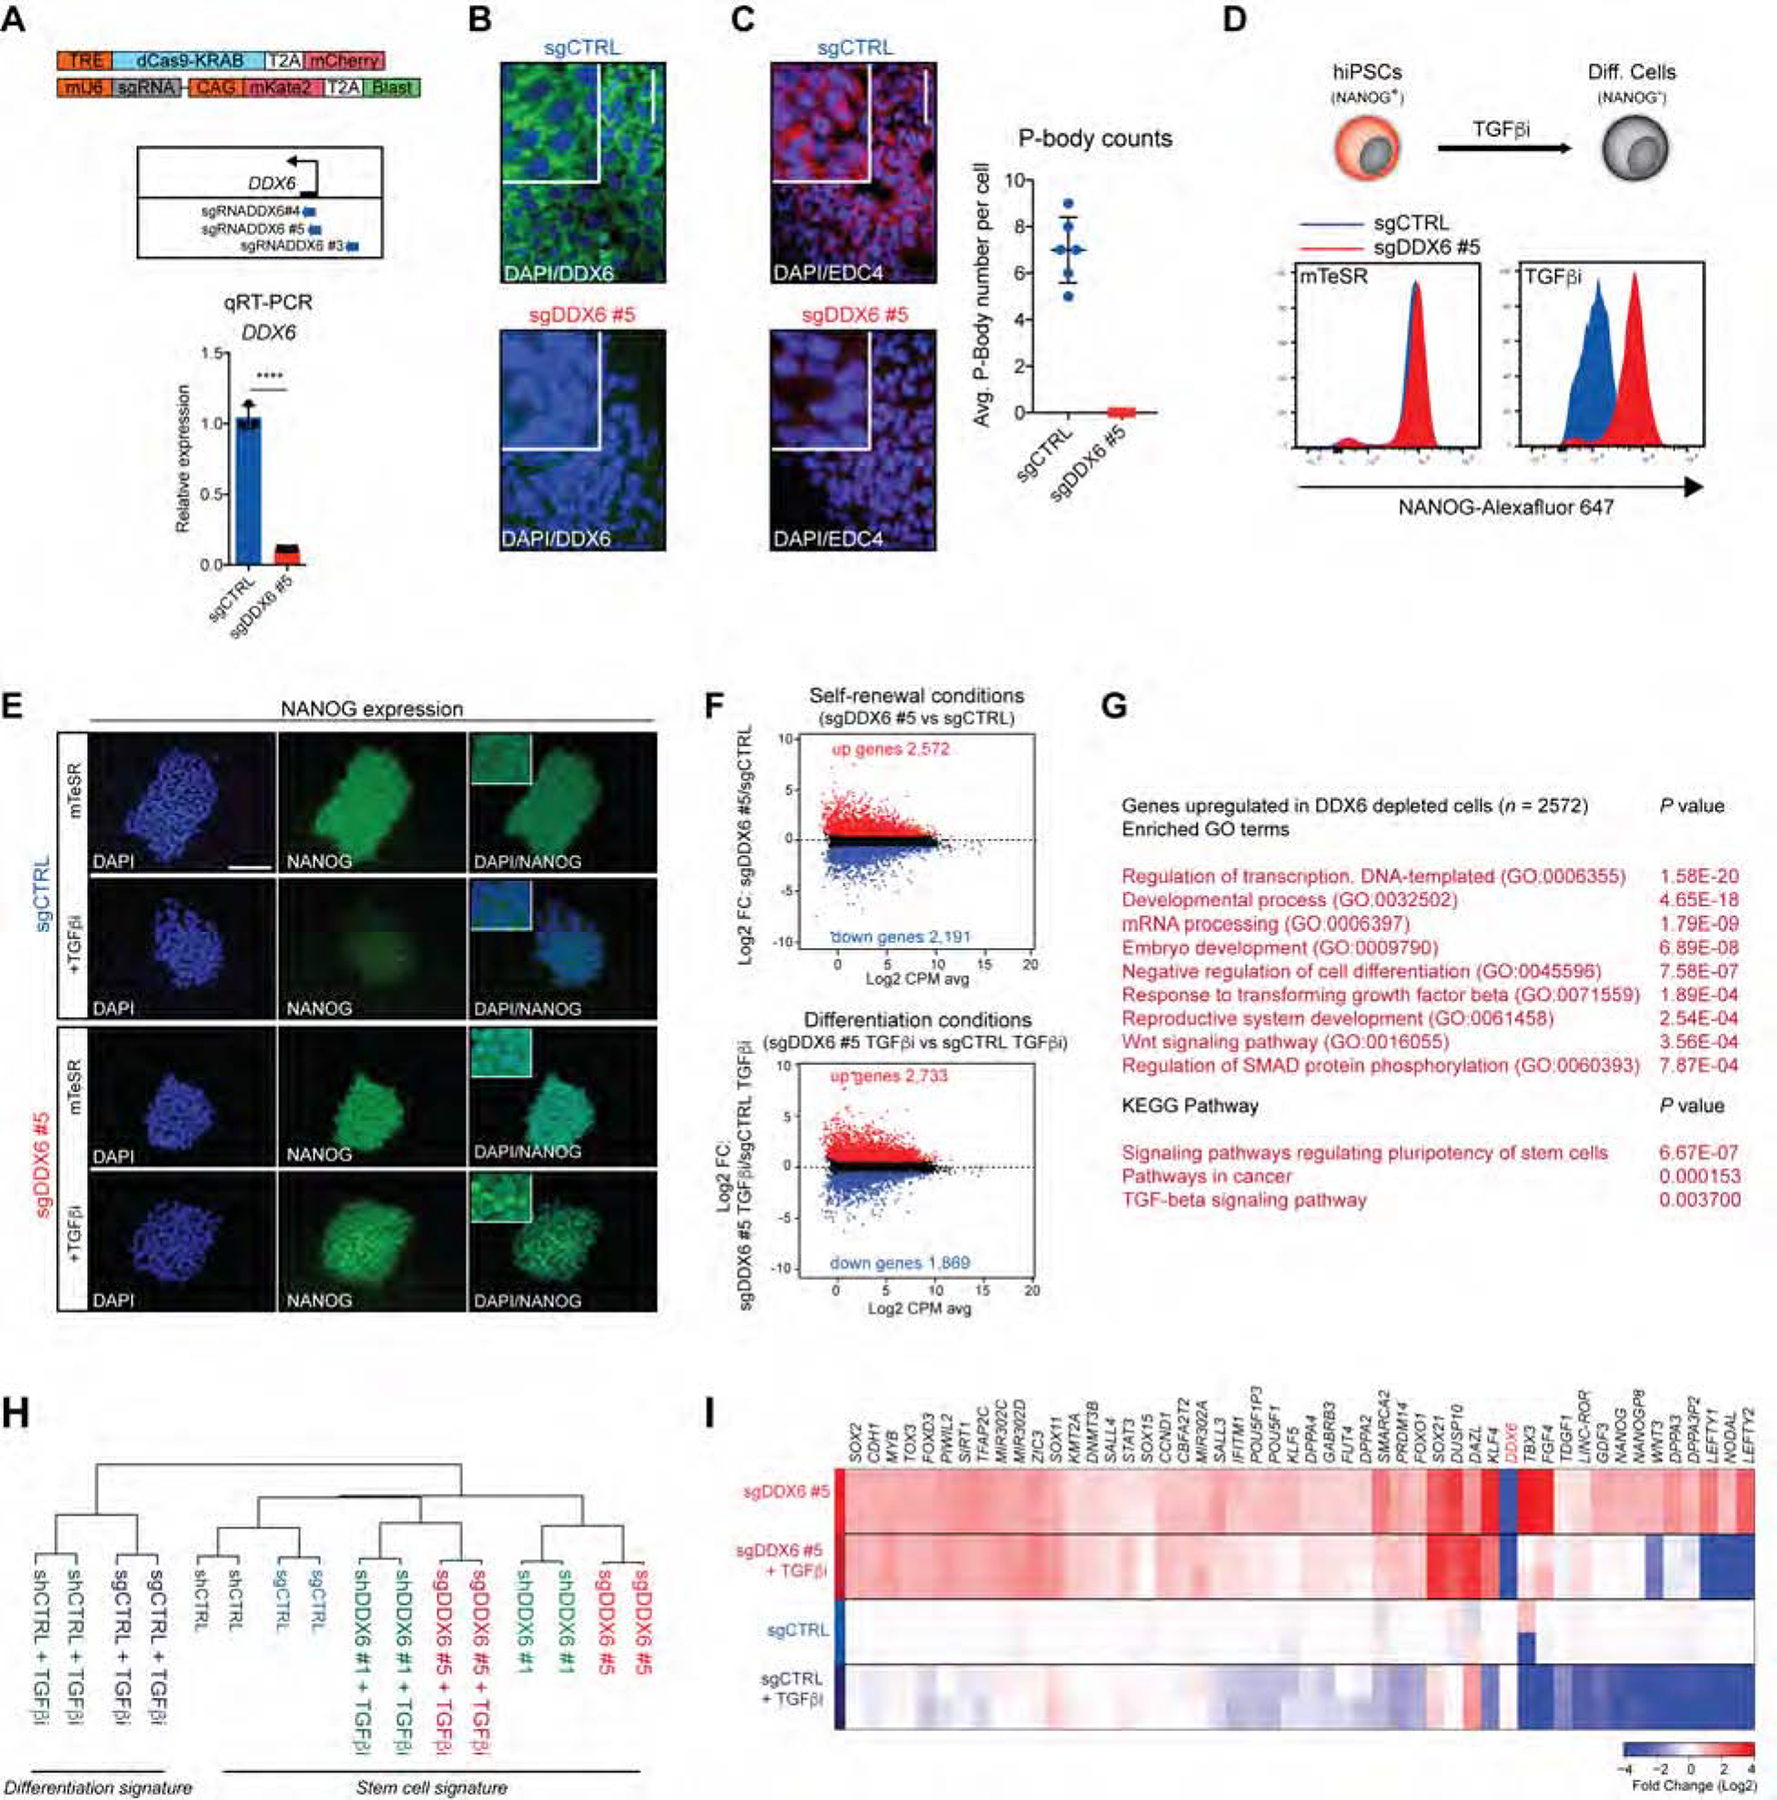
(A) Schematic of dCas9-KRAB and sgRNA vectors and genomic positions of the sgRNA targeting the DDX6 TSS (upper panel). QRT-PCR analysis of DDX6 in sgCTRL and sgDDX6 #5 cells treated with dox. Unpaired Student’s t test. n=3, mean ± s.d., ****P<0.0001. (B) Immunofluorescence image showing protein expression of DDX6 (scale: 50 μm; inset 2X). (C) Immunofluorescence image showing protein expression of EDC4 (scale: 50 μm; inset 2X) (left panel). P-body count per cell (right panel), n=6, mean ± s.d. (D) Schematic of hiPSCs differentiation (upper panel). FACS analysis of the proportion of NANOG+ cells (lower panel). (E) Immunofluorescence images showing protein expression of NANOG (scale: 100μm). (F) MA plots of RNA-seq data depicting upregulated genes in red and downregulated genes in blue (FC>1.5; FDR<0.01). (G) GO and KEGG pathways analysis of upregulated genes (FC>1.5; FDR<0.01) in sgDDX6 #5 vs sgCTRL cells. (H) Hierarchical clustering of RNA-seq samples. (I) Heatmap showing expression levels of selected pluripotency genes (n=2 each condition).
See also Figures S1, S2 and S3.
We next asked whether our observations in human PSCs were conserved in mouse ESCs (mESCs). For this purpose, we used a reporter line in which a destabilized version of GFP has been knocked into the endogenous Rex1 locus (termed Rex1GFP), which is rapidly silenced upon pluripotency exit (Wray et al., 2011). Similar to our findings in hPSCs, we determined that Ddx6 suppression delayed silencing of the Rex1-GFP reporter and led to sustained expression of pluripotency genes in differentiation conditions (Figure S2E, F).
Collectively, our results show that DDX6 is a key factor controlling the dissolution of the pluripotent state in mouse and human PSCs.
DDX6 suppression facilitates acquisition of a “hyper-pluripotent” state in PSCs
To gain insight into the mechanisms by which DDX6 modulates exit from pluripotency, we performed RNA-seq to compare gene expression patterns between control and DDX6 depleted hPSCs cultured under self-renewal or differentiation conditions. Remarkably, DDX6 silencing caused widespread transcriptional changes in both self-renewal (2,572 genes upregulated; 2,191 genes downregulated) and differentiation (2,733 genes upregulated; 1,869 genes downregulated) conditions (Figure 1F and Figure S3A). As expected, genes upregulated in control cells treated with TGFβi belonged to differentiation-related gene ontology (GO) categories (Figure S3B). By contrast, genes upregulated in DDX6-depleted cells cultured in self-renewal or differentiation conditions were associated with categories related to pluripotency such us “embryo development”, “stem cell pluripotency”, and “TGFβ signaling”, consistent with the observed resistance to differentiation (Figure 1G and Figure S3C–E). In agreement, genes downregulated after DDX6 suppression in self-renewal or differentiation conditions were associated with categories related to lineage specification including “cell adhesion”, “cell differentiation”, and “neurogenesis” (Figure S3F–I). Hierarchical clustering of our RNA-seq samples showed that TGFβi-treated cells depleted for DDX6 were more similar to undifferentiated control samples than to TGFβi-treated control samples (Figure 1H), supporting the notion that suppression of DDX6 retains an undifferentiated transcriptional program.
Closer inspection of our RNA-seq data generated from undifferentiated DDX6 depleted cells cultured in self-renewal conditions revealed a marked upregulation of TFs, chromatin regulators and lncRNAs associated with pluripotency including OCT4, NANOG, KLF4/5, DPPA2/3/4, PRDM14 and LINC-ROR (Figure 1I and Figure S3J). We confirmed increased transcript levels for these genes using qRT-PCR (Figure S1J and Figure S2D). Similar to our findings in human PSCs, knockdown of Ddx6 in mESCs led to elevated expression of pluripotency TFs (Figure S2F), indicating that Ddx6’s function in undifferentiated PSCs is again conserved across species.
Together, these data suggest that suppression of DDX6 facilitates the acquisition of a “hyper-pluripotent” state that is resistant to differentiation stimuli.
Suppression of DDX6 endows hPSCs with naïve-like characteristics
Human PSCs cultured in conventional media exist in a primed state that is representative of the post-implantation epiblast, whereas hPSCs exposed to specific pathway inhibitors adopt a naive state that is representative of the pre-implantation epiblast (Weinberger et al., 2016). Unexpectedly, we discovered that DDX6 suppression not only led to the upregulation of pluripotency genes that are already expressed in primed hESCs but also to the induction of certain genes highly expressed in naïve hPSCs (e.g., KLF4, DPPA3, GDF3) (Figure 1I, 2A and Figure S3F–I). Accordingly, DDX6 is expressed at lower levels in preimplantation epiblast and naïve hESCs relative to postimplantation epiblast and primed hESCs, respectively (Figure 2B, C), supporting a possible regulatory role for DDX6 during the transition from naïve to primed pluripotency. We therefore investigated whether depletion of DDX6 induces other features associated with naïve pluripotency such as DNA hypomethylation and reactivation of the HERVK family of transposable elements. Indeed, our RNA-seq data revealed a significant upregulation of HERVK elements in DDX6 depleted cells while most of the other transposable elements remained unaffected (Figure 2D). Reduced representation bisulfite sequencing (RRBS) indicated that although DDX6 depletion did not induce global hypomethylation typical of naïve hPSCs, localized demethylation occurred at ~200 promoters relative to control cells (Figure 2E). Further analysis of these hypomethylated regions revealed that several of these sites corresponded to promoters of known naïve-specific genes, including DPPA2, DPPA3 and PIWIL2 (Figure 2E), which are activated after DDX6 suppression (Figure 1I).
Figure 2. Human ESCs depleted for DDX6 acquire naïve-like features.
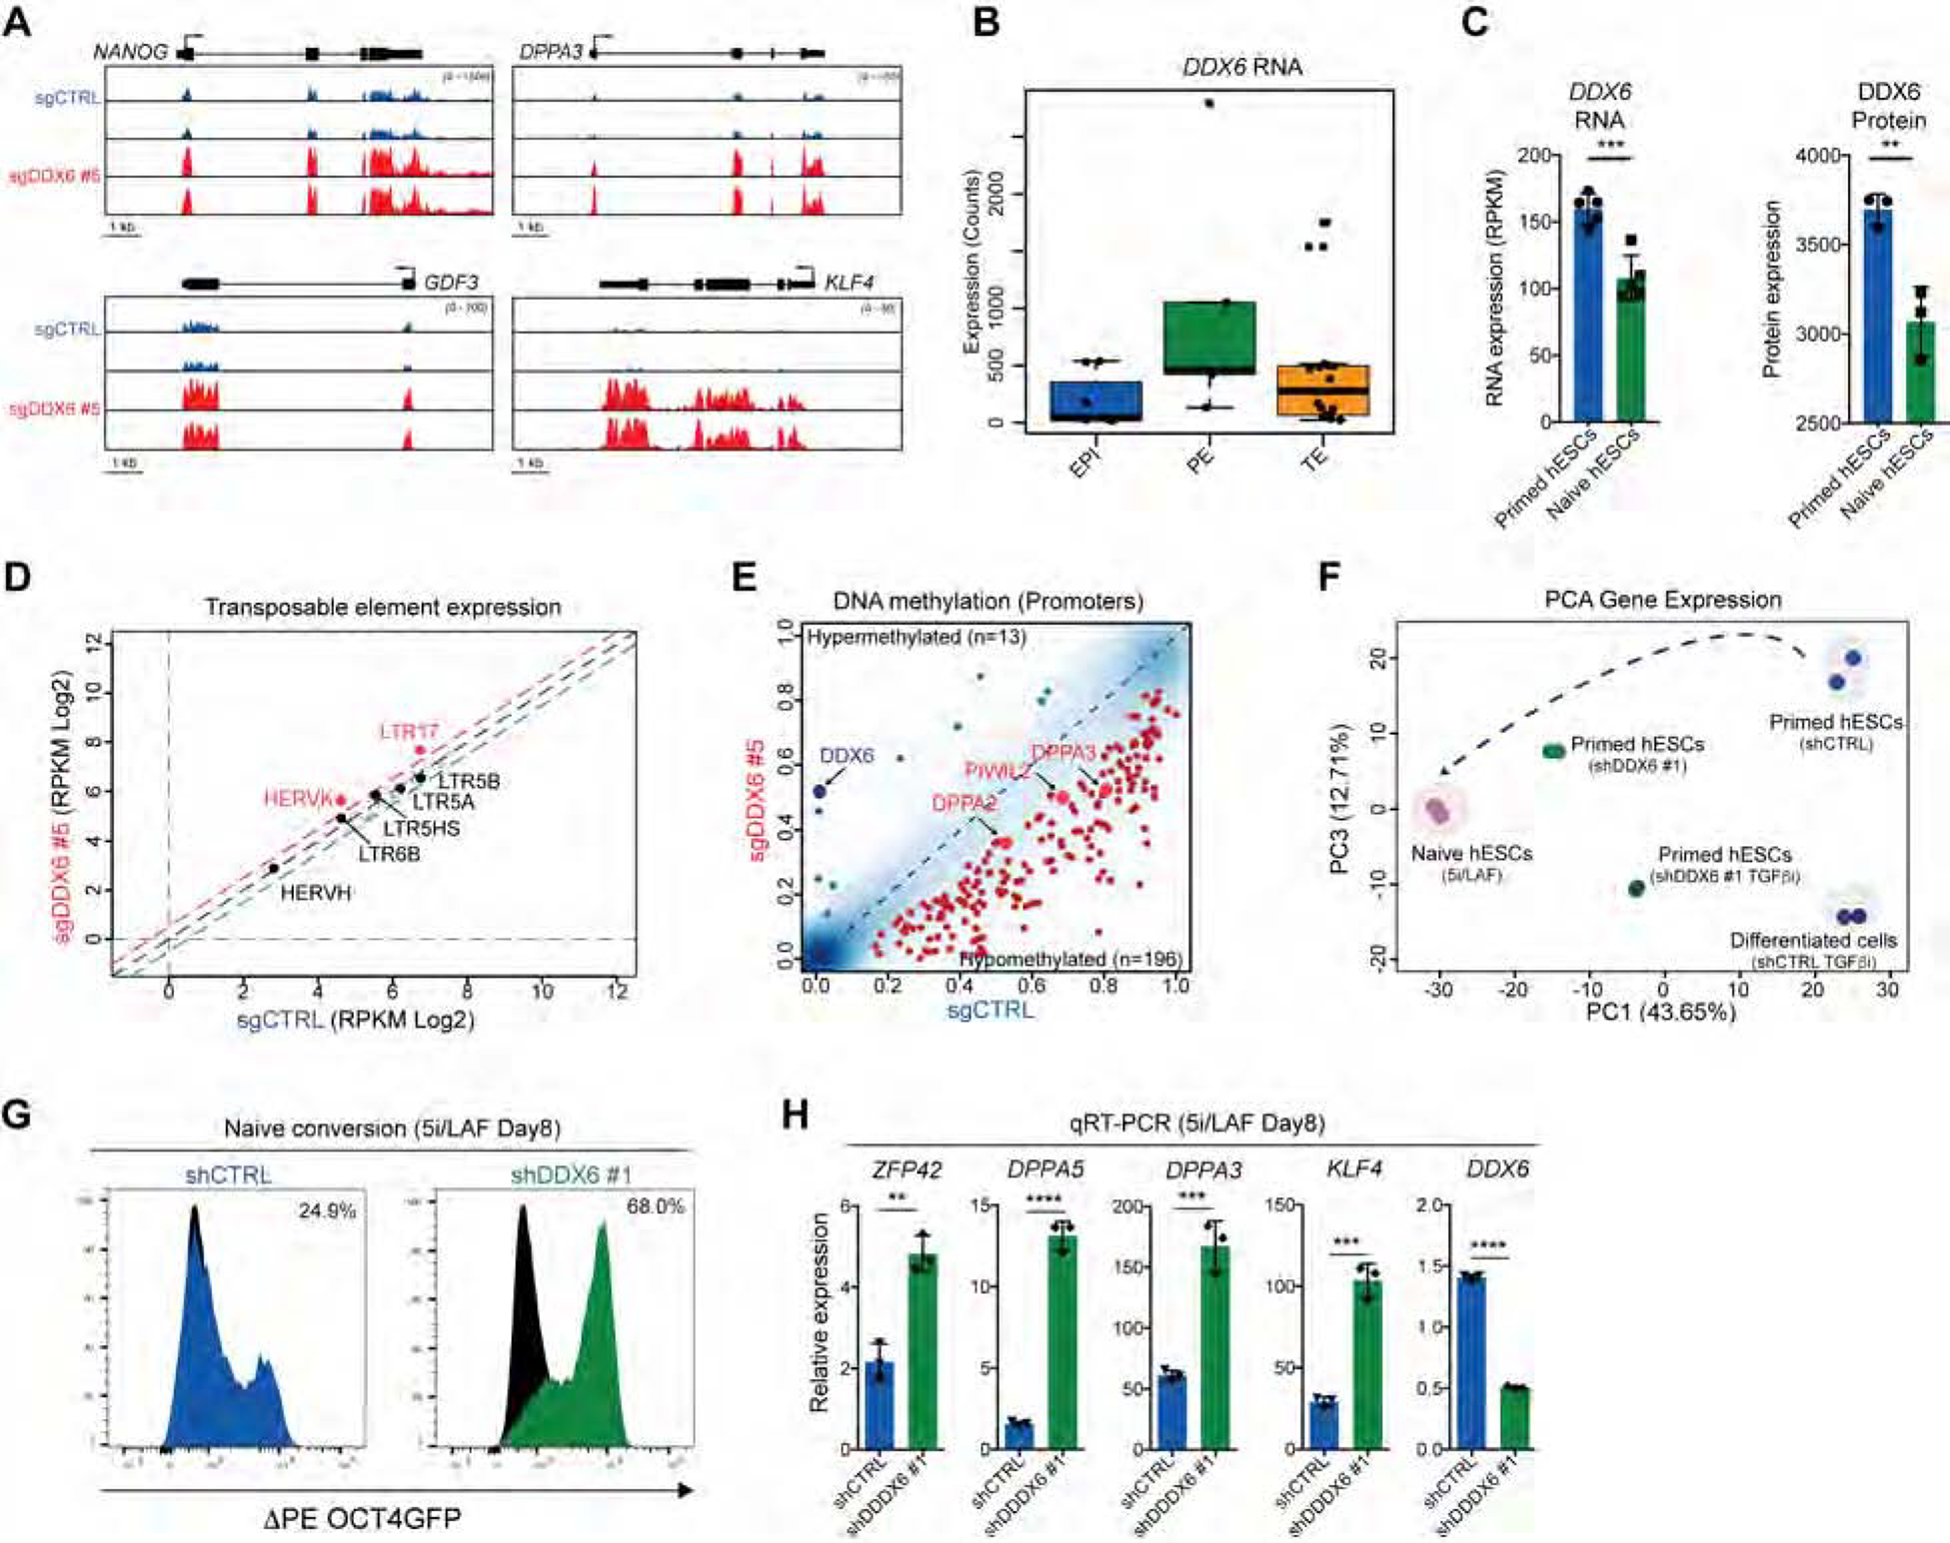
(A) Gene tracks showing RNA-seq data. (B) Single cell RNA-seq data for DDX6 expression in human preimplantation embryos (Petropoulos et al., 2016). Epi: Epiblast; Pe: Primitive Endoderm; TE: trophectoderm. (C) RNA-seq and protein expression data for DDX6 in primed and naïve hESCs (Di Stefano et al., 2018). For RNA-seq data, n=5, mean ± s.d., unpaired Student’s t-test, ***P<0.001. For proteomic data, n=3, mean ± s.d., unpaired Student’s t-test, **P<0.01. (D) Analysis of repetitive element expression. Repeats with significant expression differences are indicated in red (FC>1.5, FDR <0.05). (E) Differentially methylated promoter regions in DDX6 depleted cells relative to control cells. Significantly hypomethylated promoters are shown in red (>10% difference, P<0.01); significantly hypermethylated promoters are shown in blue (>10% difference, P<0.01). (F) PCA analysis of RNA-seq data for the indicated samples based on differentially expressed genes between shDDX6 #1 and shCTRL hESCs. (G) Flow cytometric detection of ΔPE OCT4-GFP+ cells after reversion of primed hESCs to a naïve state in 5i/LAF medium. Black curve shows the negative control. (H) QRT-PCR analysis for the indicated genes after 8 days of 5i/LAF treatment. Values are represented respect to control cells at day 0. n=3, mean ± s.d., unpaired Student’s t-test, **P<0.01, ***P<0.001, ****P<0.0001.
See also Figure S4.
To assess the transcriptional similarity between DDX6 depleted hESCs and bona fide naïve hESCs globally, we reprogrammed primed hESCs to a naïve state using the 5i/LAF condition (Theunissen et al., 2014) and compared their transcriptome to that of shCTRL- and shDDX6-transduced primed hESCs. Indeed, Principal Component Analysis (PCA) of these samples suggests that suppression of DDX6 endows hESCs cultured in conventional conditions with a state that is between primed and bona fide naïve pluripotent cells (Figure 2F). Suppression of DDX6 also facilitated the reprogramming of primed hESCs to a bona fide naïve state in 5i/LAF media, which is based on increased induction of the naïve-specific ΔPE OCT4-GFP reporter (~70% GFP+ cells in shDDX6 cells vs. 20% GFP+ cells in control) (Theunissen et al., 2014) and elevated levels of the naïve markers DPPA5, ZFP42, DPPA3 and KLF4 (Figure 2G, H). Similar to our observations in human primed cells, mouse EpiSCs depleted for Ddx6 upregulated the naïve-associated genes Klf4 and Dppa3 and reprogramed into a Rex1-GFP+ naïve state at higher efficiency compared to control cells (Figure S4A–C).
Together, these data indicate that DDX6 suppression in primed hESCs and mouse EpiSCs induces transcriptional and epigenetic features associated with naïve pluripotency, which facilitate reprogramming to a bona fide naïve state in the presence of appropriate signals.
DDX6 controls adult stem/progenitor cell potency in a context dependent manner
To investigate if DDX6 can influence self-renewal and differentiation of non-pluripotent stem cells, we initially suppressed DDX6 expression in hiPSC-derived neural progenitor cells (NPCs) and analyzed global gene expression changes by RNA-seq. We did not detect changes in the expression of the progenitor cell genes SOX2 and NESTIN in DDX6-depleted NPCs (Figure 3A), while SOX1 was slightly downregulated (~1.5-fold) (Figure S4D). However, DDX6 suppression led to the downregulation of lowly expressed transcripts involved in neuronal differentiation and maturation, and the upregulation of regulators of cell proliferation (Figure 3A and Figure S4E, F), suggesting that DDX6 keeps NPCs in a poised, differentiation-competent state. Indeed, DDX6 suppression strongly impaired the formation of βIII-tubulin+ neurons (Figure 3B, C), a finding confirmed with CRISPRi NPCs (Figure S4G–K). Thus, similar to the phenotype we observed in hPSCs, DDX6 appears to be essential for the differentiation of NPCs into neurons.
Figure 3. DDX6 controls adult stem and progenitor cell potency.
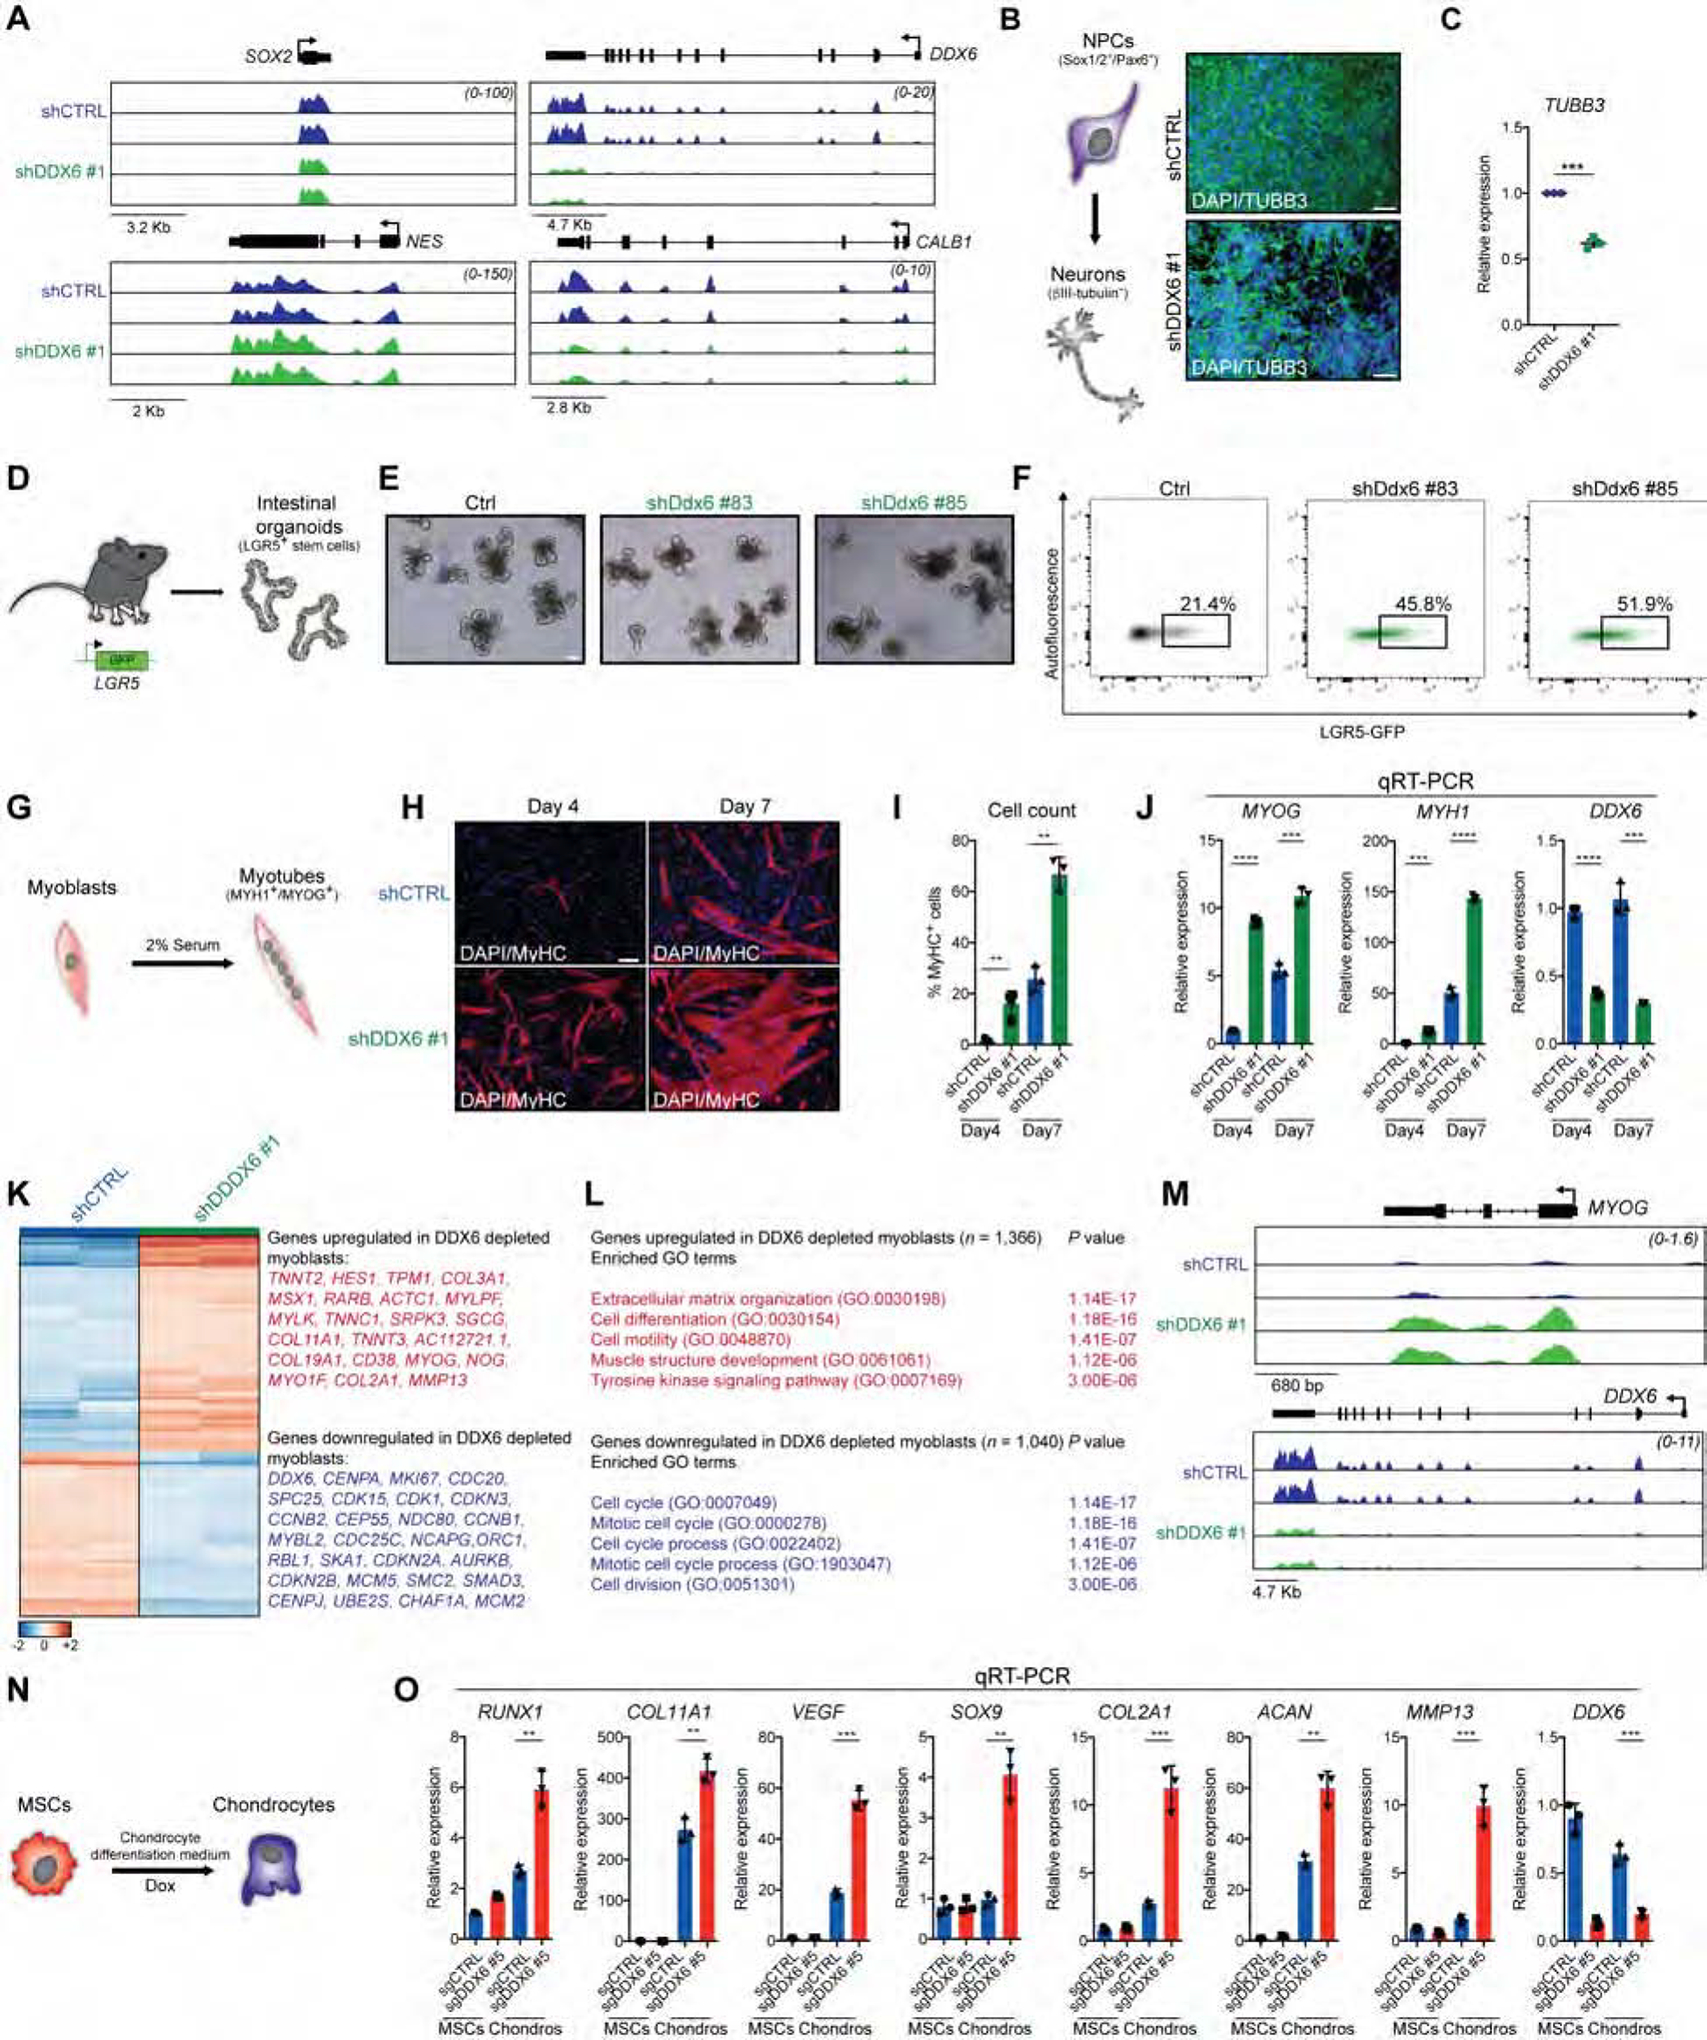
(A) Gene tracks showing RNA-seq data for NPCs infected with shCTRL or shDDX6 #1 constructs. (B) Schematic of NPC to neuron differentiation (left panel). Immunofluorescence images showing βIII-tubulin protein expression (scale: 50μm, right panels). (C) Quantification of βIII-tubulin+ cells. (D) Schematic of intestinal organoid derivation from LGR5-GFP mice. (E) Phase images of intestinal organoids in 3D cultures (scale: 100μm). (F) Flow cytometric quantification of LGR5-GFP+ cells. (G) Schematic of myoblast to myotube differentiation. (H) Immunofluorescence images showing MyHC (myosin-heavy chain) protein expression after 4 and 7 days of differentiation (scale: 100μm). (I) Quantification of MyHC+ cells. (J) QRT-PCR analysis for the indicated genes in differentiating myoblasts. (K) Heatmap showing significantly differentially expressed genes (FC>1.5; FDR<0.001). (L) GO analysis of upregulated and downregulated genes (FC>1.5; FDR<0.001) in shDDX6 #1 vs shCTRL myoblasts. (M) Gene tracks showing individual genes from RNA-seq data. (N) Schematic of hiPSC to mesenchymal stem cell (MSC) differentiation. (O) QRT-PCR analysis for the indicated genes in MSCs and chondrocytes (Chondros).
*p < 0.05; **p < 0.01; ***p < 0.001; ****p < 0.0001, unpaired Student’s t test. n=3, mean ± s.d.
See also Figure S4.
Next, we determined the possible roles of DDX6 within the endodermal lineage by studying mouse intestinal stem cells (ISCs). Briefly, we derived organoid cultures from Lgr5-GFP mice (Tian et al., 2011) and infected them with lentiviruses carrying shRNAs targeting the mouse Ddx6 gene (Figure 3D). Ddx6 depletion did not result in obvious morphological changes of organoids (Figure 3E) yet led to a greater than 2-fold increase in the number of Lgr5+ ISCs (Figure 3F), suggesting that suppression of Ddx6 facilitates the maintenance or expansion of the intestinal stem cell pool.
Finally, we tested the effect of DDX6 depletion on mesodermal progenitor identity by studying the differentiation of myoblasts into myotubes. Surprisingly, DDX6 knockdown dramatically increased rather than blocked the formation of MyHC+ multinucleated myotubes by up to 10-fold after 4 days of differentiation (Figure 3G–J). RNA-seq revealed that thousands of genes were aberrantly expressed in myoblasts depleted for DDX6 (1,366 genes upregulated; 1,040 genes downregulated) (Figure 3K). While upregulated genes were associated with categories related to cell differentiation, downregulated genes were involved in cell cycle progression (Figure 3L). For example, Myogenin (MYOG), which is a strong inducer of differentiation, was readily induced in myoblasts after DDX6 depletion in self-renewal conditions, consistent with precocious differentiation (Figure 3M).
Given the unexpected myoblast result, we asked whether DDX6 opposes differentiation in other mesoderm-associated stem cells by utilizing human mesenchymal stem cells (MSCs). To this end, we derived MSCs from hiPSCs (Figure S4L–O) and induced chondrogenic differentiation (Figure 3N). Similar to our findings in myoblasts, suppression of DDX6 in MSCs enhanced chondrocyte differentiation based on the elevated expression of chondrocyte markers (Figure 3O).
These comprehensive analyses indicate that DDX6 affects the differentiation potential of somatic progenitors in a context-specific manner.
DDX6 interacts with crucial P-body proteins, which control stem cell potency
To understand the mechanisms by which DDX6 controls cell fate and the possible involvement of P-bodies, we determined its binding partners in hiPSCs by performing immunoprecipitation for DDX6, followed by mass spectrometry (IP-MS) (Figure 4A, B and Table S1). Notably, of the 127 proteins identified in hiPSCs, 78 were previously found in HEK293T cells as DDX6 interaction partners, suggesting that a large fraction of proteins associated with DDX6 (61%) are shared across cell types (Figure S5A and (Ayache et al., 2015)). Moreover, GO analysis based on all detected DDX6-associated proteins showed a strong enrichment for categories linked to RNA binding and RNP granules, consistent with DDX6’s role in P-body maintenance (Figure 4C, D). For example, our analysis revealed interactions between DDX6 and members of the decapping complex (DCP1A and DCP1B), PABPC1 and PABPC4, and the LSM family of proteins, all of which have been implicated in P-body biology (Luo et al., 2018b) (Figure 4E and Figure S5B). Given that DDX6 silencing in hiPSCs leads to a loss of P-bodies (Figure 1C), we next asked whether DDX6 loss affects the stability of P-body-enriched DDX6 interactors. To this end, we performed large-scale quantitative proteomic analysis of sgCTRL and sgDDX6 hiPSCs (Figure S5C), identifying 6,868 proteins (Table S2). Analysis of these data revealed that many DDX6-interacting proteins (e.g., LSM14A, LASM14B, DCP1A) were significantly downregulated after DDX6 depletion (Figure 4F), a finding confirmed by western blot and immunofluorescence analyses (Figure S5D–G). Critically, transcripts encoding these DDX6-interacting proteins were not affected by DDX6 suppression (Figure S5H). These results show that DDX6 interacts with several key P-body components in stem cells, which are post-transcriptionally downregulated with loss of DDX6.
Figure 4. P-body assembly by DDX6 is essential for exit from pluripotency.
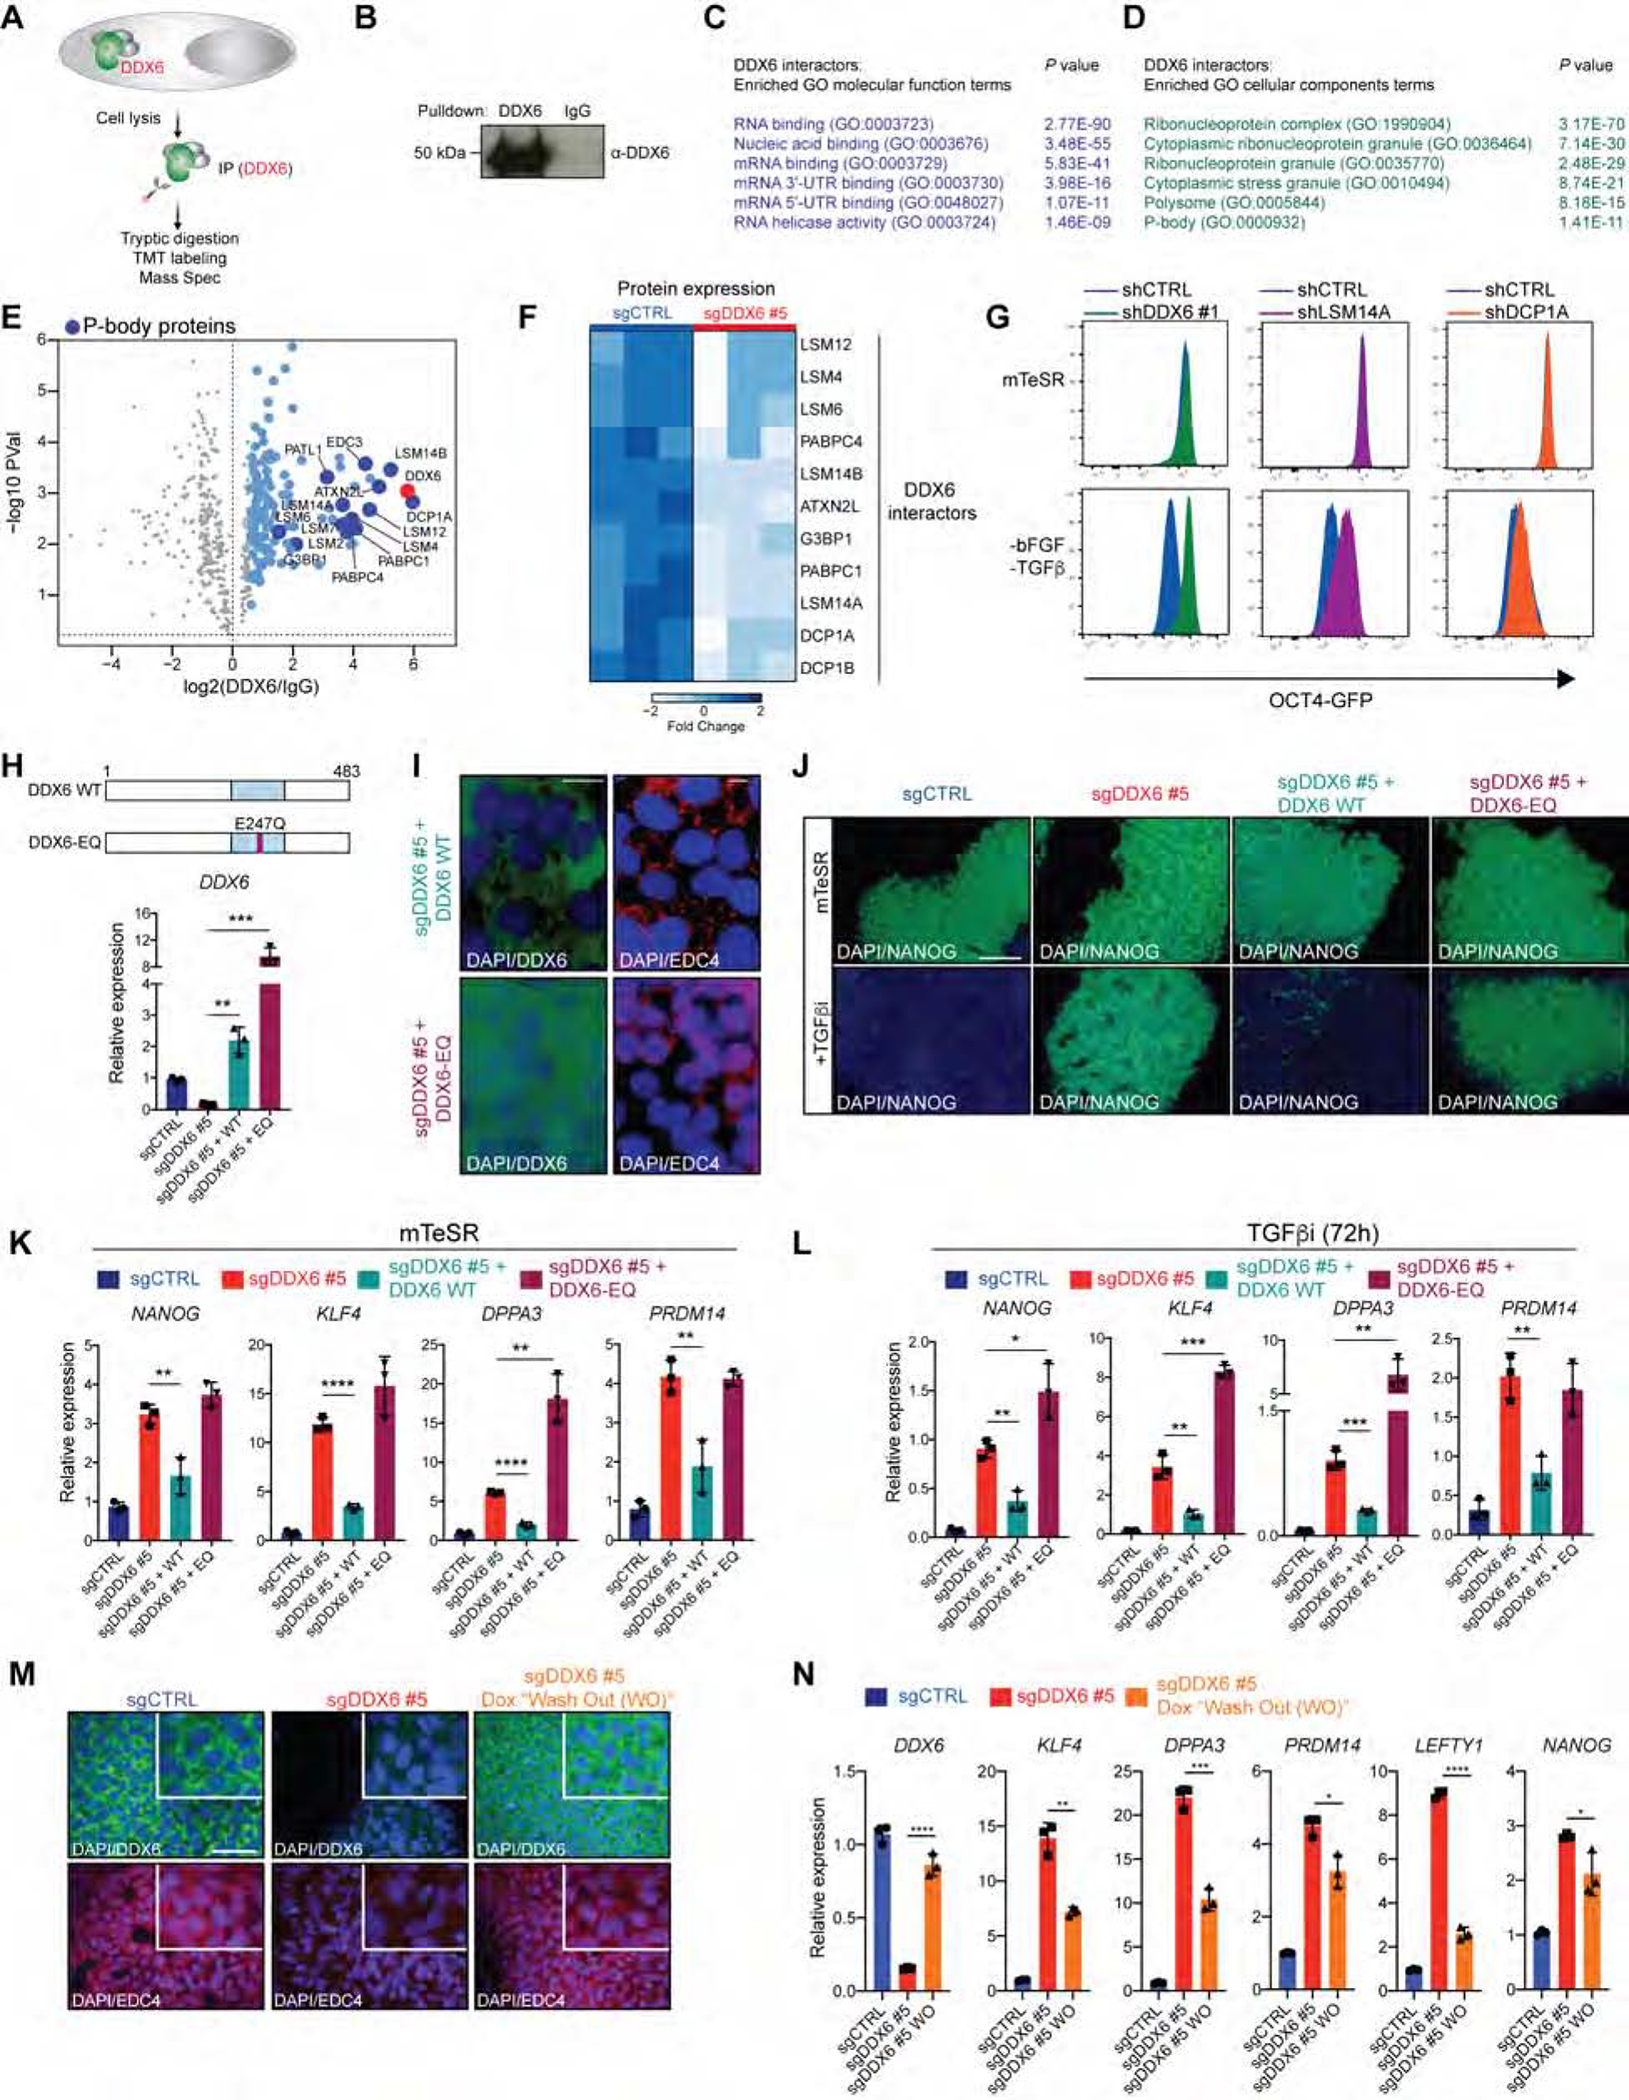
(A) Schematic of the IP-MS protocol. (B) Western blot of immunoprecipitation experiments. (C) GO molecular function analysis of DDX6 interactors (FC>1.5). (D) GO cellular component analysis of DDX6 interactors (FC>1.5). (E) DDX6 IP-MS data, n=3, unpaired Student’s t-test, FC>1.5; P<0.05. (F) Heatmap showing protein expression changes determined by MS. (G) Flow cytometric quantification of OCT4-GFP+ hESCs in mTeSR1 and mTeSR1 lacking bFGF and TGFβ. (H) Schematic of DDX6 protein with E247Q mutation (red square) in the helicase domain (blue square) (upper panel). QRT-PCR analysis of DDX6 expression (lower panel). (I) Immunofluorescence image showing protein expression of DDX6 (scale: 10μm) and EDC4 (scale: 10μm). (J) Immunofluorescence image showing protein expression of NANOG (scale: 100μm). (K) QRT-PCR analysis of selected pluripotency genes. (L) QRT-PCR analysis of selected pluripotency genes. (M) Immunofluorescence image showing protein expression of DDX6 (scale: 50μm, inset 2X) and EDC4 (scale: 50μm, inset 2X) in sgCTRL, sgDDX6 #5 hiPSCs treated with dox for 1 weeks and sgDDX6 #5 “Wash Out” (WO) which have been treated with dox for 1 week followed by 7 days of dox withdrawal. (N) QRT-PCR analysis of selected pluripotency genes.
*p < 0.05; **p < 0.01; ***p < 0.001; ****p < 0.0001, unpaired Student’s t test. n=3, mean ± s.d.
If disruption of P-bodies is indeed critical for the phenotypes observed with DDX6 loss, we would expect that suppression of other factors essential for the maintenance of P-bodies would phenocopy these results while suppression of non-essential P-body components should have no effect on cell fate. To test this possibility, we depleted LSM14A and DCP1A in hESCs and induced exit from pluripotency. Similar to the sgDDX6 phenotype, knockdown of LSM14A, which is essential for P-bodies (Ayache et al., 2015), resisted pluripotency exit (Figure 4G and Figure S5I, J). By contrast, knockdown of DCP1A, which does not affect P-body maintenance (Ayache et al., 2015), had no effect on pluripotency exit (Figure 4G and Figure S5I, J).
Collectively, these data reinforce the notion that DDX6 and LSM14A, two genes crucial for P-bodies, are functionally required for hPSC differentiation.
DDX6’s helicase activity is essential for P-body assembly and pluripotency exit
DDX6’s highly conserved DEAD domain was previously shown to have helicase activity in vitro (Sloan and Bohnsack, 2018). To test whether this enzymatic function is required for P-body assembly, we used lentivirus to express either a wild type (DDX6 WT) or a catalytically inactive point mutant (DDX6 EQ) (Jangra et al., 2010) in our transgenic CRISPRi hiPSCs (Figure 4H and Figure S5K, L). Of note, expression of DDX6 WT successfully rescued DDX6 expression and restored the assembly of EDC4+ P-bodies in these hiPSCs (Figure 4I). By contrast, hiPSCs expressing the DDX6 EQ mutant were unable to restore P-bodies (Figure 4I), indicating that the intrinsic helicase activity of DDX6 is essential for P-body formation in pluripotent cells, extending previous observations in cancer cell lines (Jangra et al., 2010).
To test whether DDX6’s helicase activity is also necessary for pluripotency exit, we treated our CRISPRi hiPSCs transduced with either DDX6 WT or DDX6 EQ lentiviral vectors with TGFβi and monitored the expression of NANOG by immunofluorescence. Similar to sgCTRL cells, DDX6 depleted cells infected with the DDX6 WT vector readily differentiated as reflected by efficient downregulation of NANOG expression (Figure 4J). Strikingly, however, expression of the DDX6 EQ mutant failed to downregulate NANOG expression, indicating that the intrinsic helicase activity of DDX6 is also essential for hPSC differentiation (Figure 4J). Supporting these observations, DDX6 EQ infected CRISPRi cells expressed higher levels of pluripotency genes such as KLF4, NANOG, PRDM14 and DPPA3 in self-renewal and differentiation conditions compared to sgCTRL or DDX6 WT-infected sgDDX6 cells (Figure 4K, L). Of note, sgCTRL cells transduced with the DDX6 EQ mutant also upregulated the pluripotency markers DPPA3 and KLF4 and showed a subtle delay in pluripotency exit, suggesting that this helicase mutant may function as a dominant-negative allele in WT cells (Figure S5M), consistent with previous observations (Jangra et al., 2010).
Finally, we exploited our CRISPRi system to assess whether DDX6 re-expression would reverse the aberrant hyper-pluripotent state and rescue the loss of P-bodies. To this end, we suppressed DDX6 with dox for 7 days followed by dox withdrawal for another 7 days before measuring pluripotency transcripts and P-body assembly. We readily detected P-bodies and the concomitant downregulation of pluripotency transcripts upon re-expression of DDX6 (Figure 4M, N), suggesting that P-body re-assembly indeed facilitates reversion from the hyper-pluripotent to the primed state.
Taken together, these results demonstrate that DDX6 mediates P-body assembly through its helicase activity and further strengthen our conclusion that P-body assembly is required for pluripotency exit.
DDX6 overexpression accelerates exit from pluripotency
To determine whether DDX6 is sufficient to modulate pluripotency exit and P-body assembly, we transduced hPSCs with a lentiviral overexpression vector for DDX6 and measured P-body assembly and pluripotency exit. Indeed, DDX6 overexpression (DDX6 OE) led to a significant increase in cytoplasmic EDC4+ P-bodies under self-renewal conditions (Figure 5A). Moreover, DDX6 OE led to a 3-fold decrease in the percentage of OCT4-GFP+ hESCs under differentiation conditions, suggesting enhanced differentiation (Figure 5B). RNA-seq analysis revealed that DDX6 OE caused widespread transcriptional changes in both self-renewal (upregulated genes n=607; downregulated genes n=750) and differentiation (upregulated genes n=654; downregulated genes n=510) conditions (Figure 5C, D). Genes upregulated in DDX6 OE cells were associated with GO categories related to cell differentiation, consistent with the observed acceleration of differentiation (Figure S6A–C). Accordingly, we observed downregulation of TFs, chromatin regulators and lncRNAs associated with pluripotency in DDX6 OE cells, including KLF4, NANOG, UTF1 and LINC-ROR (Figure 5C, D).
Figure 5. Increased translation of DDX6 targets after P-body dissolution.
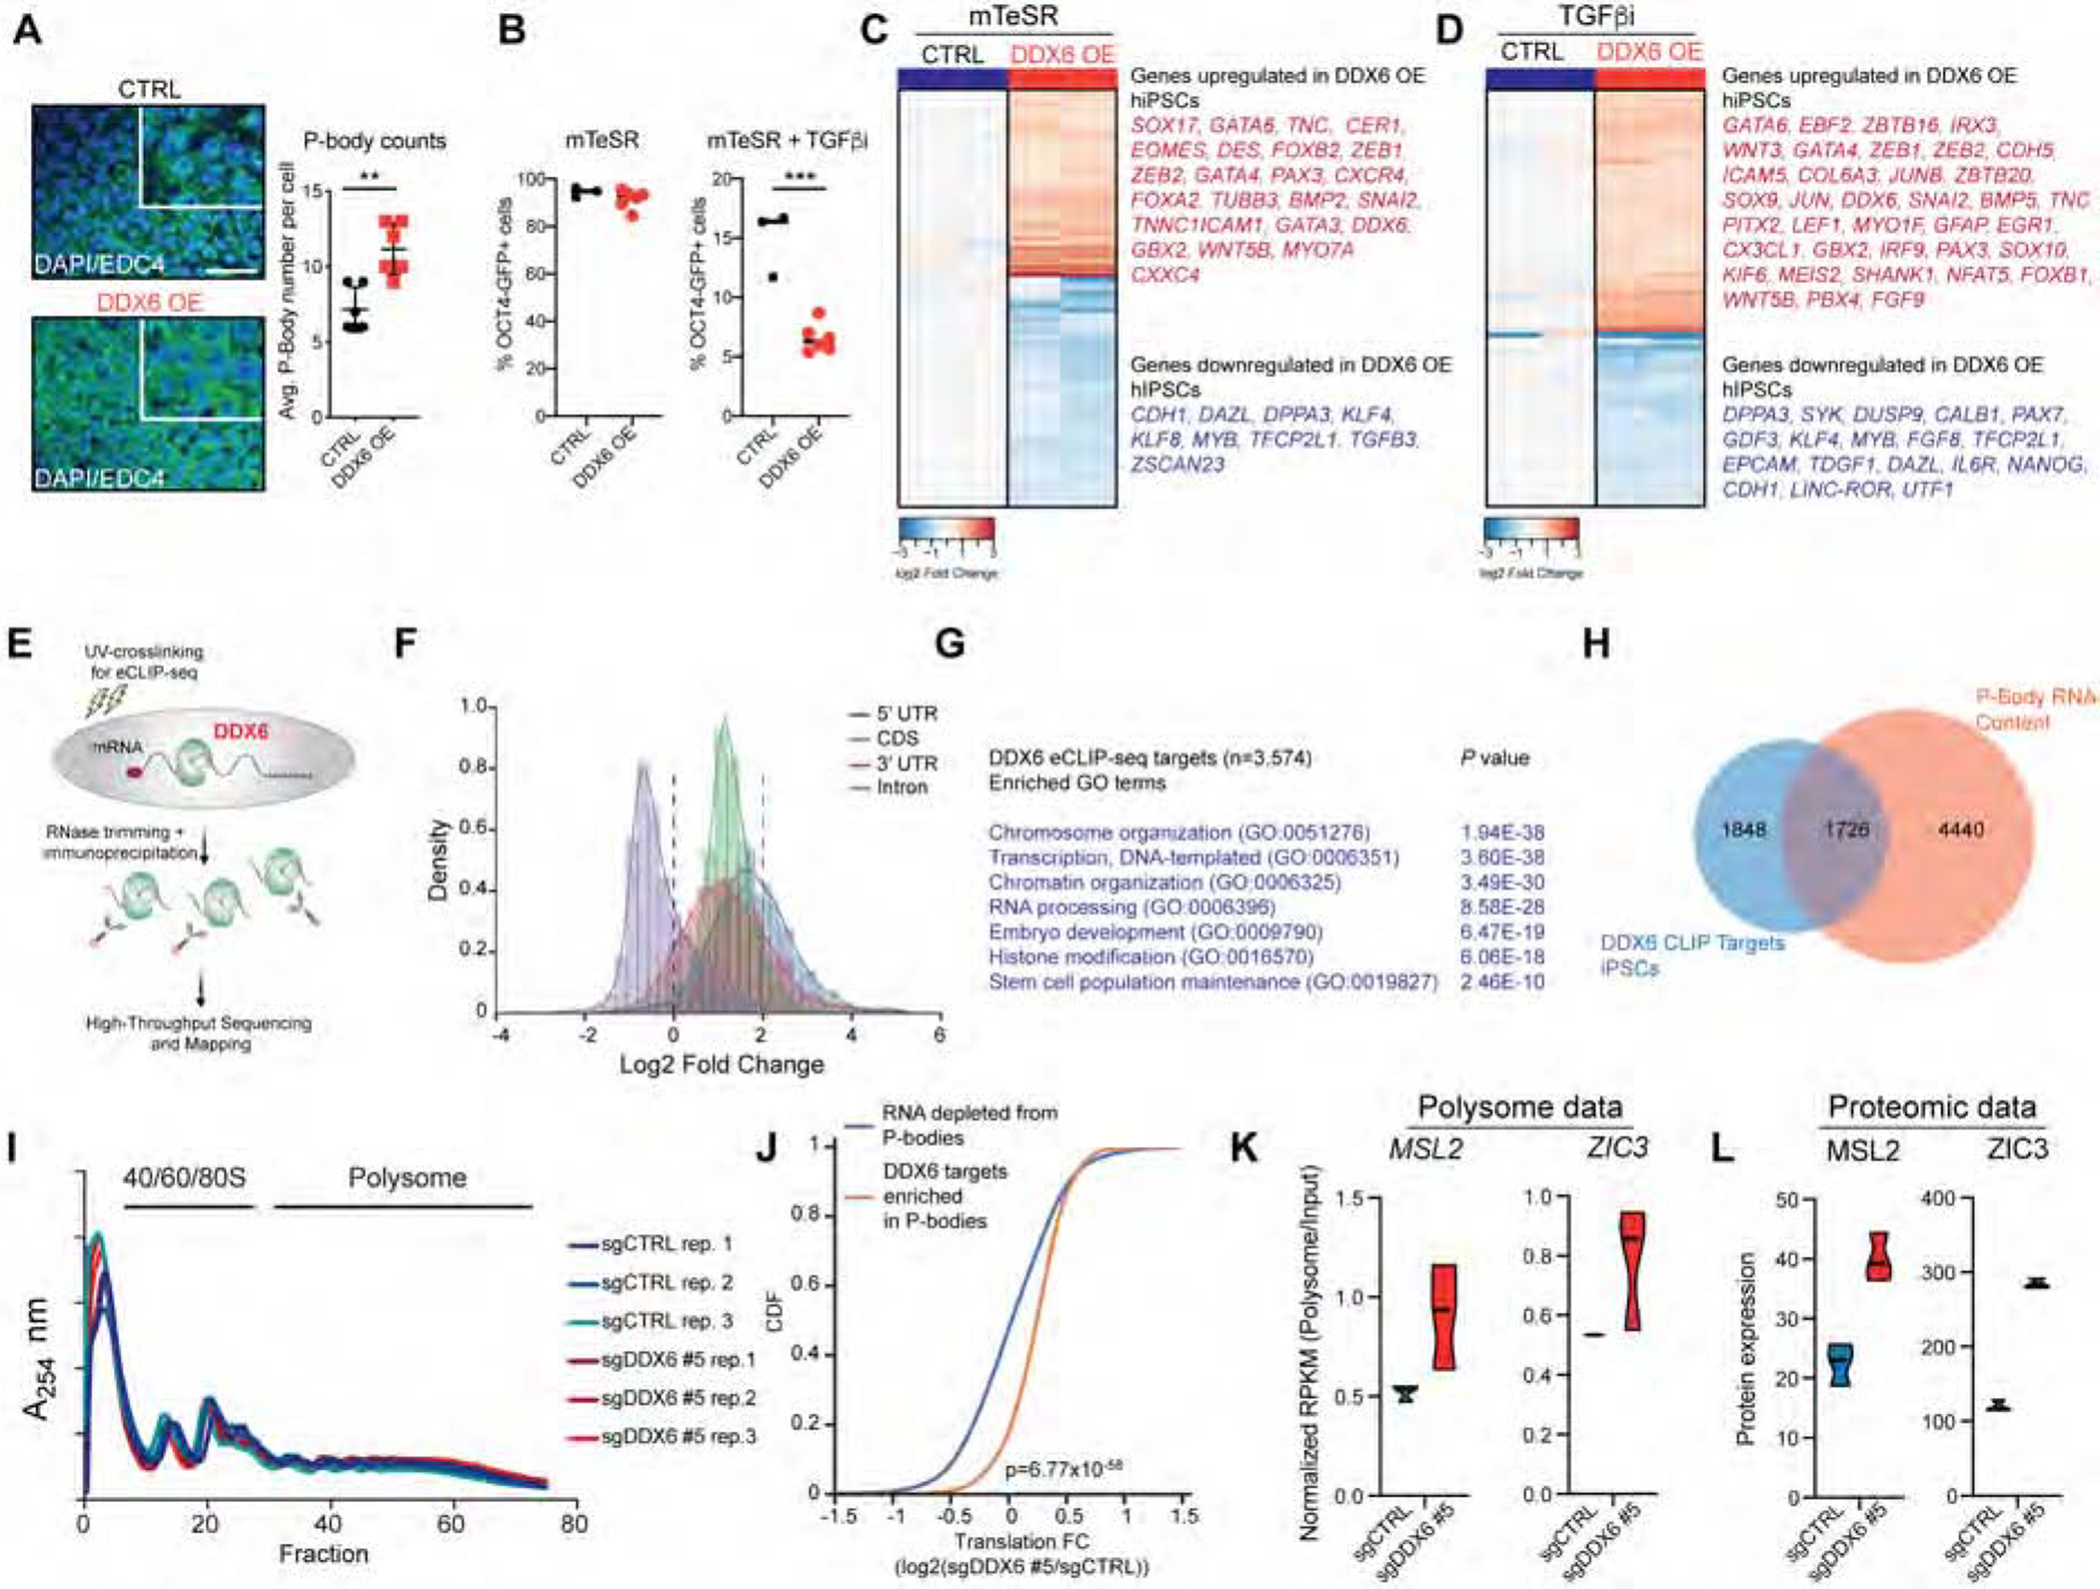
(A) Immunofluorescence image showing protein expression of EDC4 (scale: 50μm, inset 2X) in control and DDX6 overexpressing hESCs (left panel). P-body counts per cell (right panel), n=6, mean ± s.d. (B) Flow cytometric quantification of OCT4-GFP+ control (n=3) and DDX6 overexpressing (n=6) hESCs cultured in mTeSR1 and mTeSR1 supplemented with TGFβi. (C) Heatmap showing differentially expressed genes (FC>1.5; FDR<0.001) in control and DDX6 overexpressing hiPSCs cultured in mTeSR1. (D) Heatmap showing differentially expressed genes (FC>1.5; FDR<0.001) in control and DDX6 overexpressing hiPSCs cultured in mTeSR1 supplemented with TGFβi. (E) Schematic of the eCLIP-seq protocol. (F) Histogram of region-based fold change (FC) for DDX6 eCLIP-seq read density over size-matched input (FC>2; P<0.001). (G) GO analysis of DDX6 targets in hiPSCs (FC>2; P<0.001). (H) Venn diagram showing overlap for DDX6 eCLIP-seq targets (FC>2; P<0.001) and P-body-enriched mRNAs (Hubstenberger et al., 2017). (I) Polysome profile. (J) Cumulative distribution function (CDF) plot showing translation rate fold (log2) change (FC) of P-body enriched DDX6-target and non-target mRNAs for sgDDX6 #5 vs sgCTRL hiPSCs. Statistical significance was calculated using the Mann–Whitney U test. (K) Violin plots showing the Polysome/Input RPKM values for the indicated transcripts (n=3 each condition). (L) Violin plots showing expression values for the indicated proteins (n=3 each condition). See also Figure S6 and Table S3.
These data demonstrate that forced DDX6 expression is sufficient to induce P-bodies and promote hPSC differentiation.
DDX6-bound mRNAs are translationally suppressed in P-bodies
To understand how P-body assembly and disassembly via DDX6 may modulate cell fate, we identified DDX6 mRNA targets by carrying out enhanced UV crosslinking and immunoprecipitation (eCLIP)-seq (Van Nostrand et al., 2016b) in hiPSCs (Figure 5E). We observed good correlation among biological replicates (Pearson correlation coefficient r=0.88) (Figure S6D) and found that DDX6 binding patterns are not biased towards highly expressed RNA targets, supporting the quality and specificity of our datasets (Figure S6E). Overall analysis of DDX6 binding patterns revealed a preferential association with coding regions over introns (Figure 5F and Figure S6F), which is in line with previous reports (Sloan and Bohnsack, 2018). Notably, DDX6 mRNA targets included factors involved in chromatin organization, transcription, RNA processing and stem cell regulation (Figure 5G). For example, we found mRNAs encoding key pluripotency TFs (e.g., OCT4, NANOG) and chromatin regulators, including several histone demethylases, histone deacetylase complexes (e.g., NURD) and H3K4 methylases among DDX6 targets in hiPSCs (Table S3). In addition, many DDX6-bound mRNAs were previously shown to be physically present in P-bodies in 293T cells (Figure 5H and (Hubstenberger et al., 2017)), suggesting that a large fraction of DDX6-bound mRNAs are localized inside P-bodies across different cell types.
To test whether DDX6 perturbation affects gene expression and cell fate by influencing the stability of mRNA targets, we blocked transcription initiation in our CRISPRi hiPSCs using Actinomycin D and measured pluripotency mRNA levels. Unexpectedly, DDX6 depletion did not alter mRNA decay rates of the pluripotency regulators KLF4, NANOG, POU5F1, SOX2, PRDM14 and TFAP2C (Figure S6G), suggesting that DDX6 does not affect mRNA stability in hiPSCs.
We next explored the hypothesis that DDX6 affects the translation of mRNA targets in pluripotent cells by sequencing total and polysomal RNAs following DDX6 depletion. We failed to detect obvious differences in polysome profiles when comparing DDX6 depleted and control cells, suggesting that DDX6 is not a global repressor of translation (Figure 5I). However, we observed a significant increase in translational efficiency (p= 6.77×10−58) when considering only those mRNAs that are directly targeted by DDX6 and physically associated with P-bodies (Figure 5J and Figure S6H). Notably, these transcripts were strongly enriched for AU-rich sequences (Figure S6I), which have previously been associated with translational repression by DDX6 (Qi et al., 2012). Moreover, we detected key TFs and chromatin regulators with association to pluripotency among this group of mRNAs, including ZIC3, MSL2, MBLN1 and PTEN (Figure 5K, L and S6J, K). Of note, MBLN1 and PTEN protein levels were also higher in naïve hESCs relative to primed cells (Figure S6J, K), and likely contributed to the efficient reprogramming of DDX6 depleted cells into a naïve state.
DDX6 and P-bodies have also been implicated in miRNA-mediated suppression of RNA translation (Chan and Slack, 2006; Freimer et al., 2018; Kulkarni et al., 2010), suggesting that relief from miRNA-mediated silencing may be another mechanism by which DDX6 suppression affects stem cell potency. In support of this idea, we found that some mRNA targets that changed translation in DDX6 knockdown cells were enriched for binding sites of miRNAs (Figure S6L) previously implicated in pluripotency control and reprogramming (Leonardo et al., 2012).
Together, these data strongly suggest that mRNAs encoding for transcription factors and chromatin complexes are targeted by DDX6 in P-bodies to maintain them in a translationally repressed state.
Disrupting P-bodies impacts chromatin organization in diverse developmental contexts
The observation that DDX6 regulates the translation of multiple TFs and chromatin regulators raises the key question of whether P-body disassembly alters the chromatin organization of pluripotent cells. To test this hypothesis, we determined chromatin accessibility by ATAC-seq analysis in hiPSCs depleted for DDX6 for 6 days. Notably, hiPSCs exhibited an overall increase in accessible chromatin regions following DDX6 suppression relative to controls (7,420 sites with increased accessibility; 3,999 sites with decreased accessibility) (Figure 6A). TF motif analysis revealed an enrichment for pluripotency TFs such as ZIC3, TFAP2C and KLF4/5 (Figure 6B), which concurs with our observation that these TFs were upregulated at the RNA and/or protein level in DDX6 depleted iPSCs (Figure 1I and Table S2). To determine whether regions with differential chromatin accessibility are enriched for specific functional elements, we next performed ChIP-seq for relevant modifications including the enhancer mark H3K27ac, the proximal promoter mark H3K4me3 and the heterochromatic mark H3K9me3. We observed extensive remodeling at enhancers upon DDX6 suppression, as reflected by 3,528 regions that gained H3K27ac compared to only 712 regions that lost it (Figure 6C–E). Additionally, pluripotency-specific super-enhancers were significantly more acetylated in DDX6 depleted cells relative to control, suggesting that DDX6 loss impacts different types of enhancers (Figure 6D). Importantly, key pluripotency regulators such as GDF3, DPPA4, UTF1, KLF17 and OCT4 (POU5F1) were among the enhancers that gained H3K27ac, consistent with increased chromatin accessibility for these regions as observed in our ATAC-seq analysis (Figure 6E). We also detected a dramatic redistribution of H3K9me3 in DDX6 depleted cells relative to control cells (1,494 sites lost; 1,279 sites gained) (Figure 6F). For example, DDX6 depletion led to reduced H3K9me3 levels at regulatory regions of several ZFP and ZSCAN factors (see ZSCAN2 example in Figure 6E). In contrast to H3K27ac and H3K9me3 patterns, H3K4 trimethylation remained largely unaffected in sgDDX6 hiPSCs (142 sites gained; 85 sites lost) (Figure S7A). These results indicate that DDX6 silencing causes major epigenetic remodeling at enhancers and heterochromatic regions while promoters and TSSs remain largely unaffected.
Figure 6. DDX6 depletion impacts chromatin organization of PSCs and adult progenitor cells.
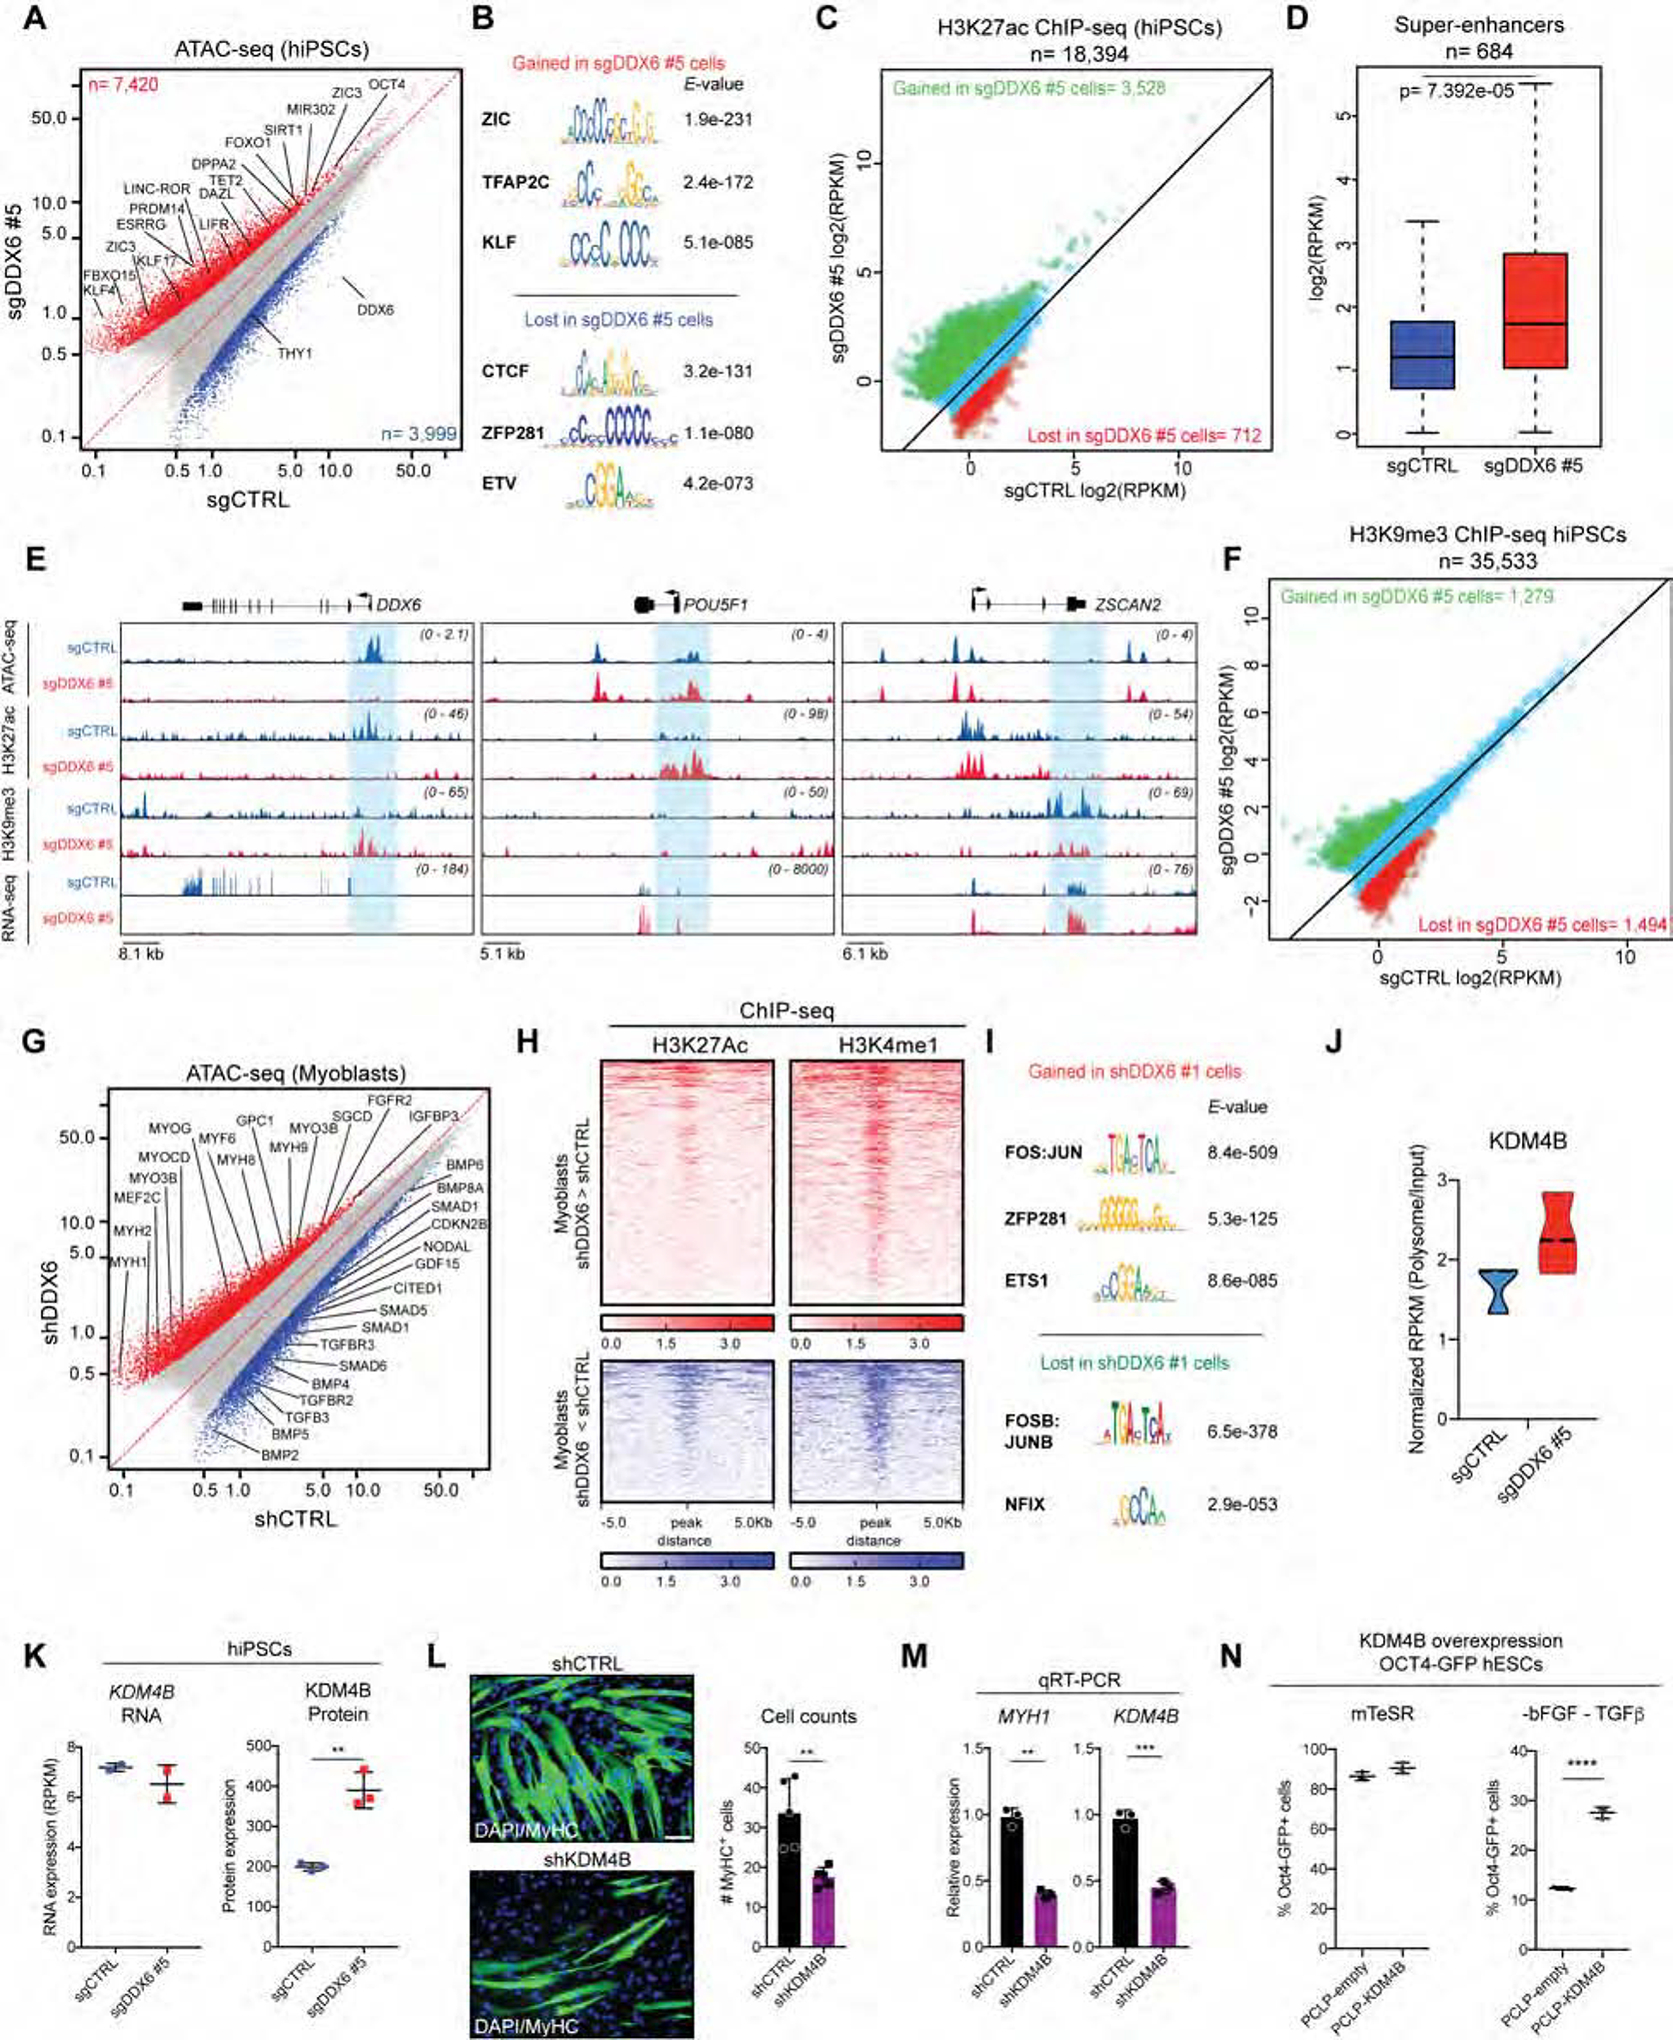
(A) Scatter plot showing correlation of ATAC-seq data for sgCTRL (n=2) and sgDDX6 #5 (n=2) hiPSCs. Blue dots indicate genomic regions showing significantly decreased chromatin accessibility in DDX6 depleted cells (>1.5-fold change, P-value<0.001; n=3999); red dots indicate genomic regions showing significantly increased chromatin accessibility in DDX6 depleted cells (1.5-fold change, P-value<0.001; n=7420). (B) TF motif enrichment on sgDDX6 gained and lost ATAC-seq peaks. (C) Scatter plot showing H3K27ac ChIP-seq data for sgDDX6 #5 (n=2) and sgCTRL (n=2) hiPSCs. Red dots indicate genomic regions with significant decreased H3K27ac signal in DDX6 depleted cells (>2-fold change; n=712); green dots indicate genomic regions with significant increased H3K27ac signal in DDX6 depleted cells (2-fold change; n=3528). (D) H3K27ac signal at pluripotency-specific super-enhancers (n=684) in sgCTRL (n=2) and sgDDX6 (n=2) hiPSCs. Statistical significance was determined using a Student’s t-test. (E) Gene tracks of individual genes based on RNA-seq, ChIP-seq and ATAC-seq data. (F) Scatter plot showing H3K9me3 ChIP-seq data for sgCTRL (n=2) and sgDDX6 #5 (n=2) hiPSCs. Red dots indicate genomic regions showing significantly decreased H3K9me3 coverage in DDX6 depleted cells (>2-fold change; n=1494); green dots indicate genomic regions with significantly increased H3K9me3 signal in DDX6 depleted cells (2-fold change; n=1279). (G) Scatter plot showing correlation of ATAC-seq data for shCTRL- (n=2) and shDDX6-infected (n=2) human myoblasts. Blue dots indicate genomic regions with significantly decreased chromatin accessibility in DDX6 depleted cells (>1.5-fold change, P-value<0.001; n=1099); red dots indicate genomic regions with significantly increased chromatin accessibility in DDX6 depleted cells (1.5-fold change, P-value<0.001; n=1864). (H) Heatmaps showing enrichment of the indicated histone modifications for regions that gained and lost ATAC-seq peaks in shDDX6 myoblasts relative to control. (I) TF motif enrichment for regions that gained and lost ATAC-seq peaks in shDDX6 myoblasts relative to control. (J) Violin plots showing the Polysome/Input RPKM values for KDM4B (n=3 each condition) in hiPSCs. (K) KDM4B mRNA (n=2, mean ± s.d.) and protein expression levels in hiPSCs (n=3, mean ± s.d.), unpaired Student’s t-test, **P<0.01. (L) Immunofluorescence images showing MyHC protein expression (left panel). Quantification of MyHC+ cells (right panel). n=4, mean ± s.d., unpaired Student’s t-test, **P<0.01 (scale: 100μm, left panel). (M) QRT-PCR analysis for the indicated genes in differentiating myoblast cultures. n=3, mean ± s.d., unpaired Student’s t-test, **P<0.01, ***P<0.001. (N) Flow cytometric quantification of OCT4-GFP+ hESCs infected with the empty retroviral vector PCLP or PCLP-KDM4B and cultured in mTeSR1 and mTeSR1 lacking bFGF and TGFβ.
In order to test whether our observations extend to adult progenitor cell populations, we measured chromatin accessibility in human myoblasts depleted for DDX6 for 4 days. Indeed, similar to hiPSCs, myoblasts exhibited an overall increase in chromatin accessibility at enhancer regions following DDX6 silencing relative to controls (Figure 6G, H and Figure S7B). Consistent with the increased differentiation we observed in in DDX6 depleted myoblasts, more accessible regions were enriched for TFs and growth factors associated with myogenic differentiation (Figure 6G). In addition, motif analysis of these regions revealed an enrichment for TFs implicated in muscle differentiation (Figure 6I).
Taken together, our results show that suppression of DDX6 modulates the chromatin organization of human PSCs and myoblasts, which in turn may underlie the specific cell fate changes we observed across different developmental contexts.
Regulation of KDM4B contributes to the context-dependent phenotypes of DDX6 depletion
To further strengthen the connection between P-body homeostasis, chromatin organization and cellular plasticity, we finally searched for DDX6 targets involved in chromatin remodeling that are common across cell types. To this end, we performed eCLIP-seq in undifferentiated myoblasts (Figure S7C and Table S4) and compared data with our hiPSC eCLIP dataset. Of note, about 55% of our DDX6 targets were shared between human iPSCs and myoblasts (Figure S7D, E). Among the common DDX6 targets, H3K9 demethylases emerged as an intriguing class of proteins as they have previously been implicated in stem cell potency in different contexts (Cloos et al., 2008) and we detected a widespread change of H3K9me3 in DDX6 depleted hiPSCs (Figure 6F). Specifically, we focused on the H3K9 demethylase KDM4B since it exhibited an increased translational rate in sgDDX6 cells (Figure 6J) and consequently was upregulated at the protein level without affecting mRNA levels in human iPSCs and myoblasts following DDX6 knockdown (Figure 6K and Figure S7F–I). In addition, KDM4B overexpression reportedly enhances MSC differentiation towards chondrocytes (Lee et al., 2016), which is consistent with the observed effect of DDX6 suppression in MSCs (Figure 3N, O). To examine whether this phenotypic link between KDM4B and DDX6 modulation in MSCs extends to other progenitor cell populations, we depleted KDM4B in human muscle progenitors. Considering that DDX6 depletion facilitates muscle differentiation, we predicted that KDM4B depletion would block differentiation. Indeed, suppression of KDM4B in human myoblasts led to a significant decrease in the number of differentiated myotubes as judged by reduced MYH1 expression (Figure 6L, M).
We next explored whether the effects of KDM4B and DDX6 modulation are also correlated in pluripotent cells. In mESCs, Kdm4b is involved in the regulation of stem cell-associated gene expression and occupies active pluripotency-specific enhancers (Das et al., 2014), again consistent with an opposing effect to DDX6. Thus, we transduced hESCs with a retroviral KDM4B overexpression vector (Castellini et al., 2017) and measured OCT4-GFP expression following withdrawal of bFGF and TGFβ or treatment with TGFβi. Indeed, KDM4B overexpression significantly increased the percentage of OCT4-GFP+ hESCs in both conditions (Figure 6N and Figure S7J). In addition, KDM4B overexpressing hESCs cultured in these conditions showed higher expression of the pluripotency markers NANOG, POU5F1, DPPA3, KLF4 and ZIC3 compared to control cells (Figure S7K), paralleling the effect of DDX6 suppression.
Collectively, these data connect the function of KDM4B and DDX6 during cell fate change.
DISCUSSION
Here, we demonstrated a crucial role for the RNA helicase DDX6 in cell fate control (Figure 7A). DDX6-mediated gene regulation is required for exiting the pluripotent state and for proper differentiation. Conversely, DDX6 suppression is sufficient to drive both mouse and human ESCs to a more primitive state, consistent with its role in the maintenance of pluripotent cell states. Our study also provides comprehensive evidence that DDX6 controls the potency of a variety of adult progenitor cell types across the three germ layers, thus extending its role to a more general regulator of cell fate. While our data suggest that DDX6 drives exit from self-renewal towards a differentiated state in some adult progenitors akin to its role in hPSCs (i.e., NPCs and endoderm progenitors), it seems to maintain the self-renewal and inhibit differentiation in others (i.e., mesenchymal and muscle progenitors).
Figure 7. P-body assembly controls stem cell potency.
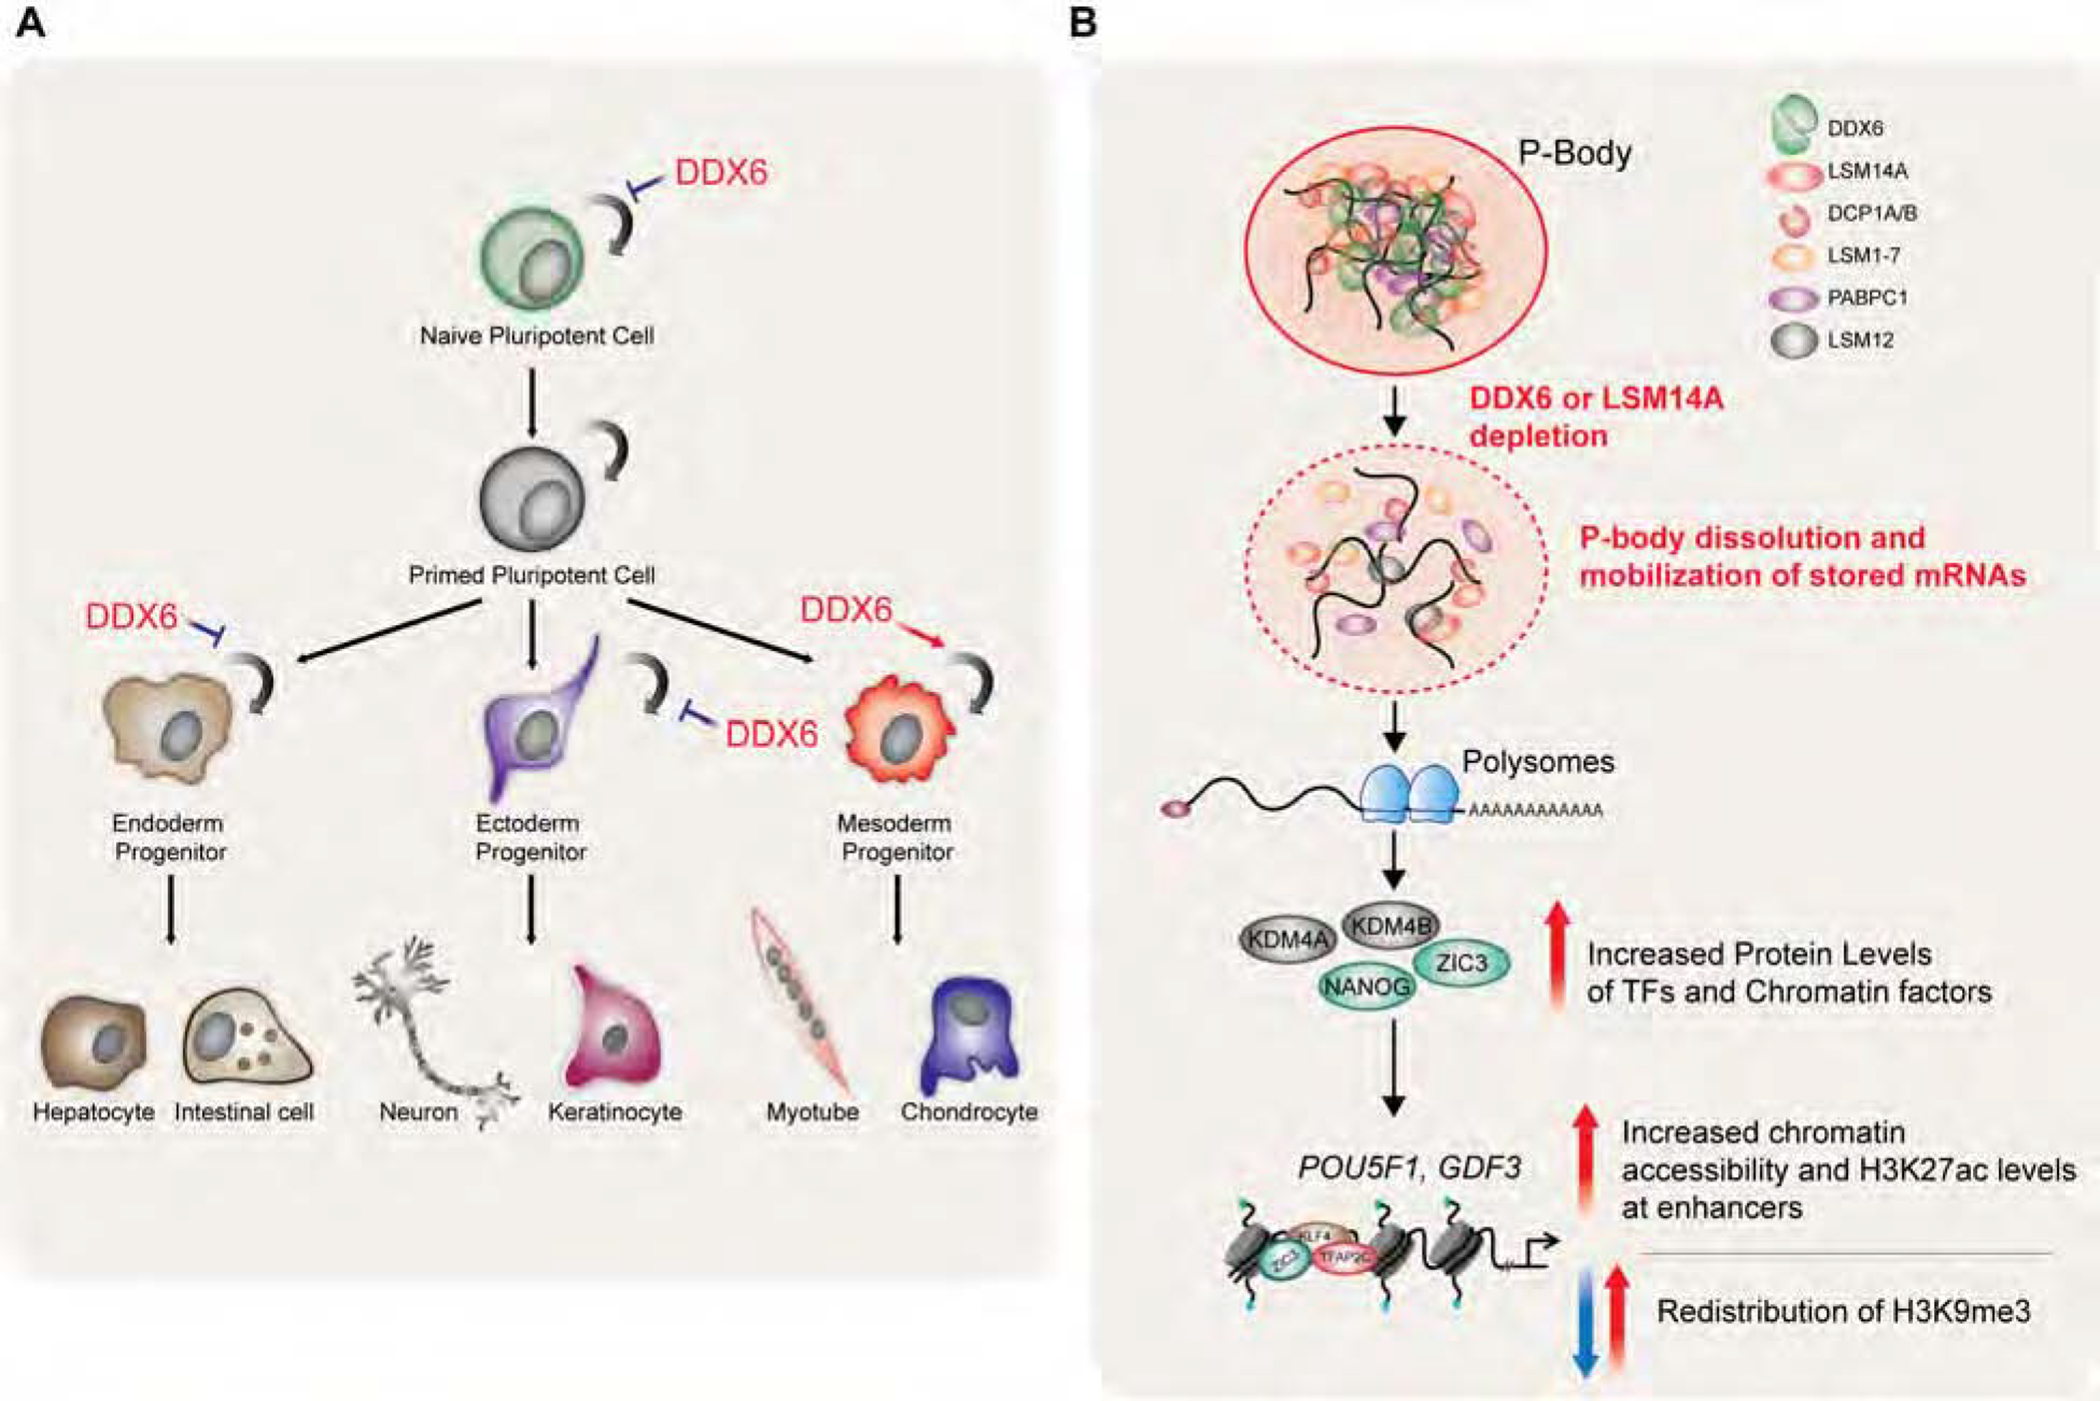
(A) Summary of phenotypes in DDX6 depleted stem cell populations. (B) Model proposing how DDX6 impacts cell fate through modulation of P-body homeostasis.
Based on our proteomic data in hPSCs and the available literature, we surmise that DDX6 acts as a hub for other translational repressors and mRNA decay enzymes, orchestrating the assembly of P-bodies. Our results further suggest that DDX6 coordinates the reversible storage in P-bodies of untranslated transcripts encoding key cell fate regulators, including transcription and chromatin factors (Figure 7B). Once P-bodies are disassembled, either through DDX6 downregulation or mutation of its helicase activity, mRNAs are released and available to the translational machinery.
Increased protein levels of encoded transcription and chromatin factors then potently influence cell fate by remodeling the enhancer and heterochromatin landscapes of embryonic and adult stem cells. Based on these observations, we propose that P-body assembly confers a “poised” state on stem cells, which may quickly be reversed upon reception of appropriate cues, thus facilitating development and differentiation in a timely manner and endowing cells with a certain degree of developmental flexibility.
Our results reveal that disrupting P-bodies in PSCs and adult progenitors elicits a remarkably rapid response for H3K27 acetylation at enhancers. Considering the profound changes in H3K27ac levels we detected in DDX6 depleted cells, it is noteworthy that the chromatin landscape at promoters was largely unaffected by DDX6 loss. Another unexpected observation is the rapid redistribution of the H3K9me3 mark at heterochromatic regions in hPSCs (Figure 7B). During development, histone acetylation controls enhancer dynamics in stem cells (Perino and Veenstra, 2016), while compacted heterochromatin expands as cells mature, assisting in the establishment and maintenance of cell identity (Zhu et al., 2013). Indeed, modulation of histone acetylation and depletion of H3K9me3 facilitate TF-induced cell fate changes, somatic cell nuclear transfer and the acquisition of a naïve pluripotent state (Becker et al., 2016; Chung et al., 2015; Federation et al., 2014; Matoba et al., 2014; Theunissen et al., 2016). Thus, these chromatin changes may underlie the context-specific effects on cell fate we observed in distinct lineages and the establishment of the hyper-pluripotent and naïve-like state in DDX6-depleted hPSCs (Figure 7A).
We could assign at least some of the cell type-specific effects of DDX6 suppression to dysregulation of the H3K9 demethylase KDM4B, which is a common DDX6 target across different cell types and is upregulated at the protein level in DDX6 depleted cells. However, the biological consequences of DDX6 depletion in any given progenitor cell population is likely more complex and involves additional chromatin factors besides KDM4B as well as cell type specific TFs. Consistent with this interpretation, we observed increased expression of the lincRNA Linc-ROR after DDX6 silencing in hPSCs. Linc-ROR is required for exit from the pluripotent state (Loewer et al., 2010; Wang et al., 2013) as well as for osteogenic differentiation of MSCs (Feng et al., 2018). The context dependency we observed for DDX6 in progenitor cells may also help to explain previous, seemingly opposing observations in mouse neural cells and human keratinocytes lacking DDX6 (Nicklas et al., 2015; Wang et al., 2015).
Recently, Blelloch and colleagues reported intriguing similarities in translational regulation between Ddx6 deficient mESCs and Dgcr8 deficient mESC, which lack all microRNAs (Freimer et al., 2018). This observation, together with our finding that some DDX6 target mRNAs in hPSCs harbor miRNA recognition sequences, suggests that the effect of DDX6 on cellular potency may be partially explained by its role in miRNA-mediated translational repression. It is further important to mention that DDX6 is not exclusively localized to P-bodies, but reportedly interacts with other RBPs in the cytoplasm (Ayache et al., 2015). It is therefore also possible that non-P-body dependent functions of DDX6 contribute to some of the phenotypes we observed in our study.
In summary, by interrogating DDX6’s role in human PSCs and adult stem and progenitor cells, we have uncovered a previously unrecognized role for P-bodies in stabilizing cell identity by modulating the storage of mRNAs encoding for key cell fate-instructive proteins. In addition to providing important insight into the role of post-transcriptional mechanisms in cell fate control, our findings have a bearing on potential therapeutic applications, as modulation of DDX6 could be exploited to expand clinically relevant stem cell populations.
STAR METHODS
LEAD CONTACT AND MATERIALS AVAILABILITY
Further information and requests for resources and reagents should be directed to and will be fulfilled by the Lead Contact, Konrad Hochedlinger (khochedlinger@mgh.harvard.edu). This study did not generate new unique reagents.
EXPERIMENTAL MODEL AND SUBJECT DETAILS
Mouse breeding and maintenance
Rex1-GFP (C57BL/6 × 129S4/SvJae mixed background) mice were a gift from Pentao Liu, the TetO-Nanog/M2-rtTA (C57BL/6 × 129S4/SvJae mixed background) and the Lgr5tm2(DTR/EGFP)Fjs C57BL/6NCrl mice were described earlier (Palla et al., 2015; Tian et al., 2011). Analyses of the influence of sex was not evaluated in this study. All of the live animals were maintained in a specific-pathogen-free (SPF) animal facility, approved and overseen by the Massachusetts General Hospital Institutional Animal Care and Use Committee (IACUC, protocol no. 2006N000104).
Human primed pluripotent stem cell culture and naïve conversion
Conventional human primed ESCs (WIBR3 “OCT4-GFP” and WIBR3 “ΔPE-OCT4-GFP” (both female) (Theunissen et al., 2014)) and hiPSCs (CRISPRi (GEN1C clone, male) (Mandegar et al., 2016) were maintained on Matrigel (Corning) coated dishes in mTeSR1 medium (Stem Cell Technologies) at 37 °C and passaged using Gentle Cell Dissociation Reagent (Stem Cell Technologies). For maintenance, cells were passaged every 4–5 days. CRISPRi hiPSCs express the dCas9-KRAB-P2A-mCherry construct under a TetO promoter and the rtTA under the CAG promoter (Mandegar et al., 2016).
For the pluripotency exit assay, 40,000 hESCs or hiPSCs were seeded into each well of a Matrigel-coated 24-well plate in mTeSR1 medium (Stem Cell Technologies) supplemented with 10 M Y-27632 (Axon Medchem). 24 hours after seeding, mTeSR1 medium was replaced with the following differentiation media: -bFGF, -TGFβ condition (mTeSR1 Medium w/o Select Factors CUSTOM (Stem Cell Technologies)) or TGFβ pathway inhibition (mTeSR1 + 1 μM A8301 (Stemgent)). Cells were incubated in differentiation media for 120 hours for the -bFGF -TGFβ condition and 48 hours for the TGFβi condition. Media was then replaced with mTeSR1 and incubated for an additional 24 hours before FACS analysis for OCT4-GFP or NANOG expression. DDX6 silencing in the CRISPRi cells was achieved by supplementing the medium with 2 μg/ml doxycycline (Sigma).
For the doxycycline washout experiment, sgDDX6 #5 hiPSCs were cultured in mTeSR1 Medium supplemented with 2 μg/ml doxycycline (Sigma) for 1 week, followed by doxycycline withdraw for an additional week.
To achieve reversion to a naïve state, female WIBR3 (“ΔPE-OCT4-GFP) hESCs (Theunissen et al., 2014) that had been passaged 6 days earlier were washed once with 1X PBS (Life Technologies) and treated for 3 minutes with TrypLE express enzyme (1X, Life Technologies). Cell were dissociated into a single-cell suspension and plated at a density of 30,000 cells per 9.5cm2 on irradiated CF-1 MEFs (GLOBALSTEM INC, Pooled male and female) in hESC medium supplemented with 10 μM Y-27632 (Axon Medchem). Two days later, medium was changed to 5i/LAF and then changed daily. 5i/LAF medium contained a 50:50 mixture of DMEM/F-12 (Life Technologies) and Neurobasal medium (Life Technologies) containing 1x N2 supplement (Life Technologies), 1x B27 supplement (Life Technologies), 10 ng/mL bFGF (Peprotech), 1% nonessential amino acids (Life Technologies), 1mM GlutaMAX (Life Technologies), penicillin-streptomycin (Life Technologies), 0.1 mM β-mercaptoethanol (Life Technologies), 50 μg/mL BSA (Life Technologies), 0.5 μM IM-12 (Axon Medchem), 0.5 μM SB590885 (Axon Medchem), 1 μM WH-4–023 (Axon Medchem), 10 μM Y-27632 (Axon Medchem), 20 ng/mL Activin A (Peprotech), 20 ng/mL rhLIF (Peprotech), 0.5% KSR (Life Technologies) and 1 μM PD0325901 (Axon Medchem). After roughly 8–10 days, cells were dissociated using Accutase (Life Technologies) and centrifuged in fibroblast medium [DMEM (Life Technologies) supplemented with 10% FBS (Hyclone), 1 mM GlutaMAX (Life Technologies), 1% nonessential amino acids (Life Technologies), penicillin-streptomycin (Life Technologies), 0.1 mM β-mercaptoethanol (Life Technologies)] and replated after passing through a 40 μm cell strainer in 5i/LAF medium on irradiated CF-1 MEFs. Established naïve hESC lines were cultured on irradiated CF-1 MEFs (2.5×10⁶ cells per 9.5 cm2) in 5i/LAF medium and passaged every 6–7 days. Cells were fed daily with fresh medium. Naïve hESCs were cultured under low oxygen conditions (5% O2) at 37 °C.
Human mesenchymal stem cell culture and chondrocyte differentiation
Human mesenchymal stem cells (male) were derived from CRISPRi hiPSCs using the STEMdiff™ Mesenchymal Progenitor Kit (Stem Cell Technologies) following the manufacturer’s instructions. Differentiation of mesenchymal stem cells into chondrocytes was achieved using the MesenCult™-ACF Chondrogenic Differentiation Medium (Stem cell technologies).
Human myoblasts culture
Primary human skeletal myoblasts (pooled male and female cells) were obtained from Thermo Fisher (Gibco, A12555) and cultured at 37 °C in MegaCell DMEM (Sigma) containing 5% FBS (Lonza), 2 mM glutamine (Life Technologies), 0.1mM β-mercaptoethanol (Life Technologies), 1X MEM non essential Amino Acids Solution (Life Technologies), 5 ng/ml bFGF (Peprotech), Penicillin (100 U/mL), Streptomycin (100 μg/mL).
Human neural progenitor cell culture and neuronal differentiation
Human neural progenitor cells derived from xcl-1 pluripotent stem cells (male) were obtained from Stem Cell Technologies (cat# 70901) and culture in neural progenitor medium 2 (Stem Cell Technologies, cat# 08560) at 37 °C. Differentiation into neurons was achieved using the STEMdiff™ Neuron Differentiation Kit (Stem Cell Technologies, cat# 08500).
For NPC induction from CRISPRi cells (male), hiPSCs were cultured in DMEM F12 medium (Life Technologies) supplemented with 1X N2 supplement (Life Technologies), 2 mM glutamine (Life Technologies), 100 nM LDN-193189 (Stemgent, 04–0074), 10 μM SB431542 (Tocris, 1254) and 2 μM XAV939 (Stemgent, 04–00046). After 9 days, cells were passaged on Matrigel (Corning) coated dishes using Accutase (Life Technologies) and maintained in STEMdiff™ Neural Progenitor Medium (Stem Cell Technologies). Neuronal differentiation was achieved by culturing NPCs on Matrigel coated dishes in Neurobasal medium supplemented with 1X B27 (Life Technologies), 10 ng/ml BDNF (Peprotech), 10 ng/ml GDNG (Peprotech), ascorbic acid (50 μg/ml, Sigma), 5 M Forskolin (Sigma).
Mouse embryonic stem cell culture
Mouse ESCs “Rex1-GFP” (Rex1::GFPd2 129/sv, male) (Wray et al., 2011) were cultured at 37 °C in naïve mESC culture medium consisting of DMEM/F12 medium and Neurobasal medium (1:1 ratio), supplemented with MEM non essential Amino Acid Solution (1X), Sodium Pyruvate (1mM), L-Glutamine (2mM), Penicillin (100 U/mL), Streptomycin (100 μg/mL), β-mercaptoethanol (50 μM), N2 and B27 supplements, two small-molecule inhibitors PD0325901 (1 μM, Axon Medchem) and CHIR99021 (3 μM, Axon Medchem), and ESGRO® Leukemia Inhibitory Factor (LIF) (1000 U/mL, EMD Millipore).
Induction of exit from pluripotency was performed essentially as described (Betschinger et al., 2013). Briefly, 6-well plates were coated with 0.1% (W/V) EmbryoMax® gelatin at 37 °C for 5 minutes. Rex1GFPd2 cells were disassoci ated with Accutase (Life Technologies) for 2 minutes at room temperature then washed twice with PBS, and 2×10⁵ cells were seeded in each well with naïve mESC culture medium without the two inhibitors and LIF.
Mouse epiblast stem cell derivation and culture
For EpiSC derivation, embryos were harvested on day E6.5, according to the protocol described in (Chenoweth and Tesar, 2010). Briefly, egg cylinder stage embryo was cut at the embryonic/extraembryonic boundary, the embryonic fragment was incubated in dissociation medium (0.5% trypsin and 2.5% pancreatin w/v in PBS) for 5 min on ice, transferred to Embryomax FHM HEPES - buffered medium (EMD Millipore) for 5 min, and drawn through a hand-pulled glass pipette to remove the visceral endoderm. Epiblasts were initially plated on CF-1 MEFs (pooled female and male cells) in EpiSC media at 37 °C, and after 1–3 days dissociated with Accutase (ThermoFisher) and passaged onto Fibronectin-coated plates in EpiSC maintenance medium with the addition of 10μM Y-27632 ROCK inhibitor (Axon Medchem). TetO-Nanog/M2-rtTA EpiSC were generated by deriving EpiSC from timed mating between Rex1-GFP females (C57BL/6 × 129S4/SvJae mixed background), gift of Pentao Liu) and TetO-Nanog/M2-rtTA males (C57BL/6 × 129S4/SvJae mixed background) (Palla et al., 2015). Rex1-GFP/TetO-Nanog/M2-rtTA EpiSCs (male) were maintained on fibronectin (EMD Millipore) coated dishes in EpiSC medium (DMEM/F12 (Life Technologies) with N2 (1:200) and B27 (1:100) supplements (Life Technology), 1X Glutamax (Life Technologies), MEM Non-Essential Amino Acids Solution (1X), 100μM β-mercaptoethanol (Life Technologies), 50 μg/ml bovine serum albumin (BSA; Life Technologies), supplemented with recombinant human Activin A (20 ng/ml; Peprotech) and bFGF (12 ng/ml; Peprotech). EpiSCs were passaged as clumps of 5–20 cells by incubating with Accutase (Life Technology), and plated at a split ratio of 1:3 to 1:8 every 1–2 days. EpiSC lines were used between passage numbers 10–20 for all experiments described.
For conversion of EpiSCs into naïve ESCs, cells were dissociated with Accutase for 15 minutes to achieve single cell suspension, and seeded on 6-well plates on MEFs (5×10⁵ cells/well) at a density of 5×10³ cells/well, in EpiSC media containing Activin A (20 ng/ml; Peprotech), bFGF (12 ng/ml; Peprotech), 10μM Y-27632 ROCK inhibitor (Axon Medchem) in the presence of 2 μg/ml doxycycline to activate the Nanog transgene. After 24 hours, media was switched to reprogramming conditions for 7 days: KO-DMEM (ThermoFisher) supplemented with 15% Knockout Serum Replacement (Life Technologies), with N2 (1:100) and B27 (1:100) supplement (Life Technologies), 1X Glutamax (Life Technologies), 100 μM MEM non-essential amino acids (Life Technology), 100μM β-mercaptoethanol (Life Technologies), 500 μg/ml bovine serum albumin (BSA; Life Technologies),103 IU LIF, 1 μM PD0325901 (Axon Medchem), and 3 μM CHIR99021 (Axon Medchem). Reprogramming to the naïve state was assessed by flow cytometric analysis for the Rex1-GFP reporter.
HEK293T culture
HEK293T (human, female) were obtained from ATCC (Cat# CRL3216) and cultured at 37 °C in DMEM medium (Life Technologies) supplemented with FBS (Life Technologies), 1X Glutamax (Life Technologies), 100 μM MEM non-essential amino acids (Life Technologies), Penicillin (100 U/mL) (Life Technologies), Streptomycin (100 g/mL) (Life Technologies).
Mouse intestinal organoid culture
Crypt isolation and organoid culture (from 3 months old female Lgr5tm2(DTR/EGFP)Fjs C57BL/6NCrl mice) were performed as previously described (Sato et al., 2009). Organoid lines were infected with shRNA lentiviral vectors as previously described (Koo et al., 2013). Once infected, organoids were selected for 7 days with 1 μg/mL puromycin (Invivogen).
METHOD DETAILS
Western blot analysis and IP
Cells were dissociated using Trypsin-EDTA (Thermo-Fisher Scientific) and collected by centrifugation at 350 RCF for 5 minutes in media containing DMEM (Life Technologies), 10% Fetal Bovine Serum (Hyclone), 1X Non-essential Amino Acids (Life Technologies), 1X Glutamax (Life Technologies). The cells were then washed twice in ice-cold PBS (Life Technologies) and pelleted at 350 RCF for 5 minutes. Ten million cells were then incubated on ice for 5 minutes in 100 μl of nuclear isolation buffer (50 mM Tris·HCl (pH 8.0), 60 mM KCl, 15 mM NaCl, 5 mM MgCl2, 1 mM CaCl2, 250 mM sucrose, 1 mM DTT, 0.6% IGEPAL (all from Sigma-Aldrich), complete mini protease inhibitors (Roche Diagnostics) and PhosSTOP phosphatase inhibitors (Roche Diagnostics). Nuclei were pelleted at 960 RCF and the supernatant containing the cytoplasmic fraction was collected for further analysis. The resulting nuclear pellet was washed twice in nuclear isolation buffer and lysed in RIPA buffer (50 mM Tris-HCL (pH8), 150 mM NaCl, 0.1% SDS, 0.5% sodium deoxycholate, 1% Triton X-100, 1 mM EDTA (all from Sigma-Aldrich), complete mini protease inhibitors (Roche Diagnostics), and PhosSTOP phosphatase inhibitors (Roche Diagnostics). Both nuclear and cytoplasmic fractions were sonicated for 5 minutes in a Bioruptor bath sonicator (Diagenode).
For immunoprecipitation, cell lysates were separated from cell debris via centrifugation at 18,000 RCF for 5 minutes at 4°C. To pre-clear the lysates, 30 ul of Protein G Mag Sepharose beads (GE Healthcare) were equilibrated for 5 minutes in RIPA buffer and added to the lysates, which were then incubated at 4°C with rotation for one hour. In total, 6 g of either DDX6 antibody (Novus Biologicals) or rabbit IgG control (AbCam) were added per 100 μl of pre-cleared lysate. The lysates were then incubated overnight at 4°C with rotation. The next day, 50 ul of equilibrated Protein G Mag Sepharose beads were added to each lysate and incubated for one hour at 4°C with rotation. The beads were then washed twice in RIPA buffer and an additional three times in 50 mM Tris-HCl (pH 8), 150 mM NaCl, 0.2 mM EDTA (all from Sigma-Aldrich) complete mini protease inhibitors (Roche Diagnostics), and PhosSTOP phosphatase inhibitors (Roche Diagnostics). The beads were then taken for further analysis by mass spectrometry.
In preparation for Western blot analysis, cell fractions were generated as described above. The following antibodies were used for Western blot: βIII-TUBULIN (1:2000, Cell Signaling Technology, clone 9F3, cat. #2128); Histone H3 (1:10,000, AbCam, cat. #1791); DDX6 (1:2000, Novus Biologicals, NB200–192); β-ACTIN (1:2000, Cell Signaling Technology, clone 13E5, cat. #4970); PABP (1:500, Santa Cruz Biotechnology, clone 10E10, cat. #SC-32318), ATXN2L (1:100, Bethyl Laboratories, cat. #A301–370A), DCP1B (1:1000, Cell Signaling Technology, clone D2P9W, cat. #13233).
Vectors and cloning
The pLKO-shDDX6 #1 (TRCN0000074696) and pLKO-shDDX6 #2 (TRCN0000074694) vectors targeting the human DDX6 genes were obtained from the Molecular Profiling Laboratory of the MGH Cancer Center. The shERWOOD UltramiR Lentiviral shRNAs targeting the mouse Ddx6 gene were purchased from Transomic technologies. The shERWOOD UltramiR Lentiviral shRNAs targeting the human KDM4B gene were purchased from Transomic Technologies. The pLKO-shDCP1A (TRCN0000235901) and pLKO-shLSM14A (TRCN0000128028) vectors were obtained from the Molecular Profiling Laboratory of the MGH Cancer Center. For CRISPRi, five gRNAs were designed to target regions near the transcription start site (TSS) of the gene of interest (250 bp upstream and downstream, respectively). The location of the TSS was determined using the UCSC genome browser (https://genome.ucsc.edu). sgRNA oligos were designed, phosphorylated, annealed and cloned into the pgRNA-CKB vector using BsmBI ligation strategy as previously described (Mandegar et al., 2016). The following sgRNAs were tested for DDX6 silencing:
#1 CGCCGCGGCGAATATAGCCG (-strand);
#2 TGGCGAAACCTCGGCCGCCG (+strand);
#3 GCGGTCGCCGCCATGCGGAG (-strand);
#4 TTCGGCGGCGCCACGAGAGC (-strand);
#5 CAGCCAGGCGGCGACTTCGG (-strand).
Lentiviral vectors expressing the wild type and mutant (E247Q) DDX6 cDNAs were obtained from Vector Builder. The PCLP-KDM4B and PCLP-empty vectors were described earlier (Castellini et al., 2017).
Virus production
Virus production was performed as previously described (Di Stefano et al., 2014). Briefly, HEK293T cells were co-transfected with vector plasmid and packaging plasmids using the TransIT®-293 Transfection Reagent (Mirus). Viral supernatants were collected 32 hours later and concentrated by ultracentrifugation at 20,000g for 2 h at 20 °C. Viral concentrates were re-suspended in PBS and stored at −80 °C.
sgRNA nucleofection and selection of stable CRISPRi lines
The sgRNA-expression vector (pgRNA-CKB) was transfected into the CRISPRi cells with the human stem cell nucleofector kit 1 solution on the Amaxa nucleofector 2b device (program A-23; Lonza). Two million CRISPRi hiPSCs and 5 μg of the circular sgRNA-expression plasmid were used per nucleofection. Nucleofected cells were then seeded in a single well of a 6-well plate in mTeSR1 supplemented with Y-27632 (10 μM). Blasticidin selection (10 μg/ml) was applied 24 h post-nucleofection in mTeSR1 supplemented with Y-27632 (10 μM) for 7–10 days, until stable colonies appeared. Stable colonies were then pooled and passaged at least three times in mTeSR1 plus Blasticidin and Y-27632 and FACS sorted for mKATE2 expression to enrich for cells with integration at transcriptionally active sites.
RNA preparation
RNA isolation was performed using the miRNeasy mini kit (Qiagen). RNA was eluted from the columns using RNase-free water and quantified using a Nanodrop ND-1000. cDNA was produced with the High Capacity RNA-to-cDNA kit (Applied Biosystems). To generate material for sequencing cells were sorted for GFP expression and cell viability (DAPI staining).
qRT-PCR analyses
qRT-PCR reactions were set up in triplicate with the Brilliant III SYBR Master Mix (Agilent Genomics). Reactions were run on a LightCycler 480 (Roche) PCR machine with 40 cycles of 30s at 95 °C, 30s at 60 °C and 30 s at 72 °C. Primers are available upon request.
TaqMan-based qRT-PCR reactions were set up using the TaqMan™ Universal Master Mix II, no-UNG (Life Technologies,1 × 5 mL (4440040)) and the following TaqMan probes (from Life Technologies): TaqMan® Gene Expression Assays (DDX6) Hs00898915_g1 size XS 75rnx (4448892); TaqMan® Gene Expression Assays (ACTB) (SIZE: S 250 RNX) Hs99999903_m1 (4453320); TaqMan® Gene Expression Assays (HPRT1) Hs02800695_m1 (4453320).
Measurement of RNA stability
Cells were treated with Actinomycin D (Tocris) (10 μg/ml) for 0, 0.5, 1.5, 2.5, 4 and 5 hours to determine the half-life of target mRNAs. RNA was isolated from the samples and qRT- PCR was used to determine the levels of target genes. RPS18 was used as control gene for data normalization.
DNA preparation
DNA was extracted using the DNeasy Blood & Tissue Kit (Qiagen) and quantified using the Qubit dsDNA High Sensitivity Kit (Life Technologies).
Flow cytometry
Cells were analyzed with an LSR II flow cytometer (BD Biosciences) using Diva v8.0.1 (BD Biosciences) or a Miltenyi MACSQuant VYB analyzer. Cell permeabilization was performed using the Fix and Perm Cell Fixation and Cell Permeabilization Kit (ThermoFisher Scientific, GAS003) following the manufacturer’s instructions. Primary antibodies used were NANOG (D73G4) XP® Rabbit mAb (1:100) (Alexa Fluor® 647 Conjugate, Cell signaling 5448), THY-1 (1:100) (PE anti-human CD90 (Biolegend 328110)), KDM4B (1:100) (Abcam ab191434), CD73 (1:100) (APC/Cy7 anti-human CD73 Antibody (Biolegend 344021)), CD105 (1:100) (APC anti-human CD105 Antibody (Biolegend 323207), (1:100) CD146 (APC anti-human CD146 (1:100) (Biolegend 361015)), CD144 (1:100) (PE anti-human CD144 Antibody (Biolegend 348505), CD34 (1:100) (PE anti-human CD34 Antibody (Biolegend 343605).
Immunofluorescence
For immunostaining, cells were fixed with 4% paraformaldehyde, blocked and incubated with primary antibodies overnight at 4 °C. They wer e then stained with Alexa Fluor conjugated secondary antibodies Goat anti-Rabbit IgG (H+L) (Thermo Fisher) and Goat anti-Mouse IgG (H+L) (Thermo Fisher) at RT for one hour. Nuclear staining was performed with DAPI (BD Bioscience). The following primary antibodies were used in this study: NANOG (D73G4) XP® Rabbit mAb #4903 (1:300) (4903S, Cell Signaling), NESTIN (1:200) (10C2, Biolegend 656801), EDC4 (1:50) (Abcam ab72408) DDX6 (Novus NB200–192), βIII-tubulin (TUJ1, Biolegend 801211), SOX1 (R&D SYSTEMS AF3369), SOX2 (R&D SYSTEMS AF2018), MYOSIN (MF-20 Hybridoma bank), LSM14A (1:50) (N3C3, GeneTex GTX120902), LSM14B (1:50) (Sigma Aldrich HPA061189).
RNA-seq
For human iPSCs and ESCs, RNA sequencing libraries were prepared using Ribo-Zero rRNA Removal Kit (H/M/R) (Illumina, MRZH11124) and NEBNext Ultra™ Directional RNA Library Prep Kit for Illumina (E7420). The total RNA input amount for the RiboZero kit was 1 μg total. The rRNA input for library construction was 50 ng total. For neural, muscle progenitors and DDX6 OE samples, RNA-seq libraries were constructed from polyadenosine (polyA)-selected RNA using NEBNext Ultra Directional RNA library prep kit for Illumina (New England BioLabs). Libraries were amplified for 14 cycles. Post library constructions, the samples were validated using 2200 Tapestation System and High Sensitivity D1000 ScreenTape kit. Libraries were quantified using the Kapa Biosystems Library Quantification kit (KK4828) and the BioRad CFX96 instrument. Each lane of sequencing was pooled into a 19-plex (19 samples per lane) with unique barcodes. Pooled libraries are also quantified using the Kapa Biosystems Library Quantification kit (KK4828) and the BioRad CFX96 instrument. These pools are then denatured to 16 pM with 1% PhiX and sequenced on the Illumina HiSeq2000 instrument, resulting in approximately 40 million reads per sample.
Reduced Representation Bisulfite Sequencing (RRBS)
RRBS libraries were prepared using a commercial kit (Ovation RRBS Methyl-Seq System, NuGen, San Carlos, CA) following the manufacturer’s protocol except that we pooled 12 individually barcoded reactions after the final repair step and performed the bisulfite conversion and library amplification as a pool. Libraries were sequenced on an Illumina HiSeq2500 high-output flowcell without a PhiX spike-in using Nugen’s custom sequencing primer for read 1 (50 bases) and standard Illumina sequencing primers to read the 8-base sample barcodes.
Assay for Transposase-Accessible Chromatin using sequencing (ATAC-seq)
ATAC-seq was performed as previously described (Buenrostro et al., 2013). 60,000 cells were washed once with 100ml PBS and resuspended in 50ml lysis buffer (10mM Tris-HCl pH 7.4, 10mM NaCl, 3mM MgCl2, 0.2% IGEPAL CA-630). The suspension of nuclei was then centrifuged for 10min at 500g at 4 °C, followed by the addition of 50ml transposition reaction mix (25ml TD buffer, 2.5ml Tn5 Transposase and 22.5ml Nuclease Free H2O) and incubation at 37 °C for 30min. DNA was isolated using MiniElute Kit (QIAGEN). Libraries were amplified by PCR (13 cycles). After the PCR reaction, the library was selected for fragments between 100bp and 1000bp with AmpureXP beads (Beckman Coulter). Libraries were purified with Qiaquick PCR (QIAGEN) and integrity checked on a Bioanalyzer before sequencing.
Proteomic and IP-mass spectrometry
Cells were syringe-lysed in a buffer containing 8 M urea, 200 mM EPPS, pH 8.5 and protease inhibitors. Protein concentrations in the clarified lysates were estimated using the Bicinchoninic acid (BCA) protein assay (Thermo Fischer Scientific). Protein disulfide reduction was carried out with 5 mM tris (2 carboxyethyl) phosphine for 30 minutes at room temperature followed by alkylation with 10 mM iodoacetamide for 30 minutes in the dark at room temperature. Excess iodoacetamide was quenched with 15 mM dithiothreitol for 15 minutes at room temperature in the dark. Proteins were precipitated using methanol/chloroform and washed with methanol prior to air drying. Proteins were then resuspended in buffer containing 8 M urea and 50 mM EPPS, pH 8.5. Prior to digestion, samples were diluted to < 1 M urea with 50 mM EPPS, pH 8.5. LysC was added at a 1:100 enzyme:protein ratio, and digestion proceeded at room temperature overnight followed by trypsin digestion (1:100 enzyme:protein ratio) for 7 hours at 37 °C. Peptides were quantified from clarified digests using Pierce Quantitative Colorimetric Peptide Assay. TMT-10 reagents (0.8 mg) were dissolved in 40 μl anhydrous acetonitrile, and 7.5 μl was used to label 75 μg of each sample in 30% (v/v) acetonitrile for 1 hour at room temperature. The labeling reaction was quenched using 0.5% hydroxylamine. Labeled peptides were then pooled, vacuum centrifuged to dryness, and desalted using 50 mg Sep-Pak (Waters). For affinity purified samples, 100 μl 200 mM EPPS, pH 8.5 was added prior to protein disulfide reduction and alkylation as detailed above. Proteins were digested first with 1 ug LysC at room temperature overnight and then 500 ng trypsin at 37 °C for 7 hours. Digests w ere acidified and cleaned via StageTip prior to TMT labelling (5 μl), pooling, and desalting as described above.
The pooled TMT-labeled peptides from whole-cell lysates were fractionated using BPRP HPLC using an Agilent 1260 Infinity pump equipped with a degasser and a single wavelength detector (set at 220 nm). Peptide separation occurred over an Agilent 300Extend C18 column (3.5 μm particles, 4.6 mm ID and 250 mm in length) across a 50 min linear gradient from 8% to 40% acetonitrile in 10 mM ammonium bicarbonate, pH 8 at a flow rate of 0.6 ml/min. A total of 96 fractions were collected and then consolidated into 24 and vacuum centrifuged to dryness. Twelve of the 24 fractions were resuspended in a 5% acetonitrile, 1% formic acid solution. Fractions were desalted via StageTip, dried via vacuum centrifugation, and reconstituted in 5% acetonitrile, 5% formic acid for LC-MS/MS processing.
Mass spectrometry data were collected using an Orbitrap Fusion Lumos mass spectrometer (Thermo Fischer Scientific) equipped with a Proxeon EASY-nLC 1000 liquid chromatography (LC) system (Thermo Fisher Scientific). Peptides were separated on a 100 m inner diameter microcapillary column packed with ~35 cm of Accucore C18 resin (2.6 m, 150 Å, Thermo Fisher Scientific). Approximately 2ug peptides were separated using a 2.5 h gradient of acidic acetonitrile. The multinotch MS3-based TMT method was used (McAlister et al., 2014). The scan sequence began with a MS1 spectrum (Orbitrap analysis; resolution 120,000; mass range 400–1400 Th). MS2 analysis followed collision-induced dissociation (CID, CE = 35) with a maximum ion injection time of 120 ms and an isolation window of 0.7 Th. The 10 most abundant MS1 ions of charge states 2–5 were selected for MS2/MS3 analysis. To obtain quantitative information, MS3 precursors were fragmented by high-energy collision-induced dissociation (HCD, CE = 65) and analyzed in the Orbitrap (resolution was 50,000 at 200 Th) with a maximum ion injection time of 150 ms and a charge state-dependent variable isolation window of 0.7 to 1.2 Da (Paulo et al., 2016).
Enhanced Crosslinking and Immunoprecipitation (eCLIP)
eCLIP (Van Nostrand et al., 2016b) was performed for DDX6 using CRISPRi hiPSCs and human myoblasts. 2 × 10⁷ cells for each replicate were UV-crosslinked (254 nm, 400 mJ/cm2), collected and lysed. Lysates were sonicated, subjected to limited RNase I digestion (40 U per ml of lysate) and RNA-protein complexes immunoprecipitated for 16 h at 4 °C with 10 μg affinity-purified antibody (DD X6 #A300–460A, Bethyl). Prior to immunoprecipitation, an aliquot of each extract was removed and stored at 4 °C for preparation of the size-matched input (SMInput) control. Complexes were collected with anti-mouse or rabbit magnetic beads, washed, dephosphorylated and 3’-ligated on-bead to custom oligonucleotides. All samples (IPs and SMInputs) were run on 4–12% polyacrylamide gradient gels and complexes transferred to nitrocellulose membranes. Successful immunoprecipitation was confirmed by parallel western blotting of fractions of each sample using the antibodies described above. RNA-protein complexes in the range from the RBP apparent molecular mass to 75 kDa above (corresponding to crosslinked RNAs of up to ~200 nucleotides in length) were excised from the membrane and RNAs released with proteinase K. SMInput samples were dephosphorylated and 3’-ligated. All samples (IPs and SMInputs) were reverse transcribed and cDNAs 5’-ligated on-bead, quantified by qPCR, and PCR-amplified with <18 cycles. PCR products were size-selected to 175–350 bp on agarose gels and resulting libraries sequenced on a HiSeq4000 instrument (Illumina) in paired-end 55 bp mode (eCLIP). All oligonucleotide adapters and primers are described in (Van Nostrand et al., 2017; Van Nostrand et al., 2016b).
Polysome profiling
GEN1C hiPSCs (8 × 10⁷ cells for each biological replicate) were treated with 100 μg/ml cycloheximide (CHX, Tocris #0970) for 2 minutes at 37 °C. Cell culture plates were then transferred on ice, the cells were scraped in 1X PBS supplemented with 100 μg/ml CHX and collected. After centrifugation, cell pellets were resuspended in 500 μl lysis buffer (20 mM Tris pH 7.5, 150 mM NaCl, 5 mM MgCl2, 1% Triton X-100, 100 μg/ml CHX, 1 mM DTT, 20 U/ml SUPERase-In (Invitrogen)), centrifuged at 14,000 × g for 10 min at 4˚C and the supernatants were collected and stored at −80 °C. Lysates were clarified by centrifugation at 17,500 × g at 4 °C for 15 min. 100 μl lysate was reserved for inputs and 400 μl lysate used for fractionation. For fractionation, a 10–50% (w/v) sucrose gradient was prepared in polysome buffer (20 mM Tris-HCl pH 7.4, 150 mM NaCl, 5mM MgCl2, 1 × protease inhibitor cocktail (EMD Millipore), 100 μg/ml CHX, 1 mM DTT, and 20 U/ml RNase inhibitor (RNaseOUT, Thermo Fisher)). Samples were loaded on the sucrose gradient and centrifuged at 35,000 × g (Beckman, rotor SW41) at 4 °C for 3 h. Fractions were collected from the top and UV absorbance monitored using a Gradient Station (BioCamp) equipped with ECONO UV monitor (BioRad). 500 μl fractions were collected using a FC203B fraction collector (Gilson). Fractions containing monosome, light polysome, medium polysome, heavy polysome, and total polysome were identified by their UV absorbance and pooled. Total RNA from the inputs and each pool were extracted in TRIzol-LS (Thermo Fisher) and purified with Direct-zol RNA kits (Zymo). RNA sequencing libraries were generated and sequenced, and reads processed as described above. Strand-specific RNA sequencing libraries were prepared from 0.5 μg total RNA using the TruSeq Stranded mRNA Sample Preparation kit (Illumina). Libraries were sequenced on the HiSeq 4000 platform in SE75 mode.
Chromatin Immunoprecipitation Sequencing (ChIP-seq)
5 × 10⁶ cells were crosslinked with 1% FA for 10 minutes at RT. Glycine was added to a final concentration of 125mM and mixed for 5min at RT. Crosslinked cells were washed with DPBS 2x then spun down 3min at 15000g. Cells were then incubated with 500μL cell lysis buffer (20 mM Tris-HCl ph8.0, 85 mM KCl, 0.5% NP 40) for 10min on ice then spun down for 3min at 2500g. Supernatant was removed and the cell pellet was resuspended in 500μL of nuclear lysis buffer (10 mM Tris–HCl, pH 7.5, 1% NP-40, 0.5% sodium deoxycholate, 0.1% SDS) then incubated for 10min on ice. Volume was increased to 1mL using Nuclei Lysis Buffer then sonicated on a Covaris E220 Evolution sonicator (PIP = 140.0, Duty Factor = 5.0, Cycles/Burst = 200, 10min). After sonication chromatin was spun down at 15000g for 10 minutes to pellet insoluble material. Volume was increased to 1.5mL with Chip Dilution Buffer (0.01% SDS, 1.1% Triton X-100,1.2mM EDTA, 16.7mM Tris-HCl pH 8.1, 167mM NaCl) and 2ug of H3K4me3 antibody (Abcam, ab8580), H3K27ac (Abcam, ab4729) or H3K9me3 (Abcam, ab8898) were added. Immunoprecipitation mixture was allowed to rotate overnight at 4°C. The next day, 40μL of Protein A Dynabeads (Thermo, 10001D) were added to the IP mixture and allowed to rotate for 4hrs at 4°C. This was fol lowed by two washes of each: low salt wash buffer (0.1% SDS, 1% Triton X-100, 2mM EDTA, 20mM Tris-HCl pH 8.1, 150mM NaCl); high salt wash buffer (0.1% SDS, 1% Triton X-100, 2 mM EDTA, 20mM Tris, pH 8.1, 500 mM NaCl); LiCl wash buffer (0.25M LCl, 1% NP40, 1% deoxycholate, 1mM EDTA, 10mM Tris-HCl pH 8.1); and TE buffer pH 8.0 (10mM Tris-HCl, pH 8.0, 1mM EDTA pH 8.0). DNA was eluted twice using 50μLs of elution buffer (0.5 to 1% SDS and 0.1 M NaHCO3) at 65°C for 15 minutes. 16μL of rever se crosslinking salt mixture (250 mM Tris-HCl, pH 6.5, 62.5 mM EDTA pH 8.0, 1.25 M NaCl, 5mg/ml Proteinase K) was added and samples were allowed to incubate at 65°C overnight. For library preparation, DNA was purified using AMPure XP beads (Beckman-Coulter) and treated with DNase-free RNase (Roche) for 30 min at 37 °C. DNA librari es were then end repaired and A-tailed using Ultra II End Repair/dA-Tailing Module (NEB) and adapters (Broad Institute, single index P7) were ligated using Blunt/TA Ligase Master Mix (NEB). Next, libraries were PCR amplified using Pfu Ultra II Fusion High-fidelity DNA Polymerase (Agilent) then size selected on a gel for fragments between 200–1000bp. Samples were sequenced on a NextSeq500 system to a targeted depth of 50 million reads per sample.
QUANTIFICATION AND STATISTICAL ANALYSIS
Statistical analysis
Quantitative data are presented as means ± s.d. (standard deviation). Statistical analyses were performed using Prism 8.2 software (GraphPad). Details for statistical analyses, including replicate numbers, are included in the figure legends.
Flow cytometry analysis
Analysis and visualization of flow cytometry data was performed using FlowJo (v10.5.3).
RNA-seq analysis
For hESC and iPSC RNA-seq analysis, read mapping was performed with STAR version 2.3.0 (Dobin et al., 2013) against human hg19 genome using the Ensembl exon/splice-junction annotations. Read counts for individual genes were produced using the unstranded count feature in HTSeq v.0.6.0 (Anders et al., 2015). Differential expression analysis was performed using the EdgeR package (Robinson et al., 2010) after normalizing read counts and including only those genes with cpm > 1 for one or more samples. Differentially expressed genes were defined based on the criteria of >1.5-fold change in expression value and false discovery rate (FDR) < 0.05. Expression of transposable elements was analyzed separately based on the genomic coordinates from (Theunissen et al., 2016). RNA-seq reads were aligned to the corresponding transcript sequences and quantified using Salmon (Patro et al., 2017).
For human NPC, myoblast and DDX6 overexpression RNA-seq analysis, STAR aligner (Dobin et al., 2013) was used to map sequencing reads to transcripts in the hg19 reference genome. Read counts for individual transcripts were produced with HTSeq-count (Anders et al., 2015), followed by the estimation of expression values and detection of differentially expressed transcripts using EdgeR (Robinson et al., 2010). Differentially expressed genes were defined by at least 1.5-fold change with FDR less than 0.001.
Analysis of enriched functional categories among detected genes was performed using EnrichR (Kuleshov et al., 2016) and Gene Ontology Consortium (http://www.geneontology.org). TargetScan miRNA enrichment analysis was performed using Network2Canvas (https://maayanlab.net/N2C/).
RRBS analysis
For RRBS analysis, sequencing reads were trimmed using timgalore (default parameters, http://www.bioinformatics.babraham.ac.uk/projects/trim_galore/), as well as a NuGEN-provided script for diversity trimming and filtering. Trimmed reads were aligned to the hg19 human genome using BSmap (Xi and Li, 2009) with flags -v 0.05 -s 16 -w 100 -S 1 -p 8 -u. The methylation status of CpGs were called by observing bisulfite conversion in reads at locations of cytosines in the reference sequence. Region methylation averages were called using CpGs that were covered with at least 3 reads in at least 80% of samples.
Mass spectrometry analysis
Mass spectra were processed using a SEQUEST-based software pipeline (Huttlin et al., 2010; McAlister et al., 2012; McAlister et al., 2014). A modified version of ReAdW.exe was used to convert spectra to mzXML. Database searching used the human proteome downloaded from Uniprot in both forward and reverse directions, along with common contaminating protein sequences. Searches were performed using a peptide mass tolerance of 20 ppm, and a fragment ion tolerance of 0.9 Da. These wide-mass-tolerance windows were chosen to maximize sensitivity in conjunction with SEQUEST searches and linear discriminant analysis (Beausoleil et al., 2006; Huttlin et al., 2010). TMT tags on lysine residues and peptide N termini (+229.163 Da) and carbamidomethylation of cysteine residues (+57.021 Da) were set as static modifications, while oxidation of methionine residues (+15.995 Da) was set as a variable modification.
Peptide-spectrum matches (PSMs) were filtered using linear discriminant analysis and adjusted to a 1% false discovery rate (FDR) as described previously (Elias and Gygi, 2007; Huttlin et al., 2010). Linear discriminant analysis considered the following parameters: XCorr, ΔCn, missed cleavages, adjusted PPM, peptide length, fraction of ions matched, charge state, and precursor mass accuracy. Peptides were again filtered to a final protein-level FDR of 1%. Peptides were quantified from MS3 scans after filtering out those with poor quality (required total TMT reporter signal-to-noise ratio > 200 and isolation specificity > 0.7). Protein quantitation was performed by summing the signal-to-noise values for all peptides for a given protein, and each TMT channel was summed across all quantified proteins and normalized to enforce equal protein loading. Each protein’s quantitative measurements were then scaled to sum to 100 across all samples.
eCLIP-seq analysis
For eCLIP-seq data, sequencing reads were processed as described (Van Nostrand et al., 2016a). Reads were adapter-trimmed and mapped to human-specific repetitive elements from RepBase (version 18.04) by STAR (Dobin et al., 2013). Repeat-mapping reads were removed, and remaining reads mapped to the human genome assembly hg19 with STAR. PCR duplicate reads were removed using the unique molecular identifier (UMI) sequences in the 5’ adapter and remaining reads retained as ‘usable reads’. Peaks were called on the usable reads by CLIPper (Lovci et al., 2013) and assigned to gene regions annotated in Gencode (v19). Each peak was normalized to SMInput by calculating the fraction of the number of usable reads from immunoprecipitation to that of the usable reads from the SMInput. Peaks were deemed significant at ≥4-fold enrichment and p-value ≤ 10−3 (Chi-square test, or Fisher’s exact test for read numbers in eCLIP or SMInput <5). For all target gene analyses, genes with at least 1 significant peak binding on transcripts were called target genes. For region analysis, usable reads were assigned to all transcripts annotated in Gencode v19. For reads overlapping >1 annotated region, each read was assigned to 1 region with the following descending priority order: CDS, 5’UTR, 3’UTR, intron. For each gene, reads were summed up across each region to calculate final region counts. A pseudocount read was added to sets with 0 reads in the region. Read counts were normalized by the total usable reads for calculating the fold-enrichment between immunoprecipitation over SMInput.
ATAC-seq analysis
For ATAC-seq, sequenced reads were aligned against the hg19 reference genome using BWA (Li and Durbin, 2010). Alignments were filtered for uniquely mapped none-mitochondrial reads and duplicates were removed. Peak calling was carried out with HOTSPOT (John et al., 2011). We identified 90,000 – 110,000 peaks, which showed high consistency between biological duplicates. The union of these peak sets was used to calculate the ATAC-seq coverage over each peak region across all samples. Differential accessible peaks were identified using edgeR (Robinson et al., 2010) with at least 1.5-fold difference and FDR<0.01. Sequence motifs for differential accessible peaks were identified with MEME-chip (Bailey et al., 2009).
Polysome profiling analysis
For polysome profiling, RNA-seq reads were trimmed using cutadapt (v1.4.0) of adaptor sequences and mapped to repetitive elements (RepBase v18.04) using STAR (v2.4.0i). Reads that did not map to repetitive elements were then mapped to the human genome (hg19). GENCODE (v19) gene annotations and featureCounts (v.1.5.0) were used to create read count matrices. The transcript RPKMs of inputs and polysome fraction pools were calculated from the read count matrices. Translation ratios were measured by calculating the RPKM ratio of transcript levels in polysome pools over input. Translation ratio fold changes between knockdown samples and their respective controls were calculated and used to calculate cumulative probabilities. Translationally up-regulated and down-regulated genes were defined as log2(translation ratio fold change) > 0.5 fold and < 0.5 fold, respectively. Kvector (https://github.com/olgabot/kvector) was used to count k-mers from the <foreground> bed file of significantly up-regulated peaks and <background> bed file containing randomly defined peaks with the same genic distribution as foreground peaks. The enrichment score of each k-mer was calculated by Z-test by using the number of k-mers in the foreground relative to the background. HOMER was used to identify de novo motifs using the command ‘findMotifsGenome.pl <foreground> hg19 <output location> -rna -S 20 -len 6 -p 4 -bg <background>‘ Foreground was a bed file of translation up-regulated peaks; the background was randomly defined peaks within the same annotated region as foreground peaks.
ChIP-seq analysis
For ChIP-seq, data processing was done mainly following the Blueprint Chip-Seq analysis pipeline (http://dcc.blueprint-epigenome.eu/#/md/chip_seq_grch37). In brief, single end 75bp reads were aligned against the hg19 human reference genome using bwa mem version 0.7.17-r1188 (arXiv:1303.3997v2 [q-bio.GN]) and duplicates were marked using gatk markduplicates version 4.0.11.0 (http://broadinstitute.github.io/picard). The aligned data were further filtered for minimum mapping quality of 15. For peak calling first the fragment size was modelled using the PhantomPeakQualTools R script (Kharchenko et al., 2008).
DATA AND CODE AVAILABILITY
The eCLIP-seq, ATAC-seq, ChIP-seq, RRBS, Polysome profiling and RNA-seq data generated during this study are available at GSE112479.
The human ESC exit screening data were obtained from (Gonzales et al., 2015). Mouse ESC exit screening data were obtained from (Li et al., 2018; Yang et al., 2012). The ChIP-seq data for human myoblasts used for comparison with the ATAC-seq data in Figure S7B were from the ENCODE project (Consortium, 2012).
Supplementary Material
Table S1. DDX6 interactors identified by IP-mass spectrometry in hiPSCs, Related to Figure 4
Table S2. Protein expression levels in Control and DDX6 depleted hiPSCs, Related to Figure 4
Table S3. DDX6 target mRNAs identified by eCLIP-seq in hiPSCs, Related to Figure 5
Table S4. DDX6 target mRNAs identified by eCLIP-seq in human myoblasts, Related to Figure 5
HIGHLIGHTS.
DDX6 depleted PSCs lose P-bodies and cannot exit pluripotency
DDX6 depletion perturbs adult stem potency in a context-dependent manner
DDX6 suppresses the translation of P-body enriched TFs and chromatin regulators
P-body loss profoundly alters chromatin organization in stem cells
ACKNOWLEDGMENTS
We thank T.W. Theunissen and R. Jaenisch for sharing the WIBR3 “OCT4-GFP” and WIBR3 “ΔPE-OCT4-GFP” hESC lines, M.A. Mandegar and B.R. Conklin for the CRISPRi-GEN1C hiPSCs, A. Smith for Rex1-GFPd2 mESCs and P. Liu for the Rex1-GFP mice, S. Vasudevan for critical reading of the manuscript, the MGH next generation sequencing facility and the HSCI flow cytometry core for technical assistance, and members of the Hochedlinger lab for discussions. K.H. was supported by funds from the MGH, NIH (R01 HD058013, P01 GM099134) and the Gerald and Darlene Jordan Chair in Regenerative Medicine. B.D.S. was supported by an EMBO long-term Fellowship (#ALTF 1143-2015) and an MGH Tosteson and FMD postdoctoral fellowship. S.P.G. was supported by NIH grant GM67945. R.I.S. was supported by NIH grant P30 DK40561. A.M. is supported by NIH grant P01 GM099117 and the Max Planck Society.
Footnotes
Publisher's Disclaimer: This is a PDF file of an unedited manuscript that has been accepted for publication. As a service to our customers we are providing this early version of the manuscript. The manuscript will undergo copyediting, typesetting, and review of the resulting proof before it is published in its final form. Please note that during the production process errors may be discovered which could affect the content, and all legal disclaimers that apply to the journal pertain.
DECLARATION OF INTERESTS
The authors declare no competing interests.
REFERENCES
- Anders S, Pyl PT, and Huber W (2015). HTSeq--a Python framework to work with high-throughput sequencing data. Bioinformatics 31, 166–169. [DOI] [PMC free article] [PubMed] [Google Scholar]
- Apostolou E, and Hochedlinger K (2013). Chromatin dynamics during cellular reprogramming. Nature 502, 462–471. [DOI] [PMC free article] [PubMed] [Google Scholar]
- Ayache J, Benard M, Ernoult-Lange M, Minshall N, Standart N, Kress M, and Weil D (2015). P-body assembly requires DDX6 repression complexes rather than decay or Ataxin2/2L complexes. Mol Biol Cell 26, 2579–2595. [DOI] [PMC free article] [PubMed] [Google Scholar]
- Bailey TL, Boden M, Buske FA, Frith M, Grant CE, Clementi L, Ren J, Li WW, and Noble WS (2009). MEME SUITE: tools for motif discovery and searching. Nucleic Acids Res 37, W202–208. [DOI] [PMC free article] [PubMed] [Google Scholar]
- Batista PJ, Molinie B, Wang J, Qu K, Zhang J, Li L, Bouley DM, Lujan E, Haddad B, Daneshvar K, et al. (2014). m(6)A RNA modification controls cell fate transition in mammalian embryonic stem cells. Cell stem cell 15, 707–719. [DOI] [PMC free article] [PubMed] [Google Scholar]
- Beausoleil SA, Villen J, Gerber SA, Rush J, and Gygi SP (2006). A probability- based approach for high-throughput protein phosphorylation analysis and site localization. Nat Biotechnol 24, 1285–1292. [DOI] [PubMed] [Google Scholar]
- Becker JS, Nicetto D, and Zaret KS (2016). H3K9me3-Dependent Heterochromatin: Barrier to Cell Fate Changes. Trends Genet 32, 29–41. [DOI] [PMC free article] [PubMed] [Google Scholar]
- Bertero A, Brown S, Madrigal P, Osnato A, Ortmann D, Yiangou L, Kadiwala J, Hubner NC, de Los Mozos IR, Sadee C, et al. (2018). The SMAD2/3 interactome reveals that TGFbeta controls m(6)A mRNA methylation in pluripotency. Nature 555, 256–259. [DOI] [PMC free article] [PubMed] [Google Scholar]
- Betschinger J, Nichols J, Dietmann S, Corrin PD, Paddison PJ, and Smith A (2013). Exit from pluripotency is gated by intracellular redistribution of the bHLH transcription factor Tfe3. Cell 153, 335–347. [DOI] [PMC free article] [PubMed] [Google Scholar]
- Boeynaems S, Alberti S, Fawzi NL, Mittag T, Polymenidou M, Rousseau F, Schymkowitz J, Shorter J, Wolozin B, Van Den Bosch L, et al. (2018). Protein Phase Separation: A New Phase in Cell Biology. Trends Cell Biol 28, 420–435. [DOI] [PMC free article] [PubMed] [Google Scholar]
- Brengues M, Teixeira D, and Parker R (2005). Movement of eukaryotic mRNAs between polysomes and cytoplasmic processing bodies. Science 310, 486–489. [DOI] [PMC free article] [PubMed] [Google Scholar]
- Brumbaugh J, Di Stefano B, Wang X, Borkent M, Forouzmand E, Clowers KJ, Ji F, Schwarz BA, Kalocsay M, Elledge SJ, et al. (2018). Nudt21 Controls Cell Fate by Connecting Alternative Polyadenylation to Chromatin Signaling. Cell 172, 106–120 e121. [DOI] [PMC free article] [PubMed] [Google Scholar]
- Buenrostro JD, Giresi PG, Zaba LC, Chang HY, and Greenleaf WJ (2013). Transposition of native chromatin for fast and sensitive epigenomic profiling of open chromatin, DNA-binding proteins and nucleosome position. Nat Methods 10, 1213–1218. [DOI] [PMC free article] [PubMed] [Google Scholar]
- Castellini L, Moon EJ, Razorenova OV, Krieg AJ, von Eyben R, and Giaccia AJ (2017). KDM4B/JMJD2B is a p53 target gene that modulates the amplitude of p53 response after DNA damage. Nucleic Acids Res 45, 3674–3692. [DOI] [PMC free article] [PubMed] [Google Scholar]
- Chan SP, and Slack FJ (2006). microRNA-mediated silencing inside P-bodies. RNA Biol 3, 97–100. [DOI] [PubMed] [Google Scholar]
- Chenoweth JG, and Tesar PJ (2010). Isolation and maintenance of mouse epiblast stem cells. Methods Mol Biol 636, 25–44. [DOI] [PubMed] [Google Scholar]
- Chung YG, Matoba S, Liu Y, Eum JH, Lu F, Jiang W, Lee JE, Sepilian V, Cha KY, Lee DR, et al. (2015). Histone Demethylase Expression Enhances Human Somatic Cell Nuclear Transfer Efficiency and Promotes Derivation of Pluripotent Stem Cells. Cell stem cell 17, 758–766. [DOI] [PubMed] [Google Scholar]
- Cirera-Salinas D, Yu J, Bodak M, Ngondo RP, Herbert KM, and Ciaudo C (2017). Noncanonical function of DGCR8 controls mESC exit from pluripotency. J Cell Biol 216, 355–366. [DOI] [PMC free article] [PubMed] [Google Scholar]
- Cloos PA, Christensen J, Agger K, and Helin K (2008). Erasing the methyl mark: histone demethylases at the center of cellular differentiation and disease. Genes Dev 22, 1115–1140. [DOI] [PMC free article] [PubMed] [Google Scholar]
- Consortium EP (2012). An integrated encyclopedia of DNA elements in the human genome. Nature 489, 57–74. [DOI] [PMC free article] [PubMed] [Google Scholar]
- Conway AE, Van Nostrand EL, Pratt GA, Aigner S, Wilbert ML, Sundararaman B, Freese P, Lambert NJ, Sathe S, Liang TY, et al. (2016). Enhanced CLIP Uncovers IMP Protein-RNA Targets in Human Pluripotent Stem Cells Important for Cell Adhesion and Survival. Cell Rep 15, 666–679. [DOI] [PMC free article] [PubMed] [Google Scholar]
- Das PP, Shao Z, Beyaz S, Apostolou E, Pinello L, Angeles AL, O’Brien K, Atsma JM, Fujiwara Y, Nguyen M, et al. (2014). Distinct and combinatorial functions of Jmjd2b/Kdm4b and Jmjd2c/Kdm4c in mouse embryonic stem cell identity. Mol Cell 53, 32–48. [DOI] [PMC free article] [PubMed] [Google Scholar]
- Decker CJ, and Parker R (2012). P-bodies and stress granules: possible roles in the control of translation and mRNA degradation. Cold Spring Harb Perspect Biol 4, a012286. [DOI] [PMC free article] [PubMed] [Google Scholar]
- Di Stefano B, Sardina JL, van Oevelen C, Collombet S, Kallin EM, Vicent GP, Lu J, Thieffry D, Beato M, and Graf T (2014). C/EBPalpha poises B cells for rapid reprogramming into induced pluripotent stem cells. Nature 506, 235–239. [DOI] [PubMed] [Google Scholar]
- Di Stefano B, Ueda M, Sabri S, Brumbaugh J, Huebner AJ, Sahakyan A, Clement K, Clowers KJ, Erickson AR, Shioda K, et al. (2018). Reduced MEK inhibition preserves genomic stability in naive human embryonic stem cells. Nat Methods 15, 732–740. [DOI] [PMC free article] [PubMed] [Google Scholar]
- Dobin A, Davis CA, Schlesinger F, Drenkow J, Zaleski C, Jha S, Batut P, Chaisson M, and Gingeras TR (2013). STAR: ultrafast universal RNA-seq aligner. Bioinformatics 29, 15–21. [DOI] [PMC free article] [PubMed] [Google Scholar]
- Elias JE, and Gygi SP (2007). Target-decoy search strategy for increased confidence in large-scale protein identifications by mass spectrometry. Nat Methods 4, 207–214. [DOI] [PubMed] [Google Scholar]
- Federation AJ, Bradner JE, and Meissner A (2014). The use of small molecules in somatic-cell reprogramming. Trends Cell Biol 24, 179–187. [DOI] [PMC free article] [PubMed] [Google Scholar]
- Feng L, Shi L, Lu YF, Wang B, Tang T, Fu WM, He W, Li G, and Zhang JF (2018). Linc-ROR Promotes Osteogenic Differentiation of Mesenchymal Stem Cells by Functioning as a Competing Endogenous RNA for miR-138 and miR-145. Mol Ther Nucleic Acids 11, 345–353. [DOI] [PMC free article] [PubMed] [Google Scholar]
- Flynn RA, and Chang HY (2014). Long noncoding RNAs in cell-fate programming and reprogramming. Cell stem cell 14, 752–761. [DOI] [PMC free article] [PubMed] [Google Scholar]
- Freimer JW, Hu TJ, and Blelloch R (2018). Decoupling the impact of microRNAs on translational repression versus RNA degradation in embryonic stem cells. Elife 7. [DOI] [PMC free article] [PubMed] [Google Scholar]
- Geula S, Moshitch-Moshkovitz S, Dominissini D, Mansour AA, Kol N, Salmon-Divon M, Hershkovitz V, Peer E, Mor N, Manor YS, et al. (2015). Stem cells. m6A mRNA methylation facilitates resolution of naive pluripotency toward differentiation. Science 347, 1002–1006. [DOI] [PubMed] [Google Scholar]
- Gonzales KA, Liang H, Lim YS, Chan YS, Yeo JC, Tan CP, Gao B, Le B, Tan ZY, Low KY, et al. (2015). Deterministic Restriction on Pluripotent State Dissolution by Cell-Cycle Pathways. Cell 162, 564–579. [DOI] [PubMed] [Google Scholar]
- Greve TS, Judson RL, and Blelloch R (2013). microRNA control of mouse and human pluripotent stem cell behavior. Annual review of cell and developmental biology 29, 213–239. [DOI] [PMC free article] [PubMed] [Google Scholar]
- Guallar D, Bi X, Pardavila JA, Huang X, Saenz C, Shi X, Zhou H, Faiola F, Ding J, Haruehanroengra P, et al. (2018). RNA-dependent chromatin targeting of TET2 for endogenous retrovirus control in pluripotent stem cells. Nat Genet 50, 443–451. [DOI] [PMC free article] [PubMed] [Google Scholar]
- Guallar D, and Wang J (2014). RNA-binding proteins in pluripotency, differentiation, and reprogramming. Front Biol (Beijing) 9, 389–409. [DOI] [PMC free article] [PubMed] [Google Scholar]
- Han H, Irimia M, Ross PJ, Sung HK, Alipanahi B, David L, Golipour A, Gabut M, Michael IP, Nachman EN, et al. (2013). MBNL proteins repress ES-cell-specific alternative splicing and reprogramming. Nature 498, 241–245. [DOI] [PMC free article] [PubMed] [Google Scholar]
- Hockemeyer D, Wang H, Kiani S, Lai CS, Gao Q, Cassady JP, Cost GJ, Zhang L, Santiago Y, Miller JC, et al. (2011). Genetic engineering of human pluripotent cells using TALE nucleases. Nat Biotechnol 29, 731–734. [DOI] [PMC free article] [PubMed] [Google Scholar]
- Hubstenberger A, Courel M, Benard M, Souquere S, Ernoult-Lange M, Chouaib R, Yi Z, Morlot JB, Munier A, Fradet M, et al. (2017). P-Body Purification Reveals the Condensation of Repressed mRNA Regulons. Mol Cell 68, 144–157 e145. [DOI] [PubMed] [Google Scholar]
- Huttlin EL, Jedrychowski MP, Elias JE, Goswami T, Rad R, Beausoleil SA, Villen J, Haas W, Sowa ME, and Gygi SP (2010). A tissue-specific atlas of mouse protein phosphorylation and expression. Cell 143, 1174–1189. [DOI] [PMC free article] [PubMed] [Google Scholar]
- Jangra RK, Yi M, and Lemon SM (2010). DDX6 (Rck/p54) is required for efficient hepatitis C virus replication but not for internal ribosome entry site-directed translation. J Virol 84, 6810–6824. [DOI] [PMC free article] [PubMed] [Google Scholar]
- John S, Sabo PJ, Thurman RE, Sung MH, Biddie SC, Johnson TA, Hager GL, and Stamatoyannopoulos JA (2011). Chromatin accessibility pre-determines glucocorticoid receptor binding patterns. Nat Genet 43, 264–268. [DOI] [PMC free article] [PubMed] [Google Scholar]
- Kalkan T, Bornelov S, Mulas C, Diamanti E, Lohoff T, Ralser M, Middelkamp S, Lombard P, Nichols J, and Smith A (2019). Complementary Activity of ETV5, RBPJ, and TCF3 Drives Formative Transition from Naive Pluripotency. Cell stem cell 24, 785–801 e787. [DOI] [PMC free article] [PubMed] [Google Scholar]
- Kalkan T, and Smith A (2014). Mapping the route from naive pluripotency to lineage specification. Philos Trans R Soc Lond B Biol Sci 369. [DOI] [PMC free article] [PubMed] [Google Scholar]
- Keene JD (2007). RNA regulons: coordination of post-transcriptional events. Nature reviews Genetics 8, 533–543. [DOI] [PubMed] [Google Scholar]
- Kharchenko PV, Tolstorukov MY, and Park PJ (2008). Design and analysis of ChIP-seq experiments for DNA-binding proteins. Nat Biotechnol 26, 1351–1359. [DOI] [PMC free article] [PubMed] [Google Scholar]
- Koo BK, Sasselli V, and Clevers H (2013). Retroviral gene expression control in primary organoid cultures. Curr Protoc Stem Cell Biol 27, Unit 5A 6. [DOI] [PubMed] [Google Scholar]
- Kuleshov MV, Jones MR, Rouillard AD, Fernandez NF, Duan Q, Wang Z, Koplev S, Jenkins SL, Jagodnik KM, Lachmann A, et al. (2016). Enrichr: a comprehensive gene set enrichment analysis web server 2016 update. Nucleic Acids Res 44, W90–97. [DOI] [PMC free article] [PubMed] [Google Scholar]
- Kulkarni M, Ozgur S, and Stoecklin G (2010). On track with P-bodies. Biochem Soc Trans 38, 242–251. [DOI] [PubMed] [Google Scholar]
- Lackford B, Yao C, Charles GM, Weng L, Zheng X, Choi EA, Xie X, Wan J, Xing Y, Freudenberg JM, et al. (2014). Fip1 regulates mRNA alternative polyadenylation to promote stem cell self-renewal. EMBO J 33, 878–889. [DOI] [PMC free article] [PubMed] [Google Scholar]
- Lee HL, Yu B, Deng P, Wang CY, and Hong C (2016). Transforming Growth Factor-beta-Induced KDM4B Promotes Chondrogenic Differentiation of Human Mesenchymal Stem Cells. Stem Cells 34, 711–719. [DOI] [PMC free article] [PubMed] [Google Scholar]
- Leeb M, Dietmann S, Paramor M, Niwa H, and Smith A (2014). Genetic exploration of the exit from self-renewal using haploid embryonic stem cells. Cell stem cell 14, 385–393. [DOI] [PMC free article] [PubMed] [Google Scholar]
- Leonardo TR, Schultheisz HL, Loring JF, and Laurent LC (2012). The functions of microRNAs in pluripotency and reprogramming. Nat Cell Biol 14, 1114–1121. [DOI] [PMC free article] [PubMed] [Google Scholar]
- Li H, and Durbin R (2010). Fast and accurate long-read alignment with Burrows-Wheeler transform. Bioinformatics 26, 589–595. [DOI] [PMC free article] [PubMed] [Google Scholar]
- Li M, Yu JSL, Tilgner K, Ong SH, Koike-Yusa H, and Yusa K (2018). Genome-wide CRISPR-KO Screen Uncovers mTORC1-Mediated Gsk3 Regulation in Naive Pluripotency Maintenance and Dissolution. Cell Rep 24, 489–502. [DOI] [PMC free article] [PubMed] [Google Scholar]
- Loewer S, Cabili MN, Guttman M, Loh YH, Thomas K, Park IH, Garber M, Curran M, Onder T, Agarwal S, et al. (2010). Large intergenic non-coding RNA-RoR modulates reprogramming of human induced pluripotent stem cells. Nat Genet 42, 1113–1117. [DOI] [PMC free article] [PubMed] [Google Scholar]
- Lovci MT, Ghanem D, Marr H, Arnold J, Gee S, Parra M, Liang TY, Stark TJ, Gehman LT, Hoon S, et al. (2013). Rbfox proteins regulate alternative mRNA splicing through evolutionarily conserved RNA bridges. Nat Struct Mol Biol 20, 1434–1442. [DOI] [PMC free article] [PubMed] [Google Scholar]
- Lu X, Goke J, Sachs F, Jacques PE, Liang H, Feng B, Bourque G, Bubulya PA, and Ng HH (2013). SON connects the splicing-regulatory network with pluripotency in human embryonic stem cells. Nat Cell Biol 15, 1141–1152. [DOI] [PMC free article] [PubMed] [Google Scholar]
- Luo Y, Na Z, and Slavoff SA (2018a). P-Bodies: Composition, Properties, and Functions. Biochemistry 57, 2424–2431. [DOI] [PMC free article] [PubMed] [Google Scholar]
- Luo Y, Na Z, and Slavoff SA (2018b). P-Bodies: Composition, Properties, and Functions. Biochemistry. [DOI] [PMC free article] [PubMed] [Google Scholar]
- Mandegar MA, Huebsch N, Frolov EB, Shin E, Truong A, Olvera MP, Chan AH, Miyaoka Y, Holmes K, Spencer CI, et al. (2016). CRISPR Interference Efficiently Induces Specific and Reversible Gene Silencing in Human iPSCs. Cell stem cell 18, 541–553. [DOI] [PMC free article] [PubMed] [Google Scholar]
- Martello G, and Smith A (2014). The nature of embryonic stem cells. Annual review of cell and developmental biology 30, 647–675. [DOI] [PubMed] [Google Scholar]
- Martello G, Sugimoto T, Diamanti E, Joshi A, Hannah R, Ohtsuka S, Gottgens B, Niwa H, and Smith A (2012). Esrrb is a pivotal target of the Gsk3/Tcf3 axis regulating embryonic stem cell self-renewal. Cell stem cell 11, 491–504. [DOI] [PMC free article] [PubMed] [Google Scholar]
- Matoba S, Liu Y, Lu F, Iwabuchi KA, Shen L, Inoue A, and Zhang Y (2014). Embryonic development following somatic cell nuclear transfer impeded by persisting histone methylation. Cell 159, 884–895. [DOI] [PMC free article] [PubMed] [Google Scholar]
- McAlister GC, Huttlin EL, Haas W, Ting L, Jedrychowski MP, Rogers JC, Kuhn K, Pike I, Grothe RA, Blethrow JD, et al. (2012). Increasing the multiplexing capacity of TMTs using reporter ion isotopologues with isobaric masses. Anal Chem 84, 7469–7478. [DOI] [PMC free article] [PubMed] [Google Scholar]
- McAlister GC, Nusinow DP, Jedrychowski MP, Wuhr M, Huttlin EL, Erickson BK, Rad R, Haas W, and Gygi SP (2014). MultiNotch MS3 enables accurate, sensitive, and multiplexed detection of differential expression across cancer cell line proteomes. Anal Chem 86, 7150–7158. [DOI] [PMC free article] [PubMed] [Google Scholar]
- Nicklas S, Okawa S, Hillje AL, Gonzalez-Cano L, Del Sol A, and Schwamborn JC (2015). The RNA helicase DDX6 regulates cell-fate specification in neural stem cells via miRNAs. Nucleic Acids Res 43, 2638–2654. [DOI] [PMC free article] [PubMed] [Google Scholar]
- Palla AR, Piazzolla D, Alcazar N, Canamero M, Grana O, Gomez-Lopez G, Dominguez O, Duenas M, Paramio JM, and Serrano M (2015). The pluripotency factor NANOG promotes the formation of squamous cell carcinomas. Sci Rep 5, 10205. [DOI] [PMC free article] [PubMed] [Google Scholar]
- Parker R, and Sheth U (2007). P bodies and the control of mRNA translation and degradation. Mol Cell 25, 635–646. [DOI] [PubMed] [Google Scholar]
- Patro R, Duggal G, Love MI, Irizarry RA, and Kingsford C (2017). Salmon provides fast and bias-aware quantification of transcript expression. Nat Methods 14, 417–419. [DOI] [PMC free article] [PubMed] [Google Scholar]
- Paulo JA, O’Connell JD, Everley RA, O’Brien J, Gygi MA, and Gygi SP (2016). Quantitative mass spectrometry-based multiplexing compares the abundance of 5000 S. cerevisiae proteins across 10 carbon sources. J Proteomics 148, 85–93. [DOI] [PMC free article] [PubMed] [Google Scholar]
- Perino M, and Veenstra GJ (2016). Chromatin Control of Developmental Dynamics and Plasticity. Dev Cell 38, 610–620. [DOI] [PubMed] [Google Scholar]
- Petropoulos S, Edsgard D, Reinius B, Deng Q, Panula SP, Codeluppi S, Plaza Reyes A, Linnarsson S, Sandberg R, and Lanner F (2016). Single-Cell RNA-Seq Reveals Lineage and X Chromosome Dynamics in Human Preimplantation Embryos. Cell 165, 1012–1026. [DOI] [PMC free article] [PubMed] [Google Scholar]
- Qi MY, Wang ZZ, Zhang Z, Shao Q, Zeng A, Li XQ, Li WQ, Wang C, Tian FJ, Li Q, et al. (2012). AU-rich-element-dependent translation repression requires the cooperation of tristetraprolin and RCK/P54. Mol Cell Biol 32, 913–928. [DOI] [PMC free article] [PubMed] [Google Scholar]
- Robinson MD, McCarthy DJ, and Smyth GK (2010). edgeR: a Bioconductor package for differential expression analysis of digital gene expression data. Bioinformatics 26, 139–140. [DOI] [PMC free article] [PubMed] [Google Scholar]
- Sato T, Vries RG, Snippert HJ, van de Wetering M, Barker N, Stange DE, van Es JH, Abo A, Kujala P, Peters PJ, et al. (2009). Single Lgr5 stem cells build crypt-villus structures in vitro without a mesenchymal niche. Nature 459, 262–265. [DOI] [PubMed] [Google Scholar]
- Sloan KE, and Bohnsack MT (2018). Unravelling the Mechanisms of RNA Helicase Regulation. Trends Biochem Sci 43, 237–250. [DOI] [PubMed] [Google Scholar]
- Smith A (2017). Formative pluripotency: the executive phase in a developmental continuum. Development 144, 365–373. [DOI] [PMC free article] [PubMed] [Google Scholar]
- Standart N, and Weil D (2018). P-Bodies: Cytosolic Droplets for Coordinated mRNA Storage. Trends Genet 34, 612–626. [DOI] [PubMed] [Google Scholar]
- Theunissen TW, Friedli M, He Y, Planet E, O’Neil RC, Markoulaki S, Pontis J, Wang H, Iouranova A, Imbeault M, et al. (2016). Molecular Criteria for Defining the Naive Human Pluripotent State. Cell stem cell 19, 502–515. [DOI] [PMC free article] [PubMed] [Google Scholar]
- Theunissen TW, Powell BE, Wang H, Mitalipova M, Faddah DA, Reddy J, Fan ZP, Maetzel D, Ganz K, Shi L, et al. (2014). Systematic identification of culture conditions for induction and maintenance of naive human pluripotency. Cell stem cell 15, 471–487. [DOI] [PMC free article] [PubMed] [Google Scholar]
- Tian H, Biehs B, Warming S, Leong KG, Rangell L, Klein OD, and de Sauvage FJ (2011). A reserve stem cell population in small intestine renders Lgr5-positive cells dispensable. Nature 478, 255–259. [DOI] [PMC free article] [PubMed] [Google Scholar]
- Tian TV, Di Stefano B, Stik G, Vila-Casadesus M, Sardina JL, Vidal E, Dasti A, Segura-Morales C, De Andres-Aguayo L, Gomez A, et al. (2019). Whsc1 links pluripotency exit with mesendoderm specification. Nat Cell Biol 21, 824–834. [DOI] [PMC free article] [PubMed] [Google Scholar]
- Van Nostrand EL, Gelboin-Burkhart C, Wang R, Pratt GA, Blue SM, and Yeo GW (2016a). CRISPR/Cas9-mediated integration enables TAG-eCLIP of endogenously tagged RNA binding proteins. Methods. [DOI] [PMC free article] [PubMed] [Google Scholar]
- Van Nostrand EL, Nguyen TB, Gelboin-Burkhart C, Wang R, Blue SM, Pratt GA, Louie AL, and Yeo GW (2017). Robust, Cost-Effective Profiling of RNA Binding Protein Targets with Single-end Enhanced Crosslinking and Immunoprecipitation (seCLIP). Methods Mol Biol 1648, 177–200. [DOI] [PMC free article] [PubMed] [Google Scholar]
- Van Nostrand EL, Pratt GA, Shishkin AA, Gelboin-Burkhart C, Fang MY, Sundararaman B, Blue SM, Nguyen TB, Surka C, Elkins K, et al. (2016b). Robust transcriptome-wide discovery of RNA-binding protein binding sites with enhanced CLIP (eCLIP). Nat Methods 13, 508–514. [DOI] [PMC free article] [PubMed] [Google Scholar]
- Waghray A, Saiz N, Jayaprakash AD, Freire AG, Papatsenko D, Pereira CF, Lee DF, Brosh R, Chang B, Darr H, et al. (2015). Tbx3 Controls Dppa3 Levels and Exit from Pluripotency toward Mesoderm. Stem cell reports 5, 97–110. [DOI] [PMC free article] [PubMed] [Google Scholar]
- Wang Y, Arribas-Layton M, Chen Y, Lykke-Andersen J, and Sen GL (2015). DDX6 Orchestrates Mammalian Progenitor Function through the mRNA Degradation and Translation Pathways. Mol Cell 60, 118–130. [DOI] [PMC free article] [PubMed] [Google Scholar]
- Wang Y, Xu Z, Jiang J, Xu C, Kang J, Xiao L, Wu M, Xiong J, Guo X, and Liu H (2013). Endogenous miRNA sponge lincRNA-RoR regulates Oct4, Nanog, and Sox2 in human embryonic stem cell self-renewal. Dev Cell 25, 69–80. [DOI] [PubMed] [Google Scholar]
- Weinberger L, Ayyash M, Novershtern N, and Hanna JH (2016). Dynamic stem cell states: naive to primed pluripotency in rodents and humans. Nature reviews Molecular cell biology 17, 155–169. [DOI] [PubMed] [Google Scholar]
- Wilbert ML, Huelga SC, Kapeli K, Stark TJ, Liang TY, Chen SX, Yan BY, Nathanson JL, Hutt KR, Lovci MT, et al. (2012). LIN28 binds messenger RNAs at GGAGA motifs and regulates splicing factor abundance. Mol Cell 48, 195–206. [DOI] [PMC free article] [PubMed] [Google Scholar]
- Wray J, Kalkan T, Gomez-Lopez S, Eckardt D, Cook A, Kemler R, and Smith A (2011). Inhibition of glycogen synthase kinase-3 alleviates Tcf3 repression of the pluripotency network and increases embryonic stem cell resistance to differentiation. Nat Cell Biol 13, 838–845. [DOI] [PMC free article] [PubMed] [Google Scholar]
- Wu J, and Izpisua Belmonte JC (2016). Stem Cells: A Renaissance in Human Biology Research. Cell 165, 1572–1585. [DOI] [PubMed] [Google Scholar]
- Xi Y, and Li W (2009). BSMAP: whole genome bisulfite sequence MAPping program. BMC bioinformatics 10, 232. [DOI] [PMC free article] [PubMed] [Google Scholar]
- Yang SH, Kalkan T, Morrisroe C, Smith A, and Sharrocks AD (2012). A genome-wide RNAi screen reveals MAP kinase phosphatases as key ERK pathway regulators during embryonic stem cell differentiation. PLoS Genet 8, e1003112. [DOI] [PMC free article] [PubMed] [Google Scholar]
- Ye J, and Blelloch R (2014). Regulation of pluripotency by RNA binding proteins. Cell stem cell 15, 271–280. [DOI] [PMC free article] [PubMed] [Google Scholar]
- Yeo GW, Coufal NG, Liang TY, Peng GE, Fu XD, and Gage FH (2009). An RNA code for the FOX2 splicing regulator revealed by mapping RNA-protein interactions in stem cells. Nat Struct Mol Biol 16, 130–137. [DOI] [PMC free article] [PubMed] [Google Scholar]
- Zhu J, Adli M, Zou JY, Verstappen G, Coyne M, Zhang X, Durham T, Miri M, Deshpande V, De Jager PL, et al. (2013). Genome-wide chromatin state transitions associated with developmental and environmental cues. Cell 152, 642–654. [DOI] [PMC free article] [PubMed] [Google Scholar]
Associated Data
This section collects any data citations, data availability statements, or supplementary materials included in this article.
Supplementary Materials
Table S1. DDX6 interactors identified by IP-mass spectrometry in hiPSCs, Related to Figure 4
Table S2. Protein expression levels in Control and DDX6 depleted hiPSCs, Related to Figure 4
Table S3. DDX6 target mRNAs identified by eCLIP-seq in hiPSCs, Related to Figure 5
Table S4. DDX6 target mRNAs identified by eCLIP-seq in human myoblasts, Related to Figure 5
Data Availability Statement
The eCLIP-seq, ATAC-seq, ChIP-seq, RRBS, Polysome profiling and RNA-seq data generated during this study are available at GSE112479.
The human ESC exit screening data were obtained from (Gonzales et al., 2015). Mouse ESC exit screening data were obtained from (Li et al., 2018; Yang et al., 2012). The ChIP-seq data for human myoblasts used for comparison with the ATAC-seq data in Figure S7B were from the ENCODE project (Consortium, 2012).