Abstract
Purpose
Obesity is associated with alterations in appetite, gastrointestinal hormone levels and excessive fat mass. We previously published a double-blind, placebo-controlled, randomized, 16-week trial on effects of once-daily glucagon-like peptide-1 (GLP-1) analog, liraglutide on weight, satiation, and gastric functions in obese volunteers. The aim of this substudy is to compare to placebo the effects of liraglutide on appetite, taste preference, regional body fat stores, and anthropometric measurements.
Methods
Forty obese adults received standard instruction for weight management, monthly behavioral intervention utilizing motivational interviews, and 16-week treatment of once-daily liraglutide (escalated to 3 mg SQ daily). At baseline and 16 weeks, the following were measured: appetite and taste preferences rated every 30 min for 5 h after ingesting 300 mL Ensure®; maximal tolerated volume (MTV) with a nutrient drink test; fasting and postprandial bioactive GLP-1 (7–36) and peptide YY (PYY) levels; total and regional body fat with dual-energy X-ray absorptiometry, and waist and hip circumference.
Results
Thirty-five participants (17 liraglutide; 18 placebo) completed the trial. Compared to placebo group, liraglutide group had significant reductions in MTV; prospective food consumption score; desire to eat something sweet, salty, savory or fatty; and an increase in perceived fullness. Postprandial plasma levels of GLP-1 decreased and PYY levels increased with liraglutide relative to baseline. Significant reductions in total body, trunk, and upper and lower body fat without reduction in lean body mass were observed.
Conclusion
Liraglutide 3 mg SQ modulates appetite, taste preference, gut hormones, and regional body fat stores in adults with obesity without reduction in lean body mass.
Keywords: liraglutide, obesity, GLP-1 analog, appetite, taste preference, body fat
Obesity is associated with increased appetite, altered levels of gastrointestinal (GI) hormones, increased fat mass, and dysregulated satiety and satiation mechanisms (1), which are the targets of weight loss drugs. Palatability, food preference, and reward functions vary based on genetic and nongenetic factors and are thought to play a role in weight gain. It has previously been demonstrated that there is an association between obesity and preference for energy-dense foods (2). Cravings experienced for different types of food are associated with obesity (3,4) and may predict response to obesity management (5,6). Glucagon-like peptide-1 (GLP-1) analogs or receptor agonists induce weight loss through multiple mechanisms including a possible direct central effect on appetite centers in the brain (7), such as through activation of a GLP-1 receptor-expressing glutamatergic neural network by liraglutide, a long-acting GLP-1 analog. GLP-1, an incretin hormone, plays a role in the control of energy intake, delays gastric emptying, and inhibits glucagon secretion (8). Peptide YY (PYY) 3–36 reduces appetite and food intake in obese subjects and reduced levels have been reported in obesity (9).
Regional fat distribution has health implications that may be more powerful than those associated with total body fat (TBF) (10) or body mass index (BMI). Thus, when compared to TBF or BMI, upper body adiposity or excess fat in the abdominal/android region has a stronger association with negative health outcomes (11), namely, insulin resistance, cardiovascular disease, and mortality (12). Conversely, less body fat in the android/waist region is considered to be protective against these health risks (10). Body fat distribution is influenced by a complex interplay of genetic, neuroendocrine, and environmental factors (11). Liraglutide treatment is associated with improved metabolic (eg, progression to type 2 diabetes) and cardiovascular outcomes or associated death from cardiovascular causes, myocardial infarction, and nonfatal stroke (13). Prior studies also suggested that liraglutide may have an effect on body fat composition and its distribution either as monotherapy or combined with the biguanide metformin (14). Thus, while the effect of liraglutide on body fat composition is established, the association of changes in appetite, food preferences, and GI hormones with body fat distribution and lean body mass in the context of weight loss remain poorly understood.
The present substudy was part of a larger clinical trial on the effect of liraglutide on gastric motor functions and associated weight loss in management of obesity (15). The hypothesis of this substudy is that, compared to placebo, treatment with liraglutide daily for 16 weeks reduces appetite, modifies taste preference and GI hormones (specifically GLP-1 and PYY), and reduces percentage upper body (android) fat.
Materials and Methods
Study design
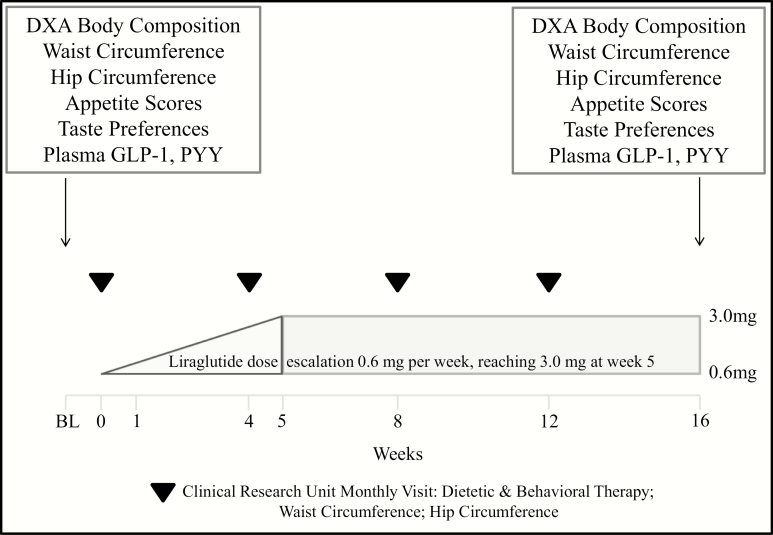
This was a substudy of a single-center, double-blind, placebo-controlled, parallel group, randomized, 16-week trial of once-daily liraglutide (escalated by 0.6 mg per week to a maintenance dose of 3.0 mg SQ daily) or placebo (ClinicalTrials.gov #NCT02647944) (15). All participants underwent screening visits, baseline measurements of GI, behavioral, and psychological factors and follow-up visits. The details of the clinical trial are published elsewhere (15).
Participants
Otherwise healthy overweight adults (BMI ≥ 27 kg/m2) and adults with obesity (BMI > 30 kg/m2), 18–65 years of age, residing within 125 miles of Mayo Clinic, Rochester, MN, USA were recruited. The study was approved by the Mayo Clinic Institutional Research Review Board (IRB #15-001783; August 15, 2015), and written informed consent was obtained from all participants. Screening visits included a physician’s evaluation for study eligibility, and questionnaires to screen for psychiatric symptoms, alcohol use disorders, eating disorders, and intake of medications.
Liraglutide
Liraglutide, an analog derivative with 97% homology to the human gut-derived incretin GLP-1, is a long-acting GLP-1 receptor agonist. The drug was purchased or provided by Novo Nordisk, Inc., Plainsboro, NJ, USA (SAXENDA®). The FDA-recommended dose escalation was used, starting at 0.6 mg subcutaneously daily, increased weekly by 0.6mg until maintenance dose of 3.0 mg daily is reached.
Standardization of dietetic and behavioral advice
All participants received a standard written instruction manual for behavioral weight management (16), and participated in brief (15–20 min) standardized behavioral and dietetic 1-on-1 counseling sessions at baseline and at weeks 4, 8, and 12, with a behavioral study interventionist with expertise in obesity management. Motivational interviewing strategies were used to teach participants various weight management behavioral skills, such as building their confidence for living a healthy lifestyle.
Protocol for the substudy
Appetite and taste preference scores, hormone levels, and body composition were assessed at baseline and at 16 weeks, and anthropometric measurements were obtained at baseline and then monthly (Fig. 1). More details are available in the original study report (15).
Figure 1.
Study protocol.
Appetite scores and taste preference
One assessment of appetite (satiation) was based on a standardized nutrient drink test, which measures satiation as the MTV (17). Participants ingested Ensure® (1 kcal/mL, 11% fat, 73% carbohydrate, 16% protein; Abbott Laboratories, Lake Bluff, IL, USA) at a constant rate of 30 mL/min to measure MTV. Participants record their sensations every 5 minutes using a numerical scale from 0 to 5, with level 0 being no symptoms, level 3 corresponding to fullness sensation after a typical meal and level 5 corresponding to the maximal tolerated volume (maximum or unbearable fullness/satiation). Nutrient intake is stopped when subjects reach the score of 5. The nutrient drink volume (and hence calorie intake) needed to achieve maximum satiation is recorded.
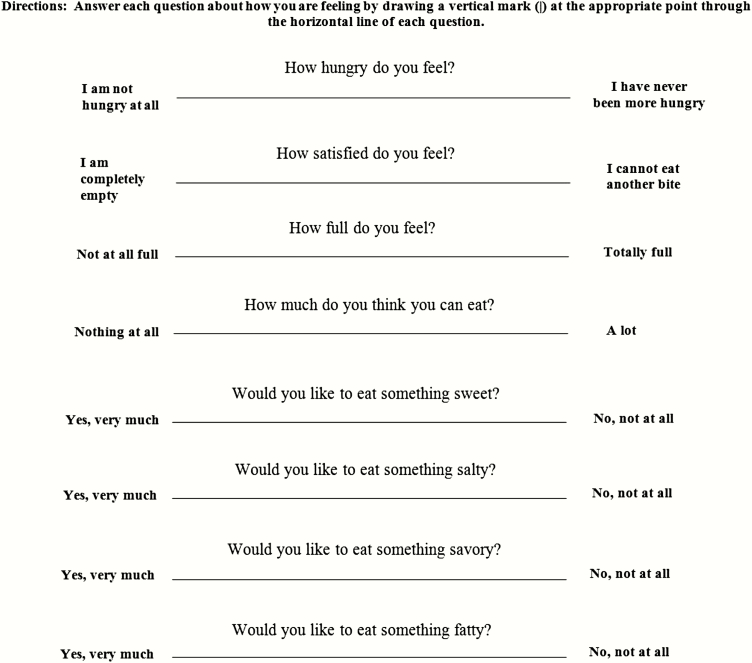
On a separate day, another assessment of appetite consisted of ingestion of a standard liquid breakfast (300 mL Ensure® 1 kcal/mL) as part of a gastric volume test. Ratings of appetite were obtained every 30 min between ingestion of Ensure® and the start of a subsequent meal. Appetite parameters were recorded using visual analog scales (VAS), as described by Flint and colleagues in 2000 (18). The VAS, 100 mm in length with words anchored at each end expressing the most positive and the most negative rating, was used to assess hunger, satiety, fullness, and prospective food consumption. The VAS was also used to assess the desire for different food types, namely the desire to eat something fatty, salty, sweet, or savory (Fig. 2). Overall appetite score was calculated as the average of the four individual appetite parameter scores: Overall appetite score = (satiety + fullness + (100 – prospective food consumption) + (100 – hunger))/4. Area under the curve (AUC)0-300 min for each parameter related to appetite was calculated for each individual participant.
Figure 2.
Appetite and taste preference Visual Analog Scale form.
Measurement of plasma gastrointestinal hormones
Plasma levels of GI hormones were assessed during fasting, and at 15, 45, and 90 min postprandially, with postprandial area under the curve (AUC0-90 min) as primary endpoint. Bioactive GLP-1 (7–36) levels were measured (pmol/L) using high-sensitive quantitative two-site enzyme-linked immunosorbent assay (ELISA) from Millipore Research, Inc. (St. Charles, MO, USA). This GLP-1 assay is specific for endogenous GLP-1 and does not cross-react with liraglutide. Human PYY was quantified using the Human Peptide YY double antibody radioimmunoassay kit from Millipore Research, Inc. (St. Louis, MO, USA).
Body composition
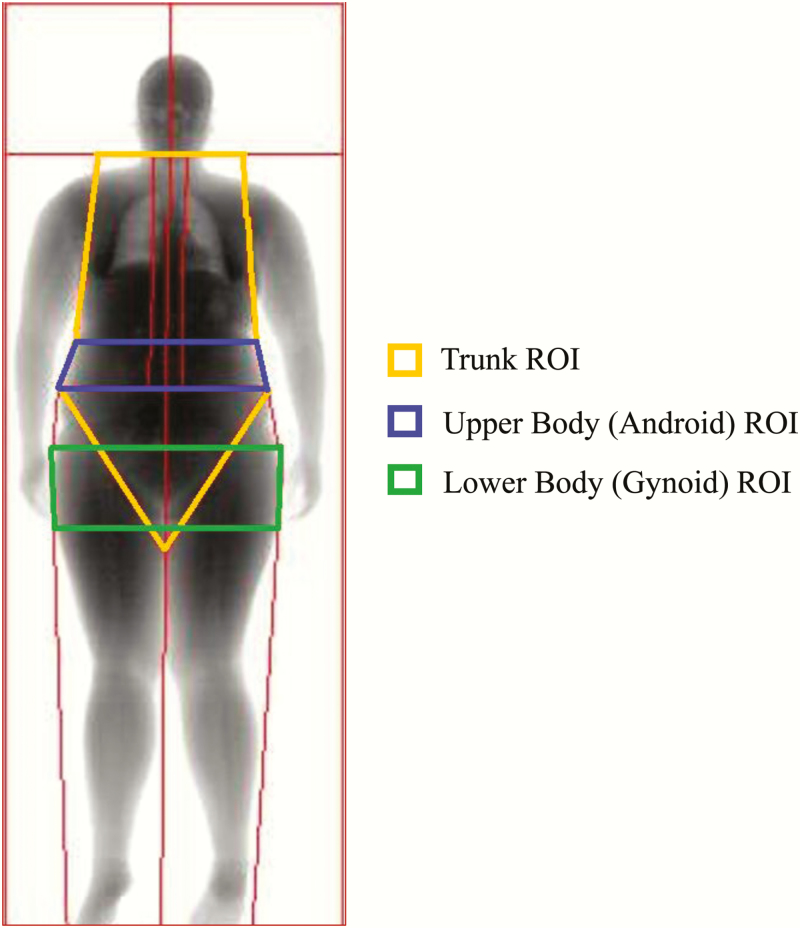
Body composition was determined at baseline and at 16 weeks of treatment via dual-energy X-ray absorptiometry (DXA) technology using a Lunar iDXA (GE Healthcare, Madison, WI, USA). A research support technician with Limited Scope X-ray Operator certification (State of MN) performed full body scans. Scans were analyzed with enCORE software (version 15.0; GE Healthcare). No hardware or software changes were made during the trial. Participants wore light clothing and removed all metal jewelry and other materials that could interfere with the X-ray beam. Quality control was performed daily before scanning the first participant using a phantom. The study technician analyzed all scans in an identical manner and was blind to group allocation. The Lunar iDXA is equipped for visceral and subcutaneous fat measurement. Standard DXA regions of interest (ROI) including the upper body (android) and trunk regions (which are associated with risk of chronic disease), the lower body region (gynoid, prominent in women) and TBF were assessed. The enCORE software produced images with automatically demarcated regional boundaries that were adjusted by the trained technician for every participant (Fig. 3). The trunk ROI is everything but the head, arms, and legs. It includes the neck, chest, abdominal, and pelvic areas with its upper boundary being at the head cut (immediately below the chin) and its lower boundary at the brim of the pelvic triangle (pelvis cut). The upper body or android ROI is the area between the ribs and the pelvis with its lower boundary at the pelvis cut and its upper boundary above the pelvis cut by 20% of the distance between the pelvis and neck cuts. Its lateral boundaries are the arm cuts. It is totally enclosed by the trunk region. The lower body or gynoid ROI includes the hips and upper thighs. The upper boundary of the gynoid region is located below the pelvis cut line, at a distance of 1.5 times the height of the upper body ROI. The lower boundary of the gynoid ROI is located at a distance 2 times the height of the android ROI, and this is close to the apex of the pelvic triangle. Its lateral boundaries are the outer leg cuts. The gynoid ROI overlaps both the leg and trunk regions (Fig. 3).
Figure 3.
Sample DXA body composition scan generated by enCORE software. This image represents the baseline full body DXA scan obtained for a 22-year-old female participant with a BMI of 33.6 kg/m2. Standard regions of interest (ROI) that were assessed by DXA: upper body (android) and trunk regions (associated with risk of chronic disease); lower body (gynoid) region. ROI boundaries in this image were highlighted by study staff.
Anthropometric measurements
Baseline and monthly measurements were taken of height, weight, waist circumference, hip circumference, and waist-to-hip ratio (WHR). Measurements were obtained by Clinical Research Trials Unit nurses and study physicians. This study compared baseline and 16-week measurements.
Safety, tolerability and adverse events
Participants were seen by the study physicians and nurses for a physical exam, vital signs, fasting blood glucose, and adverse event assessment at baseline and then at weeks 2, 3, and 4 (dose escalation visits) and at weeks 8, 12, and 16 (follow-up visits).
Statistical analyses
Endpoints.
For this substudy, the following parameters were the endpoints for analysis during the 16-week treatment period: appetite ratings; taste preference; GLP-1 and PYY levels; changes in percentage fat in upper body, lower body, trunk, and total body; changes in total body weight and lean body mass; and changes in waist circumference and WHR.
Analyses.
We analyzed the effects of liraglutide or placebo at 16 weeks compared to baseline, on ratings of appetite, taste preference, GLP-1 and PYY levels, percentage regional body fat, total body weight, lean body mass, waist circumference, and WHR using analysis of covariance (ANCOVA) with the corresponding baseline measurement as a covariate or Wilcoxon rank sum test. Data in the manuscript are summarized as median and interquartile range (IQR), unless otherwise stated. For each missing data value, we imputed the average value for all patients in the study and reduced the degrees of freedom by one for each data value imputed for that endpoint.
All authors had access to the study data and reviewed and approved the final manuscript.
Role of the funding source
The funding source had no involvement in the study design, in collection, analysis, and interpretation of the data, in writing the report, or in the decision to submit the paper for publication. The corresponding author had full access to all the data in the study and takes responsibility for the integrity of the data, the accuracy of the data analysis, and the decision to submit for publication.
Results
Participants
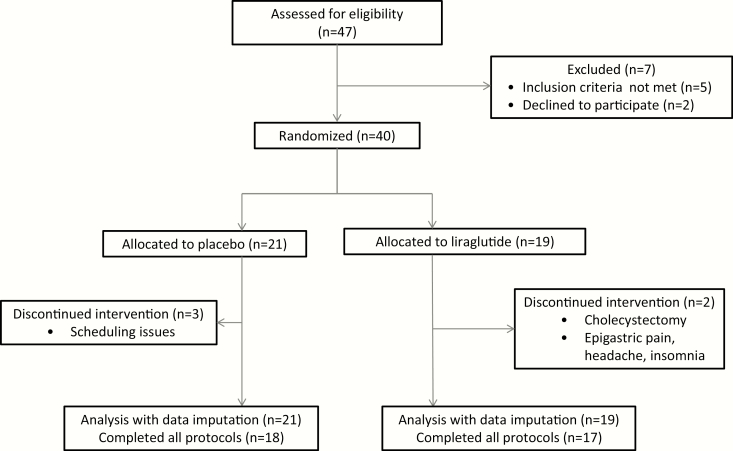
The patient disposition is detailed elsewhere (15) and the CONSORT flow chart from the original trial is included as Fig. 4.
Figure 4.
CONSORT flow chart.
There were no significant differences between the groups in baseline age, sex distribution, and BMI (Table 1).
Table 1.
Group Demographics and Comparison of Effects of Liraglutide and Placebo on Appetite Measures
| Baseline Demographics | Liraglutide 3.0 mg | Placebo | |
|---|---|---|---|
| Number randomized (Female) | 19 (18) | 21 (18) | |
| Age, years | 42 (32, 51) | 37 (26, 51) | |
| Baseline BMI, kg/m2 | 37.2 (33.6, 41.0) | 34.6 (33.4, 38.9) | |
| Appetite Measures | Liraglutide, 3.0 mg | Placebo | P-value |
| Baseline satiation (MTV), mL | 1185.0 (829.5, 1282.0) | 1185.0 (948.0, 1422.0) | |
| Satiation MTV post-treatment, mL | 750.0 (651.0, 908.0) | 1126.0 (944.0, 1185.0) | 0.054a |
| Δ 16wks-BL VAS hunger score AUC0-300 min | -3150.0 (-6037.0, 675.0) | 1290.0 (-4907.0, 5261.5) | 0.12 |
| Δ 16wks-BL VAS satiety score AUC0-300 min | 4425.0 (-1080.0, 6128.0) | 1137.0 (-1417.5, 4803.0) | 0.23 |
| Δ 16wks-BL VAS fullness score AUC0-300 min | 4065.0 (1513.0, 6870.0) | 1650.0 (-3352.5, 3367.5) | 0.02 |
| Δ 16wks-BL VAS prospective food consumption score AUC0-300 min | -4461.0 (-7560.0, -460.0) | 420.0 (-3945.0, 3838.5) | 0.03 |
| Δ 16wks-BL OAS score AUC0-300 min | 3536.0 (726.0, 6088.0) | 53.0 (-2075.5, 3847.0) | 0.08 |
| Δ 16wks-BL VAS sweet taste score AUC0-300 min | 3360.0 (-465.0, 6120.0) | -1245.0 (-4636.0, 510.0) | 0.02 |
| Δ 16wks-BL VAS salty taste score AUC0-300 min | 5235.0 (-230.0, 9705.0) | -2565.0 (-6053.5, 1027.5) | 0.005 |
| Δ 16wks-BL VAS savory taste score AUC0-300 min | 3165.0 (-1830.0, 6735.0) | -2580.0 (-7830.0, 795.0) | 0.006 |
| Δ 16wks-BL VAS fatty taste score AUC0-300 min | 6000.0 (2614.0, 12975.0) | -1350.0 (-4852.5, 4177.5) | 0.002 |
Appetite data are listed following the order of questions in the questionnaire (Fig. 2). Increase in OAS indicates reduction in appetite. Data are median (interquartile range). Intention-to-treat analysis was used to analyze appetite. P-values represent Wilcoxon’s rank sum test. Increase in OAS indicates reduction in appetite.
Abbreviations: MTV, maximal tolerated volume; OAS, overall appetite score = [satiety + fullness + (100 –hunger) + (100 – prospective food consumption)]/4;VAS, visual analog scale.
aAnalysis by analysis of covariance using baseline MTV as co-variate.
Overall summary of results
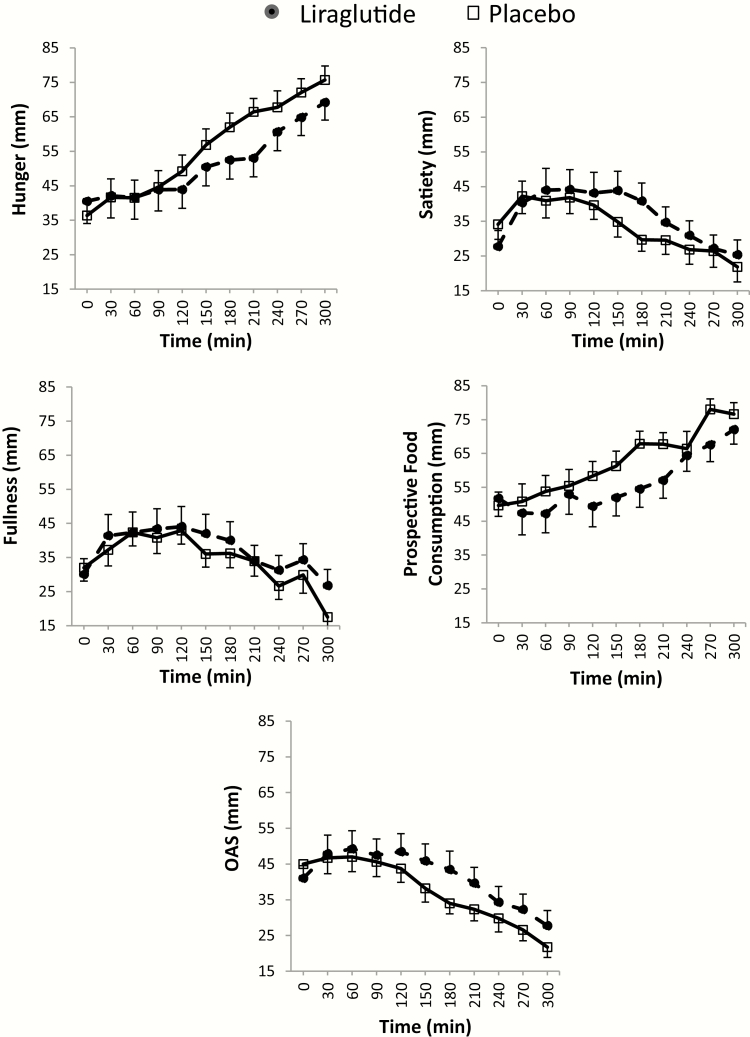
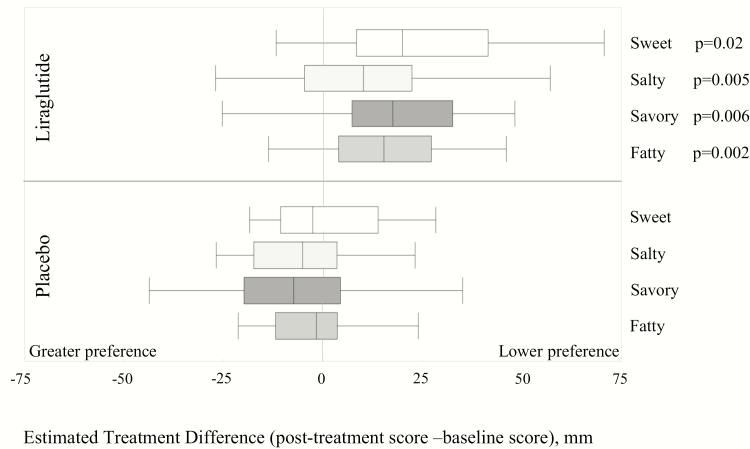
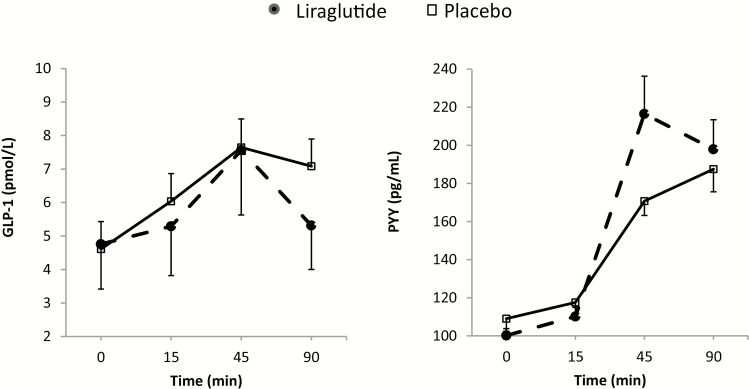
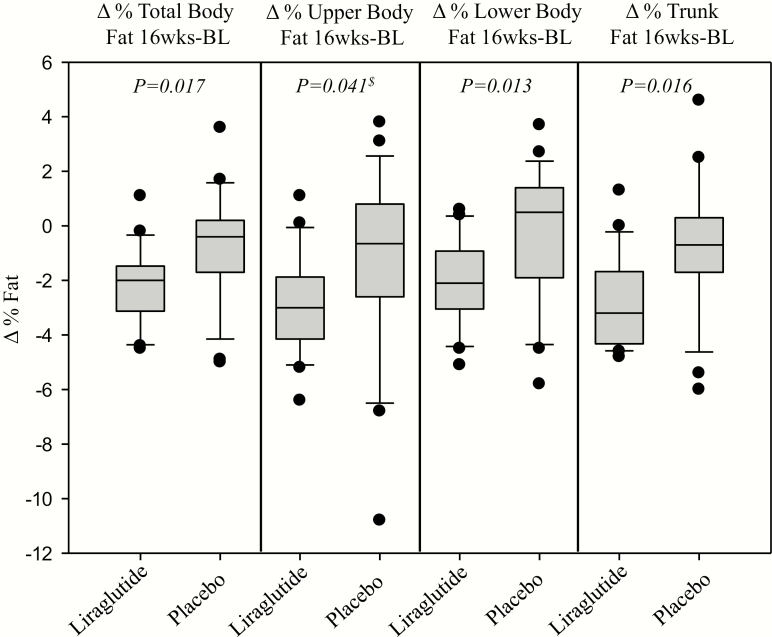
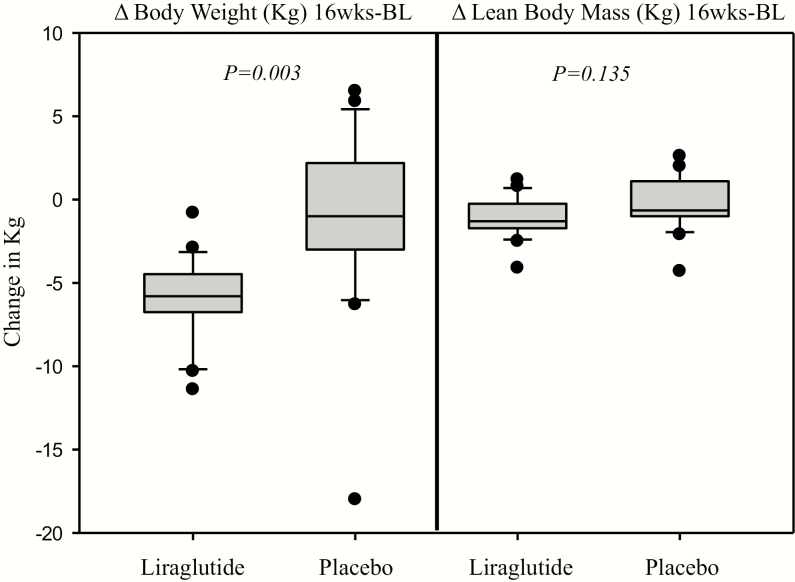
Thirty-five participants (17 liraglutide; 18 placebo) completed 16 weeks of treatment. As shown in Table 1 and Figs. 5 and 6, study participants in the liraglutide group demonstrated significant reductions in MTV; prospective food consumption score; and the desire to eat something sweet, salty, savory or fatty; and an increase in perceived fullness. A significant decrease in postprandial plasma GLP-1 levels and an increase in postprandial PYY levels were observed in this group (Table 2; Fig. 7). Percentage TBF, upper body fat, lower body fat, and trunk fat were significantly reduced in the liraglutide group compared to the placebo group (Table 3; Fig. 8). Additionally, total body weight was significantly reduced in the liraglutide group at 16 weeks compared to placebo with no significant difference in the change in lean body mass between the 2 groups (Table 3; Fig. 9). Changes in hip circumference, waist circumference, and WHR were not significant (Table 3).
Figure 5.
Appetite ratings at 16 weeks in the two groups (assessed by visual analog scale, Fig. 2) following the ingestion of a standard liquid breakfast. For each timepoint (0–300 min), average score (± standard error of the mean) of all participants per group was obtained for this figure. AUC0-300 min for each parameter and statistical analysis results can be found in Table 1.
Abbreviations: OAS, overall appetite score = [satiety + fullness + (100 – hunger) + (100 – prospective food consumption)]/4.
Figure 6.
Effect of liraglutide on taste preference compared to placebo. The box plots represent median taste scores for each group. For each individual participant, average score of all timepoints (0–300 min) was obtained for this figure. A higher value on the VAS indicates lower preference for the specified taste (Fig. 2). P-values reflect Wilcoxon’s Rank Sum analysis of the area under the curve.
Abbreviation: ETD, estimated treatment difference.
Table 2.
Comparison of effects of liraglutide and placebo on GI hormones
| GI Hormone Levels | Liraglutide, 3.0 mg | Placebo | P-value |
|---|---|---|---|
| FASTING | |||
| Baseline fasting plasma GLP-1, pmol/L | 6.4 (3.7, 10) | 3 (3, 9.4) | |
| Δ 16wks-BL fasting plasma GLP-1, pmol/L | –3.35 (–5.44, –1.53) | –0.56 (–3.08, 2.09) | 0.01 |
| Baseline fasting PYY plasma level, pg/mL | 77 (67, 99) | 92 (74.5, 143) | |
| Δ 16wks-BL fasting PYY plasma level, pg/mL | 15 (–5, 36) | –4 (–13.5, 28.5) | 0.32 |
| POSTPRANDIAL (PP) | |||
| Baseline peak PP plasma GLP-1, pmol/L | 23.32 (17, 32) | 20 (12.5, 28.5) | |
| Δ 16wks-BL peak PP plasma GLP-1, pmol/L | –17.26 (–27.85, –13.41) | –10.65 (–19.08, –6.62) | 0.06 |
| Baseline PP GLP-1 AUC0-90 min | 1542.75 (1049.25, 1859.4) | 1122.75 (879.75, 1839.75) | |
| Δ 16wks-BL PP GLP-1 AUC0-90 min | –1148.4 (–1405.05, –820.57) | –533.98 (–1030.04, –289.87) | 0.01 |
| Baseline peak PP PYY level, pg/mL | 154 (98, 194) | 176 (129, 237.5) | |
| Δ16wks-BL peak PP PYY level, pg/mL | 64 (5, 99) | 11 (–55.5, 49.5) | 0.03 |
| Baseline PP PYY AUC0-90 min | 10597.5 (7072.5, 14505) | 13132.5 (9243.75, 17936.25) | |
| Δ16wks-BL PP PYY AUC0-90 min | 4120.5 (1867.5, 6712.5) | 825 (–3341.65, 4481.25) | 0.04 |
Data are median (interquartile range). Intention to treat analysis was used to analyze gastrointestinal hormones. P-values represent Wilcoxon’s rank sum test.
Figure 7.
Plasma levels of GI hormones at 16 weeks in the 2 groups. GLP-1 and PYY levels were assessed during fasting (0 min), and at 15, 45, and 90 min postprandially. For each timepoint (0–90 min), average score (± standard error of the mean) of all participants per group was obtained for this figure. AUC0-90 min for each hormone and statistical analysis results can be found in Table 2.
Table 3.
Body composition and anthropometric data for participants treated with liraglutide compared to placebo
| Study Parameter | Liraglutide 3.0 mg | Placebo | P-value |
|---|---|---|---|
| DXA Body Composition | |||
| Baseline % total body fat | 47.75(44.3,50.35) | 46.1 (41.1, 51.13) | |
| Δ16wks-BL % total body fat | –2 (–3.15, –1.45) | –0.4 (–1.75, 0.275) | 0.017 |
| Baseline % trunk fat | 53.45 (50.65, 56.78) | 51.85 (44.55, 56.33) | |
| Δ16wks-BL % trunk fat | –3.2 (–4.35, –1.55) | –0.7 (–1.78, 0.38) | 0.016 |
| Baseline % upper body fat | 56.25 (52.23, 59.6) | 52.9 (46.33, 59.4) | |
| Δ16wks-BL % upper body fat | –3 (–4.3, –1.55) | –0.65 (–3.08, 0.93) | 0.041a |
| Baseline % lower body fat | 47.3 (44.23, 50.85) | 48 (43.13, 51.5) | |
| Δ16wks-BL % lower body fat | –2.1 (–3.1, –0.75) | 0.5 (–1.98, 1.43) | 0.013 |
| Baseline lean body mass (Kg) | 48.85 (44.08, 53.75) | 48.4 (45.73, 52.08) | |
| Δ16wks-BL lean body mass (Kg) | –1.3 (–1.75, –0.1) | –0.65 (–1.13, 1.13) | 0.135 |
| Baseline total body weight (Kg) | 104.25 (88.6, 110.68) | 100.8 (88.83, 109.93) | |
| Δ16wks-BL total body weight (Kg) | –5.8 (–6.9, –4.45) | –1 (–3.5, 2.53) | 0.003 |
| Anthropometric Measurements | |||
| BL waist circumference (cm) | 115.3 (102.1, 123) | 111.4 (105, 119.7) | |
| Δ16wks-BL Waist circumference (cm) | –4.1 (–5.75, –2.15) | –2.6 (–5.55, 0.28) | 0.510 |
| BL hip circumference (cm) | 117.5 (111, 127) | 116 (113.5, 126) | |
| Δ16wks-BL Hip circumference (cm) | –4.5 (–7, –2.15) | –3.65 (–5.83, 2.6) | 0.120 |
| Baseline waist-to-hip ratio | 0.92 (0.89, 1) | 0.94 (0.91, 0.97) | |
| Δ16wks-BL Waist-to-hip ratio | 0 (–0.02, 0.03) | 0 (–0.03, 0.01) | 0.221 |
P-values reflect analysis of covariance analysis using baseline values as covariates. Data shown as median (interquartile range).
BL = baseline.
aWilcoxon rank sum test.
Figure 8.
Box-plot graphs showing the significant decrease in percentage total body and upper body, lower body, and trunk fat with liraglutide compared to placebo. P-values reflect analysis of covariance analysis with baseline %fat as covariate.
$Wilcoxon rank sum test.
Figure 9.
Box-plot graphs showing the significant decrease in total weight, but not in lean body mass, with liraglutide compared to placebo. P-values reflect analysis of covariance analysis with baseline measure as covariate.
Effect of treatment on appetite and taste preference
Compared to placebo, participants on liraglutide ingested numerically lower calories at MTV (P = .054) compared to median pretreatment (baseline) of 1185 mL (Table 1). Fig. 5 displays average appetite ratings per group at each time point, following 16 weeks of treatment. Liraglutide was associated with more reported fullness (P = .02) and lower reported prospective food consumption score (P = .03) posttreatment compared to baseline, as well as being less likely to desire sweet, salty, fatty, or savory foods compared to placebo (P < .05; Table 1; Fig. 6).
Effect of treatment on GLP-1 and PYY
At 16 weeks, plasma GLP-1 was significantly reduced and plasma PYY was significantly increased in the liraglutide group compared to placebo. Table 2 provides detailed information about the changes relative to baseline (pretreatment) in fasting and postprandial values (peak and AUC 0–90 minutes). Fig. 7 shows average GI hormone levels per group at each time point, following 16 weeks of treatment with liraglutide or placebo; it is worth noting that the highest levels of PYY that differentiate the 2 treatments occurred at 45 minutes after the meal.
Effect of treatment on body weight, fat distribution, and anthropometric measures
There was a significant reduction in percentage TBF, trunk fat, upper body fat, and lower body fat in the liraglutide group compared to the placebo group (Table 3; Fig. 8). There was a significant decrease in total body weight assessed by DXA in the liraglutide group compared to placebo, consistent with data on scale measured weight (15). No significant change in lean body mass was observed (Table 3; Fig. 9). Changes in hip circumference, waist circumference, and WHR were not significant (Table 3).
Discussion
This study demonstrates that liraglutide treatment over 16 weeks, with target dose 3 mg once daily is associated with ingestion of less calories, increased reported fullness at MTV, and reduced appetite for a planned meal. Participants in the liraglutide group had a decreased likelihood to choose sweet, salty, fatty, or savory foods compared to placebo, a novel observation. Plasma GLP-1 levels were lower and plasma PYY levels higher with treatment. The drug was also associated with a marked reduction in total body, trunk, and upper body and lower body fat with no significant change in lean body mass, as indicated by DXA measurements. Changes in anthropometric measurements, however, were not significant.
Since postprandial satiation and satiety are highly pertinent to the onset of obesity (1), our observation of improvements in the appetite profile upon treatment with liraglutide is relevant. The increased subjective sensation of fullness observed may be attributable to the retardation of gastric emptying, which has been previously associated with decreased intake of calories in a nutrient drink test and in a buffet meal in about 280 participants (19). Alternatively, increased sensation of fullness may have resulted from direct effects of the drug on hypothalamic feeding centers. In fact, the GLP-1 receptor is expressed at multiple sites in the brain, including the brainstem and hypothalamic nuclei that regulate appetite, as demonstrated by recent animal studies utilizing rat models, which determined that hypothalamic centers that control food intake mediate liraglutide-induced weight loss (20). A central effect on appetite is supported by a lack of effect of liraglutide on gastric volume or postprandial accommodation in our prior report (15).
Consumption of calorie dense foods and foods high in sugar content, fatty foods, and salty foods contribute to development and maintenance of obesity (2). Therefore, strategies that help individuals modify their poor food preferences could potentially have lasting effects on weight and health. Our data suggest that liraglutide may lead to weight loss partly through a central effect on taste preferences. It is desirable to develop biomarkers of successful antiobesity treatments; in combination with our prior report on this trial (15), we propose that change in the rate of gastric emptying at 5 weeks constitutes an early marker of efficacy, and change in taste preference and appetite at 16 weeks reflects a later marker of efficacy in achieving weight loss with liraglutide. These results are clinically relevant despite relatively large variation in the appetite and taste preference parameters due to the subjective nature of these tests (18).
The reduction in appetite is unlikely to be secondary to increase in GLP-1 in the liraglutide-treated group, because the endogenous GLP-1 level was actually diminished with liraglutide treatment. Two likely causes of the reduced endogenous GLP-1 observed in the liraglutide group were the significant delay in gastric emptying and a direct effect of the weight loss induced by liraglutide treatment. Indeed, participants in a 6-week diet-induced weight loss trial had significantly lower postprandial GLP-1 concentrations compared to baseline (21).
PYY levels are reduced in obesity (9). In this study, the observed increase in PYY following 16 weeks of liraglutide treatment contrasts with previous studies of short-term GLP-1 or GLP-1 analog administration, which were associated with a reduction in PYY levels or with no effect (22). The interesting observation of increase in PYY following 16 weeks of liraglutide treatment requires replication, and the mechanism requires further research. The increased PYY levels are observed predominantly at 45 min postprandially; it is unlikely to result from the effect of liraglutide on gastric emptying of food, which was significantly retarded (rather than being accelerated). Thus, if food emptying had reached the ileum sooner in response to liraglutide, it might have explained the increased levels of PYY at 45 min; the converse was observed. Therefore, an alternative hypothesis might explain the observed increase in PYY levels, peaking at 45 min. For example, the liraglutide-induced increase in PYY may result from stimulation of neural release of PYY in the early postprandial period before nutrients reach the distal small intestine (23); this cholinergic regulation may be impaired in individuals with obesity (24). Thus, the increase in PYY with liraglutide may reflect a potential reversal of this impairment in cholinergic regulation, although the mechanism is unclear.
The improved metabolic and cardiovascular profiles observed with liraglutide are likely multifactorial, including weight loss, and improved glycemia (13,25). Other potential beneficial effects are supported by the results of our current study including a significant effect on adipose tissue stores, specifically reduced stores in the android and gynoid regions. The significant decrease in percentage upper body fat in the liraglutide group compared to placebo is particularly relevant from a clinical standpoint, as this could be one mechanism whereby liraglutide ameliorates metabolic imbalances, by reducing the android fat stores, which increase metabolic and cardiovascular risks (11). In the literature, loss of fat mass in the android region is associated with improved cardiovascular risk factors (26).
Given that the majority of patients in this study were female, it is not surprising that the fat stores in the gynoid region were reduced with liraglutide treatment thus explaining the non-significant effect on WHR over the 16-week trial. This is consistent with the demonstration that WHR drops in adult females with central or upper-body obesity but not in those with peripheral or gynoid type obesity (27,28). Future research is needed to study the role of liraglutide in modulating WHR and improving metabolic profiles in both females and males.
The reduction in TBF observed in study participants was associated with preservation of lean body mass. This observation is clinically important, as it shows that liraglutide targets preferentially body fat, thus preserving muscles, bones, and other organs. Since there was no effect on lean body mass, the observed significant reduction in total body weight (–5.8 [–6.9, –4.45] Kg) reflects fat loss. We postulate that these targeted changes may explain, at least in part, the favorable metabolic and cardiovascular effects previously observed with liraglutide (12–14). During the study, participants in both groups were encouraged to increase their physical lifestyle activity, and this may also have partly contributed to the maintenance of lean body mass. Thus, we believe that the combination of liraglutide and behavioral counseling may be important for preservation of lean body mass.
This research represents a step forward in the understanding of the beneficial effects of liraglutide, which may reflect effects on the gut, central mechanisms, and possibly gut–brain axis connection. Limitations of our current study include the lack of monitoring of the participants’ physical activity level (a potential confounder), and the lack of studies of appetite parameters at 5 weeks, which would have aided understanding of the relationship between gastric emptying delay and appetite alteration with liraglutide treatment, given the observed tachyphylaxis in the effects on gastric emptying at 16 weeks compared to effects at 5 weeks. Future studies should also examine central appetite suppression in response to GLP-1 receptor agonists by measuring central functions that are directly involved in appetite regulation (eg, hypothalamic function using MRI) (29).
In conclusion, treatment of individuals with obesity for 16 weeks with daily 3 mg SQ liraglutide compared to placebo, both combined with dietetic and behavioral counseling, enhances the feeling of fullness, reduces calorie intake, modulates taste preference, alters GI hormone levels, and reduces TBF as well as regional upper body fat and trunk fat stores. These results suggest a central effect of liraglutide on appetite-altering cravings for different foods, particularly fatty and salty foods, which could contribute to weight loss. This weight-reducing effect of liraglutide was associated with changes in regional fat stores while lean body mass was preserved and may, thus, provide insights on the favorable effect of liraglutide on metabolic and cardiovascular risks in obesity.
Acknowledgments
The authors thank Cindy Stanislav for excellent secretarial assistance; the nurses and staff of the Mayo Clinic Clinical Research Unit for nursing support and the care of patients; Erin Stern, Pharm D, for research pharmacy support; Deborah Eckert, RN, for excellent research coordinating; and Michael Ryks and Deborah Rhoten for excellent technical support.
Financial Support: The study was supported by NIH grant DK67071 (R56 and R01, principal investigator Dr. M. Camilleri); research studies were conducted in the Clinical Research and Trials Unit, Mayo Clinic, which is supported by grant UL1-TR000135 from NIH. This publication was made possible by CTSA Grant Number UL1 TR002377 from the National Center for Advancing Translational Sciences (NCATS), a component of the National Institutes of Health (NIH). Its contents are solely the responsibility of the authors and do not necessarily represent the official view of NIH. The study drug was purchased or provided by Novo Nordisk, Inc., Plainsboro, NJ, USA.
Clinical Trail Information: ClinicalTrials.gov #NCT 02647944 (https://clinicaltrials.gov/ct2/show/NCT02647944?term=NCT02647944&rank=1)
Author Contributions: HK is a fellow investigator and was responsible for dietary and behavioral treatment, data analysis and manuscript preparation. VC contributed in data analysis. HH was responsible for care of patients in clinical research unit and contributed in data analysis. DDB was responsible for management of study procedures and data acquisition. MMC is a staff co-investigator and was the lead of behavioral and nutrition therapists in clinical trial. DK was responsible for patient care in clinical research unit. AV is a staff co-investigator and was responsible for supervision of patient care (glycemia). AA is a staff co-investigator and participated in supervision of patient care. MC was the principal investigator, the NIH grant recipient, and was responsible for supervision of all aspects of the study.
Additional Information
Disclosure Summary: A. Vella reports personal fees from VTV Therapeutics and a research grant from Novartis. All other authors report no relevant financial or personal conflicts of interest.
Data Availability: Consistent with NIH requirements for RO1 funding (DK67071) that supports this research, collected data will be submitted to the NIH Database of Genotypes and Phenotypes (dbGaP) in year 5 of the grant period (2022) and will therefore be available for further study by others.
References
- 1. Camilleri M. Peripheral mechanisms in appetite regulation. Gastroenterology. 2015;148(6):1219–1233. [DOI] [PMC free article] [PubMed] [Google Scholar]
- 2. Berthoud HR, Zheng H. Modulation of taste responsiveness and food preference by obesity and weight loss. Physiol Behav. 2012;107(4):527–532. [DOI] [PMC free article] [PubMed] [Google Scholar]
- 3. Joyner MA, Gearhardt AN, White MA. Food craving as a mediator between addictive-like eating and problematic eating outcomes. Eat Behav. 2015;19:98–101. [DOI] [PMC free article] [PubMed] [Google Scholar]
- 4. Gearhardt AN, Rizk MT, Treat TA. The association of food characteristics and individual differences with ratings of craving and liking. Appetite. 2014;79:166–173. [DOI] [PubMed] [Google Scholar]
- 5. Chao AM, Wadden TA, Tronieri JS, et al. Effects of addictive-like eating behaviors on weight loss with behavioral obesity treatment. J Behav Med. 2019;42(2):246–255. [DOI] [PMC free article] [PubMed] [Google Scholar]
- 6. Janse Van Vuuren MA, Strodl E, White KM, Lockie PD. Emotional food cravings predicts poor short-term weight loss following laparoscopic sleeve gastrectomy. Br J Health Psychol. 2018;23(3):532–543. [DOI] [PubMed] [Google Scholar]
- 7. Horowitz M, Flint A, Jones KL, et al. Effect of the once-daily human GLP-1 analogue liraglutide on appetite, energy intake, energy expenditure and gastric emptying in type 2 diabetes. Diabetes Res Clin Pract. 2012;97(2):258–266. [DOI] [PubMed] [Google Scholar]
- 8. Koliaki C, Doupis J. Incretin-based therapy: a powerful and promising weapon in the treatment of type 2 diabetes mellitus. Diabetes Ther. 2011;2(2):101–121. [DOI] [PMC free article] [PubMed] [Google Scholar]
- 9. Batterham RL, Cohen MA, Ellis SM, et al. Inhibition of food intake in obese subjects by peptide YY3-36. N Engl J Med. 2003;349(10):941–948. [DOI] [PubMed] [Google Scholar]
- 10. Stults-Kolehmainen MA, Stanforth PR, Bartholomew JB. Fat in android, trunk, and peripheral regions varies by ethnicity and race in college aged women. Obesity (Silver Spring). 2012;20(3):660–665. [DOI] [PubMed] [Google Scholar]
- 11. Kissebah AH, Krakower GR. Regional adiposity and morbidity. Physiol Rev. 1994;74(4):761–811. [DOI] [PubMed] [Google Scholar]
- 12. Whitlock G, Lewington S, Sherliker P, et al. ; Prospective Studies Collaboration Body-mass index and cause-specific mortality in 900 000 adults: collaborative analyses of 57 prospective studies. Lancet. 2009;373(9669):1083–1096. [DOI] [PMC free article] [PubMed] [Google Scholar]
- 13. le Roux CW, Astrup A, Fujioka K, et al. ; SCALE Obesity Prediabetes NN8022-1839 Study Group 3 years of liraglutide versus placebo for type 2 diabetes risk reduction and weight management in individuals with prediabetes: a randomised, double-blind trial. Lancet. 2017;389(10077):1399–1409. [DOI] [PubMed] [Google Scholar]
- 14. Feng WH, Bi Y, Li P, et al. Effects of liraglutide, metformin and gliclazide on body composition in patients with both type 2 diabetes and non-alcoholic fatty liver disease: a randomized trial. J Diabetes Investig. 2019;10(2):399–407. [DOI] [PMC free article] [PubMed] [Google Scholar]
- 15. Halawi H, Khemani D, Eckert D, et al. Effects of liraglutide on weight, satiation, and gastric functions in obesity: a randomised, placebo-controlled pilot trial. Lancet Gastroenterol Hepatol. 2017;2(12):890–899. [DOI] [PubMed] [Google Scholar]
- 16. Brownell KD. The LEARN Program for Weight Management. 10th ed. Dallas, TX: American Health Publishing Company; 2004. [Google Scholar]
- 17. Chial HJ, Camilleri C, Delgado-Aros S, et al. A nutrient drink test to assess maximum tolerated volume and postprandial symptoms: effects of gender, body mass index and age in health. Neurogastroenterol Motil. 2002;14(3):249–253. [DOI] [PubMed] [Google Scholar]
- 18. Flint A, Raben A, Blundell JE, Astrup A. Reproducibility, power and validity of visual analogue scales in assessment of appetite sensations in single test meal studies. Int J Obes Relat Metab Disord. 2000;24(1):38–48. [DOI] [PubMed] [Google Scholar]
- 19. Halawi H, Camilleri M, Acosta A, et al. Relationship of gastric emptying or accommodation with satiation, satiety, and postprandial symptoms in health. Am J Physiol Gastrointest Liver Physiol. 2017;313(5):G442–G447. [DOI] [PMC free article] [PubMed] [Google Scholar]
- 20. Secher A, Jelsing J, Baquero AF, et al. The arcuate nucleus mediates GLP-1 receptor agonist liraglutide-dependent weight loss. J Clin Invest. 2014;124(10):4473–4488. [DOI] [PMC free article] [PubMed] [Google Scholar]
- 21. Adam TC, Jocken J, Westerterp-Plantenga MS. Decreased glucagon-like peptide 1 release after weight loss in overweight/obese subjects. Obes Res. 2005;13(4):710–716. [DOI] [PubMed] [Google Scholar]
- 22. Farr OM, Tsoukas MA, Triantafyllou G, et al. Short-term administration of the GLP-1 analog liraglutide decreases circulating leptin and increases GIP levels and these changes are associated with alterations in CNS responses to food cues: a randomized, placebo-controlled, crossover study. Metabolism. 2016;65(7):945–953. [DOI] [PMC free article] [PubMed] [Google Scholar]
- 23. De Silva A, Bloom SR. Gut hormones and appetite control: a focus on PYY and GLP-1 as therapeutic targets in obesity. Gut Liver. 2012;6(1):10–20. [DOI] [PMC free article] [PubMed] [Google Scholar]
- 24. Maier C, Riedl M, Vila G, et al. Cholinergic regulation of ghrelin and peptide YY release may be impaired in obesity. Diabetes. 2008;57(9):2332–2340. [DOI] [PMC free article] [PubMed] [Google Scholar]
- 25. Marso SP, Daniels GH, Brown-Frandsen K, et al. ; LEADER Steering Committee; LEADER Trial Investigators Liraglutide and cardiovascular outcomes in type 2 diabetes. N Engl J Med. 2016;375(4):311–322. [DOI] [PMC free article] [PubMed] [Google Scholar]
- 26. Nicklas BJ, Dennis KE, Berman DM, Sorkin J, Ryan AS, Goldberg AP. Lifestyle intervention of hypocaloric dieting and walking reduces abdominal obesity and improves coronary heart disease risk factors in obese, postmenopausal, African-American and Caucasian women. J Gerontol A Biol Sci Med Sci. 2003;58(2):181–189. [DOI] [PubMed] [Google Scholar]
- 27. Casimirri F, Pasquali R, Cesari MP, Melchionda N, Barbara L. Interrelationships between body weight, body fat distribution and insulin in obese women before and after hypocaloric feeding and weight loss. Ann Nutr Metab. 1989;33(2):79–87. [DOI] [PubMed] [Google Scholar]
- 28. Wadden TA, Stunkard AJ, Johnston FE, et al. Body fat deposition in adult obese women. II. Changes in fat distribution accompanying weight reduction. Am J Clin Nutr. 1988;47(2):229–234. [DOI] [PubMed] [Google Scholar]
- 29. Kilpatrick LA, Coveleskie K, Connolly L, et al. Influence of sucrose ingestion on brainstem and hypothalamic intrinsic oscillations in lean and obese women. Gastroenterology. 2014;146(5):1212–1221. [DOI] [PMC free article] [PubMed] [Google Scholar]


