Abstract
Background and rationale.
Fatty liver disease is common in the United States and worldwide due to changing lifestyles and can progress to fibrosis and cirrhosis contributing to premature death. We examined whether liver fibrosis scores were associated with increased overall and disease-specific mortality in a U.S. population-based prospective survey with up to 23 years of linked-mortality data.
Methods.
Data were analyzed from 14,841 viral hepatitis negative adult participants in the third National Health and Nutrition Examination Survey, 1988–1994. Liver fibrosis was predicted using the aspartate aminotransferase to platelet ratio index (APRI), fibrosis-4 (FIB-4) score, nonalcoholic fatty liver disease fibrosis score (NFS), and Forns score. Participants were passively followed for mortality, identified by death certificate underlying or contributing causes, by linkage to National Death Index records through 2011. Hazard rate ratios (HR) for mortality were calculated using Cox proportional hazards regression to adjust for mortality risk factors.
Results.
During follow-up, cumulative mortality was 28.0% from all causes and 0.82% with liver disease, including primary liver cancer. Elevated liver disease mortality was found with an intermediate-high APRI (HR, 9.44; 95% CI, 5.02–17.73), intermediate (HR, 3.15; 95% CI, 1.33–7.44) or high (HR, 25.14; 95% CI, 8.38–75.40) FIB-4, high NFS (HR, 6.52; 95% CI, 2.30–18.50), and intermediate (HR, 3.58; 95% CI, 1.78–7.18) or high (HR, 63.13; 95% CI, 22.16–179.78) Forns score. Overall mortality was also greater with higher fibrosis scores.
Conclusion.
In the U.S. population, higher liver fibrosis scores were associated with increased liver disease and overall mortality. Liver health management with common clinical measures of fibrosis risk stratification merits further investigation.
Keywords: non-invasive markers, non-alcoholic fatty liver disease, National Health and Nutrition Examination Survey, population-based, epidemiology
Fatty liver disease is becoming increasingly common in the United States and worldwide due to changing lifestyles.(1–5) It encompasses liver injury ranging from steatosis to severe steatohepatitis that can progress to fibrosis, cirrhosis, liver failure, or hepatocellular carcinoma in a subgroup of patients.(6, 7) However, natural history remains incompletely understood, and patients with advanced liver fibrosis have highest risk of progressing to end-stage liver disease.(6, 8–14) In a recent multicenter prospective study of non-alcoholic fatty liver disease (NAFLD) patients, fibrosis stage was the only histological feature independently associated with liver-related events, liver transplantation, and overall mortality.(15) Currently, the gold standard for diagnosis and staging of liver fibrosis is a liver biopsy. However, liver biopsy cannot be performed on the general population for steatosis and fibrosis prevalence estimation.
The increasing burden of chronic liver disease and need for risk stratification and continual disease monitoring to better personalize treatment has led to the evaluation of clinical measures as noninvasive markers of liver fibrosis. These consist of imaging methods that use transient elastography to measure liver stiffness and serum markers that directly measure components of extracellular matrix or indirectly measure hepatic damage and/or dysfunction during development of fibrosis. Scoring systems derived from commonly measured serum markers of hepatic dysfunction include the aspartate aminotransferase to platelet ratio index (APRI), fibrosis-4 (FIB-4) and Forns score, which were originally developed in patients with chronic hepatitis C virus and have subsequently been used with other liver diseases including NAFLD.(16–23) Recently, the NAFLD fibrosis score (NFS) was specifically constructed to predict advanced fibrosis in NAFLD patients.(24) These scoring systems have been shown to identify histological fibrosis with reasonable accuracy in cross-sectional studies. However, little is known about the role of fibrosis scores in natural history and prognosis, particularly their ability to predict adverse hepatic outcomes among asymptomatic persons, including those with NAFLD at high risk of progression.(25) In a previous paper using the third National Health and Nutrition Examination Survey (NHANES III) population with mortality follow-up through 2006, fibrosis predicted by NFS, APRI, or FIB-4 was independently associated with increased mortality, primarily from cardiovascular disease, among persons with suspected NAFLD.(26) At the time of those earlier analyses, the number of deaths from liver disease was too small to provide reliable estimates. We questioned whether recent survey-linked National Death Index records with 5 additional years of follow-up would reveal a stronger relationship of fibrosis scores with mortality outcomes, including liver disease mortality. Mortality ascertainment is now complete for NHANES III through 2011, providing up to 23 years of follow-up. We examined whether APRI, FIB-4, NFS, and the Forns score, among persons without viral hepatitis, were associated with increased overall and disease-specific mortality in this national, population-based, prospective survey.
MATERIALS AND METHODS
The NHANES III was conducted in the United States from 1988 through 1994 by the National Center for Health Statistics of the Centers for Disease Control and Prevention.(27) The survey consisted of cross-sectional interview, examination, and laboratory data collected from a complex multistage, stratified, clustered probability sample representative of the civilian, noninstitutionalized population with oversampling of non-Hispanic blacks, Mexican Americans, and persons aged 60 years or older. The survey was approved by the Centers for Disease Control and Prevention ethics review board, and all participants provided written informed consent to participate.
Data were collected at baseline on factors believed to be related to liver injury and used to calculate fibrosis scores and/or included as covariates in multivariate analyses:(28–30) age, sex, race-ethnicity, education, alcohol intake, cigarette smoking, caffeine intake from beverages, physical activity, diagnosed diabetes, body mass index [weight (kg) / height (m2)]; waist-to-hip circumference ratio, and systolic and diastolic blood pressure. A venous blood sample was collected and shipped weekly at −20°C to testing laboratories. Aspartate aminotransferase, alanine aminotransferase, gamma glutamyltransferase, albumin, platelet count, hepatitis B virus surface antigen, hepatitis C virus RNA, transferrin saturation, and concentrations of hemoglobin A1C, total and high-density lipoprotein cholesterol, C-reactive protein, alkaline phosphatase, and total bilirubin were measured as previously described.(31) Diabetes was defined as a health care provider diagnosis or hemoglobin A1C ≥6.5% and prediabetes as hemoglobin A1C ≥5.7-<6.5%.
Four scores, APRI, FIB-4, NFS, and Forns were calculated as previously described (Table 1).(16, 19, 22, 24) The originally described cut-points for each score were used to categorize liver fibrosis probability as low, intermediate, or high (Table 1).(18, 19, 22, 32) For APRI, intermediate and high categories were combined because of low liver disease mortality numbers in the NHANES III study sample representative of the U.S. general population.
Table 1.
Liver fibrosis scores
| Score | Algorithm | Cut-offs |
|---|---|---|
| AST to platelet ratio index (APRI)(19) | 0.5 and 1.5 | |
| Fibrosis 4 (FIB-4)(16, 18) | 1.30 and 2.67 | |
| NAFLD fibrosis score (NFS)(24) | NFS = −1.675 + 0.037 age (years) + 0.094 BMI (kg/m2) + 1.13 prediabetes/diabetes (yes=1, no=0) + 0.99 (AST [IU/L]/ALT [IU/L]) − 0.013 platelet count (109/L) − 0.66 albumin (g/dL) | −1.455 and 0.676 |
| Forns score(22) | Forns = 7.811 − 3.131 log(platelet count [109/L]) + 0.781 log(GGT [IU/L]) + 3.467 log(age [years]) − 0.014 total cholesterol (mg/dL) | 4.2 and 6.9 |
AST, aspartate aminotransferase; ULN, upper limit of normal; ALT, alanine aminotransferase; A1C, hemoglobin A1C; BMI, body mass index; GGT, gamma glutamyltransferase.
37 IU/L for men and 31 IU/L for women.(31)
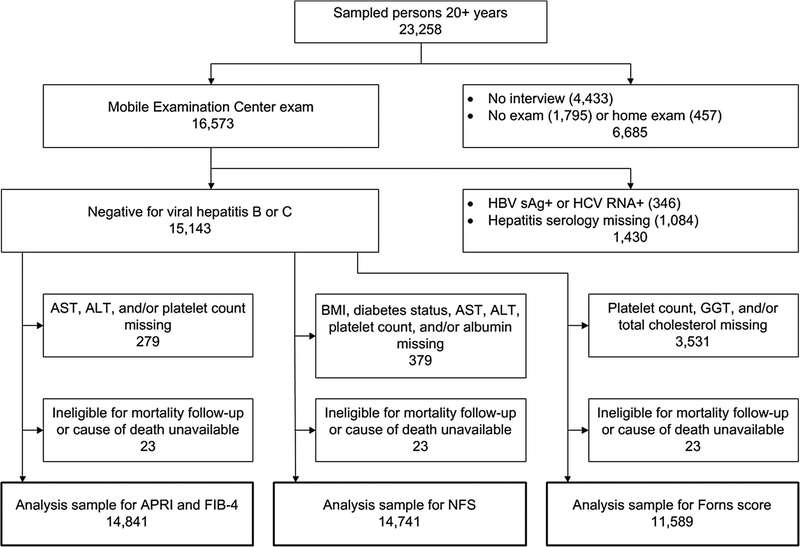
Of 23,258 sampled persons aged 20 years and older in NHANES III, 16,573 (71%) attended a study visit at a mobile examination center. Participants were excluded if they were positive for serum hepatitis B surface antigen or hepatitis C RNA (n=346). We additionally excluded persons who were missing data on viral hepatitis serology (n=1,084) or fibrosis score components (for APRI and FIB-4, n=279 and for NFS, n=379), were ineligible for mortality follow-up (n=12), or did not have a cause of death available (n=11), resulting in analysis samples of 14,841 for APRI and FIB-4 and 14,741 for NFS. One component of the Forns score, gamma glutamyltransferase, was added to the protocol after the beginning of the survey (n=3,531 missing), resulting in an analysis sample of 11,589 (Figure 1).
Figure 1.
Derivation of NHANES III sample for analysis of liver fibrosis scores and mortality. NHANES, National Health and Nutrition Examination Survey; HBV sAg+, hepatitis B virus surface antigen positive; HCV RNA+, hepatitis C virus ribonucleic acid positive; AST, aspartate aminotransferase; ALT, alanine aminotransferase; BMI, body mass index; GGT, gamma glutamyltransferase; APRI, AST to platelet ratio index; FIB-4, fibrosis-4; NFS, non-alcoholic fatty liver disease fibrosis score.
Participants were passively followed for mortality through December 31, 2011, by linking NHANES III with National Death Index records through a probabilistic match, a well-established and validated matching method.(33, 34) Mortality outcomes were based on death certificate underlying or contributing cause coded according to the International Classification of Diseases, Ninth Revision (ICD-9), for deaths occurring between 1988 and 1998 and the International Classification of Diseases, Tenth Revision (ICD-10), for deaths occurring between 1999 and 2011. Outcomes consisted of all-cause mortality and cause-specific mortality from cardiovascular disease (ICD-9 codes 410–414, 428, 429.2, 433–435, 437.0–437.1, 440, and 444; ICD-10 codes G45, I20-I25, I50, I63, I65-I66, I67.2, I67.8, I69.3, I70, and I74), neoplasms (ICD-9 codes 140–154, 155.1, and 156–239; ICD-10 codes C00-C21, C22.1, and C23-D48), diabetes (ICD-9 code 250; ICD-10 codes E10-E14), and liver disease, including primary liver cancer (ICD-9 codes 155.0, 155.2, and 570–573; ICD-10 codes C22.0, C22.2-C22.9, and K70-K76). Restricted NHANES III mortality data were used for this analysis through the National Center for Health Statics Research Data Center.(35)
Statistical analysis
Characteristics of participants by fibrosis score categories were examined by comparing mean (standard deviation) of continuous factors using analysis of variance and percentages of categorical factors using a chi-square (χ2) test. Unadjusted cumulative mortality during follow-up by fibrosis score category was calculated using Kaplan-Meier analysis. Hazard rate ratio (HR) estimates (relative risk) and 95% confidence intervals (CI) for mortality outcomes were calculated using Cox proportional hazard regression analysis (SUDAAN PROC SURVIVAL) to control for effects of potential risk factors while taking into consideration varying lengths of follow-up. Factors included in multivariate analyses consisted of age, sex, race-ethnicity, education, alcohol intake, cigarette smoking, caffeine intake from beverages, physical activity, body mass index, waist-to-hip circumference ratio, diabetes, total and high-density lipoprotein cholesterol, systolic and diastolic blood pressure, C-reactive protein, and transferrin saturation. Continuous factors whose distributions were skewed to the right were categorized as deciles (10th percentiles) in regression models. HRs were computed for intermediate and high fibrosis score categories relative to the low category. Time at risk was from the date of the NHANES III examination to the date of death or to December 31, 2011. For analyses of cause-specific mortality, participants who died from other causes were censored at the date of death. All factors met the proportional hazard assumption of a relatively constant risk ratio through examination of -log (-log) plots of survival versus time by categories.(36) Multivariate analyses excluded persons with missing values for any factor included in the model. P-values were two-sided, and a P-value of <0.05 was considered to indicate statistical significance. All analyses utilized sample weights that accounted for unequal selection probabilities and nonresponse. All variance calculations accounted for design effects of the survey using Taylor series linearization.(37)
RESULTS
Distributions of APRI, FIB-4, NFS, and the Forns score among NHANES III participants without viral hepatitis, are shown by fibrosis score category in Table 2. Using originally described cut-points, prevalence of an intermediate and high fibrosis score varied (Table 2). In general, persons with higher scores had more adverse liver-related characteristics (Tables 3a and 3b). They were also older, less educated, and more likely to be obese, diabetic, and hypertensive, with higher C-reactive protein and lower caffeine intake (Tables 3a and 3b). Relationships with sex, race-ethnicity, alcohol consumption, cigarette smoking, physical activity, lipid levels, and transferrin saturation varied among fibrosis scores.
Table 2.
Distribution of liver fibrosis scores among NHANES III examination participants, United States, 1988–1994
| Fibrosis probability | |||
|---|---|---|---|
| Score | |||
| Characteristic | Low | Intermediate | High |
| APRI | |||
| Cut-points | ≤0.5 | >0.5 | |
| Number | 14,213 | 628 | |
| Percentage (%) | 96.46 | 3.54 | |
| Median (IQR) | 0.21 (0.17, 0.27) | 0.63 (0.55, 0.84) | |
| FIB-4 | |||
| Cut-points | <1.30 | 1.30–2.67 | >2.67 |
| Number | 10,824 | 3,416 | 601 |
| Percentage (%) | 79.39 | 18.15 | 2.46 |
| Median (IQR) | 0.67 (0.50, 0.90) | 1.66 (1.45, 1.97) | 3.14 (2.84, 3.72) |
| NFS | |||
| Cut-points | <−1.455 | −1.455–0.676 | >0.676 |
| Number | 9,073 | 4,413 | 1,255 |
| Percentage (%) | 69.93 | 24.73 | 5.35 |
| Median (IQR) | −2.88 (−3.62, −2.26) | −0.71 (−1.12, −0.15) | 1.27 (0.96, 1.77) |
| Forns score | |||
| Cut-points | <4.2 | 4.2–6.9 | >6.9 |
| Number | 8,454 | 2,928 | 207 |
| Percentage (%) | 79.99 | 18.93 | 1.08 |
| Median (IQR) | 2.38 (1.48, 3.21) | 4.95 (4.55, 5.54) | 7.50 (7.16, 7.98) |
NHANES, National Health and Nutrition Examination Survey; APRI, aspartate aminotransferase to platelet ratio index; IQR, interquartile range; FIB-4, fibrosis-4; NFS, non-alcoholic fatty liver disease fibrosis score.
Table 3a.
Characteristics* of NHANES III examination participants by APRI and FIB-4 category, United States, 1988–1994
| APRI | FIB-4 | |||
|---|---|---|---|---|
| Low (n=14,213) | Intermediate-high (n=628) | Low (n=10,824) | Intermediate-high (n=4,017) | |
| AST (IU/L) | 19.8 (5.7) | 52.9 (33.4)1 | 19.8 (7.1) | 25.3 (17.7)1 |
| ALT (IU/L) | 16.1 (9.5) | 48.0 (35.1)1 | 17.5 (12.1) | 16.1 (15.4)1 |
| GGT (IU/L) | 26.3 (26.5) | 89.1 (128.2)1 | 26.9 (28.5) | 34.7 (60.1)1 |
| Alkaline phosphatase (IU/L) | 81.4 (27.7) | 102.0 (71.0)1 | 79.7 (25.6) | 91.1 (43.5)1 |
| Platelet count (109/L) | 272.9 (66.7) | 199.3 (59.6)1 | 281.5 (66.8) | 227.0 (52.4)1 |
| Albumin (g/dL) | 4.2 (0.4) | 4.1 (0.4) | 4.2 (0.4) | 4.1 (0.3)1 |
| Total bilirubin (mg/dL) | 0.61 (0.32) | 0.75 (0.55)1 | 0.61 (0.33) | 0.63 (0.35)1 |
| Age (years) | 44.7 (17.2) | 48.4 (17.6)1 | 39.2 (13.4) | 66.3 (12.7)1 |
| Women | 52.7 | 48.7 | 52.7 | 52.0 |
| Race-ethnicity | ||||
| Non-Hispanic white | 77.5 | 71.61 | 75.8 | 83.31 |
| Non-Hispanic black | 10.1 | 10.5 | 10.4 | 8.91 |
| Mexican American | 5.0 | 8.41 | 5.7 | 2.61 |
| Other | 7.4 | 9.5 | 8.1 | 5.21 |
| Education (years) | 12.4 (3.2) | 11.9 (3.3)1 | 12.6 (3.0) | 11.5 (3.6)1 |
| Alcohol intake | ||||
| Never | 13.2 | 14.2 | 11.9 | 18.41 |
| Former | 32.5 | 35.2 | 30.5 | 40.61 |
| >0–<1 drink/day | 40.2 | 28.31 | 42.8 | 28.31 |
| 1–2 drinks/day | 8.3 | 12.3 | 8.7 | 7.2 |
| >2 drinks/day | 5.8 | 10.01 | 6.1 | 5.5 |
| Cigarette smoking | ||||
| Never | 46.3 | 47.0 | 46.4 | 46.0 |
| Former | 26.2 | 26.7 | 23.2 | 37.61 |
| >0–<1 pack/day | 12.1 | 13.3 | 13.4 | 7.11 |
| ≥1 pack/day | 15.4 | 13.1 | 17.0 | 9.31 |
| Caffeine intake (mg/day) | 231.2 (282.8) | 163.6 (155.0)1 | 231.2 (283.3) | 219.4 (264.4) |
| Physical activity (METs/month) | 111.4 (131.4) | 113.1 (144.2) | 110.9 (132.1) | 113.4 (130.7) |
| BMI (kg/m2) | 26.5 (5.6) | 28.2 (6.7)1 | 26.6 (5.8) | 26.6 (5.0) |
| Waist-to-hip ratio | 90.8 (9.1) | 94.0 (8.7)1 | 90.0 (8.9) | 94.7 (8.7)1 |
| Diabetes | 6.8 | 14.11 | 5.4 | 13.41 |
| Total cholesterol (mg/dL) | 204.7 (42.9) | 206.5 (47.1) | 201.1 (42.2) | 218.7 (43.3)1 |
| HDL cholesterol (mg/dL) | 50.6 (15.1) | 51.0 (21.5) | 50.1 (14.7) | 52.6 (17.7)1 |
| Systolic blood pressure (mmHg) | 122.4 (17.8) | 126.3 (18.5)1 | 119.1 (15.4) | 135.7 (20.2)1 |
| Diastolic blood pressure (mmHg) | 74.1 (10.0) | 75.6 (10.2) | 74.0 (10.0) | 74.7 (10.0)1 |
| C-reactive protein >0.3 mg/dL | 25.9 | 33.31 | 24.9 | 31.01 |
| Transferrin saturation (%) | 26.2 (11.4) | 29.3 (12.2)1 | 26.3 (11.7) | 26.3 (10.6) |
NHANES, National Health and Nutrition Examination Survey; APRI, aspartate aminotransferase to platelet ratio index; FIB-4, fibrosis-4; AST, aspartate aminotransferase; ALT, alanine aminotransferase; GGT, gamma glutamyltransferase; MET, metabolic equivalent; BMI, body mass index; HDL, high-density lipoprotein.
p<0.05 compared with low category.
Statistics are mean (standard deviation) or percentage.
Table 3b.
Characteristics* of NHANES III examination participants by NFS and Forns category, United States, 1988–1994
| NFS | Forns | |||
|---|---|---|---|---|
| Low (n=9,073) | Intermediate-high (n=5,668) | Low (n=8,454) | Intermediate-high (n=3,135) | |
| AST (IU/L) | 20.6 (9.1) | 21.6 (12.5)1 | 20.2 (8.9) | 23.7 (15.1)1 |
| ALT (IU/L) | 18.1 (13.1) | 15.2 (11.7)1 | 17.1 (12.1) | 18.4 (15.8)1 |
| GGT (IU/L) | 26.9 (28.7) | 32.1 (51.4)1 | 24.6 (23.0) | 44.2 (67.3)1 |
| Alkaline phosphatase (IU/L) | 79.0 (25.7) | 89.4 (38.6)1 | 80.1 (25.7) | 92.8 (42.7)1 |
| Platelet count (109/L) | 285.0 (67.6) | 235.8 (54.4)1 | 278.9 (64.7) | 218.8 (49.5)1 |
| Albumin (g/dL) | 4.3 (0.4) | 4.0 (0.3)1 | 4.2 (0.4) | 4.0 (0.3)1 |
| Total bilirubin (mg/dL) | 0.63 (0.34) | 0.59 (0.31)1 | 0.61 (0.32) | 0.65 (0.33)1 |
| Age (years) | 38.0 (13.0) | 60.6 (15.5)1 | 39.6 (14.1) | 64.8 (13.4)1 |
| Women | 50.9 | 56.01 | 55.2 | 42.11 |
| Race-ethnicity | ||||
| Non-Hispanic white | 76.7 | 78.8 | 75.4 | 81.41 |
| Non-Hispanic black | 9.1 | 12.31 | 10.7 | 9.7 |
| Mexican American | 5.9 | 3.31 | 5.1 | 3.21 |
| Other | 8.3 | 5.61 | 8.8 | 5.81 |
| Education (years) | 12.8 (3.0) | 11.5 (3.4)1 | 12.6 (3.0) | 11.6 (3.7)1 |
| Alcohol intake | ||||
| Never | 11.4 | 17.81 | 13.0 | 16.01 |
| Former | 27.8 | 43.61 | 30.7 | 41.41 |
| >0–<1 drink/day | 44.6 | 28.41 | 42.2 | 29.11 |
| 1–2 drinks/day | 9.4 | 6.11 | 8.2 | 7.9 |
| >2 drinks/day | 6.8 | 4.11 | 5.8 | 5.6 |
| Cigarette smoking | ||||
| Never | 47.0 | 44.7 | 48.0 | 44.01 |
| Former | 22.3 | 35.21 | 22.6 | 38.81 |
| >0–<1 pack/day | 14.0 | 7.81 | 13.1 | 7.21 |
| ≥1 pack/day | 16.7 | 12.31 | 16.3 | 10.01 |
| Caffeine intake (mg/day) | 233.8 (290.9) | 217.4 (252.2)1 | 232.8 (285.5) | 209.7 (234.1)1 |
| Physical activity (METs/month) | 116.0 (134.8) | 101.0 (124.4)1 | 112.1 (134.1) | 105.9 (121.8) |
| BMI (kg/m2) | 25.5 (4.7) | 29.1 (6.7)1 | 26.4 (5.7) | 27.4 (5.4)1 |
| Waist-to-hip ratio | 89.3 (8.7) | 94.8 (8.9)1 | 89.4 (8.8) | 96.3 (8.4)1 |
| Diabetes | 1.9 | 18.91 | 4.5 | 16.91 |
| Total cholesterol (mg/dL) | 199.5 (41.4) | 216.8 (44.4)1 | 204.6 (44.0) | 201.5 (36.5)1 |
| HDL cholesterol (mg/dL) | 50.9 (15.1) | 50.0 (16.1) | 50.9 (14.9) | 48.7 (16.6)1 |
| Systolic blood pressure (mmHg) | 118.0 (14.6) | 133.1 (19.8)1 | 119.4 (15.8) | 135.5 (20.0)1 |
| Diastolic blood pressure (mmHg) | 73.7 (9.8) | 75.3 (10.3)1 | 73.9 (9.9) | 75.5 (10.4)1 |
| C-reactive protein >0.3 mg/dL | 20.8 | 38.81 | 26.6 | 36.51 |
| Transferrin saturation (%) | 26.8 (11.8) | 25.0 (10.4)1 | 25.9 (11.4) | 26.7 (10.9)1 |
NHANES, National Health and Nutrition Examination Survey; NFS, non-alcoholic fatty liver disease fibrosis score; AST, aspartate aminotransferase; ALT, alanine aminotransferase; GGT, gamma glutamyltransferase; MET, metabolic equivalent; BMI, body mass index; HDL, high-density lipoprotein.
p<0.05 compared with low category.
Statistics are mean (standard deviation) or percentage.
Mortality follow-up
The median follow-up time was 19.3 years (interquartile range, 17.5–21.1 years). Cumulative mortality from all causes was 28.0% (4,835 deaths) at 23 years of follow-up. Cause-specific cumulative mortality (underlying or contributing cause) was 11.4% (1,993 deaths) with cardiovascular disease, 9.0% (1,216 deaths) with neoplasms, 3.4% (593 deaths) with diabetes, and 0.82% (151 deaths) with liver disease, including primary liver cancer.
Fibrosis scores and liver disease mortality
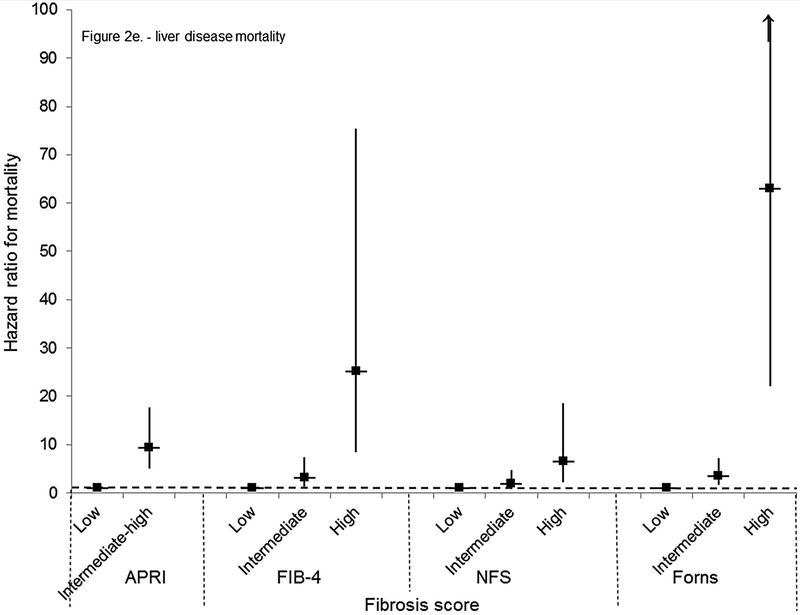
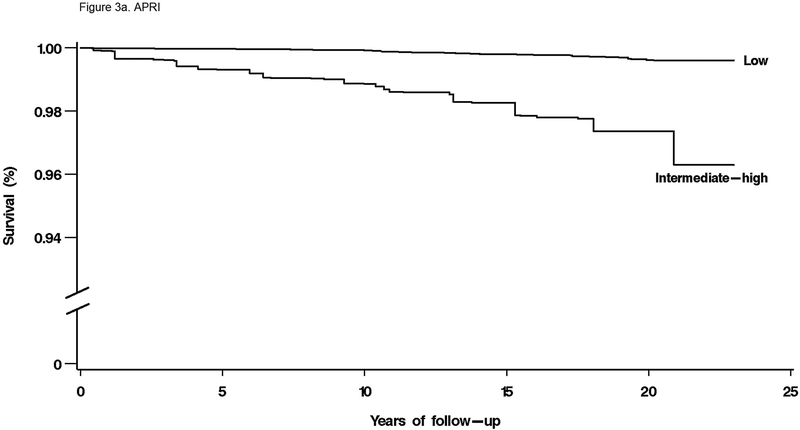
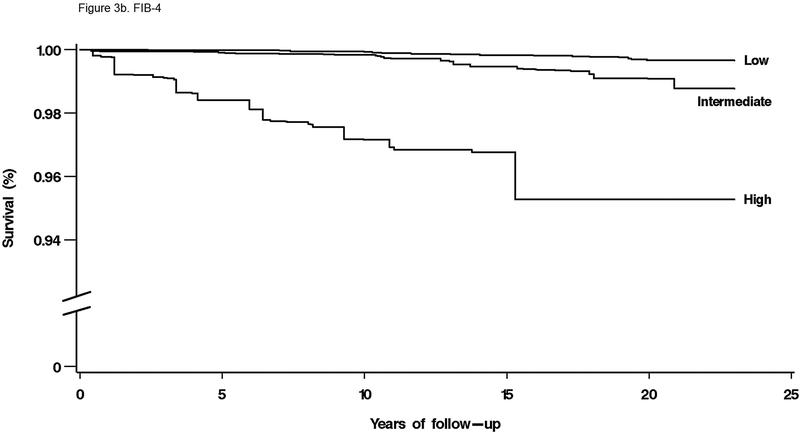
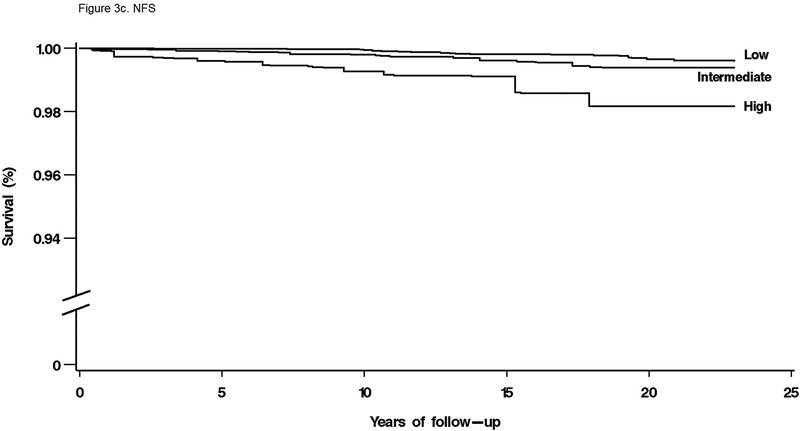
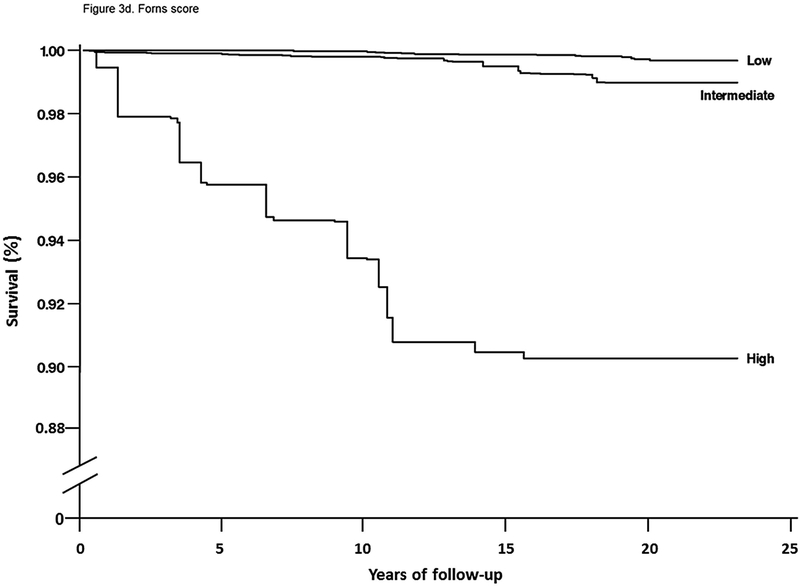
For mortality overall and from each specific cause, unadjusted cumulative mortality rates were greater with higher fibrosis scores (Table 4). For liver disease mortality, intermediate and high fibrosis scores were associated with increased risk in age-adjusted analysis (Table 4). With multivariate adjustment, liver disease mortality remained elevated with an intermediate-high APRI (HR, 9.44; 95% CI, 5.02–17.73), intermediate (HR, 3.15; 95% CI, 1.33–7.44) or high (HR, 25.14; 95% CI, 8.38–75.40) FIB-4, high NFS (HR, 6.52; 95% CI, 2.30–18.50), and intermediate (HR, 3.58; 95% CI, 1.78–7.18) or high (HR, 63.13; 95% CI, 22.16–179.78) Forns score (Figure 2e, Figure 3a–d).
Table 4.
Cumulative probability of mortality over 23 years and age-adjusted mortality hazard ratios by APRI, FIB-4, NFS, or Forns category in NHANES III, United States, 1988–2011
| Fibrosis score | No. of deaths | Unadjusted cumulative mortality | Age-adjusted | |
|---|---|---|---|---|
| Mortality outcome | HR | 95% CI | ||
| Fibrosis probability | ||||
| APRI (N=14,841) | ||||
| All-cause | ||||
| Low | 4,459 | 27.5 | 1.0 | |
| Intermediate-high | 263 | 40.4 | 1.46 | 1.20–1.78 |
| Cardiovascular disease | ||||
| Low | 1,862 | 11.2 | 1.0 | |
| Intermediate-high | 86 | 16.2 | 1.13 | 0.82–1.56 |
| Neoplasms | ||||
| Low | 1,128 | 8.9 | 1.0 | |
| Intermediate-high | 53 | 12.7 | 1.45 | 1.02–2.06 |
| Diabetes | ||||
| Low | 541 | 3.2 | 1.0 | |
| Intermediate-high | 37 | 8.4 | 1.68 | 1.01–2.79 |
| Liver disease | ||||
| Low | 97 | 0.55 | 1.0 | |
| Intermediate-high | 50 | 9.1 | 16.04 | 9.73–26.43 |
| FIB-4 (N=14,841) | ||||
| All-cause | ||||
| Low | 1,881 | 17.5 | 1.0 | |
| Intermediate | 2,317 | 66.3 | 1.02 | 0.92–1.13 |
| High | 524 | 88.5 | 1.38 | 1.21–1.58 |
| Cardiovascular disease | ||||
| Low | 664 | 5.8 | 1.0 | |
| Intermediate | 1,035 | 35.6 | 1.00 | 0.80–1.25 |
| High | 249 | 64.0 | 1.32 | 1.05–1.66 |
| Neoplasms | ||||
| Low | 557 | 6.4 | 1.0 | |
| Intermediate | 530 | 22.6 | 0.86 | 0.75–0.98 |
| High | 94 | 35.8 | 0.94 | 0.74–1.19 |
| Diabetes | ||||
| Low | 289 | 2.1 | 1.0 | |
| Intermediate | 246 | 10.8 | 0.60 | 0.44–0.82 |
| High | 43 | 17.9 | 0.75 | 0.48–1.16 |
| Liver disease | ||||
| Low | 60 | 0.48 | 1.0 | |
| Intermediate | 51 | 1.9 | 3.49 | 1.52–8.03 |
| High | 36 | 12.3 | 42.45 | 14.93–120.72 |
| NFS (N=14,741) | ||||
| All-cause | ||||
| Low | 1,318 | 15.1 | 1.0 | |
| Intermediate | 2,328 | 54.1 | 1.21 | 1.06–1.39 |
| High | 1,032 | 83.3 | .66 | 1.41–1.95 |
| Cardiovascular disease | ||||
| Low | 435 | 4.0 | 1.0 | |
| Intermediate | 1,001 | 29.4 | 1.34 | 1.02–1.74 |
| High | 499 | 56.3 | 1.76 | 1.32–2.33 |
| Neoplasms | ||||
| Low | 393 | 5.7 | 1.0 | |
| Intermediate | 582 | 17.8 | 1.21 | 0.98–1.50 |
| High | 201 | 29.2 | 1.36 | 1.00–1.85 |
| Diabetes | ||||
| Low | 114 | 0.85 | 1.0 | |
| Intermediate | 303 | 10.3 | 3.14 | 2.01–4.91 |
| High | 157 | 30.9 | 6.08 | 3.52–10.52 |
| Liver disease | ||||
| Low | 51 | 0.50 | 1.0 | |
| Intermediate | 58 | 1.3 | 2.66 | 1.19–5.95 |
| High | 37 | 4.9 | 9.83 | 3.52–27.48 |
| Forns score(N= 11,589) | ||||
| All-cause | ||||
| Low | 1,450 | 15.2 | 1.0 | |
| Intermediate | 1,903 | 62.7 | 1.14 | 1.02–1.28 |
| High | 178 | 87.5 | 1.80 | 1.50–2.17 |
| Cardiovascular disease | ||||
| Low | 507 | 5.2 | 1.0 | |
| Intermediate | 869 | 32.1 | 1.13 | 0.92–1.39 |
| High | 86 | 68.3 | 1.65 | 1.19–2.30 |
| Neoplasms | ||||
| Low | 396 | 4.9 | 1.0 | |
| Intermediate | 449 | 23.4 | 1.10 | 0.85–1.41 |
| High | 40 | 31.7 | 1.78 | 1.08–2.95 |
| Diabetes | ||||
| Low | 164 | 1.3 | 1.0 | |
| Intermediate | 239 | 11.2 | 1.79 | 1.19–2.68 |
| High | 24 | 31.3 | 3.38 | 1.72–6.65 |
| Liver disease | ||||
| Low | 38 | 0.49 | 1.0 | |
| Intermediate | 39 | 2.0 | 5.79 | 2.83–11.86 |
| High | 22 | 18.7 | 116.51 | 46.52–291.80 |
APRI, aspartate aminotransferase to platelet ratio index; FIB-4, fibrosis-4; NFS, nonalcoholic fatty liver disease fibrosis score; NHANES, National Health and Nutrition Examination Survey; HR, hazard ratio; CI, confidence interval.
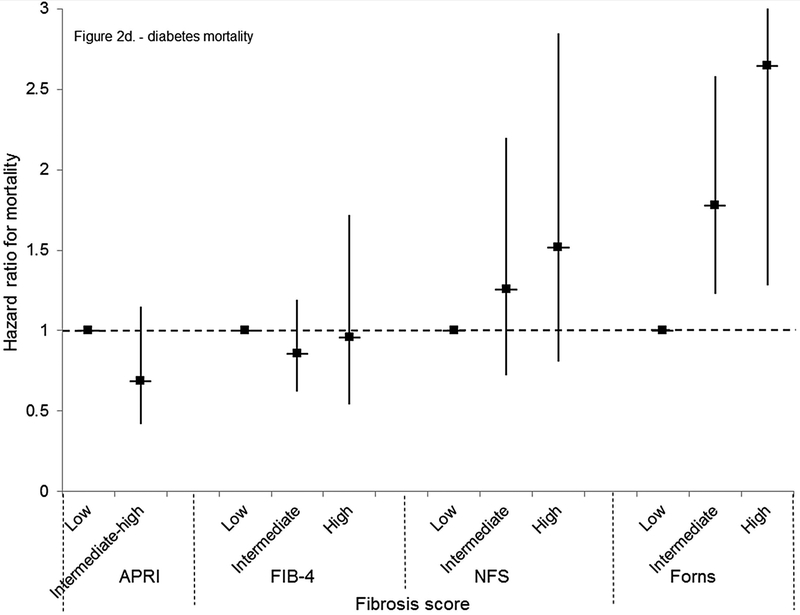
Figure 2.
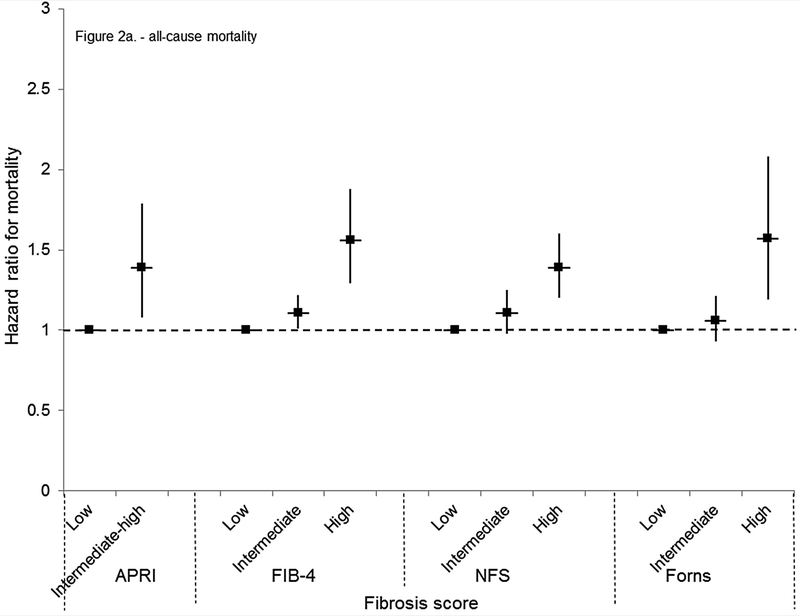
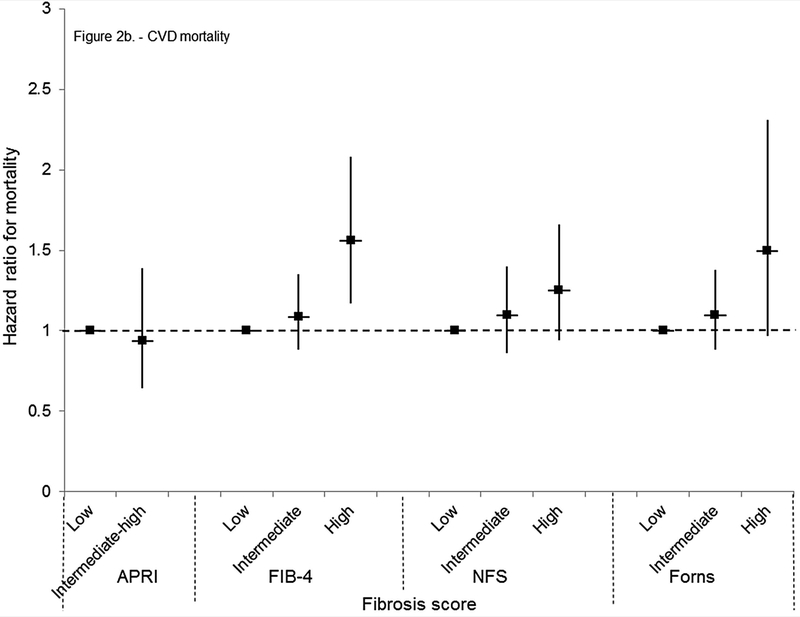
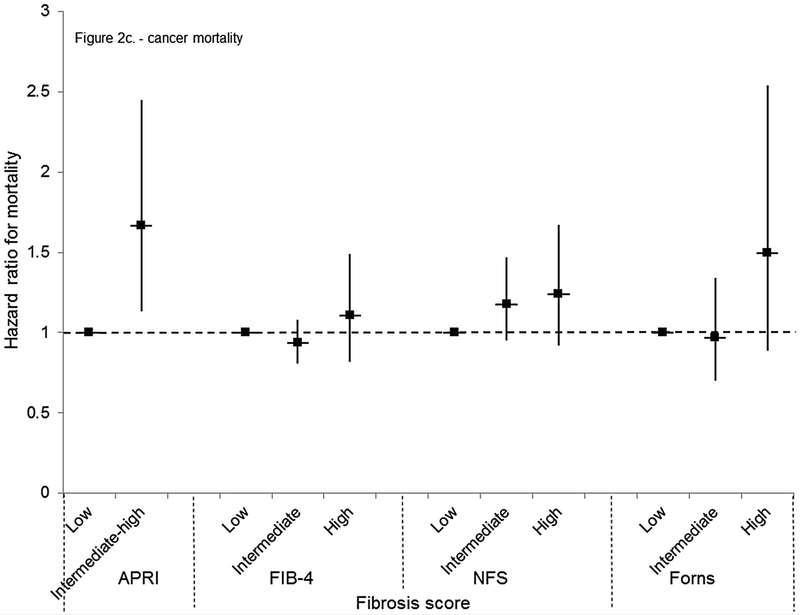
Multivariate-adjusted mortality hazard ratios and 95% confidence intervals by APRI, FIB-4, NFS, or Forns category in NHANES III, United States, 1988–2011. (A) All-cause mortality
(B) Cardiovascular disease mortality
(C) Mortality from neoplasms
(D) Diabetes mortality
(E) Liver disease mortality
NHANES, National Health and Nutrition Examination Survey; APRI, aspartate aminotransferase to platelet ratio index; FIB-4, fibrosis-4; NFS, non-alcoholic fatty liver disease fibrosis score.
Figure 3.
Multivariate-adjusted cumulative liver disease mortality by liver fibrosis score category in NHANES III, United States, 1988–2011. (A) APRI
(B) FIB-4
(C) NFS
(D) Forns
NHANES, National Health and Nutrition Examination Survey; APRI, aspartate aminotransferase to platelet ratio index; FIB-4, fibrosis-4; NFS, non-alcoholic fatty liver disease fibrosis score.
If liver disease mortality was defined based on underlying cause of death alone, rather than on any of the multiple causes recorded on the death certificate, there were 90 deaths. Similar to the main analysis, liver disease mortality risk was increased with intermediate and high fibrosis scores in unadjusted, age-adjusted, and multivariate-adjusted analyses; however, for intermediate levels some hazard ratios did not reach statistical significance due to smaller numbers of liver disease deaths (data not shown). When participants with viral hepatitis were included in analyses, there were 209 deaths with liver disease as underlying or contributing cause. Similar to the main analysis, liver disease mortality risk was increased with intermediate and high APRI, FIB-4, and Forns scores in unadjusted, age-adjusted, and multivariate-adjusted analyses and most relationships were stronger than in the main analysis due to the larger number of liver disease deaths (data not shown). The NFS, developed specifically for NAFLD, was not analyzed when persons with viral hepatitis were included.
Mortality from all causes was greater among persons with an intermediate-high APRI, high FIB-4, and intermediate or high NFS or Forns score when age-adjusted (Table 4). With multivariate adjustment, mortality risk was higher for an intermediate-high APRI (HR, 1.39; 95% CI, 1.08–1.79), intermediate (HR, 1.11; 95% CI, 1.01–1.22) or high (HR, 1.56; 95% CI, 1.29–1.88) FIB-4, high NFS (HR, 1.39; 95% CI, 1.20–1.60), and high Forns score (HR, 1.57; 95% CI, 1.19–2.08) (Figure 2a). When participants with viral hepatitis were included in analyses, there were 5,386 deaths from all causes. Results were similar to those of the main analysis (data not shown).
Cardiovascular disease mortality was increased with a high FIB-4 or Forns score or intermediate or high NFS in age-adjusted analyses (Table 4). In multivariate-adjusted analyses, an association remained only with a high FIB-4 (HR, 1.56; 95% CI, 1.17–2.08) (Figure 2b). Mortality from neoplasms was higher with an intermediate-high APRI or high NFS or Forns score in age-adjusted analyses (Table 4) and the risk remained with an intermediate-high APRI in multivariate-adjusted analyses (HR, 1.67; 95% CI, 1.13–2.45) (Figure 2c). Diabetes mortality was higher with an intermediate-high APRI or intermediate or high NFS or Forns score in age-adjusted analysis (Table 4). In multivariate-adjusted analyses, an association remained only with an intermediate (HR, 1.78; 95% CI, 1.23–2.58) or high (HR, 2.65; 95% CI, 1.28–5.48) Forns score (Figure 2d). Results for cardiovascular disease, neoplasms, and diabetes mortality were similar to those of the main analysis when outcomes were limited to underlying cause of death (data not shown) or when participants with viral hepatitis were included (data not shown).
DISCUSSION
In this U.S. population-based study with up to 23 years of follow-up, intermediate to high liver fibrosis scores among persons without viral hepatitis were associated with increased liver disease mortality. This relationship was consistent in age- and multivariate-adjusted analyses and across four fibrosis scores, both non-specific and specific for NAFLD. Intermediate to high fibrosis scores were also associated with increased overall mortality in age- and multivariate-adjusted analyses. Associations with higher mortality from cardiovascular disease, neoplasms, and diabetes were found inconsistently across fibrosis scores.
Fibrosis scores have been shown to predict histological fibrosis with reasonable accuracy in cross-sectional studies.(16–24) Fibrosis scores may also be useful as prognostic tools among persons with NAFLD, but this has been less studied. Hepatic steatosis on ultrasound and elevated liver enzyme activities, as noninvasive markers of fatty liver or non-alcoholic steatohepatitis, have been examined in relation to disease outcomes, including mortality.(38, 39) However, there have been few prospective studies of fibrosis scores well powered to predict liver-disease mortality and other long-term adverse hepatic outcomes.(40–42) A previous analysis of the NHANES III population with mortality follow-up through 2006, found higher overall and cardiovascular disease mortality in association with three of the same fibrosis scores among persons with suspected NAFLD.(26) Higher liver disease mortality was not reported in that analysis which had shorter follow-up and fewer liver-related deaths. In an international, multicenter study of 320 biopsy-diagnosed NAFLD patients followed for a median of 8.7 years, fibrosis scores, including NFS, APRI, and FIB-4, identified patients at increased risk for liver-related complications, all-cause mortality, and liver transplantation.(40) In a community-based study of 302 NAFLD patients identified through the Rochester Epidemiology Project and followed for a mean of 12 years, a higher NFS at baseline was predictive of increased overall mortality risk.(41) The latter two studies demonstrated that fibrosis scores predicted all-cause mortality, but neither was large enough to investigate disease-specific mortality. We are unaware of other well-powered prospective studies of prognostic ability of fibrosis scores in NAFLD patient cohorts or the general population.
A diagnosis of ‘NAFLD’ requires exclusion of significant alcohol intake (>21 drinks on average per week for men or >14 drinks on average per week for women).(43) However, because over two thirds of U.S. adults are now overweight or obese, mixed forms of NAFLD and alcoholic fatty liver disease are increasingly likely.(44, 45) Furthermore, the accuracy of self-reported alcohol consumption is unknown and clinical diagnosis based on patient-reported intake remains a potential source of misclassification between modest and significant alcohol use. In this analysis, we did not exclude persons based on their reported alcohol consumption; instead, we adjusted for alcohol intake in multivariate analyses to present a more comprehensive picture of the fatty liver disease epidemic. Furthermore, because characteristic features of non-alcoholic steatohepatitis, such as steatosis and inflammation, may diminish as fibrosis progresses, we did not limit our analysis to persons with steatosis on ultrasound and/or elevated liver enzymes, but studied the entire NHANES III population who were negative for viral hepatitis markers.(46, 47)
A limitation of using NHANES III to study fibrosis scores is reliance on single measurements of serum markers without a histological diagnosis. However, liver biopsies cannot be conducted on the general population. Imaging methods that use transient elastography to measure liver stiffness and serum markers that directly measure components of extracellular matrix may be more accurate than indirect serum markers, but were not performed in NHANES III. In addition, the scoring systems we studied provide a qualitative, not quantitative measure of fibrosis, and have not been validated in the general population. However, these fibrosis scores have been validated in patients with viral hepatitis, alcoholic liver disease, NAFLD, and other diseases.
Furthermore, a recent report suggested that the performance of the NFS and FIB-4 for identifying and excluding advanced fibrosis may vary across the life span with lower accuracy among young adults and lower specificity among older adults.(48) Another limitation of our study was lack of validation of cause of death. Although ascertainment of vital status using the National Death Index is high (>99%), assigning cause of death based on death certificate diagnoses can lead to misclassification. Finally, because participants were not reevaluated during follow-up, some may have developed increased fibrosis, leading to misclassification. However, we hypothesize that an increase in fibrosis scores would lead to a stronger association with liver disease mortality. Likewise, we did not have any longitudinal data on changes in other baseline participant characteristics which could lead to misclassification during the follow-up period. Assuming this misclassification was non-differential among study participants, our results may be skewed toward null and underestimate the strength of the associations of liver fibrosis scores with mortality outcomes. These limitations are balanced by the benefits of a representative population-based sample, particularly avoidance of ascertainment bias found in clinical studies of conveniently selected patients, and ability to generalize results to the U.S. population. Other important strengths were over two decades of mortality follow-up and availability of data on numerous predictors of liver disease mortality measured at baseline.
In conclusion, in the U.S. population, intermediate to high liver fibrosis scores were associated with increased liver disease mortality. Higher overall mortality was also associated with elevated fibrosis scores; however, relationships were inconsistent with mortality from cardiovascular disease, neoplasms, and diabetes. A 2012 American Gastroenterological Association practice guideline on the diagnosis and management of NAFLD recommended the clinical use of the NFS for identifying NAFLD patients with higher likelihood of having bridging fibrosis and/or cirrhosis.(43) Our study provides support for the use of fibrosis scores, including the NFS, for identifying persons at high risk for advanced fibrosis.(25, 49) Therefore, liver health management with fibrosis risk stratification merits further investigation with serial monitoring and targeted interventions.
ACKNOWLEDGMENTS
The NCHS was the source for the NHANES III Linked Mortality Files. All analyses, interpretations, and conclusions are those of the authors and not NCHS. The authors thank Patricia Barnes for assistance in using the NCHS Research Data Center.
Financial support: The work was supported by a contract from the National Institute of Diabetes and Digestive and Kidney Diseases (HHSN276201200161U).
List of abbreviations:
- APRI
aspartate aminotransferase to platelet ratio index
- FIB-4
fibrosis-4
- NFS
non-alcoholic fatty liver disease fibrosis score
- HR
hazard ratio
- NAFLD
non-alcoholic fatty liver disease
- NHANES
National Health and Nutrition Examination Survey
- ICD
International Classification of Diseases
- CI
confidence interval
Contributor Information
Aynur Unalp-Arida, National Institute of Diabetes and Digestive and Kidney Diseases, National Institutes of Health, Department of Health and Human Services, Two Democracy Plaza, Room 6009, 6707 Democracy Blvd., Bethesda, MD 20892-5458
Constance E. Ruhl, Social & Scientific Systems, Inc., 8757 Georgia Avenue, 12th floor, Silver Spring, MD 20910, 301-628-3272 (phone), 301-628-3201 (fax)
REFERENCES
- 1.Lazo M, Hernaez R, Eberhardt MS, Bonekamp S, Kamel I, Guallar E, et al. Prevalence of nonalcoholic fatty liver disease in the United States: the Third National Health and Nutrition Examination Survey, 1988–1994. Am J Epidemiol 2013;178:38–45. [DOI] [PMC free article] [PubMed] [Google Scholar]
- 2.Bedogni G, Miglioli L, Masutti F, Tiribelli C, Marchesini G, Bellentani S. Prevalence of and risk factors for nonalcoholic fatty liver disease: the Dionysos nutrition and liver study. Hepatology 2005;42:44–52. [DOI] [PubMed] [Google Scholar]
- 3.Satapathy SK, Sanyal AJ. Epidemiology and Natural History of Nonalcoholic Fatty Liver Disease. Semin Liver Dis 2015;35:221–235. [DOI] [PubMed] [Google Scholar]
- 4.Rinella M, Charlton M. The globalization of nonalcoholic fatty liver disease: Prevalence and impact on world health. Hepatology 2016;64:19–22. [DOI] [PubMed] [Google Scholar]
- 5.Younossi ZM, Koenig AB, Abdelatif D, Fazel Y, Henry L, Wymer M. Global epidemiology of nonalcoholic fatty liver disease-Meta-analytic assessment of prevalence, incidence, and outcomes. Hepatology 2016;64:73–84. [DOI] [PubMed] [Google Scholar]
- 6.Matteoni CA, Younossi ZM, Gramlich T, Boparai N, Liu YC, McCullough AJ. Nonalcoholic fatty liver disease: a spectrum of clinical and pathological severity. Gastroenterology 1999;116:1413–1419. [DOI] [PubMed] [Google Scholar]
- 7.Kleiner DE, Brunt EM. Nonalcoholic fatty liver disease: pathologic patterns and biopsy evaluation in clinical research. Semin Liver Dis 2012;32:3–13. [DOI] [PubMed] [Google Scholar]
- 8.Teli MR, James OF, Burt AD, Bennett MK, Day CP. The natural history of nonalcoholic fatty liver: a follow-up study. Hepatology 1995;22:1714–1719. [PubMed] [Google Scholar]
- 9.Dam-Larsen S, Franzmann M, Andersen IB, Christoffersen P, Jensen LB, Sorensen TI, et al. Long term prognosis of fatty liver: risk of chronic liver disease and death. Gut 2004;53:750–755. [DOI] [PMC free article] [PubMed] [Google Scholar]
- 10.Marengo A, Jouness RI, Bugianesi E. Progression and Natural History of Nonalcoholic Fatty Liver Disease in Adults. Clin Liver Dis 2016;20:313–324. [DOI] [PubMed] [Google Scholar]
- 11.Adams LA, Lymp JF, St Sauver J, Sanderson SO, Lindor KD, Feldstein A, et al. The natural history of nonalcoholic fatty liver disease: a population-based cohort study. Gastroenterology 2005;129:113–121. [DOI] [PubMed] [Google Scholar]
- 12.Ekstedt M, Franzen LE, Mathiesen UL, Thorelius L, Holmqvist M, Bodemar G, et al. Long-term follow-up of patients with NAFLD and elevated liver enzymes. Hepatology 2006;44:865–873. [DOI] [PubMed] [Google Scholar]
- 13.Ekstedt M, Hagstrom H, Nasr P, Fredrikson M, Stal P, Kechagias S, et al. Fibrosis stage is the strongest predictor for disease-specific mortality in NAFLD after up to 33 years of follow-up. Hepatology 2015;61:1547–1554. [DOI] [PubMed] [Google Scholar]
- 14.Goh GB, McCullough AJ. Natural History of Nonalcoholic Fatty Liver Disease. Dig Dis Sci 2016;61:1226–1233. [DOI] [PMC free article] [PubMed] [Google Scholar]
- 15.Angulo P, Kleiner DE, Dam-Larsen S, Adams LA, Bjornsson ES, Charatcharoenwitthaya P, et al. Liver Fibrosis, but No Other Histologic Features, Is Associated With Long-term Outcomes of Patients With Nonalcoholic Fatty Liver Disease. Gastroenterology 2015;149:389–397 e310. [DOI] [PMC free article] [PubMed] [Google Scholar]
- 16.Sterling RK, Lissen E, Clumeck N, Sola R, Correa MC, Montaner J, et al. Development of a simple noninvasive index to predict significant fibrosis in patients with HIV/HCV coinfection. Hepatology 2006;43:1317–1325. [DOI] [PubMed] [Google Scholar]
- 17.Vallet-Pichard A, Mallet V, Nalpas B, Verkarre V, Nalpas A, Dhalluin-Venier V, et al. FIB-4: an inexpensive and accurate marker of fibrosis in HCV infection. comparison with liver biopsy and fibrotest. Hepatology 2007;46:32–36. [DOI] [PubMed] [Google Scholar]
- 18.Shah AG, Lydecker A, Murray K, Tetri BN, Contos MJ, Sanyal AJ. Comparison of noninvasive markers of fibrosis in patients with nonalcoholic fatty liver disease. Clin Gastroenterol Hepatol 2009;7:1104–1112. [DOI] [PMC free article] [PubMed] [Google Scholar]
- 19.Wai CT, Greenson JK, Fontana RJ, Kalbfleisch JD, Marrero JA, Conjeevaram HS, et al. A simple noninvasive index can predict both significant fibrosis and cirrhosis in patients with chronic hepatitis C. Hepatology 2003;38:518–526. [DOI] [PubMed] [Google Scholar]
- 20.Cales P, Laine F, Boursier J, Deugnier Y, Moal V, Oberti F, et al. Comparison of blood tests for liver fibrosis specific or not to NAFLD. J Hepatol 2009;50:165–173. [DOI] [PubMed] [Google Scholar]
- 21.Tapper EB, Krajewski K, Lai M, Challies T, Kane R, Afdhal N, et al. Simple non-invasive biomarkers of advanced fibrosis in the evaluation of non-alcoholic fatty liver disease. Gastroenterol Rep (Oxf) 2014;2:276–280. [DOI] [PMC free article] [PubMed] [Google Scholar]
- 22.Forns X, Ampurdanes S, Llovet JM, Aponte J, Quinto L, Martinez-Bauer E, et al. Identification of chronic hepatitis C patients without hepatic fibrosis by a simple predictive model. Hepatology 2002;36:986–992. [DOI] [PubMed] [Google Scholar]
- 23.Adler M, Gulbis B, Moreno C, Evrard S, Verset G, Golstein P, et al. The predictive value of FIB-4 versus FibroTest, APRI, FibroIndex and Forns index to noninvasively estimate fibrosis in hepatitis C and nonhepatitis C liver diseases. Hepatology 2008;47:762–763; author reply 763. [DOI] [PubMed] [Google Scholar]
- 24.Angulo P, Hui JM, Marchesini G, Bugianesi E, George J, Farrell GC, et al. The NAFLD fibrosis score: a noninvasive system that identifies liver fibrosis in patients with NAFLD. Hepatology 2007;45:846–854. [DOI] [PubMed] [Google Scholar]
- 25.Dyson JK, McPherson S, Anstee QM. Non-alcoholic fatty liver disease: non-invasive investigation and risk stratification. J Clin Pathol 2013;66:1033–1045. [DOI] [PubMed] [Google Scholar]
- 26.Kim D, Kim WR, Kim HJ, Therneau TM. Association between noninvasive fibrosis markers and mortality among adults with nonalcoholic fatty liver disease in the United States. Hepatology 2013;57:1357–1365. [DOI] [PMC free article] [PubMed] [Google Scholar]
- 27.NCHS. Plan and operation of the Third National Health and Nutrition Examination Survey, 1988–94. (Vital and health statistics, series 1: programs and collection procedures, no. 32). Hyattsville, MD: National Center for Health Statistics; 1994. (DHHS publication no. (PHS) 94–1308). p. 321 https://www.cdc.gov/nchs/nhanes/nhanes3/survey_methods.htm. Accessed February 2017. [PubMed] [Google Scholar]
- 28.Ruhl CE, Everhart JE. Determinants of the association of overweight with elevated serum alanine aminotransferase activity in the United States. Gastroenterology 2003;124:71–79. [DOI] [PubMed] [Google Scholar]
- 29.Ruhl CE, Everhart JE. Coffee and caffeine consumption reduce the risk of elevated serum alanine aminotransferase activity in the United States. Gastroenterology 2005;128:24–32. [DOI] [PubMed] [Google Scholar]
- 30.NCHS. National Health and Nutrition Examination Survey III; Body Measurements (Anthropometry). Rockville, MD: Westat, 1988. http://www.cdc.gov/nchs/nhanes/nh3rrm.htm#manuals/anthro[1].pdf. Accessed February 2017. [Google Scholar]
- 31.Gunter EW, Lewis BG, Koncikowski SM. Laboratory procedures used for the Third National Health and Nutrition Examination Survey (NHANES III), 1988–1994. Atlanta, GA: National Center for Environmental Health, Center for Disease Control and Prevention; 1996. http://www.cdc.gov/nchs/nhanes/nh3rrm.htm#manuals/Labman[1].pdf. Accessed February 2017. [Google Scholar]
- 32.Angulo P, Keach JC, Batts KP, Lindor KD. Independent predictors of liver fibrosis in patients with nonalcoholic steatohepatitis. Hepatology 1999;30:1356–1362. [DOI] [PubMed] [Google Scholar]
- 33.NCHS. Office of Analysis and Epidemiology NCHS 2011 Linked Mortality Files Matching Methodology, September, 2013. Hyattsville, Maryland: Available at the following address:http://www.cdc.gov/nchs/data/datalinkage/2011_linked_mortality_file_matching_methodology.pdf. Accessed February 2017. [Google Scholar]
- 34.Menke A, Muntner P, Batuman V, Silbergeld EK, Guallar E. Blood lead below 0.48 micromol/L (10 microg/dL) and mortality among US adults. Circulation 2006;114:1388–1394. [DOI] [PubMed] [Google Scholar]
- 35.NCHS. NCHS Research Data Center (RDC). http://www.cdc.gov/rdc/. Accessed February 2017. [Google Scholar]
- 36.Kleinbaum DG. Survival Analysis: A Self-Learning Text. New York, NY: Springer, 1996. [Google Scholar]
- 37.Breslow NE, Day NE. Statistical Methods in Cancer Research: the Design and Analysis of Cohort Studies. Lyon, France: International Agency for Research on Cancer, 1987; 48–79. [PubMed] [Google Scholar]
- 38.Unalp-Arida A, Ruhl CE. Noninvasive fatty liver markers predict liver disease mortality in the U.S. population. Hepatology 2016;63:1170–1183. [DOI] [PMC free article] [PubMed] [Google Scholar]
- 39.Lazo M, Hernaez R, Bonekamp S, Kamel IR, Brancati FL, Guallar E, et al. Non-alcoholic fatty liver disease and mortality among US adults: prospective cohort study. BMJ 2011;343:d6891. [DOI] [PMC free article] [PubMed] [Google Scholar]
- 40.Angulo P, Bugianesi E, Bjornsson ES, Charatcharoenwitthaya P, Mills PR, Barrera F, et al. Simple noninvasive systems predict long-term outcomes of patients with nonalcoholic fatty liver disease. Gastroenterology 2013;145:782–789 e784. [DOI] [PMC free article] [PubMed] [Google Scholar]
- 41.Treeprasertsuk S, Bjornsson E, Enders F, Suwanwalaikorn S, Lindor KD. NAFLD fibrosis score: a prognostic predictor for mortality and liver complications among NAFLD patients. World J Gastroenterol 2013;19:1219–1229. [DOI] [PMC free article] [PubMed] [Google Scholar]
- 42.Sebastiani G, Alshaalan R, Wong P, Rubino M, Salman A, Metrakos P, et al. Prognostic Value of Non-Invasive Fibrosis and Steatosis Tools, Hepatic Venous Pressure Gradient (HVPG) and Histology in Nonalcoholic Steatohepatitis. PLoS One 2015;10:e0128774. [DOI] [PMC free article] [PubMed] [Google Scholar]
- 43.Chalasani N, Younossi Z, Lavine JE, Diehl AM, Brunt EM, Cusi K, et al. The diagnosis and management of non-alcoholic fatty liver disease: practice Guideline by the American Association for the Study of Liver Diseases, American College of Gastroenterology, and the American Gastroenterological Association. Hepatology 2012;55:2005–2023. [DOI] [PubMed] [Google Scholar]
- 44.Ogden CL, Carroll MD, Kit BK, Flegal KM. Prevalence of childhood and adult obesity in the United States, 2011–2012. JAMA 2014;311:806–814. [DOI] [PMC free article] [PubMed] [Google Scholar]
- 45.Ruhl CE, Everhart JE. Joint effects of body weight and alcohol on elevated serum alanine aminotransferase in the United States population. Clin Gastroenterol Hepatol 2005;3:1260–1268. [DOI] [PubMed] [Google Scholar]
- 46.Adams LA, Sanderson S, Lindor KD, Angulo P. The histological course of nonalcoholic fatty liver disease: a longitudinal study of 103 patients with sequential liver biopsies. J Hepatol 2005;42:132–138. [DOI] [PubMed] [Google Scholar]
- 47.Angulo P GI epidemiology: nonalcoholic fatty liver disease. Aliment Pharmacol Ther 2007;25:883–889. [DOI] [PubMed] [Google Scholar]
- 48.McPherson S, Hardy T, Dufour JF, Petta S, Romero-Gomez M, Allison M, et al. Age as a Confounding Factor for the Accurate Non-Invasive Diagnosis of Advanced NAFLD Fibrosis. Am J Gastroenterol 2016. [DOI] [PMC free article] [PubMed] [Google Scholar]
- 49.Tapper EB, Hunink MG, Afdhal NH, Lai M, Sengupta N. Cost-Effectiveness Analysis: Risk Stratification of Nonalcoholic Fatty Liver Disease (NAFLD) by the Primary Care Physician Using the NAFLD Fibrosis Score. PLoS One 2016;11:e0147237. [DOI] [PMC free article] [PubMed] [Google Scholar]


