Abstract
Maslinic acid is a pentacyclic triterpenoid that is distributed in the peel of olives. Previous studies found that maslinic acid inhibited inflammatory response and antioxidant effects. We investigated whether maslinic acid ameliorates nonalcoholic fatty liver disease in mice with high-fat-diet (HFD)–induced obesity and evaluated the regulation of lipogenesis in hepatocytes. Male C57BL/6 mice fed a normal diet or HFD (60% fat, w/w) were tested for 16 wk. After the fourth week, mice were injected intraperitoneally with maslinic acid for 12 wk. In another experiment, HepG2 cells were treated with oleic acid to induce lipid accumulation or maslinic acid to evaluate lipogenesis. Maslinic acid significantly reduced body weight compared with HFD-fed mice. Maslinic acid reduced liver weight and liver lipid accumulation and improved hepatocyte steatosis. Furthermore, serum glucose, leptin, and free fatty acid concentrations significantly reduced, but the serum adiponectin concentration was higher, in the maslinic acid group than in the HFD group. In liver tissue, maslinic acid suppressed transcription factors involved in lipogenesis and increased adipose triglyceride lipase. In vitro, maslinic acid decreased lipogenesis by activating AMPK. These findings suggest that maslinic acid acts against hepatic steatosis by regulating enzyme activity involved in lipogenesis, lipolysis, and fatty acid oxidation in the liver.—Liou, C.-J., Dai, Y.-W., Wang, C.-L., Fang, L.-W., Huang, W.-C. Maslinic acid protects against obesity-induced nonalcoholic fatty liver disease in mice through regulation of the Sirt1/AMPK signaling pathway.
Keywords: HepG2, lipogenesis, lipolysis, hepatic steatosis
Obesity is a chronic inflammatory disease and is considered to be a major underlying factor in chronic diseases, including hypertension, hyperlipidemia, stroke, and diabetes (1). Many studies have also found that obesity can induce abnormal lipid metabolism in the liver, developing into nonalcoholic fatty liver disease (NAFLD) (2). NAFLD is a complex chronic hepatitis involving multiple steps toward reduced liver function and metabolic disorders (3). Studies have demonstrated that initial symptoms of hepatic steatosis are characterized by an excessive accumulation of triglycerides in hepatocytes (2). If the patient does not properly maintain their weight and a balanced diet, the condition may gradually deteriorate and develop into nonalcoholic steatohepatitis, irreversible liver fibrosis, or cirrhosis, and, ultimately, hepatocellular carcinoma (3).
Excessive free fatty acids in the diet enter the liver for triglyceride and lipid synthesis, forming oil droplets and accumulating in the liver (4). These triglycerides can be stored as energy or are metabolized to produce energy to maintain the normal physiologic function of cells and tissues (5). However, obesity and being overweight are often accompanied by excessive triglyceride and cholesterol in the serum, causing cardiovascular diseases, and a large amount of free fatty acids that enter the liver and interfere with lipid storage and metabolism (6). Many studies have found that CCAAT/enhancer-binding protein (C/EBP), peroxisome proliferator–activated receptor (PPAR), and sterol regulatory element–binding protein 1c (SREBP-1c) are important transcription factors for regulating fatty acid synthase (FAS) gene expression and controlling the synthesis of fatty acid chains and lipid biosynthesis in the liver (7). Therefore, blocking transcription factors involved in lipogenesis could reduce triglyceride synthesis and ameliorate hepatic steatosis.
Improving lipolysis is also an effective strategy for improving lipid accumulation in fatty liver, but decomposition of triglycerides requires lipolytic enzymes, including adipose triglyceride lipase (ATGL) and hormone-sensitive lipase (HSL), resulting in free fatty acids and glycerol (8). Therefore, accelerating the decomposition of lipids could assist NAFLD in restoring normal liver function and improving lipid metabolism in the liver.
Sirtuin 1 (Sirt1) is a NAD+-dependent deacetylase that regulates intracellular NAD+ levels to maintain energy balance. Sirt1 expression also induces AMPK phosphorylation to regulate lipid and glucose metabolism (9). AMPK phosphorylation could stimulate acetyl CoA carboxylase (ACC) phosphorylation, reducing lipid biosynthesis. Recent research found that the Sirt1/AMPK pathway is an important regulator sensor for energy balance (10). Excessive lipid accumulation in adipocytes and hepatocytes will suppress the activity of Sirt1 and reduce the energy regulation capacity of AMPK (11). Therefore, promoting Sirt1/AMPK pathway activity would contribute to a reduction in lipid accumulation and improve hepatic steatosis.
Maslinic acid (2α, 3β-dihydroxiolean-12-en-28-oic acid) is a pentacyclic triterpenoid compound widely distributed in the peel of olives, mustard, basil, and hawthorn (12). Previous studies have found that maslinic acid can inhibit inflammatory responses, with strong antitumor, antibacterial, and antioxidant effects (13–15). Maslinic acid has been found to increase glucose uptake and suppress lipid accumulation in 3T3-L1 adipocytes (16).
In the present study, we investigated whether maslinic acid modulates lipid metabolism and ameliorates NAFLD in high-fat-diet (HFD)-induced obese mice and regulates lipogenesis and lipolysis in HepG2 hepatocytes in vitro.
MATERIALS AND METHODS
Animals and treatments
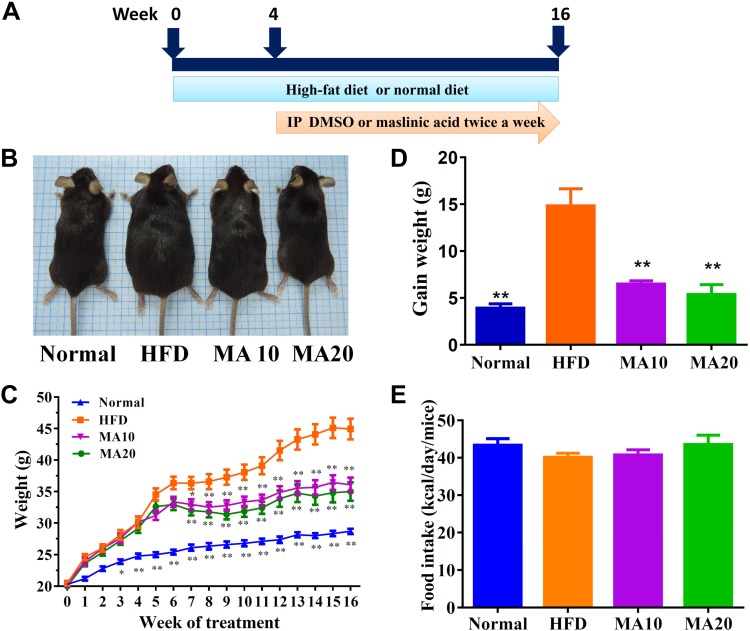
Male C57BL/6 mice (4 wk old) were procured from the National Laboratory Animal Center (Taipei City, Taiwan). All mice were randomly divided into 4 groups of 12. The normal control group (N) was fed a standard chow diet and administered DMSO by intraperitoneal injection. The HFD control group (HFD) was fed an HFD containing 60% fat. The MA10 and MA20 groups were fed an HFD and administered 10 mg/kg and 20 mg/kg maslinic acid (purity ≥98%, MilliporeSigma, Burlington, MA, USA), respectively, by intraperitoneal injection. The HFD, MA10, and MA20 groups were fed the HFD for 4 wk and then treated with 50 μl DMSO or maslinic acid (dissolved in DMSO) twice a week for the last 12 wk (Fig. 1A). Food intake was defined as the weight of consumed food (g) × calories in the diet per day; dietary intake was monitored per day and body weight was recorded weekly. Animal experiments were approved by the Laboratory Animal Care Committee of Chang Gung University of Science and Technology (Institutional Animal Care and Use Committee Approval: 2016-023).
Figure 1.
Maslinic acid reduced body weight in mice with HFD-induced obesity. A) Male mice were fed an HFD (containing 60% fat) for 16 wk and administered DMSO, 10 mg/kg maslinic acid (MA10), or 20 mg/kg maslinic acid (MA20) via intraperitoneal injection (I.P.) twice a week from wk 4 to 16. B) The appearance of the mice. C) Body weight was measured for 16 wk. D, E) Weight gain was measured in the last week (D), and food intake monitored each day (E). Data are presented as means ± sem; n = 12. *P < 0.05, **P < 0.01 compared with HFD-induced obesity.
Biochemical analysis
Mice were anesthetized with 4% isoflurane and blood sampled via the orbital vascular plexus. The blood was centrifuged at 6000 rpm for 5 min, and the serum to assay the levels of free fatty acids was collected using a Fatty Acid Quantitation Kit (MilliporeSigma) according to the manufacturer’s protocol. The serum levels of HDL, LDL, total triglycerides (TGs), total cholesterol (TC), aspartate aminotransferase (AST), and alanine aminotransferase (ALT) were detected using a biochemical analyzer (Dri-Chem NX500; Fuji, Tokyo, Japan). In addition, the day before the end of the animal experiments, mice were unfed for 16 h and glucose was given by intraperitoneal injection to assay blood insulin levels using the Insulin Enzyme-Linked Immunosorbent Assay (EIA) Kit (Cayman Chemical Co., Ann Arbor, MI, USA) and blood glucose levels using a biochemical analyzer (Fuji; National Institutes of Health, Bethesda, MD, USA). Liver glycogen levels were detected using the Glycogen Assay Kit (Cayman Chemical Co.) based on the absorbance at 570 nm using a microplate reader (Multiskan FC; Thermo Fisher Scientific, Waltham, MA, USA).
ELISA assay
Serum was assayed to detect TNF-α, leptin, and adiponectin levels using specific ELISA kits (R&D Systems, Minneapolis, MN, USA) according to the manufacturer’s instructions. The value of absorbance was measured using a microplate reader (Multiskan FC) at 450 nm.
Histologic analysis
Liver and adipose tissues were fixed with formalin and embedded in paraffin. All tissue samples were cut into 6-μm sections and stained using hematoxylin and eosin (H&E) as previously described (17). In liver tissue, glycogen accumulation was detected by periodic acid-Schiff (PAS) staining (18). Biopsy specimens were inspected using a light microscope (Olympus, Tokyo, Japan), and the NAFLD score was evaluated as previously described (19).
Immunohistochemical staining
Paraffin-embedded sections of liver tissues were incubated with primary antibody (1:50) overnight, followed by secondary antibody as previously described (20). The slides were treated with DAB substrate solution to detect carnitine palmitoyltransferase I (CPT-1), F4/80, FAS, and Sirt1 expression.
Real-time PCR
Total RNA was extracted from liver tissues and cDNA synthesized using a cDNA Synthesis Kit (Thermo Fisher Scientific) as previously described (21). Specific gene expression was detected using fluorescently labeled SYBR Green and amplified using a spectrofluorometric thermal cycler (iCycler; Bio-Rad, Hercules, CA, USA).
The primers are provided in Table 1.
TABLE 1.
Primers used for real-time PCR analysis of genes involved in lipogenesis and lipolysis
| Sequence, 5′–3′ |
||
|---|---|---|
| Gene | Forward | Reverse |
| PPAR-γ | GATGACAGCGACTTGGCAAT | TGTAGCAGGTTGTCTTGAATGT |
| C/EBP-β | GTCCAAACCAACCGCACAT | CAGAGGGAGAAGCAGAGAGTT |
| SREBP-1c | CTGTTGGTGCTCGTCTCCT | TTGCGATGCCTCCAGAAGTA |
| FAS | ATCCTGGCTGACGAAGACTC | TGCTGCTGAGGTTGGAGAG |
| ATGL | GATTGCGAAGGTTGAACTGGAT | CTCAGGCGAGAGTGACATCT |
| HSL | CGGCGGCTGTCTAATGTCT | CGTTGGCTGGTGTCTCTGT |
| Sirt1 | CGTCTTGTCCTCTAGTTCCTGT | GCCTCTCCGTATCATCTTCCA |
| CPT-1 | GAGCCAGACCTTGAAGTAACG | GAGACAGACACCATCCAACAC |
| CPT-2 | TTGACCAGTGAGAACCGAGAT | AGAGGCAGAAGACAGCAGAG |
| TNF-α | GCACCACCATCAAGGACTC | AGGCAACCTGACCACTCTC |
| β-actin | AAGACCTCTATGCCAACACAGT | AGCCAGAGCAGTAATCTCCTTC |
Western blot analysis
Protein extracts were prepared using a Mammalian Cell Lysis Kit (MilliporeSigma) and the proteins separated by 8–10% SDS-PAGE as previously described (22). The proteins were transferred from the gels onto PVDF membrane, which was then incubated with specific primary antibodies overnight at 4°C, followed by secondary antibodies for 1 h at room temperature. Luminol/Enhancer solution (MilliporeSigma) was used to detect protein signals using the UVP BioSpectrum 600 system (Thermo Fisher Scientific). The specific primary antibodies were C/EBP-α, C/EBP-β, PPAR-α, PPAR-γ, ATGL, HSL, phosphorylated (p)HSL, ACC-1, pACC-1 (Abcam, Cambridge, MA, USA), CPT-1, CPT2, AMPK-α, pAMPK-α, Serbp-1c, FAS, Sirt1 (Cell Signaling Technology, Danvers, MA, USA), and β-actin (MilliporeSigma).
Cell culture and induced fatty liver cells
The HepG2 hepatocyte cell line was purchased from the Bioresource Collection and Research Center (Hsinchu, Taiwan), and the cells were cultured in DMEM (Thermo Fisher Scientific) medium. For cell viability assays, maslinic acid was dissolved in DMSO, and in all cell experiments, <0.1% DMSO. HepG2 cells were treated with various concentrations of maslinic acid for 24 h to investigate cell viability using MTT solution (MilliporeSigma) as previously described (23). The culture medium was treated with 100% isopropanol to detect absorption, and cell viability was evaluated at 550 nm using a microtiter plate reader (Multiskan FC). For lipid accumulation in hepatocytes, HepG2 cells were plated on 6-well plates at a density of 2 × 10⁴ cells and incubated with oleic acid (0.5 mM) to stimulate lipid accumulation for 48 h. The cells were then left with vehicle (0.1% DMSO) or maslinic acid (6.25–50 μM) for 24 h to investigate the molecular mechanism of lipid metabolism. In other cellular experiments, maslinic acid–treated HepG2 cells were treated with the AMPK activator 5-aminoimidazole-4-carboxamide-1-β-d-ribofuranoside (AICAR; MilliporeSigma) or AMPK inhibitor compound C (MilliporeSigma) to investigate the molecular expression of lipid metabolism.
Effect of maslinic acid on hepatic lipid accumulation and lipoperoxidation
HepG2 cells were plated on a 6-well plate and incubated with oleic acid for 48 h. The cells were then treated with or without maslinic acid for 24 h. HepG2 cells were stained with the fluorescent probes boron-dipyrromethene (Bodipy) 493/503 and Bodipy 581/591 [11C] (Thermo Fisher Scientific) to detect lipid accumulation and lipoperoxidation, respectively, as previously described (24). Cell nuclei were stained with DAPI (MilliporeSigma). All cellular fluorescent images were observed using a fluorescence microscope (Olympus).
Effect of maslinic acid on hepatic fatty acid uptake
HepG2 cells were incubated with 0.5 mM oleic acid for 48 h, and then the cells were treated with 50 μM maslinic acid for 24 h. Next, cells were stained with the fluorescent probe Bodipy FL C12 (Thermo Fisher Scientific) to detect fatty acid uptake using a fluorescence microscope (Olympus).
Oil Red O staining
HepG2 cells were plated on 6-well plates and incubated with oleic acid for 48 h. The cells were then treated with or without maslinic acid (0–50 μM) for 24 h. The plate was washed with PBS, and the cells were fixed with formalin and stained with Oil Red O to evaluate oil droplets as previously described (24). Oil droplet images were obtained using an inverted microscope (Olympus). Hepatocytes were treated with isopropanol to measure lipid accumulation using a microplate reader (Multiskan FC) at an absorbance of 490 nm.
Statistical analysis
Statistical analyses were performed using 1-way ANOVA and a Dunnett post hoc test. Data are expressed as the mean ± sem of a minimum of 3 independent experiments. A value of P < 0.05 was considered significant.
RESULTS
Maslinic acid reduced HFD-induced obesity in mice
Mice were divided into 6 groups (4 mice/group) and injected intraperitoneally with normal saline, DMSO, or various doses of maslinic acid, including 5, 10, 20, and 50 mg/kg for 14 consecutive days. We found 50 mg/kg maslinic acid has no toxins that affect the survival rate of mice (Supplemental Table S1). Hence, subsequent experiments used maslinic acid at 10 and 20 mg/kg for all animal experiments. Visual observation at the end of the animal experiments found that HFD mice were larger than normal mice. The MA20 and MA10 mice had lost significant body weight compared with the HFD mice in the last few weeks of the experiment (34.3 ± 1.23 and 36.55 ± 1.07 vs. 45.23 ± 1.57 g, respectively, both P < 0.01; Fig. 1B, C). As maslinic acid was given for 12 wk, the weight gain in the MA groups was significantly less than that in the HFD group (MA10: 6.49 ± 0.94 g, MA20: 5.37 ± 1.05 g, HFD: 14.28 ± 1.81 g; P < 0.01; Fig. 1D). We also found that the MA10 and MA20 groups did not have altered food intake compared with HFD mice (Fig. 1E).
Maslinic acid attenuated the weight of adipose tissue in obese mice
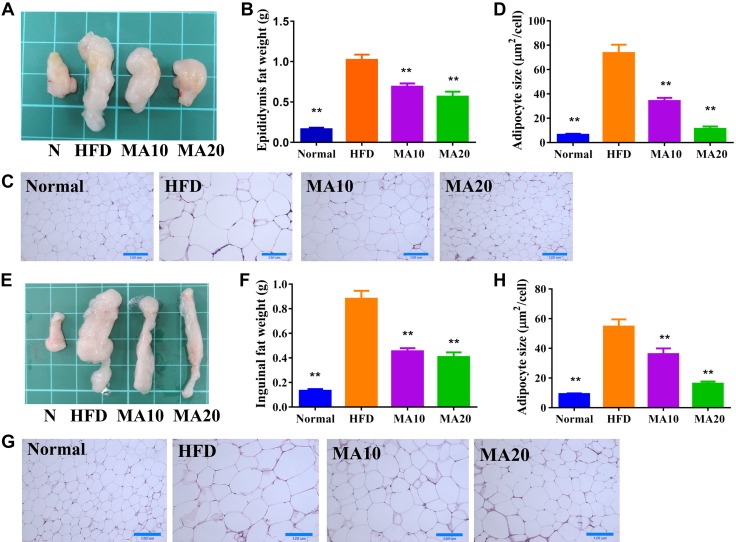
Grossly, maslinic acid significantly reduced the epididymal (Fig. 2A, B) and inguinal (Fig. 2E, F) adipose tissue weight compared with HFD mice. Histologic staining and analysis of adipose tissue showed that maslinic acid significantly decreased adipocyte size in the epididymal (Fig. 2C, D) and inguinal (Fig. 2G, H) adipose tissue of mice treated with maslinic acid compared with HFD mice.
Figure 2.
Maslinic acid (MA) reduced the epididymal and inguinal adipose tissue weight in HFD-induced obese mice. A, B) The appearance (A) and weight (B) of epididymal adipose tissue. C) HE staining of epididymal adipose tissue (original magnification, ×200). D) Adipocyte size in epididymal adipose tissue. E, F) The appearance (E) and weight (F) of inguinal adipose tissue. G) HE staining of inguinal adipose tissue (original magnification, ×200). H) Adipocyte size in inguinal adipose tissue. Data are presented as means ± sem; n = 12. *P < 0.05, **P < 0.01 compared with HFD-induced obesity.
Maslinic acid attenuated liver steatosis in obese mice
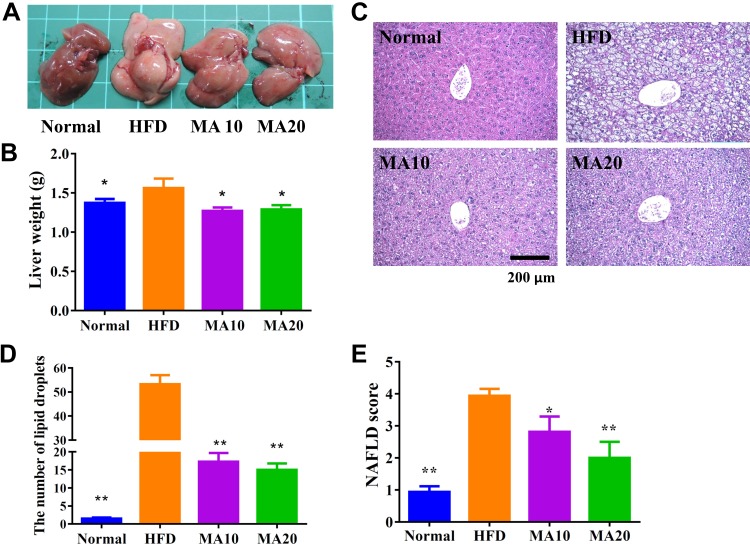
Grossly, the livers of the normal mice were dark brown-red, but the livers of the mice with HFD-induced obesity were lackluster and light yellow in color (Fig. 3A). Our results demonstrate that the dark brown-red color of the liver recovered in mice with HFD-induced obesity treated with maslinic acid. We also found that maslinic acid eliminated the liver weight compared with obese mice (Fig. 3B). H&E staining and analysis of liver tissue revealed fat vacuoles and lipid droplets in HFD mice, the number of which was significantly decreased in HFD mice treated with maslinic acid (Fig. 3C, D). Furthermore, HFD mice treated with maslinic acid had significantly reduced NAFLD scores compared with HFD mice (Fig. 3E).
Figure 3.
Maslinic acid (MA) ameliorated hepatic steatosis in HFD-induced obese mice. A–C) The appearance of the liver (A), liver weight (B), and HE staining of liver tissues (C) (original magnification, ×200). D) Calculated number of lipid droplets in liver tissue. E) NAFLD scores based on the evaluation of H&E staining of liver tissues. Data are presented as means ± sem; n = 12. *P < 0.05, **P < 0.01 compared with HFD-induced obesity.
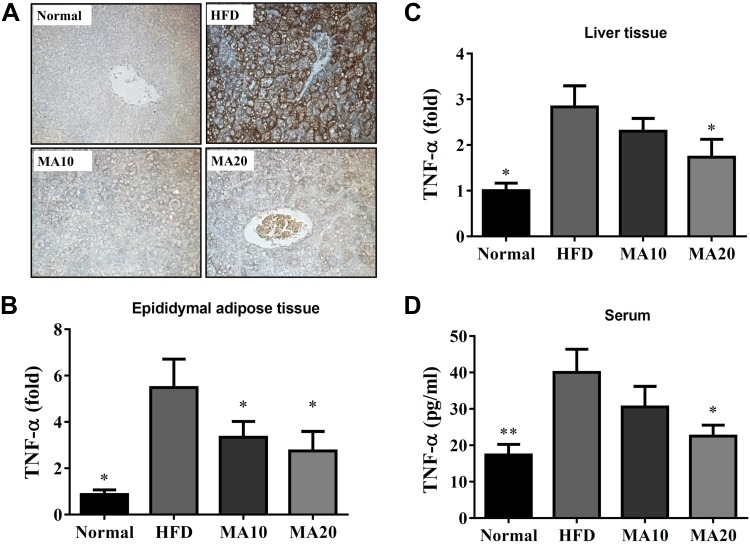
Moreover, immunohistochemistry revealed a large amount of F4/80 (macrophage marker) in the livers of HFD mice compared with the N group. Maslinic acid could decrease macrophage infiltration in the livers of mice with HFD-induced obesity (Fig. 4A). Maslinic acid could suppress TNF-α gene expression of liver and epididymal adipose tissue compared with HFD mice (Fig. 4B, C). Maslinic acid also significantly decreased the levels of TNF-α in the serum of mice with HFD-induced obesity (Fig. 4D).
Figure 4.
Effects of maslinic acid (MA) on inflammatory response in mouse. A) MA modulated F4/80 expression in the liver (brown color drop) by immunohistochemical staining. B, C) Gene expression levels of TNF-α in epididymal adipose tissue (B) and liver tissue (C) were determined using real-time PCR. D) MA modulated TNF-α levels in the serum. Three independent experiments were analyzed, and the data are presented as the means ± sem; n = 12. *P < 0.05 compared with HFD-induced obesity.
Maslinic acid regulated adipogenesis in liver tissue
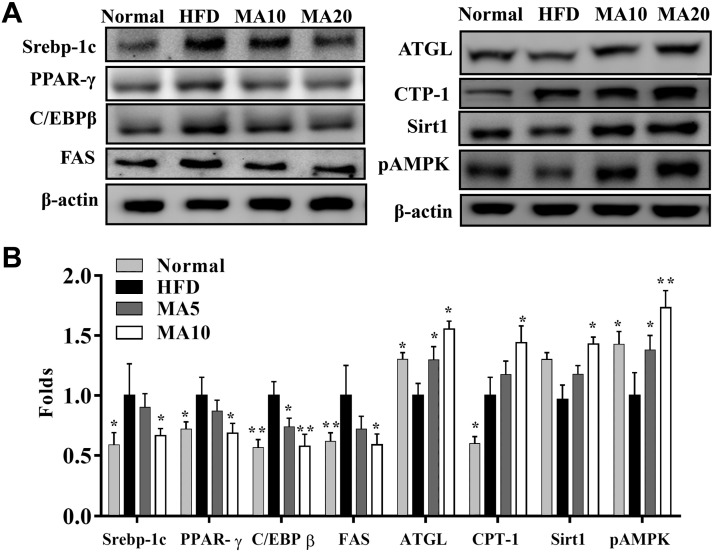
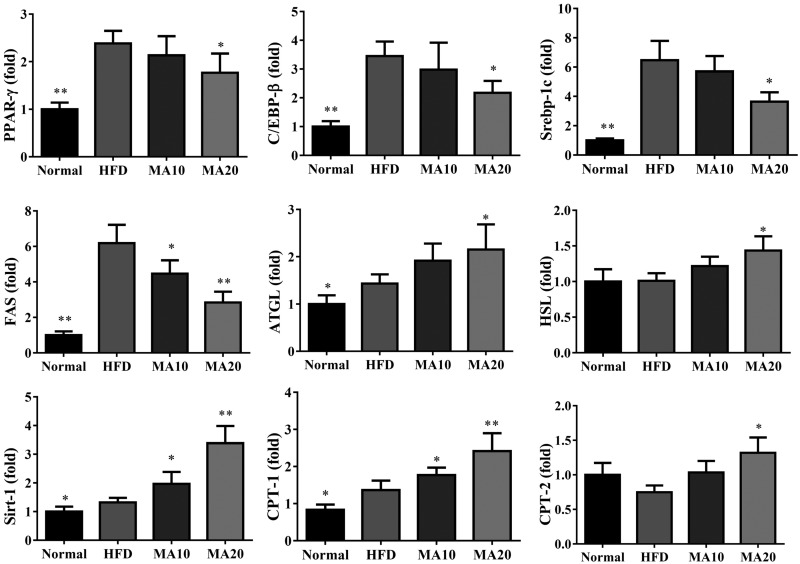
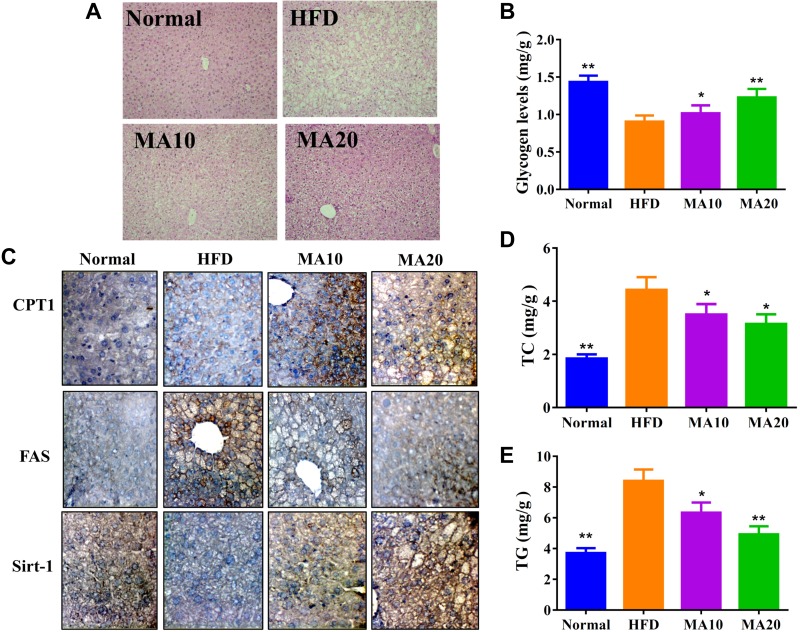
Maslinic acid suppressed the expression of transcription factors Srebp-1c, PPAR-γ, C/EBP-β, and FAS compared with the HFD group. Maslinic acid also enhanced ATGL and Sirt1 expression and the phosphorylation of AMPK compared with the HFD group. Moreover, when evaluating the fatty acid β-oxidation pathway in liver tissue, we found that administration of maslinic acid increased CPT-1 when compared with the HFD group (Fig. 5). Next, we evaluated the expression of genes involved in lipogenesis. Maslinic acid suppressed C/EBP-β, PPAR-γ, Srebp-1c, and FAS and increased ATGL, HSL, Sirt1, CPT-1, and CPT-2 expression compared with HFD mice (Fig. 6). PAS staining was performed to evaluate glycogen accumulation in hepatocytes, demonstrating that maslinic acid promoted glycogen accumulation compared with HFD-induced obesity (Fig. 7A). Moreover, maslinic acid recovered glycogen levels in the livers of mice with HFD-induced obesity (Fig. 7B) and reduced the TC and TG levels (Fig. 7D, E). Immunohistochemistry revealed a large amount of FAS and a small amount of CPT-1 and Sirt1 in the livers of HFD mice compared with the N group. In addition, maslinic acid significantly promoted CPT-1 and Sirt1 expression and decreased FAS production in the liver tissue compared with the HFD group (Fig. 7C).
Figure 5.
Effects of maslinic acid (MA) on lipid metabolism in mouse liver tissue. A) Expression of Srebp-1C, C/EBP-β, PPAR-γ, FAS, ATGL, CPT-1, Sirt1, and AMPK phosphorylation was detected by Western blot. B) The fold expression levels were measured relative to the expression of β-actin. Three independent experiments were analyzed, and the data are presented as the means ± sem; n = 12. *P < 0.05, **P < 0.01 compared with HFD-induced obesity.
Figure 6.
Maslinic acid (MA) modulated lipogenesis and lipolysis gene expression in liver tissue. Gene expression levels were determined using real-time PCR. Three independent experiments were analyzed, and the data are presented as the means ± sem; n = 12. *P < 0.05, **P < 0.01 compared with HFD-induced obesity.
Figure 7.
A) Maslinic acid (MA) modulated glycogen distribution based on PAS staining in the liver (original magnification, ×200). B) MA increased glycogen levels in liver tissue. C) MA modulated FAS, Sirt-1, and CPT-1 expression in the liver (brown color drop). D, E) MA modulated TC (D) and TG levels (E) in the liver tissue. Three independent experiments were analyzed, and the data are presented as the means ± sem; n = 12. *P < 0.05, **P < 0.01 compared with HFD-induced obesity.
Effects of maslinic acid on serum lipid metabolism
Maslinic acid significantly decreased serum TG, TC, LDL, and free fatty acid levels and significantly increased HDL levels in HFD mice (Table 2). Furthermore, the administration of maslinic acid significantly inhibited the serum levels of insulin and glucose compared with the HFD group. Therefore, we calculated the Homeostatic Model Assessment of Insulin Resistance (HOMA-IR) value to evaluate insulin resistance, and found that maslinic acid could significantly attenuate HOMA-IR for improved insulin resistance in HFD-induced obesity in mice (Table 2). Mice with HFD-induced obesity treated with maslinic acid also had significantly suppressed leptin and increased adiponectin expression in serum compared with HFD mice. Maslinic acid could improve NAFLD scores in mice with HFD-induced obesity and reduced the serum levels of ALT and AST, recovering liver function in mice with HFD-induced obesity (Table 2).
TABLE 2.
Serum biochemical analysis
| Variable | Normal | HFD | MA10 | MA20 |
|---|---|---|---|---|
| Glucose (mg/dl) | 84.2 ± 15.1** | 231.3 ± 22.8 | 156.5 ± 26.1* | 101.3 ± 15.7** |
| Insulin (mg/dl) | 61.6 ± 16.2** | 230.9 ± 28.6 | 96.1 ± 16.8** | 87.9 ± 21.6** |
| HOMA-IR | 0.39 ± 0.11** | 4.12 ± 0.61 | 1.12 ± 0.32** | 0.67 ± 0.17** |
| TC (mg/dl) | 85.67 ± 3.2** | 227.01 ± 6.3 | 153.9 ± 5.2* | 146.1 ± 6.9* |
| TG (mg/dl) | 112.1 ± 2.7 | 109 ± 6.5 | 116 ± 7.6 | 115 ± 14.8 |
| HDL-C (mg/dl) | 78.1 ± 2.2* | 51.3 ± 4.3 | 82.9 ± 8.4** | 94.6 ± 7.6** |
| LDL-C (mg/dl) | 34.6 ± 2.3** | 133.8 ± 12.1 | 56.3 ± 4.8** | 51.3 ± 3.2** |
| Free fatty acids (mM) | 10.1 ± 0.7* | 12.31 ± 0.9 | 10.6 ± 1.3* | 11.3 ± 1.1* |
| AST (U/I) | 81.6 ± 8.6** | 132.1 ± 13.9 | 105.5 ± 12.4* | 88.2 ± 12.4** |
| ALT (U/I) | 42 ± 6.71** | 77 ± 9.2 | 51.6 ± 11.8** | 46.1 ± 10.5** |
| Leptin (μg/ml) | 1.1 ± 0.2** | 25.3 ± 2.5 | 10.9 ± 1.3** | 10.7 ± 1.6** |
| Adiponectin (μg/ml) | 2328.9 ± 68* | 1974.7 ± 275.1 | 2386.5 ± 129.4* | 2348.7 ± 88.7* |
P < 0.05, **P < 0.01 compared with HFD-induced obese mice. Data are presented as means ± sem.
Cell viability of maslinic acid in HepG2 cells
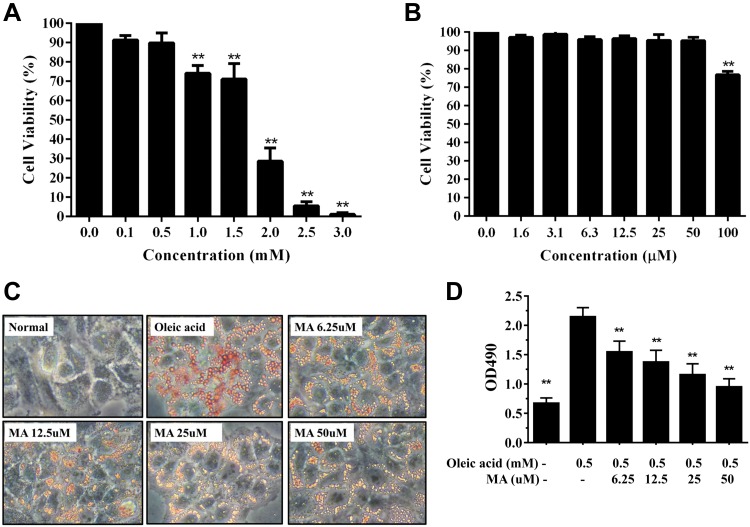
Next, we carefully studied whether maslinic acid can modulate lipid metabolism in HepG2 hepatocytes in vitro. First, cell viability was measured by the MTT assay. Oleic acid concentrations ≤0.5 mM did not significantly affect cell viability in HepG2 cells (Fig. 8A). No cell cytotoxicity was found at maslinic acid concentrations ≤50 μM in HepG2 cells (Fig. 8B), and 0–50 μM maslinic acid was used for all cell experiments.
Figure 8.
Maslinic acid (MA) reduced lipid accumulation in HepG2 cells. A) Cell viability of oleic acid in HepG2 cells. B) Cell viability of MA in HepG2 cells. C) Oil Red O staining revealed lipid accumulation. D) HepG2 cells were treated with isopropanol and lipid accumulation measured using the absorbance at ocular distance (OD) 490 nm. Three independent experiments were analyzed. Data represent the means ± sem. **P < 0.01 compared with HepG2 cells treated with oleic acid.
Maslinic acid regulated lipid accumulation and lipoperoxidation in HepG2 cells
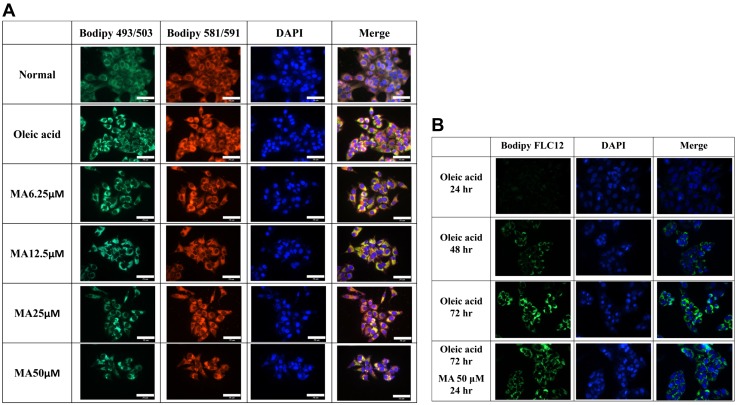
HepG2 cells were stimulated with oleic acid to induce lipid accumulation and treated with or without maslinic acid to evaluate lipid accumulation by Oil Red O staining. Maslinic acid reduced lipid droplets compared with oleic acid–induced hepatocytes (Fig. 8C). Next, hepatocytes were treated with isopropanol and lipid accumulation detected by recording the absorbance at 490 nm. Maslinic acid significantly decreased lipid accumulation in oleic acid–incubated HepG2 cells (Fig. 8D). We also used fluorescent dye Bodipy 493/503 to detect lipid accumulation, showing that maslinic acid alleviated lipid droplets in a dose-dependent manner (Fig. 9A). Similarly, fluorescent dye Bodipy 581/591 [11C] was used to detect lipoperoxidation, showing that maslinic acid significantly reduces lipoperoxidation compared with oleic acid–induced HepG2 cells (Fig. 9A). Moreover, the Bodipy FL C12 fluorescent probe was used to assay fatty acid uptake, showing that HepG2 hepatocytes promote fatty acid uptake when the cells are incubated with oleic acid for 72 h. Interestingly, 50 μM maslinic acid clearly suppressed fatty acid uptake compared with the oleic acid group (Fig. 9B).
Figure 9.
Maslinic acid (MA) reduced lipid accumulation, lipoperoxidation, and fatty acid uptake into HepG2 cells. A) The fluorescent dyes Bodipy 493/503 (green) and Bodipy 581/591 [11C] (red) were used to detect hepatic lipid droplets and hepatic lipoperoxidation, respectively, under a fluorescent microscope. B) Oleic acid–induced HepG2 cells treated with MA for 24 h before staining with the fluorescent probe Bodipy FL C12 (green). Three independent experiments were analyzed. Nuclei were stained with DAPI (blue).
Effect of maslinic acid on lipid metabolism in hepatocytes
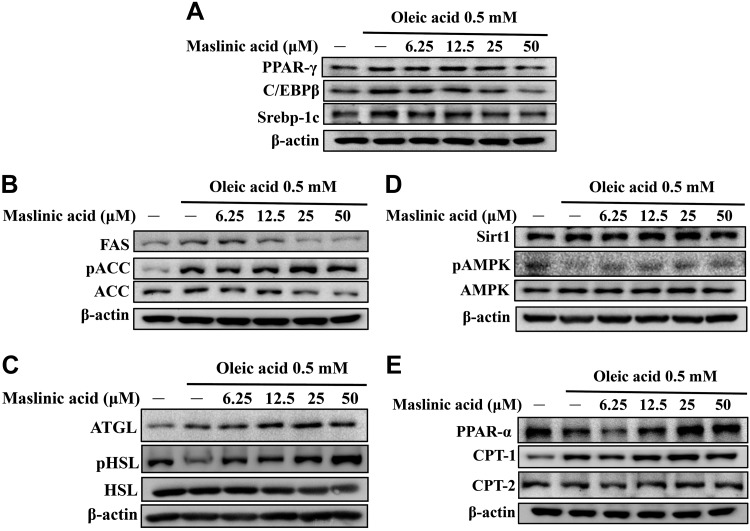
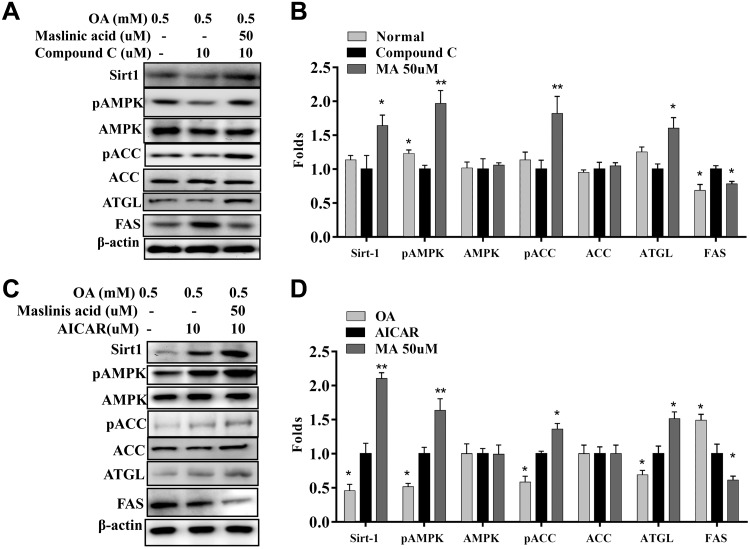
Western blot demonstrated that maslinic acid decreased PPAR-γ, C/EBP-β, and Srebp-1c expression compared with oleic acid–treated HepG2 cells (Fig. 10A). Maslinic acid also increased phosphorylation of ACC and reduced FAS production in a concentration-dependent manner compared with oleic acid (Fig. 10B). Furthermore, maslinic acid significantly enhanced ATGL, phosphorylation of HSL, Sirt1, and phosphorylation of AMPK in a concentration-dependent manner compared with oleic acid (Fig. 10C, D). Interestingly, HepG2 cells treated with maslinic acid significantly increased PPAR-α, CPT-1, and CPT-2 expression compared with oleic acid–incubated HepG2 cells (Fig. 10E). When oleic acid–induced HepG2 cells were cotreated with 50 μM maslinic acid and compound C, maslinic acid restored Sirt1, pAMPK, pACC, and ATGL and significantly reduced FAS expression (Fig. 11A, B). Surprisingly, oleic acid–induced HepG2 cells cocultured with 50 μM maslinic acid and AICAR demonstrated that maslinic acid promotes Sirt1, pAMPK, pACC, and ATGL and, more significantly, reduces FAS expression (Fig. 11C, D).
Figure 10.
Effects of maslinic acid on lipid metabolism in HepG2 cells. The expression of transcription factors (A), lipogenesis (B), lipolysis (C), the Sirt1/AMPK pathway (D), and β-oxidation (E) were detected by Western blot. Three independent experiments were performed using β-actin as an internal control.
Figure 11.
Effects of maslinic acid on the AMPK/Sirt-1 pathway in HepG2 cells. A) HepG2 cells were treated with 0.5 mM oleic acid for 48 h, followed by 50 μM maslinic acid with or without an AMPK inhibitor (compound C) for 24 h. B) The fold expression levels were measured relative to the expression of β-actin. Data are presented as means ± sem. *P < 0.05, **P < 0.01 compared with compound C treatment. C) HepG2 cells were treated with maslinic acid with or without an AMPK activator (AICAR) for 24 h. D) The fold expression levels were measured relative to the expression of β-actin. Three independent experiments were analyzed, and data are presented as the means ± sem. *P < 0.05, **P < 0.01 compared with the AICAR group.
DISCUSSION
Fatty liver is defined as the accumulation of excess TGs in hepatocytes, with more than 5% of the liver’s weight being fat or more than 10% fatty vacuoles in the liver tissue sections (25). Obesity and a diet high in fat and high in sugar will increase the lipid and carbohydrate metabolism burden of the liver, causing the accumulation of excessive TGs in the liver and promoting the development of NAFLD (26). Therefore, limiting dietary intake and controlling weight will decrease hyperglycemia and hyperlipidemia and improve insulin resistance and NAFLD.
In recent years, many studies have found that plant extracts or pure compounds can reduce body weight and improve NAFLD (9, 27). In HFD-induced obese mice, fisetin, astaxanthin, and quercetin reduce body weight and hepatic metabolic damage by promoting Sirt1 and AMPK expression (19, 28, 29). Licochalcone A could ameliorate obesity and NAFLD via promotion of the Sirt-1/AMPK pathway in obese mice (30). Previous studies showed that oral administration of sulforaphane improved NALFD via suppressed NLRP3 inflammasome signal in HFD-induced obese mice (31). Oral administration of resveratrol could decrease NAFLD severity in rats via improving inflammation, oxidative stress, and lipogenesis (32, 33). In the current study, maslinic acid effectively reduced body weight and decreased epididymal and inguinal fat weight in HFD-induced obese mice. Maslinic acid also reduced liver weight, decreased lipid accumulation in the liver, and improved NAFLD in HFD-fed obese mice. We also confirmed that maslinic acid effectively inhibited lipogenesis and increased lipolysis and fatty acid β-oxidation by promoting the Sirt1/AMPK pathway in the liver. Our results demonstrate that maslinic acid could potentially ameliorate obesity and NAFLD.
Previous studies have shown that maslinic acid regulates the differentiation of 3T3-L1 adipocytes (16), and we supposed that maslinic acid would reduce body weight and NAFLD in mice. In the current study, maslinic acid effectively reduced the body weight, adipose tissue weight, and fat cell size in male C57BL/6 mice fed an HFD. Previous studies confirmed that adipose tissue from obese mice secretes excess leptin, which binds to the leptin receptors of hypothalamic neurons, reducing appetite and regulating body weight (34). Other studies have shown that quercetin improves obesity and insulin resistance by reducing serum leptin levels and increasing serum adiponectin levels in mice (35). We demonstrated no significant difference in the food intake between the groups. However, maslinic acid significantly reduced serum leptin and increased serum adiponectin levels, but it did not affect appetite or reduce body weight in mice. Glabridin, an AMPK activator, could reduce body weight, serum lipid levels, and hypoglycemic effects in streptozotocin-induced diabetic mice (36). Interestingly, we found that maslinic acid regulates fasting blood glucose and insulin levels. HFD mice have high HOMA-IR values and high risk factors for insulin resistance (37), and maslinic acid could significantly reduce HOMA-IR values. Therefore, maslinic acid could have a hypoglycemic effect, improving insulin resistance in obese mice by regulating the levels of leptin and adiponectin.
HFD-induced obese mice are not only suitable for observing the effects of obesity, but also for studying NAFLD. We found that HFD-induced obese mice have higher NAFLD scores, and obese mice treated with maslinic acid have reduced NAFLD scores. NAFLD scores are based on macrophage infiltration, fat vacuoles, and lobular inflammation in liver tissue (19). We found that maslinic acid significantly decreased fat vacuoles and lipid droplets, and macrophage infiltration in the livers of HFD-fed obese mice. Activated macrophage would release more proinflammatory cytokines to cause liver inflammation (9, 20). Maslinic acid inhibited TNF-α gene expression of liver and adipose tissue, and also significantly reduced TNF-α level in the serum of obese mice. Therefore, maslinic acid could reduce the inflammatory effects in obese mice.
During the formation of fatty liver cells and excess lipid accumulation in hepatocytes, lipid synthesis–related enzymes and transcription factors are activated, including FAS and Srebp-1c, PPAR-γ, and C/EBP-β, for enhanced fatty acid synthesis (38). The Sirt1/AMPK pathway is not activated in the liver tissue of Sirt1-deficient mice, and transcription factors involved in lipogenesis are not expressed in excess (9). Other studies have found that Srebp-1c regulates FAS expression to promote lipid synthesis in the livers of obese mice (7, 39). Sulforaphane regulates lipid metabolism in hepatic steatosis by regulating the Srebp1c/FAS pathways in mice (40). We found that maslinic acid reduces the expression of Srebp-1c, PPAR-γ, C/EBP-β, and FAS in liver tissue, reducing lipid accumulation in hepatocytes. We used Oil Red O stain and fluorescent staining to confirm that more oil droplets were distributed in oleic acid–induced hepatocytes, but maslinic acid reduced the oil droplet distribution in HepG2 cells in vitro. We also performed immunohistochemical staining to determine that maslinic acid reduces FAS distribution in liver tissue. In liver sections, HE staining showed that maslinic acid significantly improved the formation of fat vacuoles. Therefore, we demonstrated that maslinic acid inhibits transcription factors involved in lipid synthesis in the liver.
Uptake of free fatty acids by hepatocytes would initiate lipogenic transcription factors that activate FAS to increase TG synthesis, leading to fatty liver (38). The normal liver also transports synthetic TGs and lipoproteins into the blood to maintain physiologic functions (25). However, the uptake of excessive fatty acids would exert a metabolic burden on the liver and interfere with the lipid transport form. Therefore, high levels of TC and TGs were detected in the liver of HFD-induced obese mice, and high serum levels of TC, TGs, and LDL were measured, which affect the development of chronic cardiovascular diseases. Interestingly, maslinic acid significantly inhibited fatty acid uptake and decreased lipogenesis in oleic acid–induced HepG2 cells. We speculated that maslinic acid blocked fatty acid uptake in the liver by reducing lipogenesis. Therefore, HFD-induced obese mice treated with maslinic acid had reduced TC and TG levels in the liver compared with HFD-induced obese mice not treated with maslinic acid.
Accelerating lipid breakdown in liver cells can also prevent NAFLD. Previous studies have shown that sulforaphane and astaxanthin inhibit lipid synthesis and increase lipolysis in high glucose–induced fatty liver cells and improve lipolysis in the liver tissue of NAFLD mice (40, 41). Olive leaf extract could regulate lipid metabolism and promote lipolysis in obese rats (42). Our study demonstrated that maslinic acid has the ability to reduce body weight in obese mice and suppress adipose tissue weight and adipocyte size in inguinal and epididymal adipose tissue. Maslinic acid also promotes the phosphorylation of HSL and ATGL expression in oleic acid–induced hepatocytes and increases ATGL to accelerate lipolysis in the livers of obese mice. Previous studies have demonstrated that metformin increases ATGL, increasing lipolysis by activating AMPK phosphorylation (43). In the current study, maslinic acid could restore ATGL expression. We thought that maslinic acid increased lipolysis in fatty liver via regulated phosphorylation of HSL and ATGL and AMPK expression.
Previous studies have found that free fatty acids inhibit AMPK activation (44). Lipid accumulation in the liver and adipose tissue also inhibits AMPK activity and affects ACC expression, accelerating fatty acid synthesis, resulting in excessive accumulation of TGs in the liver, and inducing the development of NAFLD (44). Resveratrol is a Sirt1 enhancer that promotes the expression of Sirt1 and AMPK and reduces lipid accumulation in the livers of obese mice (45). Previous studies have found that metformin is a hypoglycemic drug that could regulate the metabolism of carbohydrates and lipids by activating AMPK phosphorylation (43). The current study found that maslinic acid can increase the expression of Sirt1 and pAMPK in oleic acid–induced HepG2 hepatocytes. AMPK phosphorylation would stimulate ACC phosphorylation, blocking FAS expression and reducing fatty acid synthesis (46). Our experimental results also confirmed that maslinic acid can increase ACC phosphorylation and inhibit FAS production in oleic acid–induced HepG2 hepatocytes. In addition, maslinic acid cocultured with AMPK inhibitors has the ability to restore AMPK phosphorylation and inhibit FAS expression. Therefore, maslinic acid reduced lipid accumulation in the livers of obese mice by regulating the AMPK pathway.
In the liver, TGs could decompose to produce free fatty acids that require rapid breakdown by β-oxidation to produce energy or form bile acids and be excreted in the feces (2). Many studies have confirmed that AMPK and Sirt1 expression enhance CPT-1 expression, which converts long-chain fatty acyl-CoA to promote β-oxidation expression and increase fatty acid decomposition (11, 46). Maslinic acid significantly increased CPT1 expression in the livers of HFD-induced obese mice. Other studies have shown that quercetin enhances the expression of Sirt1/AMPK, thereby inhibiting ACC activity, and increases β-oxidation of lipolysis, improving NAFLD in HFD-fed mice (35, 47).
During the development of obesity and NAFLD, metabolic syndrome or insulin resistance often obstruct glucose transport into hepatocytes, adipocytes, and skeletal muscle cells (3). These insulin-resistant cells will use a lot of fatty acids to produce energy and promote free fatty acid levels in the serum for an aggravated chronic inflammatory response. More studies have demonstrated that hypoglycemic and hypolipidemic drugs could improve blood sugar and blood pressure and also relieve the effectiveness of fatty liver disease (43, 48). Other studies have shown that many purified plant compounds could improve insulin resistance and NAFLD (28, 41). In summary, we demonstrated that maslinic acid ameliorates hepatic steatosis, reduces adipose tissue weight and body weight, and significantly decreases lipid accumulation in the livers of obese mice by promoting the Sirt1/AMPK pathway. Therefore, maslinic acid has potential as a novel antiobesity agent for the treatment of NAFLD.
Supplementary Material
This article includes supplemental data. Please visit http://www.fasebj.org to obtain this information.
ACKNOWLEDGMENTS
This study was supported, in part, by grants from Chang Gung Memorial Hospital (CMRPF1H0022, CMRPF1G0232, and CMRPF1H0042) and the Ministry of Science and Technology in Taiwan (106-2320-B-255-007-MY3). The authors declare no conflicts of interest.
Glossary
- ACC
acetyl CoA carboxylase
- AICAR
5-aminoimidazole-4-carboxamide-1-β-d-ribofuranoside
- ALT
alanine aminotransferase
- AST
aspartate aminotransferase
- ATGL
adipose triglyceride lipase
- Bodipy
boron-dipyrromethene
- C/EBP
CCAAT/enhancer-binding protein
- CPT-1
carnitine palmitoyltransferase 1
- FAS
fatty acid synthase
- H&E
hematoxylin and eosin
- HFD
high-fat diet
- HOMA-IR
Homeostatic Model Assessment of Insulin Resistance
- HSL
hormone-sensitive lipase
- NALFD
nonalcoholic fatty liver disease
- PAS
periodic acid-Schiff
- PPAR
peroxisome proliferator–activated receptor
- Sirt1
sirtuin 1
- SREBP-1c
sterol regulatory element–binding protein 1c
- TG
triglyceride
- TC
total cholesterol
Footnotes
This article includes supplemental data. Please visit http://www.fasebj.org to obtain this information.
AUTHOR CONTRIBUTIONS
C.-J. Liou, Y.-W. Dai, C.-L. Wang, and L.-W. Fang performed the experiments; C.-J. Liou, Y.-W. Dai, and W.-C. Huang designed the experiments; C.-J. Liou and W.-C. Huang drafted the manuscript; and Y.-W. Dai and C.-L. Wang performed the analysis and interpretation of data.
REFERENCES
- 1.Sun K., Kusminski C. M., Scherer P. E. (2011) Adipose tissue remodeling and obesity. J. Clin. Invest. 121, 2094–2101 [DOI] [PMC free article] [PubMed] [Google Scholar]
- 2.Kitade H., Chen G., Ni Y., Ota T. (2017) Nonalcoholic fatty liver disease and insulin resistance: new insights and potential new treatments. Nutrients 9, E387 [DOI] [PMC free article] [PubMed] [Google Scholar]
- 3.Hazlehurst J. M., Woods C., Marjot T., Cobbold J. F., Tomlinson J. W. (2016) Non-alcoholic fatty liver disease and diabetes. Metabolism 65, 1096–1108 [DOI] [PMC free article] [PubMed] [Google Scholar]
- 4.Zhu Y., Liu H., Zhang M., Guo G. L. (2016) Fatty liver diseases, bile acids, and FXR. Acta Pharm. Sin. B 6, 409–412 [DOI] [PMC free article] [PubMed] [Google Scholar]
- 5.Coppari R., Bjørbæk C. (2012) Leptin revisited: its mechanism of action and potential for treating diabetes. Nat. Rev. Drug Discov. 11, 692–708 [DOI] [PMC free article] [PubMed] [Google Scholar]
- 6.Smith M. M., Minson C. T. (2012) Obesity and adipokines: effects on sympathetic overactivity. J. Physiol. 590, 1787–1801 [DOI] [PMC free article] [PubMed] [Google Scholar]
- 7.Mota de Sá P., Richard A. J., Hang H., Stephens J. M. (2017) Transcriptional regulation of adipogenesis. Compr. Physiol. 7, 635–674 [DOI] [PubMed] [Google Scholar]
- 8.Saponaro C., Gaggini M., Carli F., Gastaldelli A. (2015) The subtle balance between lipolysis and lipogenesis: a critical point in metabolic homeostasis. Nutrients 7, 9453–9474 [DOI] [PMC free article] [PubMed] [Google Scholar]
- 9.Zhang Y., Geng C., Liu X., Li M., Gao M., Liu X., Fang F., Chang Y. (2016) Celastrol ameliorates liver metabolic damage caused by a high-fat diet through Sirt1. Mol. Metab. 6, 138–147 [DOI] [PMC free article] [PubMed] [Google Scholar]
- 10.Miller R. A., Birnbaum M. J. (2010) An energetic tale of AMPK-independent effects of metformin. J. Clin. Invest. 120, 2267–2270 [DOI] [PMC free article] [PubMed] [Google Scholar]
- 11.Wu L., Zhang L., Li B., Jiang H., Duan Y., Xie Z., Shuai L., Li J., Li J. (2018) AMP-activated protein kinase (AMPK) regulates energy metabolism through modulating thermogenesis in adipose tissue. Front. Physiol. 9, 122 [DOI] [PMC free article] [PubMed] [Google Scholar]
- 12.Sánchez-González M., Lozano-Mena G., Juan M. E., García-Granados A., Planas J. M. (2013) Assessment of the safety of maslinic acid, a bioactive compound from Olea europaea L. Mol. Nutr. Food Res. 57, 339–346 [DOI] [PubMed] [Google Scholar]
- 13.Fukumitsu S., Villareal M. O., Fujitsuka T., Aida K., Isoda H. (2016) Anti-inflammatory and anti-arthritic effects of pentacyclic triterpenoids maslinic acid through NF-κB inactivation. Mol. Nutr. Food Res. 60, 399–409 [DOI] [PubMed] [Google Scholar]
- 14.Yang Y. W., Tsai C. W., Mong M. C., Yin M. C. (2015) Maslinic acid protected PC12 cells differentiated by nerve growth factor against β-amyloid-induced apoptosis. J. Agric. Food Chem. 63, 10243–10249 [DOI] [PubMed] [Google Scholar]
- 15.Qin X., Qiu C., Zhao L. (2014) Maslinic acid protects vascular smooth muscle cells from oxidative stress through Akt/Nrf2/HO-1 pathway. Mol. Cell. Biochem. 390, 61–67 [DOI] [PubMed] [Google Scholar]
- 16.Pérez-Jiménez A., Rufino-Palomares E. E., Fernández-Gallego N., Ortuño-Costela M. C., Reyes-Zurita F. J., Peragón J., García-Salguero L., Mokhtari K., Medina P. P., Lupiáñez J. A. (2016) Target molecules in 3T3-L1 adipocytes differentiation are regulated by maslinic acid, a natural triterpene from Olea europaea. Phytomedicine 23, 1301–1311 [DOI] [PubMed] [Google Scholar]
- 17.Liou C. J., Cheng C. Y., Yeh K. W., Wu Y. H., Huang W. C. (2018) Protective effects of casticin from Vitex trifolia alleviate eosinophilic airway inflammation and oxidative stress in a murine asthma model. Front. Pharmacol. 9, 635 [DOI] [PMC free article] [PubMed] [Google Scholar]
- 18.Huang W. C., Fang L. W., Liou C. J. (2017) Phloretin attenuates allergic airway inflammation and oxidative stress in asthmatic mice. Front. Immunol. 8, 134 [DOI] [PMC free article] [PubMed] [Google Scholar]
- 19.Kleiner D. E., Brunt E. M., Van Natta M., Behling C., Contos M. J., Cummings O. W., Ferrell L. D., Liu Y. C., Torbenson M. S., Unalp-Arida A., Yeh M., McCullough A. J., Sanyal A. J.; Nonalcoholic Steatohepatitis Clinical Research Network (2005) Design and validation of a histological scoring system for nonalcoholic fatty liver disease. Hepatology 41, 1313–1321 [DOI] [PubMed] [Google Scholar]
- 20.Liou C. J., Huang W. C. (2011) Dehydroepiandrosterone suppresses eosinophil infiltration and airway hyperresponsiveness via modulation of chemokines and Th2 cytokines in ovalbumin-sensitized mice. J. Clin. Immunol. 31, 656–665 [DOI] [PubMed] [Google Scholar]
- 21.Liou C. J., Wu S. J., Chen L. C., Yeh K. W., Chen C. Y., Huang W. C. (2017) Acacetin from traditionally used Saussurea involucrata Kar. et Kir. suppressed adipogenesis in 3T3-L1 adipocytes and attenuated lipid accumulation in obese mice. Front. Pharmacol. 8, 589 [DOI] [PMC free article] [PubMed] [Google Scholar]
- 22.Huang W. C., Su H. H., Fang L. W., Wu S. J., Liou C. J. (2019) Licochalcone A inhibits cellular motility by suppressing E-cadherin and MAPK signaling in breast cancer. Cells 8, 218 [DOI] [PMC free article] [PubMed] [Google Scholar]
- 23.Huang W. C., Chang W. T., Wu S. J., Xu P. Y., Ting N. C., Liou C. J. (2013) Phloretin and phlorizin promote lipolysis and inhibit inflammation in mouse 3T3-L1 cells and in macrophage-adipocyte co-cultures. Mol. Nutr. Food Res. 57, 1803–1813 [DOI] [PubMed] [Google Scholar]
- 24.Chang Y. H., Chen Y. L., Huang W. C., Liou C. J. (2018) Fucoxanthin attenuates fatty acid-induced lipid accumulation in FL83B hepatocytes through regulated Sirt1/AMPK signaling pathway. Biochem. Biophys. Res. Commun. 495, 197–203 [DOI] [PubMed] [Google Scholar]
- 25.Neuschwander-Tetri B. A. (2017) Non-alcoholic fatty liver disease. BMC Med. 15, 45 [DOI] [PMC free article] [PubMed] [Google Scholar]
- 26.Li M., Sharma A., Yin C., Tan X., Xiao Y. (2017) Metformin ameliorates hepatic steatosis and improves the induction of autophagy in HFD-induced obese mice. Mol. Med. Rep. 16, 680–686 [DOI] [PMC free article] [PubMed] [Google Scholar]
- 27.Norris G. H., Blesso C. N. (2017) Dietary sphingolipids: potential for management of dyslipidemia and nonalcoholic fatty liver disease. Nutr. Rev. 75, 274–285 [DOI] [PubMed] [Google Scholar]
- 28.Liou C. J., Wei C. H., Chen Y. L., Cheng C. Y., Wang C. L., Huang W. C. (2018) Fisetin protects against hepatic steatosis through regulation of the Sirt1/AMPK and fatty acid β-oxidation signaling pathway in high-fat diet-induced obese mice. Cell. Physiol. Biochem. 49, 1870–1884 [DOI] [PubMed] [Google Scholar]
- 29.Liu L., Gao C., Yao P., Gong Z. (2015) Quercetin alleviates high-fat diet-induced oxidized low-density lipoprotein accumulation in the liver: implication for autophagy regulation. Biomed. Res. Int. 2015, 607531 [DOI] [PMC free article] [PubMed] [Google Scholar]
- 30.Liou C. J., Lee Y. K., Ting N. C., Chen Y. L., Shen S. C., Wu S. J., Huang W. C. (2019) Protective effects of Licochalcone A ameliorates obesity and non-alcoholic fatty liver disease via promotion of the Sirt-1/AMPK pathway in mice fed a high-fat diet. Cells 8, 447 [DOI] [PMC free article] [PubMed] [Google Scholar]
- 31.Lei P., Tian S., Teng C., Huang L., Liu X., Wang J., Zhang Y., Li B., Shan Y. (2019) Sulforaphane improves lipid metabolism by enhancing mitochondrial function and biogenesis in vivo and in vitro. Mol. Nutr. Food Res. 63, e1800795 [DOI] [PubMed] [Google Scholar]
- 32.Bujanda L., Hijona E., Larzabal M., Beraza M., Aldazabal P., García-Urkia N., Sarasqueta C., Cosme A., Irastorza B., González A., Arenas J. I., Jr (2008) Resveratrol inhibits nonalcoholic fatty liver disease in rats. BMC Gastroenterol. 8, 40 [DOI] [PMC free article] [PubMed] [Google Scholar]
- 33.Zhu W., Chen S., Li Z., Zhao X., Li W., Sun Y., Zhang Z., Ling W., Feng X. (2014) Effects and mechanisms of resveratrol on the amelioration of oxidative stress and hepatic steatosis in KKAy mice. Nutr. Metab. (Lond.) 11, 35 [DOI] [PMC free article] [PubMed] [Google Scholar]
- 34.Cui H., López M., Rahmouni K. (2017) The cellular and molecular bases of leptin and ghrelin resistance in obesity. Nat. Rev. Endocrinol. 13, 338–351 [DOI] [PMC free article] [PubMed] [Google Scholar]
- 35.Kobori M., Takahashi Y., Sakurai M., Akimoto Y., Tsushida T., Oike H., Ippoushi K. (2016) Quercetin suppresses immune cell accumulation and improves mitochondrial gene expression in adipose tissue of diet-induced obese mice. Mol. Nutr. Food Res. 60, 300–312 [DOI] [PMC free article] [PubMed] [Google Scholar]
- 36.Lee J. W., Choe S. S., Jang H., Kim J., Jeong H. W., Jo H., Jeong K. H., Tadi S., Park M. G., Kwak T. H., Man Kim J., Hyun D. H., Kim J. B. (2012) AMPK activation with glabridin ameliorates adiposity and lipid dysregulation in obesity. J. Lipid Res. 53, 1277–1286 [DOI] [PMC free article] [PubMed] [Google Scholar]
- 37.Ippagunta S. M., Kharitonenkov A., Adams A. C., Hillgartner F. B. (2018) Cholic acid supplementation of a high-fat obesogenic diet suppresses hepatic triacylglycerol accumulation in mice via a fibroblast growth factor 21-dependent mechanism. J. Nutr. 148, 510–517 [DOI] [PubMed] [Google Scholar]
- 38.Wang Y., Viscarra J., Kim S. J., Sul H. S. (2015) Transcriptional regulation of hepatic lipogenesis. Nat. Rev. Mol. Cell Biol. 16, 678–689; erratum: 17, 64 [DOI] [PMC free article] [PubMed] [Google Scholar]
- 39.Zhang Y., Meng T., Zuo L., Bei Y., Zhang Q., Su Z., Huang Y., Pang J., Xiang Q., Yang H. (2017) Xyloketal B attenuates fatty acid-induced lipid accumulation via the SREBP-1c pathway in NAFLD models. Mar. Drugs 15, E163 [DOI] [PMC free article] [PubMed] [Google Scholar]
- 40.Choi K. M., Lee Y. S., Kim W., Kim S. J., Shin K. O., Yu J. Y., Lee M. K., Lee Y. M., Hong J. T., Yun Y. P., Yoo H. S. (2014) Sulforaphane attenuates obesity by inhibiting adipogenesis and activating the AMPK pathway in obese mice. J. Nutr. Biochem. 25, 201–207 [DOI] [PubMed] [Google Scholar]
- 41.Kim B., Farruggia C., Ku C. S., Pham T. X., Yang Y., Bae M., Wegner C. J., Farrell N. J., Harness E., Park Y. K., Koo S. I., Lee J. Y. (2017) Astaxanthin inhibits inflammation and fibrosis in the liver and adipose tissue of mouse models of diet-induced obesity and nonalcoholic steatohepatitis. J. Nutr. Biochem. 43, 27–35 [DOI] [PubMed] [Google Scholar]
- 42.Merola N., Castillo J., Benavente-García O., Ros G., Nieto G. (2017) The effect of consumption of citrus fruit and olive leaf extract on lipid metabolism. Nutrients 9, E1062 [DOI] [PMC free article] [PubMed] [Google Scholar]
- 43.Yang S., Lv Q., Luo T., Liu L., Gao R., Chen S., Ye P., Cheng Q., Li Q. (2013) Metformin inhibits expression and secretion of PEDF in adipocyte and hepatocyte via promoting AMPK phosphorylation. Mediators Inflamm. 2013, 429207 [DOI] [PMC free article] [PubMed] [Google Scholar]
- 44.Asrih M., Montessuit C., Philippe J., Jornayvaz F. R. (2015) Free fatty acids impair FGF21 action in HepG2 cells. Cell. Physiol. Biochem. 37, 1767–1778 [DOI] [PubMed] [Google Scholar]
- 45.Tian Y., Ma J., Wang W., Zhang L., Xu J., Wang K., Li D. (2016) Resveratrol supplement inhibited the NF-κB inflammation pathway through activating AMPKα-SIRT1 pathway in mice with fatty liver. Mol. Cell. Biochem. 422, 75–84 [DOI] [PubMed] [Google Scholar]
- 46.López M. (2018) Hypothalamic AMPK and energy balance. Eur. J. Clin. Invest. 48, e12996 [DOI] [PMC free article] [PubMed] [Google Scholar]
- 47.Pisonero-Vaquero S., Martínez-Ferreras Á., García-Mediavilla M. V., Martínez-Flórez S., Fernández A., Benet M., Olcoz J. L., Jover R., González-Gallego J., Sánchez-Campos S. (2015) Quercetin ameliorates dysregulation of lipid metabolism genes via the PI3K/AKT pathway in a diet-induced mouse model of nonalcoholic fatty liver disease. Mol. Nutr. Food Res. 59, 879–893 [DOI] [PubMed] [Google Scholar]
- 48.Shaw R. J. (2013) Metformin trims fats to restore insulin sensitivity. Nat. Med. 19, 1570–1572 [DOI] [PubMed] [Google Scholar]
Associated Data
This section collects any data citations, data availability statements, or supplementary materials included in this article.


