

Abstract
Principal component analysis (PCA) is a well‐known technique for reduction of dimensionality of functional imaging data. PCA can be looked at as the projection of the original images onto a new orthogonal coordinate system with lower dimensions. The new axes explain the variance in the images in decreasing order of importance, showing correlations between brain regions. We used an efficient, stable and analytical method to work out the PCA of Positron Emission Tomography (PET) images of 74 normal subjects using [18F]fluoro‐2‐deoxy‐d‐glucose (FDG) as a tracer. Principal components (PCs) and their relation to age effects were investigated. Correlations between the projections of the images on the new axes and the age of the subjects were carried out. The first two PCs could be identified as being the only PCs significantly correlated to age. The first principal component, which explained 10% of the data set variance, was reduced only in subjects of age 55 or older and was related to loss of signal in and adjacent to ventricles and basal cisterns, reflecting expected age‐related brain atrophy with enlarging CSF spaces. The second principal component, which accounted for 8% of the total variance, had high loadings from prefrontal, posterior parietal and posterior cingulate cortices and showed the strongest correlation with age (r = −0.56), entirely consistent with previously documented age‐related declines in brain glucose utilization. Thus, our method showed that the effect of aging on brain metabolism has at least two independent dimensions. This method should have widespread applications in multivariate analysis of brain functional images. Hum. Brain Mapping 18:13–21, 2003. © 2002 Wiley‐Liss, Inc.
Keywords: PET, PCA, SVD, normal aging, topographic profile
INTRODUCTION
Over the last 20 years functional brain imaging, and especially PET studies of resting‐state cerebral glucose utilization (CMRGlc) using FDG, has become a major tool in the investigation of age‐related brain pathology such as Alzheimer disease (AD) and in differentiating pathology from normal aging effects. Objective methods for FDG‐PET image analysis have used regions of interest (ROI) or voxel‐based univariate methods, which treat the voxels as if they represented independent or uniformly correlated measures throughout the brain. This is clearly not true in the brain, which has extensive yet highly structured connections between brain regions on the microscopic and macroscopic scale. Normal aging and pathologic processes, such as neurodegenerative brain disease, also affect brain systems rather than individual brain voxels. Thus, the need to describe patterns of covariance among ROI or voxels to characterize the effects of normal aging, as compared to distinct pathologic processes such as AD, in terms of metabolic topography has become more and more pressing in recent years. To this aim, principal component analysis was extensively applied to ROI data such as with the Scaled Subprofile Model (SSM) [Moeller and Strother, 1991; Moeller et al., 1996; Strother et al., 1995], but as this approach does not produce results in terms of 3D images, it has not had widespread applications. In contrast to SSM, the analysis discussed here uses only straightforward, standard statistical methods without the necessity of using a complex multiplicative and additive model. Although a recent study reports findings with SSM implemented in a voxel‐based approach, the methodology was not described in sufficient detail and validation was not given [Moeller et al., 1999]. Voxel‐based implementation of PCA has also been incorporated into statistical parametric mapping (SPM; the Wellcome Department of Cognitive Neurology, London, UK) to establish functional connectivity among voxels in brain activation studies [Friston et al., 1993], but in this model the analysis is restricted to families of voxels previously identified as significant in univariate comparisons. Another approach was to reduce the number of voxels using macrovoxels [Jones et al., 1998], but this procedure resulted in images of much lower resolution. Indeed, one major problem to date has been that implementing PCA over hundreds of thousands voxels has been impractical because of computer memory restrictions. We introduce a method that attempts to show the intrinsic structure of the data by asking the question: what are the patterns causing the greatest variance within the imaging data? To find the external variables that cause or are the consequence of those variations, regression analysis is applied. Another multivariate method that extracts patterns related to external variables is partial least squares analysis (PLS) [McIntosh et al., 1996]. Those patterns are extracted from the cross‐covariance matrix of the external variables and image data by SVD. Thus the patterns are directly related to external variables such as experimental design, but are not able to capture unexpected sources of variance. Both methods are complementary because PCA is purely driven by imaging data whereas PLS extracts mainly those components that are directly related to particular external variables.
We used an efficient and analytical method to work out the PCs of a large data set without computing the large covariance matrix with the number of elements having the order of 1010. This method was first proposed by Weaver et al. [1995] for application to PET and fMRI studies, but in fact is mathematically well known and fully described in textbooks (e.g., Jackson 1991). By taking all the voxels of the brain, the principal images have exactly the same resolution as the original images. Furthermore, as no intra‐cerebral mask selecting the voxels is required before PCA, any region inside the brain can be studied.
We have applied this novel approach to resting state FDG‐PET data sets from a large sample of normal subjects across a wide range of age, and used the expected age‐related voxel‐based effects [Calautti et al., 2001; Garraux et al., 1999; Martin et al., 1991; Petit‐Taboué et al., 1998] on resting state FDG PET data as a means to validate our methodology. Our goal was not only to demonstrate the feasibility of the computations, but also to check whether the independent factors (dimensions) of the data set that are extracted by PCA are related to age as the main biological parameter that describes the sample subjects.
MATERIALS AND METHODS
PCA was carried out on images of 74 healthy and unmedicated controls (mean age = 56.6, SD = 12.8, range = 21–80 years), 41 male and 33 female, obtained from five different PET scanners assessing the entire brain. A histogram of the age distribution is given in Figure 1. All subjects had given their informed consent and had been screened clinically and neuropsychologically to exclude organic brain disease (other than age‐related asymptomatic minor vascular changes or atrophy) and cognitive impairment. A few older subjects complained about subjective memory deficits but all were within normal age‐adjusted limits at neuropsychological testing, which rules out mild cognitive impairment (MCI). They were examined at a resting state with eyes closed and ears unplugged after intravenous injection of 110–370 MBq FDG. Images used in the analysis are a summed part of a dynamic sequence. Minimum start time and duration of each scan were 40 min and 10 min, respectively. The spatial resolution (full width at half maximum, FWHM) of the tomographs used ranged from 3.6–4.6 mm for the in‐plane resolution and 3.125–5.3 mm for slice thickness. Images were reconstructed by filtered backprojection with measured attenuation correction. Subjects are part of the NEST‐DD (Network for Efficiency and Standardization of Dementia Diagnosis) database.
Figure 1.
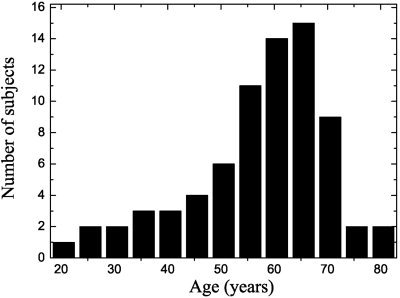
Age distribution of normal subjects.
After affine (12 parameter) spatial normalization using SPM99, all FDG‐uptake images were smoothed with a 8‐mm FWHM Gaussian kernel. Images were scaled to the same mean value. Voxels from outside the brain were removed by means of a mask derived from an average image of normalized brains using a fixed threshold with additional manual editing to remove extracerebral voxels. The mask included grey and white matter tissue as well as the ventricles. The number of voxels retained was 221,351.
After removing the mean image of each image, data were scaled by  and transformed into a (p × n) matrix X, where n is the number of images (observations) and p is the number of voxels (variables). PCA consists of finding the eigenvalues and eigenvector of the (p × p) covariance or correlation matrix of the data matrix X. The eigenvector are the PCs and the eigenvalues give the variance explained by the corresponding eigenvector. As the number of variables p is at the order of 105 this covariance matrix cannot be built with up to date computers. Another way to compute the PCs of X would be to use singular value decomposition (SVD):
| (1) |
where E and e are the matrices of eigenvector of XXT and XTX respectively. L is a diagonal matrix and its nonzero elements are the eigenvalues of both, XXT and XTX. But also due to the size of the data SVD cannot be carried out directly. What can easily be computed are the eigenvalues L and eigenvector e of the small covariance matrix XTX [Oja, 1983]. The PCs of X, i.e., the eigenvector of XXT can then be determined by
| (2) |
To summarize, the output data of the PCA are:
PCi: Principal Components that are the eigenvector of the covariance matrix XXT or in other words the new axes, i runs from 1 to n, where n is the number of observations. In this case they are 3D images.
Li: Eigenvalues of the covariance matrix XXT, giving the variance explained by PCi.
PCi‐score: Projections of the observations on PCi, being the coordinates of the observations in the new space.
To search for outliers in the data set, the Hotelling T2 test, which is a multivariate generalization of the Student's t‐test, assuming a multivariate normal distribution, is used [Hotelling, 1931]. The T2‐value of one observation gives a normalized measure of distance from the mean. It is given by:
| (3) |
where y is a column vector of PC‐scores belonging to one subject whose elements are divided by the square root of its corresponding eigenvalues. The T2 distribution is directly related to the F‐distribution by the relationship:
| (4) |
where n is the number of images and q the number of PCs used for the test. The T2 test is often used in combination with PCA in the field of quality control to determine whether a process is in control or not [Jackson, 1991]. To test the validity and the power of the T2 test we carried out 15 PCA of 74 images of normal controls with an image from a different subject suffering from AD added each time (MMSE = 16.4 ± 3.6; age = 62.8 ± 7.2 years).
One of the important features of PCA is to provide new coordinates for the observations on uncorrelated axes. Those coordinates can therefore be related to available characteristics or attributes of the individuals to find a meaning for the corresponding axis.
To find the PCs related to age, a series of correlations is carried out. After identification of those PCs it was checked whether they were confounded by effects of gender or scanner resolutions. To this aim the point bi‐serial correlation coefficient was used in the case of the dichotomous variable (gender). To check the influence of the resolution of the five different scanners the χ2 test on proportion for linear trends was applied after categorizing the PC‐score variables into an ordinal variable. The age of the subjects were not distributed normally (P < 10−3; Lilliefors test, Fig. 1), therefore Spearman's correlation coefficient was used as a measure of dependence.
The images (PCs) related to age were compared to a parametric map obtained by a univariate (voxel by voxel) approach comparable to the work of Petit‐Taboué [1998]. The parametric map identified those voxel that were significantly correlated with age.
The robustness of the method, i.e., the dependence of the PCs on the particular data set, was checked by cross‐validation. Fourteen PCAs of 69 images each were carried out after randomly removing each time five different images from the full data set. The resulting PCs were compared to each other calculating their correlation coefficients. Calculations were carried out using MATLAB v. 6.0 (Mathworks, Newton, MA)
RESULTS
Figure 2 shows the variance explained by the first 18 PCs as well as the cumulative variance explained. As the motivation behind PCA is to find a direction, or few directions, that explain as much of the variance within the data as possible, Figure 2 shows that by taking into account only the first 18 PCs, two‐thirds of the variance within the images was explained. The dimension of the data set was reduced from about 220,000 to 18, losing only one‐third of the information. PCA is therefore a very effective method to reduce the dimensionality of FDG PET imaging data.
Figure 2.
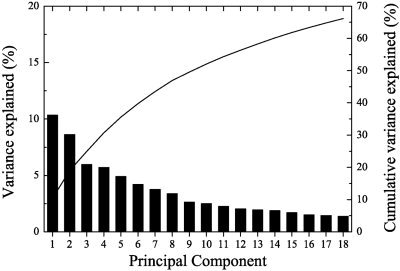
Variance explained by principal components. Two‐thirds of the variance within the images can be explained by the first 18 PCs.
Before the calculation of the T2 test, the PC scores were tested for normality. Only one of the PC‐scores taken into account for the test deviated significantly from normality at the 5% level. The T2 test (Fig. 3) demonstrates the absence of outliers in the data at the 1% level, and therefore, the images represent a homogeneous set, reflecting the quality of the selection process of normal subjects within the centres. Actually, after performing the T2 test on the initial set of control subjects one outlier had been detected. Though this subject had been clinically normal, his PET image had in fact showed questionable Alzheimer pattern. Further investigation showed that this subject went on to develop dementia within a few years after PET scanning. This subject was therefore removed from all subsequent analyses presented here. To further test the validity and the power of the T2 test, 15 PCA of 74 normal controls and one AD subject who was exchanged at each run were carried out. In each run the AD subject showed the highest T2 value. Eleven of the 15 AD subjects deviated solely and significantly at the 1% level from the mean.
Figure 3.
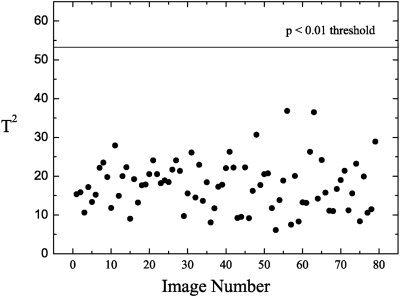
Hotelling T2 test for the first 18 PCs with a threshold of P < 0.01, showing no outliers.
In the test of robustness, by removal of different subsets from the data, PC1 and PC2 did not change significantly. The mean of the 105 correlation coefficients among the first PCs of the different data sets was 0.97 (SD 0.02) with minimum and maximum values of 0.88 and 0.99 respectively. For PC2 the average correlation coefficient was 0.96 (SD 0.018, min 0.90, max 0.99). After these technical checks that demonstrated the homogeneity of the sample and the stability of the method, we continued the analysis of the results.
Figure 4 shows the correlation coefficients of all PC‐scores and age, and demonstrates that only the first two PCs were statistically significant (P < 0.01). The second PC had the highest correlation coefficient, with R2 = 0.314 and P < 10−6 (Fig. 5). Thus, about 31% of the variance with respect to age was explained by PC2 alone. PC1 explained about 17% of the variance and was also highly significant (P < 10−3; Fig. 6).
Figure 4.
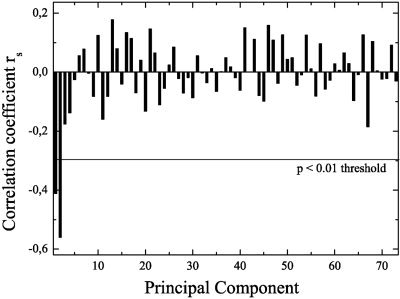
Spearman's correlation between PC‐scores and age. Only the first two PCs are correlated with the age at 1% level.
Figure 5.
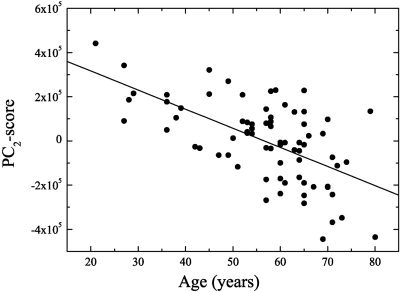
Negative correlation between age and the projections on PC2 with R2 = 0.314 and P < 10−6.
Figure 6.
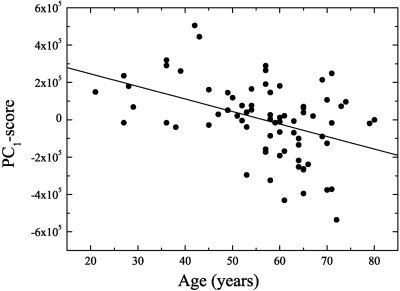
Negative correlation between PC1 scores and age. Note that only from an age of about 55 years several subjects demonstrate high negative scores, however, fitting a second order polynomial through the data did not result in any significant nonlinear contribution.
Figures 7 and 8 show PC1 and PC2, respectively, projected onto a spatially normalized MRI belonging to one subject of the group. The 80th percentile threshold was used to show only the most relevant features, demonstrating a relative reduction of activity. Voxels with a high weight in PC1 (Fig. 7) were preferentially located in and around the cerebral ventricles and in frontobasal and perisylvian structures. This was balanced by negative weights in most of the cerebral cortex. PC2 (Fig. 8), which was most significantly correlated with age, had highest positive loadings in frontal cortex, in particular in dorsolateral and medial prefrontal association cortex. Further high positive loadings could be found in posterior parietal and posterior cingulate cortices, indicating that metabolism in these structures declined significantly with age. Interestingly, the caudate nuclei also showed this decline. Thus, we identified two different and independent sets of brain areas, defined by high covariance of brain metabolism within each set, which were both significantly correlated with age. PC1‐scores appeared to be relatively stable up to age 55 but were reduced in some of the older subjects (Fig. 6), resulting in a weaker correlation with age than observed for PC2‐scores that exhibited a more linear decline (Fig. 5). PC3 had high loadings in parasagittal cortex (close to the falx and sagittal sinus), midbrain, and cerebellum. Regarding PC4, high loadings were present in the heads of the caudate nuclei and the thalamus (close to the ventricles), and the occipital cortex.
Figure 7.

PC1 projected on a spatially normalized MRI showing only positive regions. The 80th percentile was used as a threshold. The units of the coordinates are mm and refer to the MNI coordinate system.
Figure 8.

PC2, the most significant PC correlated with the age projected on a spatially normalized MRI. Only those pixel of the PC are shown that have higher values than the 80th percentile. The units of the coordinates are mm and refer to the MNI coordinate system.
Investigations of the effect of resolutions and gender on PC1 and PC2 using the χ2 test on proportion for linear trends and the point bi‐serial correlation coefficient respectively, showed no significant association or dependencies between in‐plane resolution, slice thickness and gender on PC1 and PC2.
The univariate (voxel‐by‐voxel) correlation analysis showed almost exactly the same structures that demonstrate a declining metabolism with age (Fig. 9) as identified by PC1 and PC2.
Figure 9.

The parametric map of the univariate (voxel‐by‐voxel) correlation analysis projected on a stereotactically normalized MRI. Those voxel corresponding to the colors red, blue and green show a significant decline in metabolism with age at the 1%, 5%, and 40% level, respectively. The units of the coordinates are mm and refer to the MNI coordinate system.
DISCUSSION
In this cross‐sectional study of normal brain metabolism, we found that there are relatively few distinct large‐scale networks in normal brain that show high metabolic covariance. Age was a significant covariate in those two components that explained most of the variance, whereas there was no significant influence of gender. This suggests that age is likely to be the most important factor influencing the function of large‐scale brain networks. We obtained two robust principal components that by construction do not correlate with each other, which both were related to age, suggesting that the influence of age on brain metabolism is not due to a unitary mechanism. This is not unexpected in view of the large variety of physiological changes that occur with aging in the brain, including vascular and structural changes [Raz, 2000].
Measurements of cerebral glucose metabolism with PET are influenced by local atrophy via partial volume effects that leads to underestimation of metabolism in areas that are adjacent to areas with lower metabolism [Mazziotta et al., 1981]. Correction for this effect [Tanna et al., 1991] would require coregistered and segmented MRI of very high quality [Meltzer et al., 2000] and has not yet been validated for use on a voxel‐by‐voxel basis. Thus, atrophy correction was not available in this study, and our data therefore reflect the combined effect of atrophy and reduction of local metabolism within tissue.
PC2 was the most significantly correlated with age. It showed high positive loadings in the frontal cortex, particularly in the medial and dorsolateral prefrontal association cortex, as well as in the posterior parietal and posterior cingulate cortices, indicating that metabolism in these structures declines significantly with age. Interestingly, the caudate nuclei, which have strong reciprocal anatomic connections with the prefrontal cortex, also exhibited this relationship. This age‐related decline contrasts with the relative preservation with age of glucose metabolism in the cerebellum, putamen, thalamus and occipital and primary motor cortices.
It is important to note that the univariate (voxel‐by‐voxel) correlation analysis, which is a hypothesis driven approach, shows almost exactly the same regions as PCA, which is a purely data driven method, in its first two PCs. The latter are chosen to extract those patterns explaining the greatest variance in the data, being unaware of any covariate such as age. Thus PCA is able to identify also unexpected sources of variance and can be seen as a hypothesis generating method. For the future it will be interesting to extract disease‐specific patterns from cohorts of subjects suffering from dementia or depression and search for the underlying covariates.
Although the findings of the two age‐related PCs are globally consistent with previous reports employing region of interest techniques [Blesa et al., 1997; Kuhl et al., 1982; Pantano et al., 1984] that reported age‐related decreases of regional cerebral blood flow (rCBF) and metabolism mainly in frontal cortex, they overall are strikingly similar with three recent univariate voxel‐based studies of resting‐state CMRGlc [Garraux et al., 1999; Petit‐Taboue et al., 1998] and rCBF [Calautti et al., 2001]. An earlier voxel‐based study found similar though less widespread changes in rCBF with normal aging, possibly due to the overly conservative statistical cut‐off used by the authors [Martin et al., 1991]. In a study closely related to our work, though ROI‐based, Moeller et al. [1996] also found a pattern of covariance within a set of normal subjects demonstrating a significant correlation with age by means of SSM. This pattern based on 29 ROI and a linear combination of five principal components accounting for 48% of the aging variance demonstrated a similar frontal metabolic reduction as seen in our study. The region that was labeled as paracentral also shows a decrease of activity in our study but shows itself as being part of the entire parasagittal cortex.
The present results also indicate that there is a close covariance among brain regions. They are connected by extensive projection fibers that have been shown to undergo microstructural changes during aging as measured by diffusion tensor imaging [Pfefferbaum et al., 2000]. The age‐related decline of these association areas is in contrast to relative preservation of glucose metabolism in cerebellum, putamen, thalamus, occipital and primary motor cortex. This spatial distribution is qualitatively similar to that of metabolic impairment in AD, but in AD the posterior cingulate and temporoparietal regions show more severe metabolic reduction than the prefrontal areas [Minoshima et al., 1997]. Thus, the same network of cortical association areas seems to be vulnerable to aging and to AD, but the changes observed in healthy aging are strongest in frontal association cortex and thus do not appear to merely represent very mild AD. As mentioned above, the apparent age‐related metabolic decline may be partly due to atrophy by quite a significant degree, as indicated in a recent ROI‐based study of cerebral blood flow measured with PET [Meltzer et al., 2000]. Predominant frontal atrophy related to aging was also noted in several studies with MRI and CT [see review by Raz, 2000].
PC1 showed high loadings in the vicinity of the ventricles, the basal cisterns and the sylvian fissure, which most likely reflects age‐related enlargement of these cerebrospinal fluid spaces due to brain atrophy. To a large extent the ventricles are delineated by white matter. Adjacent to the ventricles, PC2 showed high loadings only in grey matter structures (caudate nucleus), whereas PC1 also includes with high weight the large extent of white matter that delineates the ventricles. Thus, PC1 may reflect age‐related white matter atrophy and it is interesting to note that this effect is uncorrelated with the age‐related decline of metabolism in the association cortices. Age‐related white matter atrophy has been described in the anatomical and radiological literature [Raz, 2000]. The physiological meanings of PC3 and PC4 are not yet clear and require further studies including correction for possible local atrophy effects.
CONCLUSION
The results from the application of this new PCA method onto FDG‐PET data from subjects across a wide age range suggest that it is both reliable and efficient, whereas the striking similarity of the age effects on CMRGlc relative to previous univariate voxel‐based and multivariate studies strongly argues in favor of the overall validity of our method. In addition, it was shown that the effect of aging on brain metabolism as measured by neuroimaging, which shows the combined effect of metabolic and structural changes, has at least two independent dimensions that also merit further study by correlation with volumetric and neuropsychological measurements.
The finding that the only outlier in the T test was a subject who developed clear‐cut dementia at follow‐up as well as the fact that all 15 AD subjects showed the highest T2 value with 11 of them being significantly different can be seen as an illustration of the potential of PCA for diagnostic use that we will explore in further studies.
Acknowledgements
This study was conducted on behalf of the Network for Efficiency and Standardization of Dementia Diagnosis (NEST‐DD) with support from the European Commission (Framework V). The work includes data that were kindly provided by Dr. D. Perani, Milan, Italy, Dr. V. Holthoff, Dresden, Germany, and Dr. K. Ito, Obu, Japan.
REFERENCES
- Blesa R, Mohr E, Miletich RS, Randolph C, Hildebrand K, Sampson M, Chase TN (1997): Changes in cerebral glucose metabolism with normal aging. Eur J Neurol 4: 8–14. [DOI] [PubMed] [Google Scholar]
- Calautti C, Serrati C, Baron JC (2001): Effects of age on brain activation during auditory‐cued thumb‐to‐index opposition: a PET study. Stroke 32: 139–146. [DOI] [PubMed] [Google Scholar]
- Friston KJ, Frith CD, Liddle PF, Frackowiack RSJ (1993): Functional connectivity: the principal‐components analysis of large PET data sets. J Cereb Blood Flow Metab 13: 5–14. [DOI] [PubMed] [Google Scholar]
- Garraux G, Salmon E, Degueldre C, Lemaire C, Laureys S, Franck G (1999): Comparison of impaired subcortico‐frontal metabolic networks in normal aging, subcortico‐frontal dementia, and cortical frontal dementia. Neuroimage 10: 149–162. [DOI] [PubMed] [Google Scholar]
- Hotelling H (1931): A generalization of Student's ratio. Ann Math Stat 2: 360–378. [Google Scholar]
- Jackson JE (1991): A user's guide to principal components. New York: John Wiley & Sons, Inc. [Google Scholar]
- Jones K, Johnson KA, Becker JA, Spies PA, Albert MS, Holman BL (1998): Use of Singular value decomposition to characterize age and gender differences in SPECT cerebral perfusion. J Nucl Med 39: 965–973. [PubMed] [Google Scholar]
- Kuhl DE, Metter EJ, Riege WH, Phelps ME (1982): Effects of human aging on patterns of local cerebral glucose utilization determined by the [18F]fluorodeoxyglucose method. J Cereb Blood Flow Metab 2: 163–171. [DOI] [PubMed] [Google Scholar]
- Martin AJ, Friston KJ, Colebatch JG, Frackowiak RS (1991): Decreases in regional cerebral blood flow with normal aging. J Cereb Blood Flow Metab 11: 684–689. [DOI] [PubMed] [Google Scholar]
- Mazziotta JC, Phelps ME, Plummer D, Kuhl DE (1981): Quantitation in positron emission computed tomography: 5. Physical—anatomical effects. J Comput Assist Tomogr 5: 734–743. [DOI] [PubMed] [Google Scholar]
- McIntosh AR, Bookstein FL, Haxby JV Grady CL (1996): Spatial pattern analysis of functional brain images using partial least squares. Neuroimage 3: 143–157. [DOI] [PubMed] [Google Scholar]
- Meltzer CC, Cantwell MN, Greer PJ, Ben Eliezer D, Smith G, Frank G, Kaye WH, Houck PR, Price JC (2000): Does cerebral blood flow decline in healthy aging? A PET study with partial‐volume correction. J Nucl Med 41: 1842–1848. [PubMed] [Google Scholar]
- Minoshima S, Giordani B, Berent S, Frey KA, Foster NL, Kuhl DE (1997): Metabolic reduction in the posterior cingulate cortex in very early Alzheimer's disease. Ann Neurol 42: 85–94. [DOI] [PubMed] [Google Scholar]
- Moeller JR, Strother SC (1991): A regional covariance approach to the analysis of functional patterns in positron emission tomographic data. J Cereb Blood Flow Metab 11: A121–A135. [DOI] [PubMed] [Google Scholar]
- Moeller JR, Ishikawa T, Dhawan V, Spetsieris P, Mandel F, Alexander GE, Grady C, Pietrini P, Eidelberg D (1996): The metabolic topography of normal aging. J Cereb Blood Flow Metab 16: 385–398. [DOI] [PubMed] [Google Scholar]
- Moeller JR, Nakamura T, Mentis MJ, Dhawan V, Spetsieris P, Antonini A, Missimer J, Leenders KL, Eidelberg D (1999): Reproducibility of regional metabolic covariance patterns: comparison of four populations. J Nucl Med 40: 1264–1269. [PubMed] [Google Scholar]
- Oja E (1983): Subspace methods of pattern recognition. Hertfordshire, UK: Research Studies Press. [Google Scholar]
- Pantano P, Baron JC, Lebrun‐Grandie P, Duquesnoy N, Bousser MG, Comar D (1984): Regional cerebral blood flow and oxygen consumption in human aging. Stroke 15: 635–641. [DOI] [PubMed] [Google Scholar]
- Petit‐Taboué MC, Landeau B, Desson JF, Desgranges B, Baron JC (1998): Effects of healthy aging on the regional cerebral metabolic rate of glucose assessed with statistical parametric mapping. Neuroimage 7: 176–184. [DOI] [PubMed] [Google Scholar]
- Pfefferbaum A, Sullivan EV, Hedehus M, Lim KO, Adalsteinsson E, Moseley M (2000): Age‐related decline in brain white matter anisotropy measured with spatially corrected echo‐planar diffusion tensor imaging. Magn Reson Med 44: 259–268. [DOI] [PubMed] [Google Scholar]
- Raz N (2000): Aging of the brain and its impact on cognitive performance: integration of structural and functional findings In: Craik FIM, Salthouse TA, editors. The handbook of aging and cognition. 2nd Ed. Mahwah, NJ: Lawrence Erlbaum Associates; p 1–90. [Google Scholar]
- Strother SA, Anderson JR, Shaper KA, Sidtis JJ, Liow JS, Woods RP, Rottenberg DA (1995): Principal components analysis and the scaled subprofile model compared to intersubject averaging ans statistical parametric mapping: I. “Functional connectivity” of the human motor system studied with [15O] water PET. J Cereb Blood Flow Metab 15: 738–753. [DOI] [PubMed] [Google Scholar]
- Tanna NK, Kohn MI, Horwich DN, Jolles PR, Zimmerman RA, Alves WM, Alavi A (1991): Analysis of brain and cerebrospinal fluid volumes with MR imaging: impact on PET data correction for atrophy. Part II. Aging and Alzheimer dementia [see comments]. Radiology 178: 123–130. [DOI] [PubMed] [Google Scholar]
- Weaver JB (1995): Efficient calculation of the principal components of imaging data. J Cereb Blood Flow Metab 15: 892–894. [DOI] [PubMed] [Google Scholar]