

Calibration using the same sample being measured enables quantitative in-the-field diagnostics for complex biological samples.
Abstract
Easy-to-perform, relatively inexpensive blood diagnostics have transformed at-home healthcare for some patients, but they require analytical equipment and are not easily adapted to measuring other biomarkers. The requirement for reliable quantification in complex sample types (such as blood) has been a critical roadblock in developing and deploying inexpensive, minimal-equipment diagnostics. Here, we developed a platform for inexpensive, easy-to-use diagnostics that uses cell-free expression to generate colored readouts that are visible to the naked eye, yet quantitative and robust to the interference effects seen in complex samples. We achieved this via a parallelized calibration scheme that uses the patient sample to generate custom reference curves. We used this approach to quantify a clinically relevant micronutrient and to quantify nucleic acids, demonstrating a generalizable platform for low-cost quantitative diagnostics.
INTRODUCTION
Most blood diagnostics are complex assays that require highly trained staff and sophisticated analytical equipment, resulting in high per-sample costs and long waiting times for results. The promise of simple, low-cost diagnostics from small blood sample volumes has garnered great excitement and substantial investment (1), yet with the exception of a few extremely impactful but narrowly targeted products (e.g., blood glucose monitors), there are still no technologies that live up to the transformative potential of easy-to-use, accessible diagnostics. Cell-free expression (CFE) systems, consisting of cell extracts supplemented with additional chemical resources (2), are a particularly promising approach to fulfill this potential. In particular, their low cost, ease of use, small reaction volumes, and ability to be stably stored and shipped in a lyophilized, freeze-dried format make CFE systems appealing for use in almost any setting (from field studies to at-home use), with minimal or no equipment required (3–7). To date, however, equipment-free CFE-based diagnostics have been limited only to presence/absence detection (not quantification) and only to diseases with nucleic acid biomarkers. Importantly, the overwhelming majority of clinically relevant biomarkers for conditions beyond infectious disease are not nucleic acids, and for these biomarkers, quantification of their concentrations is critical (8–10).
Quantitative measurement of biomarkers in complex samples is inherently difficult to do robustly, and even more so when constrained to a minimal-equipment framework. Variability in the components of complex samples such as blood can affect the readouts of even sophisticated analytical instrumentation, a phenomenon known as “matrix effects” that can yield inaccurate results (11–13). In a system with minimal equipment and no mechanisms to compensate for sample-to-sample variability (such as cell-free diagnostics), these matrix effects may be substantial and could preclude the use of standard quantification approaches such as calibration curves made from chemical standards, thus hindering the development of clinically relevant quantitative CFE-based diagnostics. Here, we overcome the challenges of matrix-specific quantification via a generalizable parallel calibration strategy (Fig. 1A). Specifically, we create a CFE diagnostic platform that accurately quantifies biomarkers in 25 to 100% human serum. Furthermore, we demonstrate this platform by creating an imminently translatable equipment-free assay for a globally important nutritional biomarker.
Fig. 1. Proposal and development of parallel calibration approach for matrix-specific biomarker quantification.
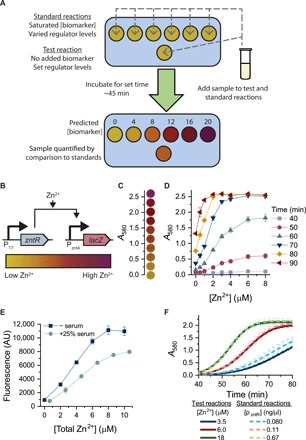
(A) Schematic of standardization method to account for matrix effects. An array of standard reactions will have saturated biomarker concentrations and varied regulator concentrations. The test reaction will have a set regulator concentration and no added biomarker. The sample to be analyzed will be added to both the standard and test reactions so that all reactions run in the same sample matrix. After a set incubation time, the color of the test reaction can be matched to the color of the standard reactions to determine biomarker concentration in the test reaction. (B) Schematic of a zinc-responsive circuit used to control β-galactosidase production. On one plasmid, ZntR is expressed from a T7 promoter, and on a second plasmid, β-galactosidase is expressed from the ZntR-activated promoter PzntA. (C) Pictures of visible colors from reactions corresponding with different absorbance measurements. The lowest A580 readings correspond with yellow reactions (the color of CPRG), and as the A580 increases, and the reaction color turns different shades of orange, red, and purple (the color of CPR). (D) Quantitative colorimetric response to added zinc. At early time points, there is no detectable absorbance of the purple substrate CPR at tested [Zn2+], and reactions appear yellow (the color of CPRG). As the reactions proceed, they produce CPR at different rates based on the concentration of Zn2+ in the reaction, with the maximal differences visible between 60 and 70 min. An ideal assay readout time would yield outputs spanning a wide range of absorbances across as much of the [Zn2+] range as possible. (E) Fluorescent response to zinc in 25% human serum, demonstrating substantial matrix effects in serum. AU, arbitrary units. (F) Selected time course readings of test and standard reactions run in 25% serum, demonstrating the mapping between the two reaction designs.
RESULTS
Matrix effects in cell-free diagnostics
With the ultimate goal of developing quantitative equipment-free diagnostics (regardless of matrix effects), we first sought to develop a clinically relevant test bed to demonstrate the potential of CFE to accomplish this goal. We chose to use zinc as the model analyte because of its global health relevance (zinc deficiency kills 100,000 children under the age of five every year) (14, 15), our group’s previous experience in developing whole-cell zinc biosensors (16–18), and the lack of field-deployable zinc diagnostics. Current clinical assessment of zinc levels requires high-pressure acid digestion and analysis with a mass spectrometer, a process that is costly and equipment intensive.
To begin, we tested whether zinc-responsive elements could properly control output in a CFE reaction. We constructed a regulator plasmid (pZntR) that constitutively expresses the zinc-responsive activator ZntR and a reporter plasmid (pGFP) that contains green fluorescent protein (GFP) under control of ZntR’s cognate promoter PzntA (fig. S1A). When both plasmids are added to a CFE reaction, the system shows a dose-dependent zinc response between 0 and 8 μM (fig. S1B), demonstrating that zinc can be detected in a cell-free system. Notably, the system also shows a marked decrease in protein production at higher zinc concentrations. We attributed this trend to decreased expression from native Escherichia coli σ70 promoters at high zinc concentrations, based on similar observations for constitutive E. coli σ70 promoters (fig. S1C).
To better enable equipment-free testing, we replaced the GFP reporter with β-galactosidase to create a plasmid (pLacZ) that can mediate a colorimetric output (Fig. 1B). β-Galactosidase cleaves the yellow substrate chlorophenol red (CPR)–β-d-galactopyranoside (CPRG) to the purple product CPR; this enzyme/substrate pair has previously been used in the development of low-resource diagnostic tools (3). Colorimetric output can be quantified by measuring absorbance at 580 nm or assessed qualitatively by looking at reaction color (Fig. 1C). We characterized the system’s behavior in a bacterial extract with no β-galactosidase or ZntR background activity (fig. S2, A and B). All reactions are initially yellow (the color of CPRG), and at intermediate time points, tests are varying shades of yellow, orange, red, and purple based on zinc concentrations (Fig. 1D and fig. S3). Lyophilized systems show a similar colorimetric response to zinc, a critical requirement for field-friendly deployment (fig. S4).
To tune reaction timing for detection purposes, we modulated the concentration of reporter plasmid in the reaction. As expected, higher concentrations of the reporter plasmid (pLacZ) decrease the incubation time required for visible color, although they also decrease the time interval over which a dose-dependent zinc response (color difference) is detectable (fig. S5). Thus, plasmid dosage can be used to create tests that meet the necessary time parameters for a given application. For most experiments, we selected reporter plasmid concentrations that allowed readouts in less than an hour but maximized the time interval over which dose-dependent color differences were evident.
With a CFE zinc sensor in hand, we then sought to test the hypothesis that CFE is prone to substantial matrix effects. Whereas CFE reactions respond to zinc in high concentrations (25%) of serum, the serum matrix markedly affects test output, reducing protein expression by 25 to 50% (Fig. 1E). The addition of higher reporter plasmid concentrations enables reactions run in 25% serum and lyophilized reactions run in 100% serum to still produce a spectrum of colors across a large range of zinc concentrations (fig. S6). However, the markedly different expression levels of reactions run in serum (compared to reactions run without serum) preclude the use of chemical calibration standards, as they would not exhibit the same matrix effects. Because standards are required for a CFE quantitative diagnostic, a more sophisticated approach to quantification is necessary.
Test standardization in complex matrices
Since an ideal diagnostic would allow the user to match the test’s color output to a set of reference colors, accounting for all matrix effects caused by serum samples is critical. In addition, because the assay outputs change with time, those reference colors should also change over the course of the test. We next developed a standardization method that addresses both these issues so that the color of the test reaction can be matched to an array of standard reactions run in the exact same sample matrix as the test reaction (Fig. 1A).
To create such a matrix-specific standardization approach, we designed standard reference reactions so that they have saturated biomarker concentrations and a variable, predetermined amount of the response regulator. We found that the zinc response for a given concentration of the regulator plasmid pZntR saturates above a certain concentration of zinc (fig. S7) such that additional zinc does not affect colorimetric output. Instead, colorimetric output is solely dependent on the concentration of the transcriptional regulator ZntR, and ZntR levels can be controlled by varying the concentration of the regulator plasmid pZntR. This means that we can then create reference reactions that have saturated concentrations of zinc and that are thus insensitive to the (unknown) zinc concentrations of whatever sample is added to the reference reactions. A sample to be tested can thus be added to both the test and reference reactions, and any matrix effects of serum on CFE machinery will be identical in both the sample and the reference standards. The output of each reference reaction can then be set by changing the level of ZntR to reproduce the output that the test reaction would yield (at its fixed level of ZntR) for any given zinc concentration (Fig. 1F). Together, this allows sample-specific calibration for the test reaction.
Specifically, we found that in a 25% serum matrix, colorimetric output is identical across a raw concentration range of 8 to 16 μM added zinc (fig. S7). If each standard reaction starts with 8 μM zinc and each raw sample added to a standard reaction has no more than 8 μM zinc, then the final standard reactions will have between 8 and 16 μM zinc, and thus have constant output. This enables tests run in 25% serum to differentiate between 0 and 8 μM raw zinc, corresponding to a clinically relevant serum zinc range of 0 to 32 μM.
To determine what concentrations of the regulator plasmid pZntR to use in predictive standards, we ran a large set of standard reactions (with saturated zinc and varied pZntR concentrations) and hypothetical test reactions (with a set pZntR concentration and varied zinc) in pooled serum (fig. S8) that was collected from three individual donors. For each concentration of zinc in the hypothetical test reactions, we identified a standard reaction with nearly identical colorimetric output (Fig. 1F). The relationship between regulator and zinc concentrations was consistent across experiments run on different days and in different batches of cell extract (fig. S9). From these runs, we determined the optimal regulator plasmid concentration to put in each reference reaction to create standards that correspond with different potential test results.
Accurate biomarker quantification in serum
We next used these optimal regulator plasmid concentrations to quantify zinc in single-donor serum samples. Different concentrations of zinc were spiked into individual (zinc-depleted) serum samples, and each of these serum samples was then added to (i) a test reaction containing a defined concentration of the pZntR plasmid with no added zinc and (ii) a set of standard reference reactions containing saturated zinc with the predetermined pZntR concentrations. Evaluation at a single time point within the 1-hour target time frame (56 min) shows accurate test results: The colorimetric output of each test reaction matched the appropriate reference reaction for all samples tested (including serum excluded from the pooled sample used for test calibration). The test accurately classified all serum zinc concentrations below 20 μM into concentration bins with a width of 4 μM (Fig. 2A). Although the test inaccurately classified some of the zinc concentrations above 20 μM (far above the deficiency threshold), the range of accurate predictions covers all clinically relevant serum zinc concentrations.
Fig. 2. Quantification approach provides high prediction accuracy at micromolar resolution of raw sample concentrations.
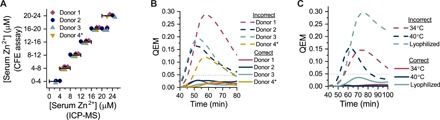
(A) Quantification of serum zinc concentrations for all four single-donor samples tested, evaluated at 56 min. Zinc concentration in chelex-treated samples was measured with inductively coupled plasma–mass spectrometry (ICP-MS), and defined zinc standards were added to each sample to achieve a range of concentrations. Serum from donors 1 to 3 was used in initial calibration, and serum from donor 4 was only used in test validation, indicated by the asterisk. Symbols falling inside the horizontal bars that correspond with the binned prediction ranges for each y-axis level indicate that the CFE test accurately quantified zinc in the serum sample. (B) Error quantification of all individual donor samples via the QEM. Low QEM for correct predictions and high QEM for incorrect predictions indicate unambiguously interpretable test results for a given time. (C) Error quantification in nonideal reaction conditions with serum from donor 4.
To quantitatively assess test prediction accuracy and specificity at all time points, we defined a quantification error metric (QEM) that captures the differences in absorbance, across all zinc levels, between test reactions and predictive standards (Supplementary Text). Ideally, the QEM of the correct predictions should be zero, and that of the incorrect predictions should be high. We set a QEM threshold that corresponds with the ability to differentiate between 1/10 increments of the color spectrum (Fig. 1C). In all serum samples, the QEM of the correct predictions is substantially lower than the set threshold, and that of the closest incorrect predictions is substantially higher than the threshold (Fig. 2B), indicating unambiguous interpretability of test results.
The parallelized calibration approach is robust to both assay conditions and multiple assay design parameters. Although optimal standards were chosen by correlations determined in freshly assembled reactions run at 37°C, the test accurately quantifies zinc when run at both 34° and 40°C and following lyophilization (Fig. 2C). Moreover, the method can reliably quantify zinc in samples without serum (fig. S10) and in assay designs where the transcriptional regulator is added to the reaction rather than being expressed during the reaction (figs. S11 and S12).
To further characterize our standardization approach, we created an ordinary differential equation model that qualitatively recapitulates our experimental results (Supplementary Text). On the basis of previously published approaches and parameters (19–23), sensitivity analysis was used to guide an iterative parameter fitting method that minimized the error between computational predictions and data collected from reactions run in 25% serum with a range of zinc concentrations (fig. S13); this approach provided improved parameter estimates compared to simultaneous optimization of all parameter values against all experimental data. When using these optimal parameter estimates, the model qualitatively reproduced the trend in the relationship between low zinc concentrations in the test reactions and regulator concentrations in the standard reactions and also reproduced the effect of incubation time on test interpretability and accuracy (fig. S14). The predicted regulatory concentrations were usually within a factor of 2 of the experimentally observed results (fig. S9), although there were differences in the exact quantitative values due to the limitations of our model’s assumptions (including binding kinetics and parameter lumping). Of the identified relevant parameters, the predictive ability of the test is most sensitive to changes in the binding constant of zinc to ZntR, the transcriptional rate of ZntR, the degradation rate of RNA, the translational rate of proteins, and the cleavage rate of CPRG to CPR (fig. S15).
Equipment-free test interpretation in serum
Ideally, for an equipment-free test, users could easily match the color of the test reaction to the color of standard reference reactions, similarly to how one reads pH strips. The diverse array of colors that correspond with intermediate reaction stages (Fig. 1C) readily enables this interpretation. However, when the test is run in serum, the distinct colored intermediates (orange and red) are eliminated, and all intermediate reaction states are varying degrees of yellow and purple (Fig. 3A). While this has minimal effect when quantifying test output via absorbance, the lack of distinct intermediates makes quantitation by eye much more challenging.
Fig. 3. Addition of small molecules reverses color shifts due to serum albumin.
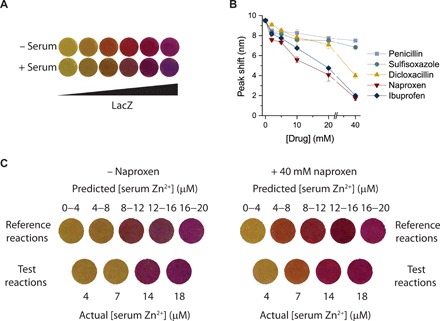
(A) Reactions run in serum appear different from reactions run in the absence of serum. Reactions with complete conversion of CPRG to CPR appear more purple in a 25% serum matrix. In 25% serum, the colored orange and red reaction intermediates initially observed are no longer visible. (B) Whereas the presence of serum shifts the absorbance peak of CPR approximately 10 nm, the addition of small molecules that bind albumin reverses this spectrum shift. (C) Visualization of standard reference and test reactions in 25% serum. Standard reference reactions contain a saturated amount of zinc and predetermined concentrations of the pZntR plasmid. Test reactions contain a set amount of the pZntR plasmid and specified zinc concentrations. All reactions were run for 50 min and then visualized either with or without 40 mM naproxen addition. With added naproxen, the color of test reactions matches the color of the appropriate standard reference reaction.
Elimination of colored intermediates corresponds with a 10-nm shift in the absorption spectrum of CPR (fig. S16). Dyes with similar structures to CPR are known to change color upon interaction with serum albumin (24, 25), and we demonstrated that human serum albumin reproduces the color change seen in serum samples (fig. S17), which is consistent with previous work using albumin-coated paper (3). To reverse this color change, we added different compounds known to bind serum albumin (26), with the aim of displacing CPR from albumin. Naproxen addition elicited the most marked effects, nearly restoring reaction color to its appearance without added serum (Fig. 3B and fig. S18) and thus enabling equipment-free biomarker quantification (Fig. 3C).
Generalizability of quantification approach
To demonstrate that our approach can be used to quantify multiple classes of biomarkers using various molecular-level sensing mechanisms, we applied the same framework to quantification of RNA via an established toehold switch (Fig. 4A) (3). We constitutively expressed a toehold switch from the plasmid pSwitch in the CFE reaction to measure trigger RNA that was directly added to CFE reactions. In this nucleic acid sensing implementation of our calibration approach, the pSwitch plasmid serves as the response regulator (analogous to the pZntR plasmid in the zinc sensing application), and the trigger RNA is the biomarker. Thus, the test reaction has a defined amount of the pSwitch plasmid with no initial trigger RNA, and standard reference reactions have saturated levels of trigger RNA (fig. S19) and variable amounts of the pSwitch plasmid. Standard reference reactions should reproduce the response of test reactions with different measured levels of trigger RNA. For each trigger concentration tested, we identified a standard reaction that shows a nearly identical colorimetric output (fig. S20); the relationship between trigger concentration in the test reactions and switch concentration in standard reactions is consistent across experiments (fig. S21). From these data, we determined the optimal set of switch concentrations that match each desired trigger concentration for a calibration curve.
Fig. 4. Quantification approach is generalizable to toehold switches.
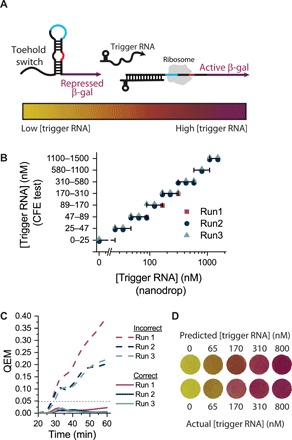
(A) Schematic of toehold switch used to control β-galactosidase production. Trigger RNA unfolds the toehold switch and enables β-galactosidase translation. Increasing amounts of trigger RNA correspond with increased β-galactosidase translation. (B) Test quantification of trigger concentrations, evaluated at 40 min. Purified RNA was added to each sample at different known concentrations. Symbols falling inside the horizontal bars that correspond with the binned prediction ranges for each y-axis level indicate that the CFE test accurately quantified RNA in the sample. (C) Quantification error for toehold sensing. (D) Visualization of test and standard reactions, evaluated at 40 min. The color of test reactions matches that of the appropriate standard reference reaction.
Optimized standard reactions accurately quantify trigger concentrations in all test reactions (Fig. 4B). QEM quantification (Fig. 4C) shows nearly ideal test behavior across time points, and the colors of the test reactions accurately match the color of the correct corresponding standard reactions (Fig. 4D). We also created an ordinary differential equation model recapitulating toehold switch results from experiments (Supplementary Text and fig. S22). Parameter values obtained from the estimation procedure mentioned before qualitatively reproduced the logarithmic relationship between trigger concentration in test reactions and switch concentration in standard reactions (fig. S23). Of the identified parameters, the mapping of test and standard reaction is most sensitive to changes in the maturation rate of trigger RNA to its active form and the transcriptional rate of the switch (fig. S24).
The resulting RNA quantification platform could be used to directly quantify RNA in biological samples. It could also be used for more sensitive RNA assessment by processing samples through a pipeline that includes reverse transcription and transcription if the processing pipeline yields quantitatively reproducible amplification (the calibration approach can compensate for matrix effects, but not quantitative variation introduced by upstream processing).
DISCUSSION
Matrix-specific quantification is a critical step in enabling low-cost diagnostics with clinical impact. In this work, we developed a versatile, low-cost (table S7), cell-free diagnostic platform that allows robust quantification of biomarker levels in different environmental conditions. We specifically address the impacts of the sample matrix on accuracy and robustness of quantification by using the patient sample itself as the sample matrix for the parallel calibration standards. Further, our approach enables test interpretation without any equipment by engineering an originally two-color readout to take advantage of the broad color spectrum that corresponds with different levels of β-galactosidase activity.
The specific zinc assay we created is readily translatable to public health and clinical diagnostic applications. Of foremost importance, our test detects diagnostically relevant concentrations of serum zinc, the biomarker for a nutritional deficiency that kills 100,000 children under age five annually. Thresholds used for identifying zinc deficiency are typically no lower than 8.5 μM and no higher than 11.5 μM (14). Our assay (in 25% serum) reliably distinguishes 4 μM increments between 0 and 20 μM serum zinc (Fig. 2A), which enables identification of sufficient, borderline, and low serum zinc levels. This approach meets nearly all requirements for field-friendly testing (27) in the developing world (where zinc deficiency is mostly found), as it requires no electricity or analytical equipment, requires minimal processing steps [only separation of red blood cells from serum, which can be accomplished with field-friendly approaches (28)], and uses only a finger-stick volume of blood. (A schematic overview of low-resource field testing use is shown in fig. S25.) Although zinc overdose is rare, the test could be slightly altered via incorporation of zinc chelators or addition of smaller serum volumes so that it could quantify serum zinc concentrations indicative of zinc overdose (>75 μM) (29).
Our matrix-specific quantification approach can be easily expanded to other biomarkers. For example, we showed that by replacing a transcription factor–based sensor with a toehold switch (a completely different information transduction mechanism), we could create a minimal-equipment test that could quantify nucleic acids. Our platform, therefore, is positioned to serve as an important foundation for cell-free biosensors, especially given the rise of efforts to use CFE systems and purified in vitro platforms to quantify diverse types of analytes (3–6, 30, 31). Transcription factors that bind to a new target molecule can be seamlessly integrated into the developed framework, as could toehold switches for any nucleic acid sequence, or established riboswitches; this already gives a wide starting point for the number of quantitative diagnostics that could be created using this approach. Sensing systems, such as aptamers and antibody fragments, can be readily evolved to detect small molecules or proteins with user-defined sensitivity, potentially expanding the reach of this platform to essentially arbitrary biomarkers (32, 33).
Although we focused on equipment-free test interpretation, the matrix-specific quantification platform could also be incorporated into a minimal-equipment testing framework for automated, more precise quantification. A user could add a cartridge of lyophilized test and standard reactions for any desired biomarker to a low-cost absorbance reader and use serum from just a finger prick of blood to rehydrate and activate the tests. The reader would then report a more precise, matrix-normalized biomarker concentration.
These tests—whether interpreted visually or with equipment—would enable at-home health monitoring or could be used as rapid initial screens in clinics before ordering more expensive laboratory panels. Together, assays developed via the quantification platform described here could markedly improve access to vital health information, potentially transforming health monitoring and analytics.
MATERIALS AND METHODS
Construction of zinc-responsive circuit
Three plasmids were assembled through Gibson assembly: one in which the transcription factor ZntR was under the control of a standard T7 promoter, one in which PZntA controlled sfGFP production, and one in which PZntA controlled β-galactosidase production. ZntR and PZntA were amplified from a previously described plasmid (17). β-Galactosidase was amplified from BL21(DE3) genomic DNA, and sfGFP was amplified from the plasmid pJL1. All operons were cloned into a plasmid containing a ColE1 origin and a kanamycin resistance cassette. All primers and plasmid sequences can be found in the Supplementary Materials. All plasmids were purified with EZNA midiprep columns and sequence-confirmed.
Construction of knockout strains
Lambda red recombination was used to make all knockout strains. The kanamycin resistance cassette was amplified from the plasmid pKD4 using primers that contained the P1 and P2 priming sequences specified by Datsenko and Wanner (34) and an additional 50 nucleotides of the appropriate upstream (P1) or downstream (P2) homologous sequence for the specific knockout. The polymerase chain reaction (PCR) product was gel-purified and transformed via electroporation into cells that contained the plasmid pDK46, which expresses the lambda red recombinase under control of the PBad promoter. Two knockout strains were constructed: A strain with the full Lac operon deleted was constructed as previously described (35) to make BL21(DE3) ΔlacIZYA, and a dual knockout strain with zntR deleted was also constructed to make BL21(DE3) ΔlacIZYA ΔzntR. Successful knockouts were selected on kanamycin plates, and replacement of the target gene with the kanamycin cassette was confirmed via PCR. The kanamycin selection marker was not excised. For the dual knockout strain, zntR was first knocked out and selected via antibiotic resistance. Then, lacIZYA was knocked out, and blue-white screening and PCR were used to confirm successful knockouts.
Preparation of cellular lysate
Cellular lysate for all experiments, excluding toehold switch experiments, was prepared as previously described (36, 37). BL21(DE3) ΔlacIZYA ΔzntR cells were grown in 2× YTPG medium at 37°C and 180 rpm to an optical density (OD) of 2.0, which corresponded with the mid-exponential growth phase. Cells were then centrifuged at 2700 rcf and washed three times with S30 buffer. S30 buffer contains 10 mM tris-acetate (pH 8.2), 14 mM magnesium acetate, 60 mM potassium acetate, and 2 mM dithiothreitol. After the final centrifugation, the wet cell mass was determined, and cells were resuspended in 1 ml of S30 buffer per 1 g of wet cell mass. The cellular resuspension was divided into 1-ml aliquots. Cells were lysed using a Q125 sonicator (Qsonica, Newton, CT) at a frequency of 20 kHz and at 50% of amplitude. Cells were sonicated on ice with three cycles of 10 s on and 10 s off, delivering approximately 180 J, at which point the cells appeared visibly lysed. An additional 4 mM dithiothreitol was added to each tube, and the sonicated mixture was then centrifuged at 12,000 rcf and 4°C for 10 min. The supernatant was removed, aliquoted, and stored at −80°C for future use.
Cellular lysate for toehold switch experiments was prepared as previously described by Sun et al. (38). BL21 Star (DE3) ΔlacIZYA cells were grown in 2× YTP medium at 37°C and 220 rpm to an OD of 2.0. Cells were centrifuged at 2700 rcf and washed three times with S30A buffer [50 mM tris, 14 mM magnesium glutamate, 60 mM potassium glutamate, 2 mM dithiothreitol (pH-corrected to 7.7 with acetic acid)]. Wet cell mass was determined after the third centrifugation step, and the cells were resuspended in 1 ml of S30A buffer per 1 g of wet cell mass and sonicated using the same method described above, although with a sonication output of approximately 400 J. Following the centrifugation of the sonicated cellular mixture, the supernatant was removed, divided into 0.5-ml aliquots, and incubated at 37°C and 220 rpm for 80 min. After this runoff reaction, the cellular lysate was centrifuged at 12,000 rcf and 4°C for 10 min. The supernatant was removed and loaded into a 10-kDa molecular weight cutoff dialysis cassette (Thermo Fisher). Lysate was dialyzed in 1 liter of S30B buffer [14 mM magnesium glutamate, 60 mM potassium glutamate, 1 mM dithiothreitol (pH-corrected to 8.2 with tris)] at 4°C for 3 hours. Dialyzed lysate was removed and centrifuged at 12,000 rcf and 4°C for 10 min. The supernatant was removed, aliquoted, flash-frozen in liquid nitrogen, and stored at −80°C for future use.
Cell-free reactions: Constitutive expression and zinc sensing
Cell-free reactions for all experiments, excluding toehold switch reactions, were run as previously described (39). Each cell-free reactions contained 0.85 mM each of guanosine triphosphate (GTP), uridine triphosphate (UTP), and cytidine triphosphate (CTP), in addition to 1.2 mM adenosine triphosphate (ATP), folinic acid (34 μg/ml), E. coli transfer RNA (tRNA) mixture (170 μg/ml), 130 mM potassium glutamate, 10 mM ammonium glutamate, 12 mM magnesium glutamate, 2 mM each of the 20 standard amino acids, 0.33 mM nicotine adenine dinucleotide (NAD), 0.27 mM coenzyme A (CoA), 1.5 mM spermidine, 1 mM putrescine, 4 mM sodium oxalate, 33 mM phosphoenol pyruvate, 27% cell extract, and the specified concentration of plasmids. In all reactions producing β-galactosidase, CPRG was added to a final concentration of 0.6 mg/ml. All chemicals were purchased from Sigma-Aldrich. In reactions containing human serum, ribonuclease (RNase) inhibitor (New England BioLabs) was added to a concentration of 0.6 U/μl.
In all reactions producing GFP, plasmids were added to reactions at a final concentration of 20 ng/μl. Plasmid dosage of β-galactosidase and ZntR expression plasmids (pLacZ and pZntR) was optimized so that color change would be observable at approximately 60 min. In reactions without serum, pLacZ was added at a concentration of 1.0 ng/μl when ZntR was preexpressed and at a concentration of 1.5 ng/μl when ZntR was coexpressed. When ZntR was coexpressed in reactions without serum, pZntR was added to reactions at a concentration of 0.5 ng/μl. In all reactions with serum, pLacZ was added at a concentration of 15 ng/μl, and pZntR was added at a concentration of 2.5 ng/μl.
In experiments in which ZntR was preexpressed and added to the reaction (figs. S11 and S12), ZntR was first produced overnight in a cell-free reaction. Reactions were carried out in 1.5-ml microcentrifuge tubes, and the reaction volume in each tube was 50 μl. A plasmid expressing ZntR (pZntR) was added at 20 ng/μl, and a plasmid expressing a ZntR-GFP fusion protein was added at 1 ng/μl as a way to assess the output of the reaction. Reactions were incubated at 30°C for 16 hours. Reactions were then centrifuged at 12,000 rcf and 4°C for 10 min, and the supernatant was removed and subsequently used. On the basis of the assumptions that the transcriptional rates of both ZntR and the ZntR-GFP fusion protein are identical (because they have the same promoter) and that the translational rates of both proteins are identical (because they have the same 5′ untranslated region and initial coding sequence), fluorescence was used as a proxy measurement for total ZntR production. Although these fluorescent measurements give an arbitrary approximation of final ZntR production and not an absolute concentration, they enable easy and fast comparison across different CFE reactions. To measure fluorescence, each reaction was diluted by a factor of 10 in nuclease-free ultrapure water. Ten microliters was added to a well of a 384-well plate, and the fluorescence was measured with a plate reader (Synergy4, BioTek). Excitation and emission for sfGFP were 485 and 528 nm, respectively. Fluorescence values were used to account for batch-to-batch variations so that a constant amount of ZntR was added to each reaction. Unless otherwise specified, the overnight ZntR reaction was added to fresh reactions at a concentration of 1% (± variations of less than 0.05% determined through fluorescent quantification measurements).
CFE reactions were run in 8 μl of volumes in 384-well small volume plates (Greiner Bio-One), and a clear adhesive film was used to cover the plate and prevent evaporation. Fluorescence of GFP was quantified as described above. β-Galactosidase activity was monitored by measuring absorbance at 580 nm. For time course experiments, plates were incubated at 37°C, and either fluorescence or absorbance was measured every 2 min. For endpoint experiments, plates were incubated at 37°C, and fluorescence was measured after 22 hours.
Cell-free reactions: Toehold switches
For experiments involving toehold switches, cell-free reactions were run according to the protocol described by Sun et al. (38). Each reaction contained 1.5 mM ATP and GTP, 0.9 mM CTP and UTP, E. coli tRNA mixture (0.2 mg/ml), 0.33 mM NAD, 0.26 mM CoA, 0.75 mM cyclic adenosine monophosphate, 0.068 mM folinic acid, 1 mM spermidine, 30 mM 3-phosphoglyceric acid, 50 mM Hepes, 1.5 mM each of the 20 standard amino acids, 4 mM magnesium glutamate, 100 mM potassium glutamate, 2% PEG-8000 (polyethylene glycol, molecular weight 8000), 33% cell extract, CPRG (0.6 mg/ml), and DNA expression plasmids. Toehold switch was expressed from the plasmid pSwitch. Unless otherwise specified, the concentration of pSwitch in reactions was 2.5 nM. Trigger RNA was produced from linear DNA template (40 ng/μl) in an in vitro transcription reaction using T7 RNA Polymerase (New England BioLabs), following the manufacturer’s protocol. Synthesized RNA was treated with deoxyribonuclease to remove the DNA template and then purified using a Zymo RNA Clean and Concentrator kit (R1014), according to the manufacturer’s protocol. Time course reactions were run as described above.
Determination of best-fit reactions and predictive standard reactions
In determining which standard reference reaction best fit each zinc concentration, sum of squared error (SSE) minimization was used. The difference between each standard and test reaction was calculated at all time points between 30 and 90 min. The SSE was calculated over this time frame, and the standard reaction that had the lowest SSE was determined to be the best-fit reaction and thus the optimal regulator for that experimental run. When choosing what regulator concentration best predicts each potential biomarker concentration, the overall optimal regulator concentration was determined to be the one closest to the average of the optimal matching regulator concentration across three runs.
Preparation of human serum
Pooled human serum was purchased from Corning. Chelex 100 (Bio-Rad) was used to deplete zinc from the serum. One gram of resin was added to 100 ml of serum, and serum was stirred for 2 hours. Resin was removed from serum through filtration.
In single-donor experiments, blood was collected from donors as approved in Institutional Review Board protocol number H17489. Venous blood was collected in 6 ml of BD Vacutainer collection tubes for trace element testing, and tubes were left on ice for 30 min to clot. Blood was then transferred to a 50-ml conical tube and centrifuged at 2700 rcf, 4°C for 30 min. The serum was removed and either immediately frozen or treated with Chelex 100 resin. Eight milligrams of resin was added to 8 ml of serum, and the mixture was vigorously stirred for 2 hours. Resin was isolated from the samples through centrifugation, and serum was syringe-filtered. All serum samples were aliquoted to minimize freeze-thaw cycles and stored at −20°C.
Zinc measurements
Zinc concentration of pooled serum was analyzed using an x-ray fluorescence (XRF) spectrometer. Two microliters of serum was spiked with 1 ppm (part per million) of a gallium internal standard and pipetted onto a quartz disc, and atomic fluorescence emission spectra were collected. Zinc concentration in individual donor serum samples was measured at the University of Georgia Laboratory for Environmental Analysis. Samples were digested with concentrated acid and analyzed with inductively coupled plasma–mass spectrometry (ICP-MS) according to EPA method 3052.
Spectrum analysis
To analyze the spectrum of CPR and reaction intermediates, a large batch of concentrated CPR was made by adding CPRG to a small amount of extract made from standard BL21(DE3) cells (which have high baseline β-galactosidase activity). The spectrum of CPR was analyzed to ensure that all CPRG reacted to CPR by screening for the absence of a detectable peak at 410 nm. Different combinations of CPRG and CPR were then added to solutions containing 27% bacterial cell extract [made from BL21(DE3) ΔlacIZYA cells], with or without serum. The final concentration of dye in each solution analyzed was 1.02 μM, which corresponds with the addition of CPRG (0.6 mg/ml).
When adding small molecules to the reaction, 10× stocks of each molecule were made. Penicillin, dicloxacillin, and naproxen were dissolved in water; ibuprofen was dissolved in ethanol; and sulfisoxazole was dissolved in chloroform. Three microliters of each stock was added to PCR tubes, and tubes were left open in a fume hood overnight so that solvents could evaporate. A 30-μl solution containing the specified amount of dye, protein extract, and serum was used to redissolve the small molecule. Concentrations reported are the final concentration of small molecule in the analyzed solutions.
The spectra of all solutions reported were measured in triplicate with a NanoDrop 2000 spectrophotometer. When analyzing reaction intermediates, spectrum height was normalized to a peak at 280 nm. When further analyzing the peak corresponding with CPR, each spectrum was first height-normalized so that the maximum of the peak corresponding with CPR was the same for all spectra. Then, the wavelengths that correspond with four different absorbance intensities were determined and subtracted from the values of the control spectrum. The four differences were averaged to compute the overall wavelength shift. Reported averages are the average of the overall wavelength shift of the three initial replicates.
Color imaging and processing
All pictures were taken with a Panasonic Lumix camera in a light-controlled setting. All pictures in figures showing color results are of 8-μl reactions in 384-well plates. The centers of selected reaction wells were cropped using Adobe Photoshop and combined to make color arrays. A brightness filter was uniformly applied to photos to make them better resemble actual appearance.
Lyophilization
Thirty-microliter reactions containing all components of the cell-free reaction (including lysate, small-molecule mix, DNA templates, and CPRG) at a 1× concentration were prepared in PCR tubes and flash-frozen in liquid nitrogen. Frozen samples were removed from liquid nitrogen and added to a Labconco Fast-Freeze flask that contained a small amount of liquid nitrogen. Care was taken to transfer samples quickly and keep samples cold throughout the transfer process. Flasks were connected to a Labconco benchtop freeze dryer and lyophilized at −50°C and 0.05 mbar for 3 hours. Samples were then removed and rehydrated on ice.
Supplementary Material
Acknowledgments
We thank P. Santangelo and his laboratory, specifically D. Vanover, for usage of and assistance with their lyophilizer; Y. Xia and his laboratory, specifically M. Xiao, for preliminary ICP-MS analysis support; and A. Reddi and his laboratory, specifically C. Stapleton, for preliminary XRF support. Funding: M.P.S. thanks the NIH (R01-EB022592 and R35-GM119701) and the NSF (MCB-1254382) for support. M.P.M. was supported by an NSF graduate research fellowship (DGE-1650044). M.C.J. acknowledges support from the Air Force Research Laboratory Center of Excellence for Advanced Bioprogrammable Nanomaterials (C-ABN) (grant FA8650-15-2-5518), the U.S. Defense Advanced Research Projects Agency’s (DARPA) Living Foundries (program award HR0011-15-C-0084), the Army Research Office (W911NF1810181), the David and Lucile Packard Foundation, and the Camille Dreyfus Teacher-Scholar Program. Author contributions: Conceptualization: M.P.M. and M.P.S.; investigation: M.P.M., Y.Z., and P.S.; formal analysis: M.P.M. and Y.Z.; resources: A.D.S. and M.C.J.; writing (original draft): M.P.M.; writing (review and editing): M.P.M., Y.Z., A.D.S., M.C.J., and M.P.S.; visualization: M.P.M., P.S., Y.Z., and M.P.S.; supervision: M.P.S.; funding acquisition: M.P.S. and M.C.J. Competing interests: M.P.S. and M.P.M. have filed a patent with the USPTO that is related to this work (Application no. 049640, filed on 5 September 2019). M.P.S. is founder and officer of a company, Chromanostics, previously formed for commercialization of micronutrient diagnostics. The authors declare no other competing interests. Data and materials availability: All data needed to evaluate the conclusions in the paper are present in the paper and/or the Supplementary Materials. Additional data related to this paper may be requested from the authors.
SUPPLEMENTARY MATERIALS
Supplementary material for this article is available at http://advances.sciencemag.org/cgi/content/full/5/9/eaax4473/DC1
Supplementary Text
Definition of QEM
Computational model of parallel calibration approach
Computational model of trigger response and standardization approach
Table S1. Species and their initial conditions in the model of zinc response in cell-free reactions.
Table S2. Zinc model parameters and estimated values.
Table S3. Equations used to model the zinc response in cell-free reactions.
Table S4. Species and their initial conditions in the model of toehold switch circuit in cell-free reactions.
Table S5. Toehold switch model parameters and estimated values.
Table S6. Equations used to model the toehold switch in cell-free reactions.
Table S7. Approximate cost analysis for zinc diagnostic tools.
Table S8. Description of plasmids constructed and used in this study.
Table S9. Sequences of primers used in this study.
Table S10. Sequences of promoters used in this study.
Table S11. Sequences of genes used in this study.
Table S12. Sequences of plasmids used in this study.
Fig. S1. Fluorescent response to zinc addition in CFE systems.
Fig. S2. Validation of knockout strains.
Fig. S3. Qualitative colorimetric response to added zinc.
Fig. S4. Zinc response in lyophilized reactions.
Fig. S5. Effect of reporter plasmid concentration on the ability to distinguish between different zinc concentrations.
Fig. S6. Quantitative colorimetric response to reactions run in serum.
Fig. S7. Response to zinc saturates in 25% serum.
Fig. S8. Zinc concentrations in individual donor serum.
Fig. S9. Relationship between regulator in standard reactions and zinc in test reactions.
Fig. S10. Validation of zinc quantification without added serum.
Fig. S11. Validation of direct protein addition to modulate zinc response.
Fig. S12. Validation of zinc quantification with direct protein addition.
Fig. S13. Comparison of parameterized model and experimental data in zinc-response circuit.
Fig. S14. Simulated zinc and regulator mapping.
Fig. S15. Perturbation of parameter values to identify the most sensitive parameters in the zinc model.
Fig. S16. Color change caused by serum corresponds with a shift in the visible spectrum of CPR.
Fig. S17. Human serum albumin replicates the spectrum shift caused by serum.
Fig. S18. Naproxen concentration necessary to restore colored intermediates.
Fig. S19. Response to trigger RNA addition saturates.
Fig. S20. Selected time course readings of test and standard reactions for a toehold sensor.
Fig. S21. Relationship between trigger concentration in the test reaction and the switch concentration in the calibration reaction.
Fig. S22. Comparison of parameterized model to experimental data in toehold switch circuit.
Fig. S23. Simulated trigger RNA and switch plasmid mapping.
Fig. S24. Perturbation of parameter values to identify the most sensitive parameters in toehold switch model.
Fig. S25. Overview schematic of test manufacture and use.
REFERENCES AND NOTES
- 1.Waltz E., After Theranos. Nat. Biotechnol. 35, 11–15 (2017). [DOI] [PubMed] [Google Scholar]
- 2.Carlson E. D., Gan R., Hodgman C. E., Jewett M. C., Cell-free protein synthesis: Applications come of age. Biotechnol. Adv. 30, 1185–1194 (2012). [DOI] [PMC free article] [PubMed] [Google Scholar]
- 3.Pardee K., Green A. A., Ferrante T., Cameron D. E., Keyser A. D., Yin P., Collins J. J., Paper-based synthetic gene networks. Cell 159, 940–954 (2014). [DOI] [PMC free article] [PubMed] [Google Scholar]
- 4.Pardee K., Green A. A., Takahashi M. K., Braff D., Lambert G., Lee J. W., Ferrante T., Ma D., Donghia N., Fan M., Daringer N. M., Bosch I., Dudley D. M., O’Connor D. H., Gehrke L., Collins J. J., Rapid, low-cost detection of zika virus using programmable biomolecular components. Cell 165, 1255–1266 (2016). [DOI] [PubMed] [Google Scholar]
- 5.Gootenberg J. S., Abudayyeh O. O., Lee J. W., Essletzbichler P., Dy A. J., Joung J., Verdine V., Donghia N., Daringer N. M., Freije C. A., Myhrvold C., Bhattacharyya R. P., Livny J., Regev A., Koonin E. V., Hung D. T., Sabeti P. C., Collins J. J., Zhang F., Nucleic acid detection with CRISPR-Cas13a/C2c2. Science 356, 438–442 (2017). [DOI] [PMC free article] [PubMed] [Google Scholar]
- 6.Gootenberg J. S., Abudayyeh O. O., Kellner M. J., Joung J., Collins J. J., Zhang F., Multiplexed and portable nucleic acid detection platform with Cas13, Cas12a, and Csm6. Science 360, 439–444 (2018). [DOI] [PMC free article] [PubMed] [Google Scholar]
- 7.Takahashi M. K., Tan X., Dy A. J., Braff D., Akana R. T., Furuta Y., Donghia N., Ananthakrishnan A., Collins J. J., A low-cost paper-based synthetic biology platform for analyzing gut microbiota and host biomarkers. Nat. Commun. 9, 3347 (2018). [DOI] [PMC free article] [PubMed] [Google Scholar]
- 8.Vasan R. S., Biomarkers of cardiovascular disease: Molecular basis and practical considerations. Circulation 113, 2335–2362 (2006). [DOI] [PubMed] [Google Scholar]
- 9.Goossens N., Nakagawa S., Sun X., Hoshida Y., Cancer biomarker discovery and validation. Transl. Cancer Res. 4, 256–269 (2015). [DOI] [PMC free article] [PubMed] [Google Scholar]
- 10.Combs G. F. Jr., Trumbo P. R., Mc Kinley M. C., Milner J., Studenski S., Kimura T., Watkins S. M., Raiten D. J., Biomarkers in nutrition: New frontiers in research and application. Ann. N. Y. Acad. Sci. 1278, 1–10 (2013). [DOI] [PMC free article] [PubMed] [Google Scholar]
- 11.Taylor P. J., Matrix effects: The Achilles heel of quantitative high-performance liquid chromatography-electrospray-tandem mass spectrometry. Clin. Biochem. 38, 328–334 (2005). [DOI] [PubMed] [Google Scholar]
- 12.Trufelli H., Palma P., Famiglini G., Cappiello A., An overview of matrix effects in liquid chromatography-mass spectrometry. Mass Spectrom. Rev. 30, 491–509 (2011). [DOI] [PubMed] [Google Scholar]
- 13.Shiel A. E., Barling J., Orians K. J., Weis D., Matrix effects on the multi-collector inductively coupled plasma mass spectrometric analysis of high-precision cadmium and zinc isotope ratios. Anal. Chim. Acta 633, 29–37 (2009). [DOI] [PubMed] [Google Scholar]
- 14.King J. C., Brown K. H., Gibson R. S., Krebs N. F., Lowe N. M., Siekmann J. H., Raiten D. J., Biomarkers of nutrition for development (BOND)-zinc review. J. Nutr. 146, 858S–885S (2016). [DOI] [PMC free article] [PubMed] [Google Scholar]
- 15.Bhutta Z. A., Das J. K., Rizvi A., Gaffey M. F., Walker N., Horton P. S., Webb P. P., Lartey P. A., Black R. E., Evidence-based interventions for improvement of maternal and child nutrition: What can be done and at what cost? Lancet 382, 452–477 (2013). [DOI] [PubMed] [Google Scholar]
- 16.Watstein D. M., McNerney M. P., Styczynski M. P., Precise metabolic engineering of carotenoid biosynthesis in Escherichia coli towards a low-cost biosensor. Metab. Eng. 31, 171–180 (2015). [DOI] [PMC free article] [PubMed] [Google Scholar]
- 17.Watstein D. M., Styczynski M. P., Development of a pigment-based whole-cell zinc biosensor for human serum. ACS Synth. Biol. 7, 267–275 (2018). [DOI] [PMC free article] [PubMed] [Google Scholar]
- 18.McNerney M. P., Styczynski M. P., Precise control of lycopene production to enable a fast-responding, minimal-equipment biosensor. Metab. Eng. 43, 46–53 (2017). [DOI] [PMC free article] [PubMed] [Google Scholar]
- 19.Yao K. Z., Shaw B. M., Kou B., McAuley K. B., Bacon D. W., Modeling ethylene/butene copolymerization with multi-site catalysts: Parameter estimability and experimental design. Polym. React. Eng. 11, 563–588 (2003). [Google Scholar]
- 20.Hu C. Y., Takahashi M. K., Zhang Y., Lucks J. B., Engineering a functional small RNA negative autoregulation network with model-guided design. ACS Synth. Biol. 7, 1507–1518 (2018). [DOI] [PubMed] [Google Scholar]
- 21.Hu C. Y., Varner J. D., Lucks J. B., Generating effective models and parameters for RNA genetic circuits. ACS Synth. Biol. 4, 914–926 (2015). [DOI] [PubMed] [Google Scholar]
- 22.Wang D., Hosteen O., Fierke C. A., ZntR-mediated transcription of zntA responds to nanomolar intracellular free zinc. J. Inorg. Biochem. 111, 173–181 (2012). [DOI] [PMC free article] [PubMed] [Google Scholar]
- 23.Yildirim N., Mackey M. C., Feedback regulation in the lactose operon: A mathematical modeling study and comparison with experimental data. Biophys. J. 84, 2841–2851 (2003). [DOI] [PMC free article] [PubMed] [Google Scholar]
- 24.Rodkey F. L., Direct spectrophotometric determination of albumin in human serum. Clin. Chem. 11, 478–487 (1965). [PubMed] [Google Scholar]
- 25.Sochacka J., Application of phenol red as a marker ligand for bilirubin binding site at subdomain IIA on human serum albumin. J. Photochem. Photobiol. B Biol. 151, 89–99 (2015). [DOI] [PubMed] [Google Scholar]
- 26.T. Peters, All About Albumin, T. Peters, Ed. (Academic Press, 1995), pp. 76–132.
- 27.Garrett D. A., Sangha J. K., Kothari M. T., Boyle D., Field-friendly techniques for assessment of biomarkers of nutrition for development. Am. J. Clin. Nutr. 94, 685S–690S (2011). [DOI] [PMC free article] [PubMed] [Google Scholar]
- 28.Bhamla M. S., Benson B., Chai C., Katsikis G., Johri A., Prakash M., Hand-powered ultralow-cost paper centrifuge. Nat. Biomed. Eng. 1, 0009 (2017). [Google Scholar]
- 29.Barceloux D. G., Zinc. J. Toxicol. Clin. Toxicol. 37, 279–292 (1999). [DOI] [PubMed] [Google Scholar]
- 30.Voyvodic P. L., Pandi A., Koch M., Conejero I., Valjent E., Courtet P., Renard E., Faulon J.-L., Bonnet J., Plug-and-play metabolic transducers expand the chemical detection space of cell-free biosensors. Nat. Commun. 10, 1697 (2019). [DOI] [PMC free article] [PubMed] [Google Scholar]
- 31.Alam K. K., Jung J. K., Verosloff M. S., Clauer P. R., Lee J. W., Capdevila D. A., Pastén P. A., Giedroc D. P., Collins J. J., Lucks J. B., Rapid, low-cost detection of water contaminants using regulated in vitro transcription. bioRxiv 619296 [Preprint] (2 May 2019). [Google Scholar]
- 32.Ku T.-H., Zhang T., Luo H., Yen T. M., Chen P.-W., Han Y., Lo Y.-H., Nucleic acid aptamers: An emerging tool for biotechnology and biomedical sensing. Sensors 15, 16281–16313 (2015). [DOI] [PMC free article] [PubMed] [Google Scholar]
- 33.Boder E. T., Midelfort K. S., Wittrup K. D., Directed evolution of antibody fragments with monovalent femtomolar antigen-binding affinity. Proc. Natl. Acad. Sci. U.S.A. 97, 10701–10705 (2000). [DOI] [PMC free article] [PubMed] [Google Scholar]
- 34.Datsenko K. A., Wanner B. L., One-step inactivation of chromosomal genes in Escherichia coli K-12 using PCR products. Proc. Natl. Acad. Sci. U.S.A. 97, 6640–6645 (2000). [DOI] [PMC free article] [PubMed] [Google Scholar]
- 35.Didovyk A., Tonooka T., Tsimring L., Hasty J., Rapid and scalable preparation of bacterial lysates for cell-free gene expression. ACS Synth. Biol. 6, 2198–2208 (2017). [DOI] [PMC free article] [PubMed] [Google Scholar]
- 36.Kwon Y.-C., Jewett M. C., High-throughput preparation methods of crude extract for robust cell-free protein synthesis. Sci. Rep. 5, 8663 (2015). [DOI] [PMC free article] [PubMed] [Google Scholar]
- 37.Silverman A. D., Kelley-Loughnane N., Lucks J. B., Jewett M. C., Deconstructing cell-free extract preparation for in vitro activation of transcriptional genetic circuitry. ACS Synth. Biol. 8, 403–414 (2019). [DOI] [PMC free article] [PubMed] [Google Scholar]
- 38.Sun Z. Z., Hayes C. A., Shin J., Caschera F., Murray R. M., Noireaux V., Protocols for implementing an Escherichia coli based TX-TL cell-free epxression system for synthetic biology. J. Vis. Exp. 2013, e50762 (2013). [DOI] [PMC free article] [PubMed] [Google Scholar]
- 39.Jewett M. C., Swartz J. R., Mimicking the Escherichia coli cytoplasmic environment activates long-lived and efficient cell-free protein synthesis. Biotechnol. Bioeng. 86, 19–26 (2004). [DOI] [PubMed] [Google Scholar]
Associated Data
This section collects any data citations, data availability statements, or supplementary materials included in this article.
Supplementary Materials
Supplementary material for this article is available at http://advances.sciencemag.org/cgi/content/full/5/9/eaax4473/DC1
Supplementary Text
Definition of QEM
Computational model of parallel calibration approach
Computational model of trigger response and standardization approach
Table S1. Species and their initial conditions in the model of zinc response in cell-free reactions.
Table S2. Zinc model parameters and estimated values.
Table S3. Equations used to model the zinc response in cell-free reactions.
Table S4. Species and their initial conditions in the model of toehold switch circuit in cell-free reactions.
Table S5. Toehold switch model parameters and estimated values.
Table S6. Equations used to model the toehold switch in cell-free reactions.
Table S7. Approximate cost analysis for zinc diagnostic tools.
Table S8. Description of plasmids constructed and used in this study.
Table S9. Sequences of primers used in this study.
Table S10. Sequences of promoters used in this study.
Table S11. Sequences of genes used in this study.
Table S12. Sequences of plasmids used in this study.
Fig. S1. Fluorescent response to zinc addition in CFE systems.
Fig. S2. Validation of knockout strains.
Fig. S3. Qualitative colorimetric response to added zinc.
Fig. S4. Zinc response in lyophilized reactions.
Fig. S5. Effect of reporter plasmid concentration on the ability to distinguish between different zinc concentrations.
Fig. S6. Quantitative colorimetric response to reactions run in serum.
Fig. S7. Response to zinc saturates in 25% serum.
Fig. S8. Zinc concentrations in individual donor serum.
Fig. S9. Relationship between regulator in standard reactions and zinc in test reactions.
Fig. S10. Validation of zinc quantification without added serum.
Fig. S11. Validation of direct protein addition to modulate zinc response.
Fig. S12. Validation of zinc quantification with direct protein addition.
Fig. S13. Comparison of parameterized model and experimental data in zinc-response circuit.
Fig. S14. Simulated zinc and regulator mapping.
Fig. S15. Perturbation of parameter values to identify the most sensitive parameters in the zinc model.
Fig. S16. Color change caused by serum corresponds with a shift in the visible spectrum of CPR.
Fig. S17. Human serum albumin replicates the spectrum shift caused by serum.
Fig. S18. Naproxen concentration necessary to restore colored intermediates.
Fig. S19. Response to trigger RNA addition saturates.
Fig. S20. Selected time course readings of test and standard reactions for a toehold sensor.
Fig. S21. Relationship between trigger concentration in the test reaction and the switch concentration in the calibration reaction.
Fig. S22. Comparison of parameterized model to experimental data in toehold switch circuit.
Fig. S23. Simulated trigger RNA and switch plasmid mapping.
Fig. S24. Perturbation of parameter values to identify the most sensitive parameters in toehold switch model.
Fig. S25. Overview schematic of test manufacture and use.