

Abstract
Zinc colocalizes with glutamate in the synaptic vesicles of certain glutamatergic vesicles in the mammalian brain. Here, I introduce a method for detecting Zn in the extracellular space of brain slices and another method for detecting the passage of Zn out of the slice. In both cases, the fluorimetric Zn probe FluoZin-3 is used in conjunction with a slow Zn chelator, Ca-EDTA, to reduce background fluorescence. In addition, a new Zn chelator, ethylenediiminodi-2-pentanedioic acid, with little affinity for Ca or Mg is introduced. These tools are then used to show that little Zn (∼2 nm) is released during the course of synaptic transmission into the extracellular space. However, when hippocampal slices are subjected to a high potassium stimulus (50 mM) combined with an increase in osmolarity, Zn is externalized in the Timm's-stained areas (∼6 nm). This stimulus also leads to even greater Zn elevations in area CA1 that is only weakly stained by the Timm's method. Nevertheless, even under these conditions, little if any Zn makes its way out of the slices. I present evidence for a layer of Zn in the extracellular space that maps onto the Timm's stained region of the hippocampus. This Zn veneer appears to be loosely associated with molecules in the extracellular space and may be the raison d'être for vesicular Zn.
Keywords: zinc, fluorimetric, hippocampus, chelator, glutamate, fluorescence
Introduction
It has been known for almost 50 years that Zn is found at a high concentration in the synaptic vesicles of certain neurons in the mammalian forebrain (Maske, 1955). The discovery of the coexistence of glutamate and Zn in the same vesicles naturally led to the hypothesis that Zn might be released and act as a neuromodulator (Frederickson, 1989). The first evidence in support of Zn release was published in 1984 in two back-to-back publications (Assaf and Chung, 1984; Howell et al., 1984); however, there has been little additional evidence to bolster the claims of Zn release and even less for any postsynaptic action in situ. In this study, I reexamine the question of Zn release using a recently developed fluorimetric Zn probe, FluoZin-3, with a Kd of 15 nm.
Most of the intracellular ionic Zn is found in tight association with proteins and peptides. A smaller fraction of Zn (∼10%) appears not to be tightly associated with macromolecules but is confined to synaptic vesicles. The existence of vesicular Zn in the hippocampus manifests in the striking scimitar-shaped form that results after staining transverse slices with the Timm's method, with the handle being the hilus and the blade being the mossy fibers. There is much evidence to suggest that Timm's method highlights vesicular Zn, and it is found chiefly in glutamatergic vesicles, although there is a growing body of data for its occurrence in a smaller population of inhibitory neurons (Wang et al., 2001). In a nice convergence of classical histochemistry and contemporary molecular biology, Palmiter et al. (1996) were able to demonstrate that a single protein, Zn transporter-3 (ZnT3), is responsible for stocking vesicles in the brain with Zn. Deletion of ZnT3 leads to mice with no histochemically detectable Zn in the brain (Wenzel et al., 1997). However, other than a slightly enhanced susceptibility to chemically induced seizures, these animals do not show an alteration of their phenotype (Cole et al., 2000). Defining the precise role of vesicular Zn still stands as a singular challenge to neuroscientist.
Because Zn is found in synaptic vesicles, it certainly seems plausible that Zn might be released together with the neurotransmitter. Two studies provided some evidence for this conjecture by detecting Zn in saline superfused over hippocampal slices, in one case by atomic absorption spectroscopy (Assaf and Chung, 1984) and in the other case by prelabeling the slices with radioactive Zn (Howell et al., 1984). After stimulation of the slices electrically or with a high potassium concentration, the Zn in the extracellular medium was found to increase. The stimulus-dependent increase in Zn was blocked by maneuvers that inhibited synaptic transmission. Similar experiments were repeated in intact animals using push-pull cannulas and confirmed the broad outlines of the in vivo findings (Anikstejn et al., 1987)
Fluorimetric Zn probes offer the rather powerful prospect of visualizing Zn release directly. If one has in hand a Zn probe with a high affinity and quantum yield, and if the probe is not membrane permeant, then with the probe in the extracellular space, synaptic stimulation should lead to increases in fluorescence when Zn is released. That such experiments are indeed feasible was shown recently by the successful detection of Zn release from single pancreatic β-cells (Gee et al., 2002).
Materials and Methods
Preparation of hippocampal slices. Hippocampal slices were cut from the brains of Wistar rats (16-30 d) or C57BL6 wild-type and ZnT3-null mice (8 weeks) on a McIlwain tissue chopper (400 μm). The slices were transferred to a physiological saline with the following composition (in mm): 125 NaCl, 2.5 KCl, 2 CaCl2, 1.3 MgSO4, 25 NaHCO3, 1.25 NaH2PO4, and 25 glucose, bubbled with 95% O2-5% CO2, in an interface holding chamber at room temperature. To reduce Zn contamination, no glass or metal was brought into contact with the solutions that were held in Teflon bottles. Metal-free pipettor tips (Fisher Scientific, Houston, TX) were used for all of the dilutions.
Slices were transferred to a temperature-controlled chamber (RC-27L; Warner Instruments, Hamden, CT) on the microscope and perfused continuously with saline at 32°C. Images were acquired on an Olympus Optical (Tokyo, Japan) BX50WI upright microscope. Illumination was provided by a monochromator set at 480 nm (T.I.L.L. Photonics, Martinsreid, Germany), passed through a dichroic (Q495lp; Chroma Technology, Brattleboro, VT) and then through a filter (HQ530/60; Chroma Technology) onto the faceplate of a Princeton Instruments (Monmouth Junction, NJ) cooled CCD camera. Data were acquired by the MetaFluor program (Universal Imaging Corporation, West Chester, PA), and the images were analyzed using the ImageJ (NIH) program. Fluorescent imaging experiments were performed in 1.5 ml of saline that was added to the chamber and stirred continuously with a jet of 95% O2-5% CO2. Changes in fluorescence are presented as the percentage change in fluorescence relative to fluorescence before the stimulus (% ΔF/F). Results are reported as mean ± SD unless otherwise noted.
The approximate concentration of Zn was estimated using the following equation (Tsien and Pozzan, 1989):
 |
1 |
where f is the measured fluorescence, fmin and fmax are the fluorescence with no Zn and saturating Zn, respectively, and Kd is the dissociation constant (15 nm). fmin was estimated by the application of ethylenediiminodi-2-pentanedioic acid (EDDG) to the slice, and fmax was estimated by the application of 10 μm ZnSO4. The estimates represent effectively the average concentration of Zn in the extracellular space; locally, the concentration could be more elevated.
Slices were stimulated with bipolar tungsten electrodes (5 MΩ; 200-500 μA; A-M Systems, Everett, WA) coupled through a stimulus isolation unit (A.M.P.I., Jerusalem, Israel) to a DigiData 1200 interface (Axon Instruments, Foster City, CA). Field potentials were recorded using a patch electrode (1-3 MΩ) filled with physiological saline coupled to an Axopatch 200 (Axon Instruments) amplifier operating in the current-clamp mode, 300-600 μm from the recording electrode. The stimulus intensity was adjusted to give a half-maximal field EPSP, and imaging experiments were performed only on slices with potentials of >0.3 mV. Potentials were digitized by a DigiData 1200 coupled to a personal computer (Dell) using Pclamp 7.0 (Axon Instruments).
Fluorimetry. Excitation-emission spectra and fluorescent time courses were determined on a Hitachi (Tokyo, Japan) F-4500 spectrofluorometer, using a methacrylate cuvette whose temperature was controlled by a circulating-water bath. Unless otherwise specified, spectra were measured in HEPES-buffered saline containing (in mm): 140 NaCl, 2.5 KCl, and 10 HEPES, pH 7.4.
For slices-in-a-basket, a 1.5 ml Eppendorf tube was cut 2.5 cm from the top. Stocking was stretched over the cut end and glued with super-glue. After placing a stir bar in a methacrylate cuvette, the cut Eppendorf tube was inserted into the cuvette and pushed down so the top was flush with that of the cuvette (see Fig. 6, inset). O2 (95%)-5% CO2 was bubbled into the solution through a MicroFil syringe (World Precision Instruments, Sarasota, FL).
Figure 6.
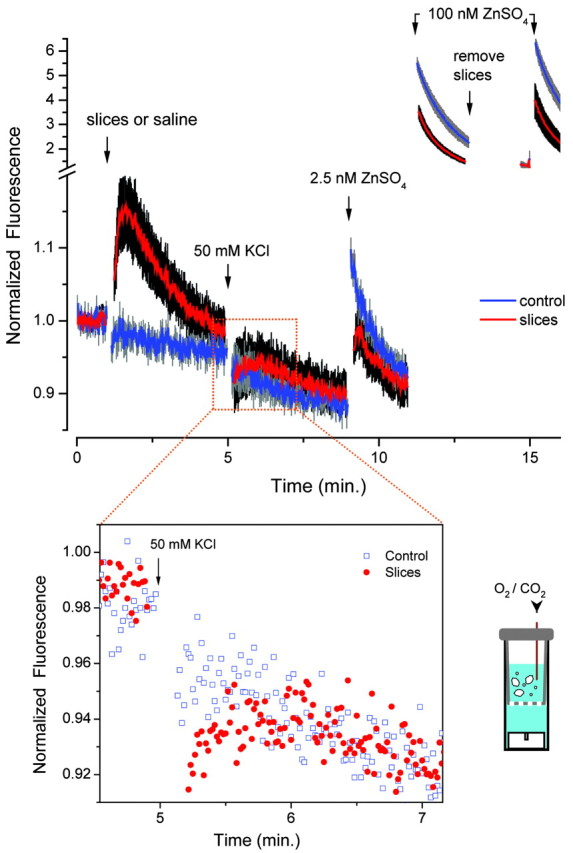
Slices in a basket. a, Normalized fluorescence measured in a fluorimeter with seven hippocampal slices suspended over the light beam (bottom-right inset) (mean ± SEM; control, n = 4; slices, n = 8). The solution contained 2 μm FluoZin-3 and 50 μm Ca-EDTA at 32°C. Bottom-left inset is a blowup of the rectangular selection without the SEMs. In the inset, the control data have been adjusted to coincide with the first 10 sec before the addition of the KCl, to correct for the difference in the initial fluorescent intensity before stimulation. Concentrations denoted on the graph are final concentrations.
Calculation of the rate of Zn chelation by EDTA. The following time constants were used to calculate the rate of chelation of Zn by EDTA in the presence of Ca and Mg: forward rate constants (m-1 · sec-1), 2.2 × 10⁷ (Ca), 8.75 × 10⁵ (Mg), and 1 × 10⁸ (Zn); and backward rate constants (sec-1), 0.7 × 10⁻⁶ (Ca), 2.8 × 10⁻⁶ (Mg), and 7 × 10⁻⁶ (Zn) (Davis et al., 1999; Li et al., 2001a). The system of equations was solved using the XPP program and the stiff differential-equation solver within that package (Ermentrout, 2002).
Reagents. FluoZin-3 (Molecular Probes, Eugene, OR), EDDG (Aldrich, Milwaukee, WI), HEPES (Calbiochem, La Jolla, CA), MgSO4, NaCl, KCl, NaHCO3, NaH2PO4, glucose (Sigma, St. Louis, MO), EDTA, N, N,N′,N′-tetrakis(2-pyridylmethyl)ethylenediamine (TPEN), and CaCl2 (Fluka, Buchs, Switzerland). All of the Zn solutions were prepared from a standard solution of ZnSO4 purchased as a 0.0501 m standardized solution (Aldrich).
Results
Metal-binding characteristics of FluoZin-3
In this study, I have used a newly synthesized fluorescent probe FluoZin-3 to attempt to detect the release of Zn from hippocampal slices. FluoZin-3 is a member of a family of probes recently synthesized by Molecular Probes, based on the chelator BAPTA, stripped of one of its four carboxyl groups to reduce its affinity for Ca and Mg. FluoZin-3 has a Kd of 15 nm for Zn at pH 7.4 and was recently used to detect Zn, coreleased with insulin from pancreatic β-cells (Gee et al., 2002).
Zn chelators
If Zn is released during synaptic transmission and then passes on to exert a postsynaptic action, it is important to have a chelator that can interrupt its passage, antagonizing its potential physiological action. In addition, such a chelator would be of great value in fluorimetric experiments intercepting Zn before it could interact with the fluorescent probe. The question of speed is one of great importance here; if the chelator is too slow, it will prove ineffective in capturing the Zn in transit.
EDTA has an affinity for Zn that is more than 105 times greater than that for Ca and Mg, and can be used in the presence of a vast excess of Ca to buffer Zn to very low levels in the steady state (Smith and Martell, 1998). However, the kinetics of this process may be sluggish, because it is determined by the slow off-rate constant of Ca.
To measure the rate of chelation of Zn, a simple fluorimetric assay was devised using FluoZin-3 as a fluorimetric sensor. Addition of Zn to a stirred cuvette with FluoZin-3 led to a rapid increase in the fluorescence. If this was then followed by the addition of EDTA in the absence of Ca or Mg, the fluorescence was rapidly extinguished (∼500 msec). However, if Ca-EDTA was in the presence of excess Ca, then the rate of chelation was slowed. As shown in Figure 1a, Zn is added to a solution containing the probe, 50 μm Ca-EDTA, and 2 mm Ca and Mg. The fluorescence increases transiently and then declined with an exponential time course. The biphasic time course results from the fact that Zn binds rapidly to the probe, and then Ca-EDTA chelates the Zn more slowly, retarded by the presence of Ca on EDTA
Figure 1.
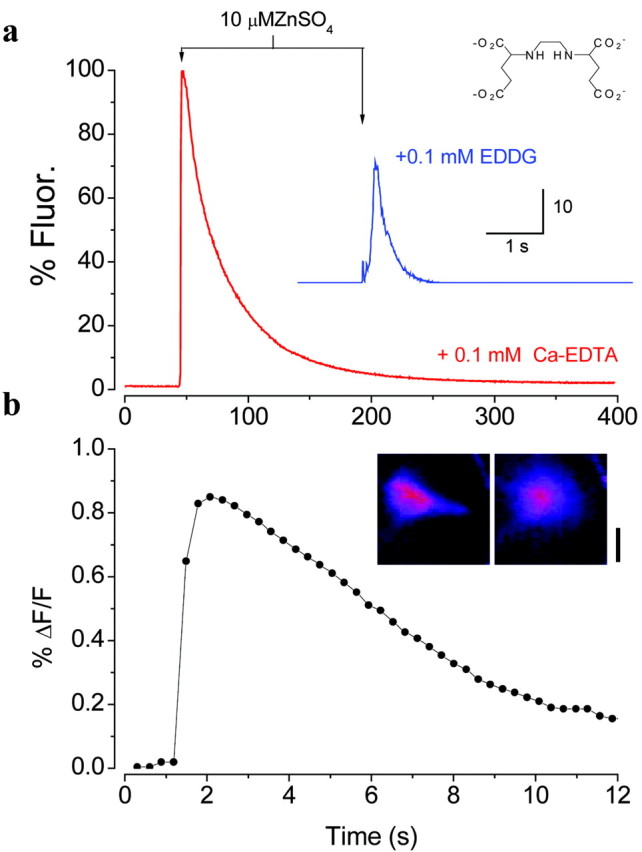
Chelation of Zn from FluoZin-3 and the sensitivity of the FluoZin-3 to Zn. a, Response of FluoZin-3 (500 nm) to the addition of ZnSO4 in the presence of Ca-EDTA or EDDG (inset). The fluorescence (Fluor.) is expressed relative to the fluorescence attained on the addition of ZnSO4 to a solution without the chelator. The fluorescence declined with a time constant of 32 sec on the addition of Zn in the presence of Ca-EDTA. The experiments were performed in the HEPES-buffered saline with 2 mm CaCl2 and 2 mm MgSO4 at 26°C. b, Response of FluoZin-3 to the pressure ejection of 1 μm ZnSO4 from an electrode. The experiment was performed in physiological saline at 32°C. Inset, Images of the experiments at 2 and 6 sec. Scale bar, 100 μm.
The above method will tend to underestimate the efficiency of Ca-EDTA as a chelator of free Zn. To estimate the rate at which Ca-EDTA will chelate free Zn ions, I have used empirical rate constants for the interaction of Ca, Mg, and Zn with EDTA (see Materials and Methods). For the addition of 10 μm Zn to a solution containing (in mM): 3 Ca, 1.3 Mg, and 2 EDTA at pH 7.4, the free Zn concentration declines with an exponential time course with a time constant of 646 msec. With the addition of the same amount of Zn to a solution containing (in mM): 12 Ca, 1.3 Mg, and 10 EDTA, the time constant changes to 66 msec.
Paradoxically, the slowness with which Ca-EDTA chelates Zn from FluoZin-3 can be put to good advantage in measuring Zn in the extracellular space. Because of the slow response of Ca-EDTA, a transient elevation of Zn will lead to saturation of FluoZin-3 followed by a slow decline. Measurements can thus be made in the presence of Ca-EDTA to reduce the contaminating Zn in the solution, improving the dynamic range of the fluorimetric response. With 500 nm FluoZin-3 and 50 μm Ca-EDTA, it was possible to detect the addition of 100 pm of Zn to a cuvette (data not shown).
The tardiness of Ca-EDTA led to a search for compounds that might bind Zn rapidly without suffering interference from Ca and Mg. A number of commercially available compounds were screened using the protocol shown in Figure 1a. A single compound, EDDG (Fig. 1a), proved most effective. Figure 1a shows that EDDG chelated Zn far more rapidly than Ca-EDTA and was not influenced by the presence of Ca or Mg. Addition of 100 μm EDDG to a solution containing 1 μm ZnSO4 and 1 μm FluoZin-3 reduced the fluorescence as rapidly in the presence of divalents (2 mm MgSO4 and 2 mm CaCl2, t1/2 = 512 ± 63 msec, mean ± SEM; n = 3; temperature, 15°C; apparatus dead time, 330 msec) as it did in their absence (t1/2 = 518 ± 60 msec; n = 3). In addition, EDDG was not membrane permeant, as judged by a liposomal assay (Snitsarev et al., 2001) (data not shown).
Sensitivity of Zn probes
To determine the sensitivity of the FluoZin-3 in imaging Zn concentrations in small compartments, Zn was ejected from a glass microelectrode (tip diameter, ∼1 μm) by pressure pulses into a solution containing the Zn probe. The electrode tip was imaged with a water immersion objective, and the bath was left unstirred, because it leads to the very rapid dissipation of the signal.
With 2 μm FluoZin-3 in solution, ejection of 1 μm ZnSO4 could not be detected; indeed, there was a slight decrease in the signal corresponding to the probe being blown away by the emerging solution. Addition of 50 μm Ca-EDTA led to a reduction of the background signal, and now ejections of 1 μm ZnSO4 could be unambiguously detected (Fig. 1b).
Autofluorescence
In the experiments that follow, I have used the membrane-impermeant fluorescent probe FluoZin-3 to attempt to detect the release of Zn into the extracellular space. In these experiments, the release of Zn should be accompanied by an increase in fluorescence; however, it should be recognized at the outset that transient changes invoked by stimulation may arise from cellular changes entirely unrelated to Zn. Transient changes in fluorescence induced by synaptic activation may arise in three ways. First, all cells exhibit some autofluorescence that arises primarily from reduced nicotinamide adenine dinucleotide (NADH) and flavins (Billington and Knight, 2001). Changes in cellular activity influence the level of these metabolites and consequently the autofluorescence (Sick and Rosenthal, 1989). Second, neuronal activity leads to changes in the light scattering of tissue through alterations in the volume of the cellular elements (Rector et al., 1997). This could alter the fluorescence of an exogenous probe because of changes in the efficiency of penetration of the incident and emitted light. Third, if a fluorescent molecule moves from one chemical environment into another, its fluorescence may be altered (Lakowicz, 1999). One could envision that, during synaptic stimulation, changes in protein conformations or of the lipid environment may alter the partitioning of a probe and hence its fluorescence.
If a transient change in fluorescence induced by electrical stimulation in the presence of FluoZin-3 is eliminated by an extracellular Zn chelator like EDDG, the transient likely as not arises from the release of Zn to the extracellular space and not through any of the mechanisms described above. Alternatively, if Zn is trapped in an intracellular compartment, it can be revealed by a cell-permeant Zn probe (e.g., Zinquin) and its location confirmed if the fluorescence can be quenched by an intracellular Zn chelator like TPEN (Arslan et al., 1985) or diethyldithiocarbamate (Danscher et al., 1975), but not by an extracellular chelator.
Monitoring the fluorescence in the absence of the probe while stimulating the slice led to changes in fluorescence that result from changes in the levels of NADH or flavins. In the course of measuring such changes in the autofluorescence, I noted that the concentration of glucose had a strong influence on the amplitude of the autofluorescence response to electrical and potassium stimulation. In hippocampal slices at 32°C, the peak increase in fluorescence (% ΔF/F) induced by the application of 12.3 mm KCl was 0.27 ± 0.09% (n = 3) and 0.05 ± 0.02% (n = 4) (average ± SEM) for 10 and 25 mm glucose, respectively. In all of the subsequent experiments, 25 mm glucose was used. It should be noted that, although this is ∼2.5 times greater than that typically used, this concentration of glucose is fairly widely used to maintain acutely prepared brain slices in vitro.
Is Zn released during synaptic transmission?
FluoZin-3 has the requisite characteristics needed to detect the release of Zn from synaptic vesicles (i.e., an appropriate sensitivity, specificity, and the absence of membrane permeability). If it is added to the extracellular medium and given enough time to diffuse into the interstices of the tissue, the release of Zn should be signaled by an increase in fluorescence.
Incubation of hippocampal slices in 2 μm FluoZin-3 for up to 3 hr did not lead to any marked staining of cellular elements, only a pale uniform cast to the hilus and mossy fibers (see below). These experiments suggest that FluoZin-3, unlike Zinquin (Snitsarev et al., 2001), is not membrane permeant.
Experiments were performed on hippocampal slices using the known topography of the vesicular Zn to attempt to visualize the release of Zn during electrical stimulation or excitation with high concentrations of potassium. A hippocampal slice was incubated in physiological saline containing 2 μm FluoZin-3, allowing at least 5 min for the probe to diffuse into the tissue. In addition, the solution contained 50 μm Ca-EDTA, which serves to lower the background fluorescence but acts insufficiently rapidly to intercept Zn introduced into the medium (Fig. 1a). To conserve the fluorescent probe, 1.5 ml of solution was used to superfuse the slice, and to ensure oxygenation, the solution was stirred by means of a jet of 95% O2-5% CO2 directed over the solution.
If the fluorescence of a hippocampal slice was monitored 70-100 μm below the slice surface during the addition of 2 μm FluoZin-3, the fluorescence rose approximately exponentially to asymptote within 5 min (Fig. 2). Addition of 50 μm Ca-EDTA led to an exponential decline in the fluorescence to a persistent steady-state level. Both the addition of FluoZin-3 and that of Ca-EDTA suggest that there is some Zn in association with the extracellular space. This is confirmed by the addition of 100 μm EDDG, which reduced the fluorescence to a minimum. Using Equation 1, the free (see Discussion) Zn concentration in the slice in the presence of 50 μm Ca-EDTA was estimated to be 2.0 ± 0.3 nm (mean ± SD; n = 15).
Figure 2.
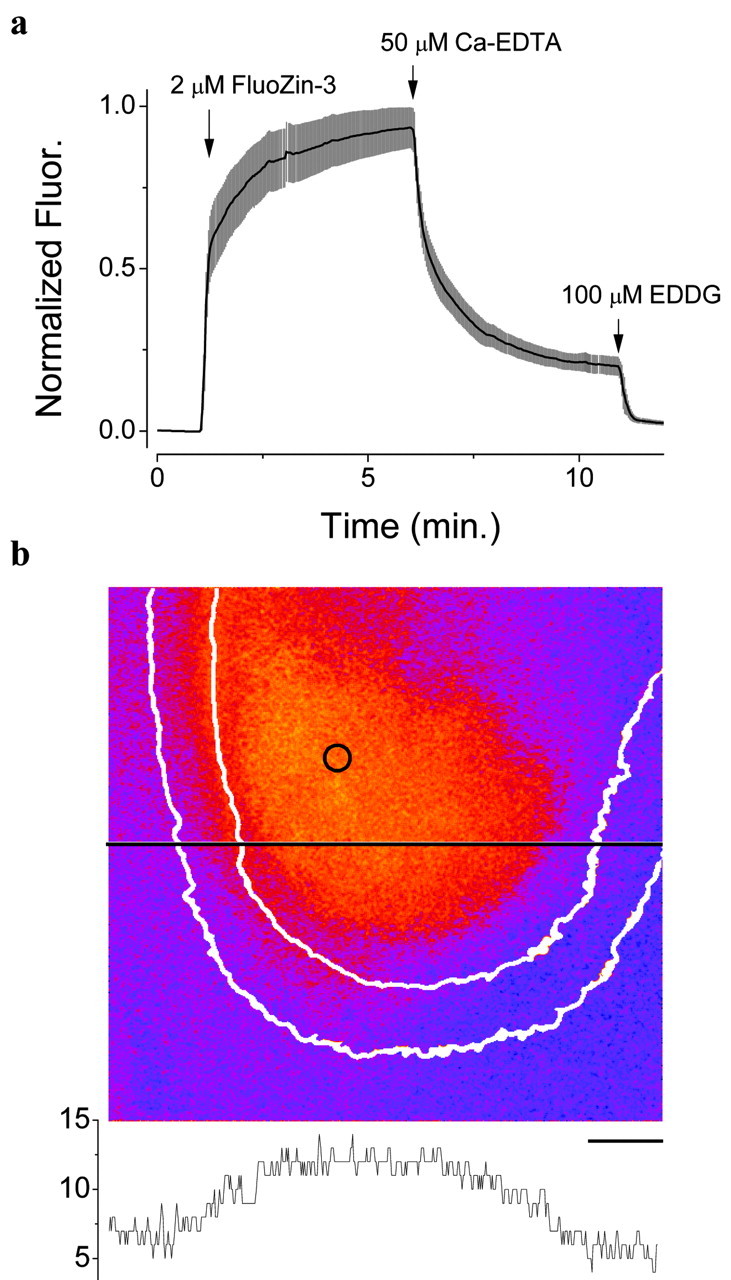
Evidence for extracellular chelatable Zn. a, Fluorescence (Fluor.) in the hilus of the dentate gyrus (circle in b) during the addition of 2 μm FluoZin-3, followed by the addition of 50 μm Ca-EDTA and then 100 μm EDDG (mean ± SEM; n = 4). b, Pseudocolor image of the difference between an image acquired in the presence of FluoZin-3 and 50 μm Ca-EDTA and that after the addition of 1 mm EDDG. The intensity of the fluorescence along the black line is graphed below and in register with the figure. The irregular white lines delimit the granule cell layer. Scale bar, 100 μm.
Application of EDDG reduced the fluorescence as expected; however, the reduction could result from the chelation of contaminating Zn in the extracellular solution, or there could be high levels of free Zn at certain locations in the slice. If the Zn is simply a contamination, the difference between the image before EDDG application and after its application should be uniform across the hippocampus. However, when these subtractions were performed, the difference images were clearly inhomogeneous, with higher fluorescence signals overlying the classically Timm's-stained regions of the hippocampus (Fig. 2b). Similar results were obtained in 11 other slices in which this experiment was performed (% ΔF/F = -6.5 ± 1.6; mean ± SEM; n = 12).
Electrical stimulation
Mossy fibers were stimulated with bipolar tungsten electrodes while recording field potentials in either the hilus or stratum lucidum of CA3. The fluorescence was monitored close to the recording electrode, while a 100 Hz tetanus of 10 sec duration with a pulse duration of 30 μsec was applied. Control images were taken in the absence of probe to measure the change in autofluorescence. The probe was then applied for 5 min, and the same stimulus was delivered. To determine whether elevations in fluorescence result from the release of Zn, 100 μm EDDG was applied, which should rapidly intercept released Zn and reduce the fluorescence (Fig. 1).
The following criteria were used to judge whether a fluorescent transient was indeed a Zn release event. First, the transient had to be larger by one SD than that induced by the stimulation of unstained slices. Second, the area of tissue exhibiting a transient increase in fluorescence had to map onto the Timm's-positive regions of the slice (vide infra). Third, the transient had to be suppressed by the addition of EDDG.
In the 20 experiments performed, 60.9% gave rise to fluorescent transients that were, according to the above criteria, consistent with Zn release. However, in all of the cases, the transients were small (Fig. 3a,d; Table 1) and seemed inconsistent with the 100-300 μm Zn elevations predicted by others (Frederickson, 1989). Could it be that the Zn increases are occurring too deep within the slice to be imaged, and that a combination of depth and lack of penetration of the probe obscure visualization of the release event?
Figure 3.
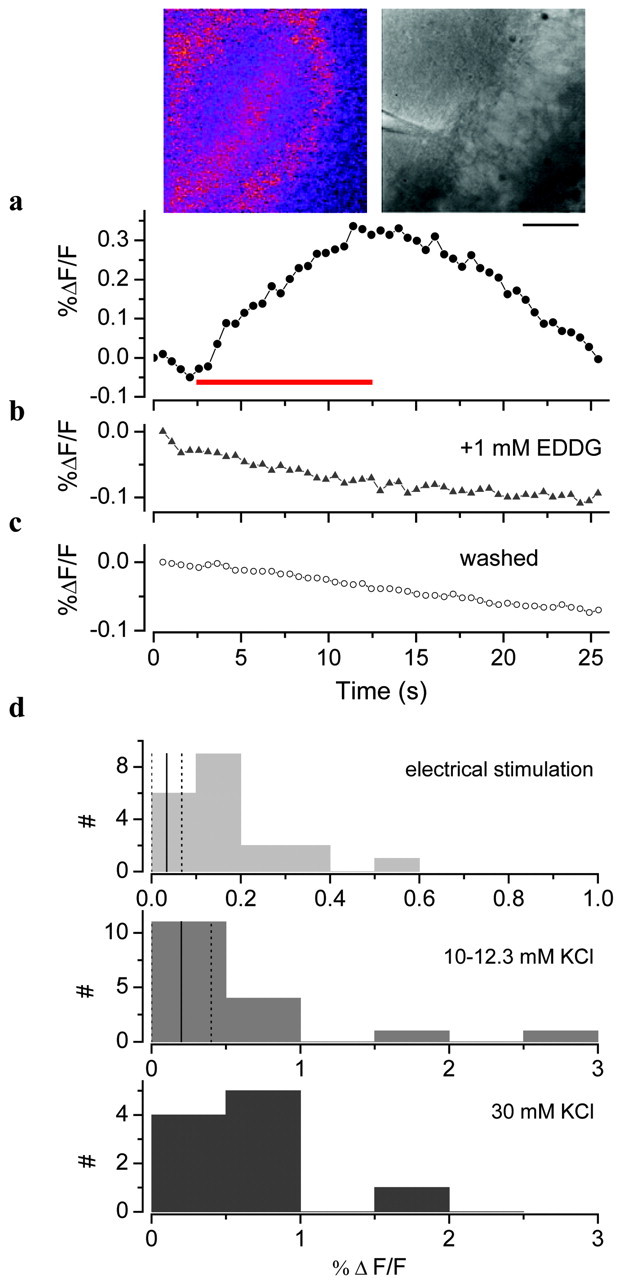
Electrically induced changes in FluoZin-3 fluorescence. Response of hippocampal slice to electrical stimulation (100 Hz, 10 sec; red bar) in the hilus in 2 μm FluoZin-3 and 25 μm Ca-EDTA (a), 2 μm FluoZin-3, 25 μm Ca-EDTA, and 1 mm EDDG (b), and after washing for 20 min (c). Insets, Left, Difference in fluorescence between the image at 13 and 2 sec. Right, Bright-field image with the stratum pyramidale of area CA4 on the right and the electrode in stratum radiatum. Scale bar, 100 μm. d, Change in fluorescence induced by electrical (100 Hz, 5-10 sec) and potassium stimulation in the hilus of the dentate gyrus and CA4. Vertical lines, Mean (solid) ± SD (dotted) of controls.
Table 1.
Changes in fluorescence induced by different stimulation regimens in the presence of 2 μm FluoZin-3 and 50 μm Ca-EDTA
|
|
Electrical stimulation (n = 20) |
10-12.3 mm KCI (iso-osmotic) (n = 16) |
30 mm KCI (iso-osmotic) (n = 10) |
50 mm KCI (iso-osmotic) (n = 7) |
50 mm KCI (n = 23) |
|---|---|---|---|---|---|
| % ΔF/Fa | 0.17 ± 0.12 | 0.45 ± 0.74 | 0.75 ± 0.67 | 3.53 ± 2.07 | 6.9 ± 2.7 |
| % Releaseb
|
60.9
|
37.5
|
50.0
|
85.7
|
100
|
Values shown are means ± SDs.
Percentage of experiments that showed some release.
To estimate how the depth of release affects fluorescence in a slice, the following experiments were performed. An electrode filled with 10 μm ZnSO4 was placed at different depths in a slice, and pressure was used to eject solution while imaging (Fig. 4). Ejection of Zn just above the surface led to a rapid increase in fluorescence followed by a rapid decline as a result of stirring the solution. If the tip of the pipette was placed below the surface, the increase in fluorescence was reduced (Fig. 4a) because of scattering; however, the time course was considerably prolonged, because the interior of the slice is effectively unstirred. When the electrode was placed 25 μm below the slice surface, the fluorescence intensity declined to 63% of that outside the slice and to 38% at a depth of 125 μm (Fig. 4b). These results suggest that it should be possible to detect small Zn elevations even in the depths of the slice.
Figure 4.
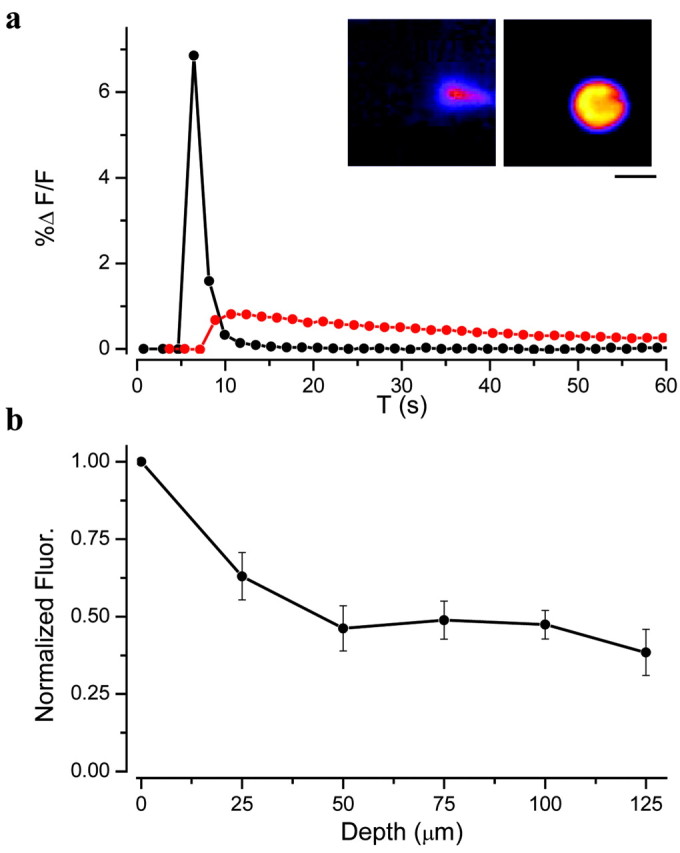
a, Imaging the fluorescence induced by the pressure ejection of ZnSO4 (10 μm in HEPES saline with 1.3 mm MgSO4 and 2 mm CaCl2; pulse duration, 60 msec; 18 psi) into a hippocampal slice bathed with 2 μm FluoZin-3 and 50 μm Ca-EDTA just above the surface of the slice (black circles) or 70 μm below the surface of the slice (red circles). Insets, At peak of response within slice (left) and out of slice (right). Scale bar, 100 μm. T, Time. b, Dependence of the peak fluorescence induced by the pressure ejection of 10 μm ZnSO4 as a function of the depth of penetration of the electrode into the slice. The fluorescence has been normalized by the response obtained with the electrode out of the slice (0 μm). Mean ± SEM (n = 3). Fluor., Fluorescence.
Potassium stimulation
Electrical stimulation perhaps emulates natural activity more closely than potassium stimulation; however, it is difficult to ensure that the stimulation includes all of the terminals in the field of view. In this regard, potassium stimulation is useful in that it can potentially stimulate all of the terminals, and it was used by Assaf and Chung (1984) (23.8 mM) to induce Zn release from hippocampal slices.
In the course of these experiments, I found that large increases in fluorescence could be induced by the addition of 50 mm KCl to slices incubated with 2 μm FluoZin-3 and 50 μm Ca-EDTA. This addition was uncompensated (i.e., there was also an increase in osmolarity of 81 mOsm). Addition of 50 mm KCl led to a marked increase in fluorescence that mapped onto regions of the hippocampus associated with the Timm's histochemical stain (Fig. 5a,b). However, there was also a larger increase in the fluorescence in area CA1 above and below the stratum pyramidale, areas that normally exhibit weak Timm's staining. The average increases in hippocampal sectors were as follows (% ΔF/F): dentate gyrus, 5.86 ± 0.80; CA3, 5.62 ± 0.92; and CA1, 7.12 ± 1.44 (n = 5; mean ± SEM; the areas measured are indicated Fig. 5a). That the increase in fluorescence was primarily associated with the release of Zn to the extracellular space, was demonstrated by the fact that EDDG led to a rapid truncation of the response (Fig. 5b) and inhibited the increase in fluorescence if applied before the addition of high potassium (data not shown). Application of high potassium to the cerebellum, a region of the brain that does not exhibit high levels of Timm's stain, did not lead to an increase in fluorescence (data not shown). Moreover, the fluorescent transient induced by 50 mm KCl in the presence of FluoZin-3 was absent from mice null for ZnT3 (% ΔF/F, 0.32 ± 0.25; n = 10), but present in wild-type mice (% ΔF/F, 5.62 ± 2.54; n = 7) (Fig. 5c)
Figure 5.
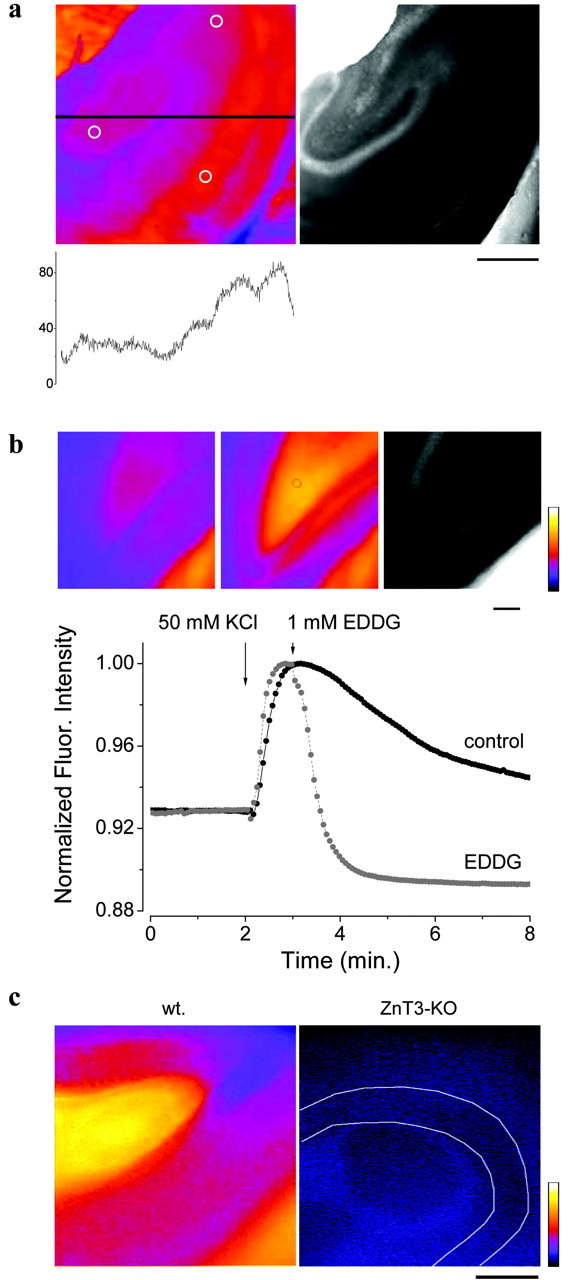
Stimulation of hippocampal slices with 50 mm KCl. a, Left, Pseudocolor difference image of the slice at the peak of the response and that before stimulation. The intensity profile along the line indicated in the image is graphed in register below the image. Circles indicate the approximate positions used for measurements of fluorescence in the dentate gyrus (left), CA3 (top), and CA1 (bottom). Right, Bright-field image of the same slice. FluoZin-3 (2 μm) and Ca-EDTA (50 μm). Note that the images appear different because of the inadvertent saturation of the image in the top-left corner of the bright-field image. Scale bar, 0.5 mm. b, Application of 1 mm EDDG chelates Zn released by a 50 mm KCl stimulus. Insets, Fluorescence before stimulation (2 min) (left), after stimulation at the peak of the response (control) (middle), and bright field of the same slice (right). Scale bar, 100 μm. Pseudocolor scale, 0-255. Fluor., Fluorescence. c, Image of mouse dentate gyrus during stimulation with 50 mm KCl in the presence of 2 μm FluoZin-3 and 50 μm Ca-EDTA in wild-type (wt) and ZnT3-null mice (ZnT3-KO) (the white lines delimit the granule cell layer). Images are the difference between fluorescence at the peak of the response and that before potassium stimulation. Pseudocolor scale, 0-255; scale bar, 100 μm.
Stimulation of slices with 50 mm KCl with an iso-osmotic solution change also led to a smaller increase in fluorescence over the Timm's-stainable regions of the hippocampus (% ΔF/F = 3.53 ± 2.07; n = 7); however, the latency of the response was far longer than that of the unbalanced 50 mm KCl stimulus [time to half-maximal amplitude, 94 ± 35 sec (n = 7) and 13 ± 6 sec (n = 11), respectively].
To assay the calcium dependence of the Zn release induced by high potassium, experiments were performed in saline with zero added Ca and 5 mm MgSO4. These conditions neither inhibited nor increased the latency of the Zn release induced by 50 mm KCl (% ΔF/F = 8.6 ± 1.8; time to half-maximal amplitude, 8.9 ± 1.9 sec; mean ± SEM; n = 4). An increase in osmolarity through the addition of 100 mm sucrose also led to the release of Zn (% ΔF/F = 2.3 ± 0.6; mean ± SEM; n = 3). In this case, the increase occurred more slowly (t1/2 = 97 ± 2 sec; mean ± SEM; n = 3).
Additional experiments were performed with the addition of 10-12.3 or 30 mm KCl, so that the osmolarity of the solution was preserved. Neither of these levels of stimulation invariably induced Zn release and led to smaller increases in fluorescence (Fig. 3d, Table 1).
Quantification of Zn release
FluoZin-3 is not a ratiometric probe, making the quantification of Zn release in an imaging experiment difficult. However, it is possible to use Equation 1 to estimate the concentration of Zn in the extracellular space. The peak Zn concentration during electrical stimulation was 4.2 ± 0.4 nm (n = 14), and for 50 mm KCl stimulation, it was 7.5 ± 1.1 nm (n = 10). Recall that, in the presence of 50 μm Ca-EDTA, the baseline Zn concentration was 2 nm; therefore, electrical stimulation only leads to an increase of ∼2 nm. If the value of fmax is in error and equals 20 rather than 36, the peak Zn concentration during electrical stimulation would be ∼16 nm, and for 50 mm KCl stimulation, it would be 24 nm.
A different approach was developed to quantify the amount of Zn released into the solution during potassium depolarization, by suspending slices within a fluorimeter (Fig. 6, inset). Seven hippocampal slices were held on a net 5 mm above the light path and 12 mm above a stir bar in a cuvette filled with physiological saline (2.5 ml) containing 2 μm FluoZin-3 and 50 μm Ca-EDTA. In control experiments, the slices were omitted from the cuvette. Five additions were made to the cuvette and will be dealt with in sequence (Fig. 6). First, addition of the slices to the cuvette led to an increase in fluorescence (equivalent to an elevation of 4.6 ± 1.4 nm; mean ± SEM; n = 8), whereas addition of control saline (125 μl) did not. The Zn concentration did not peak immediately after the addition of the slices but took 36 sec to reach a maximum. This suggests that the probe chelates Zn from within the slice rather than from the solution added with the slice. The slow decline represents the chelation of Zn by Ca-EDTA. Second, addition of 50 mm KCl led to a small, statistically insignificant decrease (∼0.9 nm) in fluorescence relative to that of the control experiment, with no sign of an increase relative to the control. Third, the sensitivity of the system was assayed by the addition of ZnSO4 at the end of the experiment, and it was found that the addition of 2.5 nm could be detected easily with this method (control, 0.19 ± 0.02; slices, 0.08 ± 0.03; mean ± SEM, normalized fluorescence). The response in the experimental solution was smaller than that in the control, and this could result from uptake by the slices, the release of a chelator, or quenching metal by the slices. Fourth, a further addition of 100 nm ZnSO4 was made to the cuvette, and there was again a reduction in the response with slices relative to the control (slices, 2.59 ± 0.26; control, 4.56 ± 0.26; mean ± SEM, normalized fluorescence). Fifth, to test whether this results from uptake of Zn by the slice, the basket was removed from the cuvette, and a further addition of 100 nm ZnSO4 was made. Removal of the slices did not significantly increase the response (slices, 2.63 ± 0.6; control, 4.98 ± 0.1; mean ± SEM, normalized fluorescence), suggesting that the slices have either released a Zn chelator into the solution or a quenching metal like copper or iron.
Discussion
Some experimental considerations
The method introduced here of using fluorescent probes in conjunction with a slow Zn chelator to image Zn has the advantage over physical techniques that the background levels of Zn are reduced, improving the chances of detecting very small elevations in Zn concentration. Moreover, if Zn is released, it is likely that a considerable fraction will be reinternalized by Zn transporters, allowing only a small amount to make its way into the bulk of the solution and be accessible to physical assay. An in situ technique has the advantage that it has access to Zn within the slice, intercepting it before it is internalized, while allowing real-time data acquisition.
It is important to recognize that, although fluorimetric methods may have some advantages over physical techniques, they can, under certain circumstances, give indications of Zn release when there is in fact none. For example, if Zn is weakly bound to a vesicular protein that is externalized during exocytosis but not released to the extracellular space, a Zn probe may prize Zn off the protein and give rise to an apparent Zn release event. Because fluorimetric techniques cannot distinguish between release and externalization, I will simply use the term “release” to include externalization as well.
Is Zn released?
There is little doubt that Zn exists in some glutamatergic synaptic vesicles in a somewhat less constrained state than in the rest of the cell, and that it is this Zn that is seen in Timm's-, N-(6-methoxy-8-quinolyl)-4 methylbenzenesulfonamide (TSQ) toluene sulfonamide quinoline-, Zinquin-, and N-(6-methoxy-8-quinolyl)-p-carboxybenzoylsulfonamide (TFLZn)-stained brain slices. However, my data bring into question the belief that this pool of Zn is freely available for release during exocytosis.
To reconcile the results of the imaging experiments with those of the slice-in-a-basket experiment, it is useful to calculate the amount of Zn likely to be released from synaptic vesicles if the full contents of the vesicle were free to enter into the extracellular space. Knocking out ZnT3 in mice leads to a reduction of the total Zn in the hippocampus by 3 ppm (Cole et al., 1999), which probably represents the vesicular Zn. If we assume that this figure holds for rats (wet weight of hippocampal slices, 2.6 ± 0.1 mg; mean ± SEM; n = 4), and that the application of 50 mm KCl leads to the release of 10% of the synaptic vesicular contents, then the Zn concentration in the slice-in-a-basket experiment should reach 33 nm. Furthermore, if we assume that the extracellular space represents 20% of the total volume (Cragg, 1980; Nicholson and Sykova, 1998), and that released Zn is distributed throughout the extracellular space, the extracellular Zn concentration should reach 23 μm. After stimulation with 50 mm KCl, the extracellular Zn concentration reaches a peak of only ∼6 nm, and making the same assumptions as above, the Zn concentration in the cuvette should reach only 8.7 pM, which is well below the detection limit of the slice-in-a-basket technique. These calculations suggest that, although there may be a high Zn concentration within synaptic vesicle (∼1 mM), very little makes its way into the synaptic cleft, perhaps being detained through an association with vesicular proteins. It is worth noting that extrapolating from the experiment of Assaf and Chung (1984), the concentration in the slice-in-a-basket experiment should have reached ∼290 nm.
My results are at variance with those recently published by Li et al. (2001a,b), who suggested that extracellular Zn reaches micromolar levels during synaptic stimulation. They used the fluorescent probe Newport Green, which has an affinity of ∼1 μm for Zn, considerably less avid than that of FluoZin-3. If electrical stimulation in the presence of FluoZin-3 gives rise to very small transient changes, then those with Newport Green should be ∼40 times smaller, assuming that the probes have similar quantum efficiencies. Extrapolating from my results (Table 1), the change in fluorescence resulting from Zn release in the presence of Newport Green should be less than the change in autofluorescence, making the change undetectable, at least in my system. Although similar conditions were used in our experiments, it is difficult to reconcile these rather different findings.
In a previous study, my colleagues and I (Budde et al., 1997) used the fluorimetric Zn probe TFLZn to image Zn within synaptic vesicles. A 10 Hz stimulus for 8 min in the presence of 1 mm extracellular Ca-EDTA led to a decline of fluorescence, consistent with the release of Zn. However, both the presence of TFLZn and extracellular Ca-EDTA may have contributed to the decline. That is, in their absence, Zn may have remained moored to a site within the externalized synaptic vesicle.
The highest levels of fluorescence induced by 50 mm KCl were encountered in area CA1 in my experiments. Although the Timm's stain in this area is rather faint, the CA3 pyramidal cells that send projections to this area express the Zn transporter ZnT3. Moreover, the ZnT3 protein is found in both stratum oriens and stratum radiatum. Nevertheless, both the Timm's stain and the levels of ZnT3 expressed are higher in mossy-fiber terminals. It could be that there are indeed higher levels of Zn in CA1; however, within the vesicles, the Zn may be complexed more tightly and may thus be less evident to histochemical stains. On exocytosis, the coordination of Zn may weaken and become available for chelation. Alternatively, the distribution may reflect the ease with which the different sectors are stimulated by high potassium or differences in Zn transport.
What accounts for the difference between the amount of Zn release evoked by electrical stimulation and 50 mm KCl? During the course of normal synaptic transmission, it is believed that some synaptic release occurs through the process of kiss and run, in which synaptic vesicles briefly dock and are rapidly reinternalized with a delay of a few microseconds (Kjaerulff et al., 2002; Sun et al., 2002). If, as I contend, Zn is presented in a loosely chelated form to the extracellular space, the susceptibility of Zn to chelation by FluoZin-3 will depend on the length of time that the Zn is exposed. With kiss and run, there would be little time for FluoZin-3 to abstract Zn from its putative site within the externalized vesicle. In the case of 50 mm KCl stimulation, I suggest that endocytosis occurs through the slow pathway, allowing more time for FluoZin-3 to chelate Zn. In addition to this mechanism, it is likely that traumatic stimuli may augment the loss of vesicular Zn (Suh et al., 2000).
The Zn veneer
Both the experiment on the slice-in-a-basket preparation and the experiment on unstimulated slices suggest that there is some Zn associated with the extracellular space. In the former experiment, washing the slices in physiological saline did not reduce the bolus of Zn release observed on addition of the slices to the cuvette. This suggests that the Zn is not free in the extracellular space but is loosely associated with molecules in the extracellular space and is chelated by FluoZin-3.
If ∼4.7 nm Zn (Fig. 5a) is released into a volume of 2.5 ml of solution when seven brain slices are placed in a cuvette, the concentration of Zn in the extracellular space, assuming again that it is 20% of total volume, is ∼3.2 μm.
The presence of this much Zn in the extracellular space and little Zn release under normal conditions may, at first blush, seem contradictory. However, the Zn veneer may simply reflect the steady state of a slow externalization and a correspondingly slow reuptake process. The overlap of the extracellular Zn and Timm's-stainable areas suggests that the pools feed into one another, although it is certainly possible that the extracellular Zn could simply be stocked from extracellular sources.
What is synaptic Zn for?
There are a large number of experiments showing that a variety of ion channels can be modulated by Zn with values of Kd in the range of 1-10 μm (Harrison and Gibbons, 1994). This coupled with the previous evidence for Zn release led to the notion that Zn might act as a neuromodulator. I have shown that Zn release occurs at a level too low for it to act as a phasic modulator of ion channels. There is one notable exception, the NMDA channel that has two Zn sites, one with an affinity of ∼10 nm (Paoletti et al., 1997). However, the high levels of loosely chelated extracellular Zn could mask small elevations of Zn.
If Zn does not act as a neuromodulator, what then might its functions be? Perhaps Zn is loosely associated with sites either on the inner face of the vesicular membrane or with an intravesicular matrix (Rahamimoff and Fernandez, 1997). On exocytosis, the Zn may stay in association with these sites and be reabsorbed during endocytosis. Zn may function intravesicularly or extracellularly in the following ways: (1) intravesicularly, it might operate as a cofactor or modulator of a vesicular protein, perhaps binding to a matrix within the synaptic vesicle or interacting with the release pore during exocytosis; (2) extracellularly, Zn may serve to maintain the extracellular veneer of Zn. I hypothesize that this Zn is associated with membrane proteins and can act as a hook for Zn-binding molecules in the extracellular space, much as a His-tag metal column does. Once the protein is bound, it may serve to signal directly or through uptake.
The precise role of synaptic Zn in the CNS has proved elusive, and I believe that the Zn veneer may hold the key to this enigma. One of the most striking features of zinc-enriched neurons is their involvement in intrinsic associational pathways, whereas long-range input and output pathways do not have high vesicular Zn (Frederickson and Moncrieff, 1994). An understanding of why some glutamatergic projections are Zn rich, whereas others are not, may be essential for an understanding of the operation of the cortical machinery.
Footnotes
This work was supported by National Institute of Neurological Disorders and Stroke Grant NS35243. I thank to the following individuals for helpful discussions: D. Bergles, D. Eide, M. Dailey, C. Fahrni, K. Gee, J. McNamara, M. Mattson, V. Nadler, A. Petersen, J. Telford, L.-G. Wu, and K.-W. Yau. Thanks also to T. Budde, J. Lilien, and R. Palmiter for comments on a previous version of this manuscript. I thank M. Dailey for providing rats and R. Palmiter for the ZnT3-null mice.
Correspondence should be addressed to Dr. Alan R. Kay, Biological Sciences, 138 Biology Building, University of Iowa, Iowa City, IA 52242. E-mail: alan-kay@uiowa.edu.
Copyright © 2003 Society for Neuroscience 0270-6474/03/236847-09$15.00/0
References
- Anikstejn L, Charton G, Ben-Ari Y ( 1987) Selective release of endogenous zinc from the hippocampal mossy fibers in situ. Brain Res 404: 58-64. [DOI] [PubMed] [Google Scholar]
- Arslan P, Di Virgilio F, Beltrame M, Tsien RY, Pozzan T ( 1985) Cytosolic Ca2+ homeostasis in Ehrlich and Yoshida carcinomas: a new, membrane-permeant chelator of heavy metals reveals that these ascites tumor cell lines have normal cytosolic free Ca2+ J Biol Sci 260: 2719-2727. [PubMed] [Google Scholar]
- Assaf SY, Chung S-H ( 1984) Release of endogenous Zn2+ from brain tissue during activity. Nature 308: 734-735. [DOI] [PubMed] [Google Scholar]
- Billington N, Knight AW ( 2001) Seeing the wood through the trees: a review of techniques for distinguishing green fluorescent protein from endogenous autofluorescence. Anal Biochem 291: 175-197. [DOI] [PubMed] [Google Scholar]
- Budde T, Minta A, White JA, Kay AR ( 1997) Imaging free zinc in synaptic terminals in live hippocampal slices. Neuroscience 79: 347-358. [DOI] [PubMed] [Google Scholar]
- Cole TB, Wenzel HJ, Kafer KE, Schwartzkroin PA, Palmiter RD ( 1999) Elimination of zinc from synaptic vesicles in the intact mouse brain by disruption of the ZnT3 gene. Proc Natl Acad Sci USA 96: 1716-1721. [DOI] [PMC free article] [PubMed] [Google Scholar]
- Cole TB, Robbins CA, Wenzel HJ, Schwartzkroin PA, Palmiter RD ( 2000) Seizures and neuronal damage in mice lacking vesicular zinc. Epilepsy Res 39: 153-169. [DOI] [PubMed] [Google Scholar]
- Cragg B ( 1980) Preservation of extracellular space during fixation of the brain for electron microscopy. Tissue Cell 12: 63-72. [DOI] [PubMed] [Google Scholar]
- Danscher G, Shipley MT, Andersen P ( 1975) Persistent function of mossy fiber synapses after metal chelation with DEDTC (Antabuse). Brain Res 85: 522-526. [DOI] [PubMed] [Google Scholar]
- Davis JP, Tikunova SB, Walsh MP, Johnson JD ( 1999) Characterizing the response of calcium signal transducers to generated calcium transients. Biochemistry 38: 4235-4244. [DOI] [PubMed] [Google Scholar]
- Ermentrout GB ( 2002) Simulating, analyzing, and animating dynamical systems: a guide to XPPAUT for researchers and students. Philadelphia: Society for Industrial and Applied Mathematics.
- Frederickson CJ ( 1989) Neurobiology of zinc and zinc-containing neurons. Int Rev Neurobiol 31: 145-238. [DOI] [PubMed] [Google Scholar]
- Frederickson CJ, Moncrieff DW ( 1994) Zinc-containing neurons. Biol Signals 3: 127-139. [DOI] [PubMed] [Google Scholar]
- Gee KR, Zhou ZL, Qian WJ, Kennedy R ( 2002) Detection and imaging of zinc secretion from pancreatic β-cells using a new fluorescent zinc indicator. J Am Chem Soc 124: 776-778. [DOI] [PubMed] [Google Scholar]
- Harrison NL, Gibbons SJ ( 1994) Zn2+: an endogenous modulator of ligand- and voltage-gated ion channels. Neuropharmacology 33: 935-952. [DOI] [PubMed] [Google Scholar]
- Howell GA, Welch MG, Frederickson CJ ( 1984) Stimulation-induced uptake and release of zinc in hippocampal slices. Nature 308: 736-738. [DOI] [PubMed] [Google Scholar]
- Kjaerulff O, Verstreken P, Bellen HJ ( 2002) Synaptic vesicle retrieval: still time for a kiss. Nat Cell Biol 4: E245-E248. [DOI] [PubMed] [Google Scholar]
- Lakowicz JR ( 1999) Principles of fluorescence spectroscopy, Ed 2. New York: Kluwer Academic/Plenum Publishers.
- Li Y, Hough CJ, Frederickson CJ, Sarvey JM ( 2001a) Induction of mossy fiber→CA3 long-term potentiation requires translocation of synaptically released Zn2+ J Neurosci 21: 8015-8025. [DOI] [PMC free article] [PubMed] [Google Scholar]
- Li Y, Hough CJ, Suh SW, Sarvey JM, Frederickson CJ ( 2001b) Rapid translocation of Zn2+ from presynaptic terminals into postsynaptic hippocampal neurons after physiological stimulation. J Neurophysiol 86: 2597-2604. [DOI] [PubMed] [Google Scholar]
- Maske H ( 1955) Über den topochemischen Nachweis von Zink im Ammonshorn verschiedener Säugestiere. Naturwissenschaften 42: 424. [Google Scholar]
- Nicholson C, Sykova E ( 1998) Extracellular space structure revealed by diffusion analysis. Trends Neurosci 21: 207-215. [DOI] [PubMed] [Google Scholar]
- Palmiter RD, Cole TB, Quaife CJ, Findley SD ( 1996) ZnT-3, a putative transporter of zinc into synaptic vesicles. Proc Natl Acad Sci USA 93: 14934-14939. [DOI] [PMC free article] [PubMed] [Google Scholar]
- Paoletti P, Ascher P, Neyton J ( 1997) High-affinity zinc inhibition of NMDA NR1-NR2A receptors. J Neurosci 17: 5711-5725. [DOI] [PMC free article] [PubMed] [Google Scholar]
- Rahamimoff R, Fernandez JM ( 1997) Pre- and postfusion regulation of transmitter release. Neuron 18: 17-27. [DOI] [PubMed] [Google Scholar]
- Rector DM, Poe GR, Kristensen MP, Harper RM ( 1997) Light scattering changes follow evoked potentials from hippocampal Schaeffer collateral stimulation. J Neurophysiol 78: 1707-1713. [DOI] [PubMed] [Google Scholar]
- Sick TJ, Rosenthal M ( 1989) Indo-1 measurements of intracellular free calcium in the hippocampal slice: complications of labile NADH fluorescence. J Neurosci Methods 28: 125-132. [DOI] [PubMed] [Google Scholar]
- Smith RM, Martell AE ( 1998) NIST critically selected stability constants of metal complexes database, Ed 5.0. Gaithersburg, MD: National Institute of Standards and Technology.
- Snitsarev V, Budde T, Stricker TP, Cox JM, Krupa DJ, Geng L, Kay AR ( 2001) Fluorescent detection of Zn2+-rich vesicles with Zinquin: mechanism of action in lipid environments. Biophys J 80: 1538-1546. [DOI] [PMC free article] [PubMed] [Google Scholar]
- Suh SW, Chen JW, Motamedi M, Bell B, Listiak K, Pons NF, Danscher G, Frederickson CJ ( 2000) Evidence that synaptically-released zinc contributes to neuronal injury after traumatic brain injury. Brain Res 852: 268-273. [DOI] [PubMed] [Google Scholar]
- Sun JY, Wu XS, Wu LG ( 2002) Single and multiple vesicle fusion induce different rates of endocytosis at a central synapse. Nature 417: 555-559. [DOI] [PubMed] [Google Scholar]
- Tsien R, Pozzan T ( 1989) Measurement of cytosolic free Ca2+ with quin2. Methods Enzymol 172: 230-262. [DOI] [PubMed] [Google Scholar]
- Wang Z, Li JY, Dahlstrom A, Danscher G ( 2001) Zinc-enriched GABAergic terminals in mouse spinal cord. Brain Res 921: 165-172. [DOI] [PubMed] [Google Scholar]
- Wenzel HJ, Cole TB, Born DE, Schwartzkroin PA, Palmiter RD ( 1997) Ultrastructural localization of zinc transporter-3 (ZnT-3) to synaptic vesicle membranes within mossy fiber boutons in the hippocampus of mouse and monkey. Proc Natl Acad Sci USA 94: 12676-12681. [DOI] [PMC free article] [PubMed] [Google Scholar]