

Abstract
Increasing evidence suggests that cyclooxygenase-2 (COX-2) is involved in synaptic transmission and plasticity, and prostaglandin E2 (PGE2) is a key molecule in COX-2-meduated synaptic modification. However, the precise mechanisms, in particular, which subtypes of PGE2 receptors (EPs) mediate the PGE2-induced synaptic response, are not clear. Recently, we demonstrated that EPs are expressed heterogeneously in the hippocampus, and EP2/4 are mainly expressed in presynaptic terminals. Here, we report that PGE2 increased synaptic stimulus-evoked amplitudes of EPSPs in hippocampal slices and frequency of miniature EPSCs (mEPSCs) in hippocampal neurons in culture. These actions were mimicked by an EP2 agonist and attenuated by protein kinase A inhibitors. Decrease of EP2 expression through silencing the EP2 gene eliminated PGE2-induced increase of the frequency of mEPSCs. COX-2 and microsomal PGE synthase-1 (mPGES-1) and mPGES-2 are present in postsynaptic dendritic spines, because they are colocalized with PSD-95 (postsynaptic density-95), a postsynaptic marker. In addition, the frequency of mEPSCs was enhanced in neurons pretreated with interleukin-1β or lipopolysaccharide, which elevated expression of COX-2 and mPGES-1 and produced PGE2, and this enhancement was inhibited by a COX-2 inhibitor that inhibited production of PGE2. Our results suggest that PGE2 synthesized by postsynaptically localized COX-2 functions as a retrograde messenger in hippocampal synaptic signaling via a presynaptic EP2 receptor.
Keywords: cyclooxygenase-2, microsomal prostaglandin synthase, retrograde messenger, PGE2 receptors, small hairpin RNA, gene silence
Introduction
Cyclooxygenases (COXs) are the rate-limiting enzymes that convert arachidonic acid (AA) to prostaglandins. Of three COX isozymes (Vane et al., 1998; Bazan and Flower, 2002; Chandrasekharan et al., 2002), COX-2 has become the focus of growing attention, because selective COX-2 inhibitory drugs target its high inducibility by inflammation. Moreover, this enzyme is important to neuronal signaling and has been implicated in epilepsy, Alzheimer's, and other neurologic diseases. Expression of COX-2 is regulated by NMDA receptor-dependent synaptic activity and by a high-frequency stimulation (HFS) associated with long-term potentiation (LTP) induction (Yamagata et al., 1993). Furthermore, COX-2 is localized in excitatory neuronal dendrites (Kaufmann et al., 1996). These previous studies suggested that COX-2 is involved in synaptic transmission and plasticity. Recently, direct evidence that COX-2 participates in hippocampal long-term synaptic plasticity has been provided (Chen et al., 2002). Selective COX-2 inhibitors, but not those of COX-1, reduce HFS-induced LTP in hippocampal perforant path-dentate granule cell synapses. Importantly, the COX-2 inhibitor-induced reduction of LTP can be reversed by exogenous addition of prostaglandin E2 (PGE2) but not by prostaglandin D2 (PGD2) or prostaglandin F2α (PGF2α) (Chen et al., 2002). Because PGE2 is derived mainly from the COX-2 pathway (Brock et al., 1999; Vidensky et al., 2003; Chen and Bazan, 2005), it is likely that PGE2 may be a key messenger in COX-2-mediated regulation of hippocampal synaptic transmission and plasticity (Bazan, 2001; Chen et al., 2002; Chen and Bazan, 2005a,b). However, mechanisms by which PGE2 participates in synaptic signaling are not well understood.
Four subtypes of PGE2 receptors (EP1-4) have been cloned (Boie et al., 1997; Narumiya et al., 1999; Breyer et al., 2001), all displaying seven-hydrophobic-transmembrane-segment architecture typical of G-protein-coupled receptors and evoking cellular responses via distinct intracellular signaling (Narumiya et al., 1999; Breyer et al., 2001). EP2 and EP4 receptors couple with the Gs-adenylyl cyclase (AC)-cAMP pathway and increase cAMP levels. In contrast, activation of EP3 receptors inhibits cAMP generation via a pertussis toxin-sensitive Gi-coupled mechanism. EP1 receptors couple with the Gq-phospholipase C-IP3 pathway. All four subtypes of EPs are expressed heterogeneously in the hippocampus (Zhu et al., 2005), and the expression of EP2 and EP3 is more abundant in hippocampal neurons. Because EP2 and EP3 are coupled to Gs and Gi, this implies that EP2 and EP3 may be functionally relevant in the hippocampus.
The purpose of the present work was to examine how PGE2 elicits its action as a messenger in synaptic transmission and its relationship with COX-2-mediated synaptic modifications. Our results indicate that PGE2 is a retrograde messenger in excitatory synaptic transmission through a presynaptic EP2 receptor that increases the probability of glutamate release at hippocampal synapses. Moreover, endogenous PGE2 is an important modulator of synaptic physiology, and its accumulation (e.g., increased COX-2 expression) may contribute to synaptic dysfunction and lead to pathologic conditions.
Materials and Methods
Hippocampal slice preparation. Hippocampal slices were prepared from 7- to 14-week-old FVB mice (Chen et al., 2001, 2002; Chen and Bazan, 2005). Briefly, after decapitation, brains were removed rapidly and placed in cold oxygenated (95% O2, 5% CO2) low-Ca2+/high-Mg2+ slicing solution composed of the following (in mm): 2.5 KCl, 7.0 MgCl2, 28.0 NaHCO3, 1.25 NaH2PO4, 0.5 CaCl2, 7.0 glucose, 3.0 pyruvic acid, 1.0 ascorbic acid, and 234 sucrose. Slices were cut at a thickness of 400 μm and transferred to a holding chamber in an incubator containing oxygenated artificial CSF (ACSF) composed of the following (in mm): 125.0 NaCl, 2.5 KCl, 1.0 MgCl2, 25.0 NaHCO3, 1.25 NaH2PO4, 2.0 CaCl2, 25.0 glucose, 3 pyruvic acid, and 1 ascorbic acid at 36°C for 0.5-1 h and maintained in an incubator containing oxygenated ACSF at room temperature (∼22-24°C) for >1.5 h before recordings. Slices were then transferred to a recording chamber where they were perfused continuously with the 95% O2, 5% CO2-saturated standard ACSF at ∼32-34°C. Individual dentate granule neurons or CA1 pyramidal neurons were viewed with a Zeiss (Oberkochen, Germany) Axioskop microscope, fitted with a 60× (Olympus, Melville, NY) water-immersion objective and differential interference contrast optics.
Primary hippocampal neuron culture. Primary hippocampal neurons were grown in culture as described previously with some modifications (Chen and Bazan, 1999). Briefly, hippocampi were dissected out from FVB mouse pups [postnatal day 0 (P0) to P1]. Tissue was incubated in oxygenated trypsin for 10 min at 37°C and then mechanically triturated. Cells were spun down and resuspended in Neurobasal/B27 medium (Invitrogen, San Diego, CA) supplemented with 0.5 mm l-glutamine, penicillin/streptomycin, and 25 μm glutamate. Cells (1 × 10⁶) were loaded into poly-d-lysine-coated 35 mm culture dishes for electrophysiological recordings and into six-well plates for real-time PCR analysis. Cells (4 × 10⁴) were plated on poly-d-lysine-coated glass coverslips for immunocytochemistry. In certain experiments in which the proliferation of glial astrocytes was inhibited, cultures were treated with 5-10 μm cytosine arabinoside (Arac). One-third to one-half of the culture medium without glutamate was changed every 2-3 d. Cultures were used between 10 and 15 d in vitro (DIV).
Electrophysiological recordings. Whole-cell patch-clamp recordings were made using an Axoclamp-2B patch-clamp amplifier in bridge mode for the current-clamp recordings. Recording pipettes (3-5 MΩ for CA1 pyramidal neurons and 5-7 MΩ for dentate granule neuron recordings) were pulled from borosilicate glass with a micropipette puller (Sutter Instruments, Novato, CA). The internal pipette solution contained the following (in mm): 120 potassium gluconate, 20 KCl, 4 NaCl, 10 HEPES, 0.5 EGTA, 0.28 CaCl2, 4 Mg2ATP, 0.3 Tris2GTP, and 14 phosphocreatine, pH 7.25 with KOH. The resting membrane potential for recorded cells was between -62 to -74 mV for CA1 pyramidal neurons and -75 to -86 mV for dentate granule neurons. EPSPs were recorded in response to Schaffer collateral or perforant path stimulus at a frequency of 0.05 Hz via a bipolar tungsten electrode. Paired-pulse stimulation was induced by delivering two pulses with an interpulse interval of 80-100 ms (Zucker, 1989; Chen et al., 2001). Paired-pulse ratio (PPR) was calculated as P2/P1 (P1, the amplitude of the first EPSP; P2, the amplitude of the second EPSP). Series resistance was monitored during recordings by injection of a hyperpolarizing current (50 pA) before delivery of a stimulus (Chen, 2004). Miniature EPSCs (mEPSCs) were recorded in primary hippocampal neurons in culture under voltage clamp using an Axopatch-200B amplifier. The membrane potential was held at -70 mV. The internal pipette solution contained the following (in mm): 120 Csgluconate, 20 KCl, 4 NaCl, 10 HEPES, 0.5 EGTA, 0.28 CaCl2, 4 Mg2ATP, 0.3 Tris2GTP, and 14 phosphocreatine, pH 7.25 with KOH. The external solution contained the following (in mm): 130.0 NaCl, 2.5 KCl, 1.0 MgCl2, 10.0 HEPES, 1.25 NaH2PO4, 2.0 CaCl2, 25.0 glucose, pH 7.4 with NaOH. TTX (0.5-1 μm) and bicuculline (10 μm) were added in the external solution. The frequency, amplitude, and rising and decay kinetics were analyzed using the MiniAnalysis program (Synaptosoft, Fort Lee, NJ).
RNA isolation and DNase treatment. Total RNA was prepared from harvested cells with the RNeasy Mini kit (Qiagen, Hilden, Germany) and treated with RNase-free DNase (Qiagen) according to the manufacturer's instructions. The RNA concentration was measured by spectrophotometer (DU 640; Beckman Instruments, Fullerton, CA). RNA integrity was verified by electrophoresis in a 1% agarose gel.
Reverse transcription and real-time PCR. The iScript cDNA synthesis kit (Bio-Rad, Hercules, CA) was used for the reverse transcription reaction. We used 1 μg of total RNA with 4 μl of 5× iScript reaction mix and 1 μl of iScript reverse transcriptase. The total volume was 20 μl. Samples were incubated for 5 min at 25°C. All samples were then heated to 42°C for 30 min, and reactions were stopped by heating to 85°C for 5 min.
Real-time reverse transcription-PCR (RT-PCR)-specific primers for COX-2, microsomal PGE synthase-1 (mPGES-1), mPGES-2, cytosolic PGES (cPGES), and glyceraldehyde-3-phosphate dehydrogenase (GAPDH) were selected using Beacon Designer software (Bio-Rad) and synthesized by IDT (Coralville, IA). They are listed as follows: name, forward primer, reverse primer (amplicon size), GenBank accession number: COX-2, 5-aagcgaggacctgggttcac-3, 5-acacctctccaccaatgacctg-3 (142 bp), BC052900; mPGES-1, 5-gatgaggctgcggaagaagg-3, 5-gcgaaggcgtgggttcag-3 (271 bp), NM_022415; mPGES-2, 5-aagccaggacggaggagatg-3, 5-atcactcgcagcacaccatac-3 (355 bp), NM_133783; cPGES, 5-cagttgtcttggaggaagcg-3, 5-ttattgaagtccacactgagcc-3 (201 bp), AY281130; and GAPDH, 5-accacagtccatgccatcac-3, 5-accttgcccacagccttg-3 (134 bp), M32599. The PCR amplification of each product was further assessed using 10-fold dilutions of mouse brain cDNA library as a template and found to be linear over five orders of magnitude and at >95% efficiency. All the PCR products were verified by sequencing. The reactions were set up in duplicate in total volumes of 25 μl containing 12.5 μl of 2× iQSYBR green Supermix (Bio-Rad) and 5 μl of template (1:10 dilution from RT product) with a final concentration of 400 nm of the primer. The PCR cycle was as follows: 95°C for 3 min, 45 cycles of 95°C for 30 s, 58°C for 45 s, and 95°C for 1 min, and the melt-curve analysis was performed at the end of each experiment to verify that a single product per primer pair was amplified. Furthermore, the sizes of the amplified DNA fragments were verified by gel electrophoresis on a 3% agarose gel. The amplification and analysis were performed using an iCycler iQ Multicolor Real-Time PCR Detection System (Bio-Rad). Samples were compared using the relative cycle threshold (CT) method. The fold increase or decrease was determined relative to a vehicle-treated control after normalizing to a housekeeping gene using 2-ΔΔCT, where ΔCT is (gene of interest CT) - (GAPDH CT), and ΔΔCT is (ΔCT treated) - (ΔCT control).
Immunocytochemistry. Immunostaining was performed in primary hippocampal neurons in culture. The neurons were rinsed with PBS after removal of the culture medium and fixed with prewarmed (37°C) 4% paraformaldehyde, 4% sucrose in 0.1 m phosphate buffer, pH 7.2, and incubated for 20 min at room temperature. Then, the cells were washed with ice-cold PBS four times and incubated with blocking buffer (1% BSA and 10% normal goat serum) in PBS at room temperature for 1 h. Primary antibodies at different dilutions (in PBS containing 1% BSA) were applied for 1 h at 37°C. These were rabbit anti COX-2, mPGES-1 and -2, cPGES (1:200; Cayman Chemical, Ann Arbor, MI), mouse anti-PSD-95 (postsynaptic density-95) (12.5 μg/ml), and synaptophysin (1: 1000; Chemicon, Temecula, CA). After four 10 min washes with PBS containing 1% BSA, species-specific and highly cross-adsorbed secondary antibodies coupled to Alexa 488 and cyanine 3 (Invitrogen), diluted 1:1000 in PBS containing 1% BSA, were applied for 1 h at 37°C. Cells were washed four times, 10 min each, with PBS containing 1% BSA and rinsed with PBS. Negative controls without primary antibody or secondary antibody for second staining in double staining were checked. No apparent cross-reactions from the second staining were noticed. The specificity of antibodies was checked by adsorption with corresponding blocking peptides (ratio of primary antibody/blocking peptide, 1:1) from the same company. The images were taken by a Zeiss 510 Meta laser confocal microscope with LSM 510 Meta software.
Plasmid construction. The PGSU6-GFP plasmid (GeneSilencer shRNA Vectors kit; Gene Therapy Systems, San Diego, CA), which contains the human U6 RNA pol III promoter for the expression of small hairpin RNA (shRNA) and the cytomegalovirus (CMV) promoter carried with the green fluorescent protein (GFP) reporter gene were used for construction of the shRNA-encoding plasmids. These were generated by inserting annealed oligonucleotides (EP2 sense plus EP2 antisense) (supplemental Table 1, available at www.jneurosci.org as supplemental material) into GeneSilencer shRNA vectors between the BamHI and NotI restriction sites. The shRNA inserts were designed based on the following criteria: (1) the 19 nt target sites were immediately downstream of an AA dinucleotide; (2) the G/C content of target sites ranged between 49 and 60%; (3) the sequence did not contain a repeat of more than three Gs or Cs; and (4) target regions were at least 70-100 nt away from the translational initiation site of the transcript (Caplen and Mousses, 2003). Selected sequences were submitted to a basic local alignment search tool search against the human genome sequence to ensure that the human genome was not targeted. Two pairs of candidate target sequences satisfied the criteria. We designed three different oligonucleotides (number 1, nucleotides 495-513; number 2, nucleotides 593-611; and number 3, nucleotides 1438-1456; GenBank accession number NM_008964). It appeared that the resultant plasmids that expressed three different shRNA targeting the EP2 worked, as evident from the decreases in mRNA and protein in RAW264.7 macrophages transfected with the plasmids. Annealed oligonucleotides (luciferase sense and antisense provided with the GeneSilencer shRNA Vectors kit; Gene Therapy Systems) were cloned into the vectors between the BamHI and NotI restriction sites as negative control plasmid. Similar procedures were used for designing EP4 oligonucleotides (number 1, nucleotides 1118-1136; number 2, nucleotides 1146-1164; and number 3, nucleotides 1506-1524; GenBank accession number NM_008965) and constructing EP4-shRNA plasmid.
Transfection of the shRNA expression plasmid. Transfection with the shRNA-encoding plasmid into primary hippocampal neurons in culture was conducted using a calcium phosphate precipitate protocol (Xia et al., 1996). Hippocampal neurons (8 × 10⁵) from P0 mice were plated onto 35 mm dishes for electrophysiological recordings, and 1 × 10⁵ cells were plated onto four-well chamber slides for immunostaining and transfected on 9 DIV. Neuronal culture medium (2 ml) was added into each dish for making conditioned medium on 8 DIV, and one-half of the conditioned medium in each dish was removed and saved before addition of the transfection precipitate. The DNA/calcium phosphate precipitate was prepared by mixing 1 vol of EP2- or EP4-shRNA plasmid DNA in 125 mm CaCl2 solution with an equal volume of 2× HBS [composed of the following (in mm): 42 HEPES, 274 NaCl, 1.4 Na2HPO4·7H2O, 10 KCl, and 15 glucose, pH 7.05]. The precipitate was incubated at room temperature for 30 min and shielded from light before addition of the transfection mixture onto the neurons. EP2-shRNA or EP4-shRNA plasmid DNA (10 μg) or luciferase-shRNA plasmid was used for 35 mm dishes and 2 μg of DNA for four-well chamber slides. After addition of the transfection precipitate mixture onto cells, the dishes were returned to the incubator for 90 min. Neurons were then washed twice with neuronal culture medium and returned to the incubator after addition of the saved conditioned medium back to each plate.
Hippocampal PGE2 assay. Quantitative analysis of PGE2 by liquid chromatography-mass spectrometry-mass spectrometry (LC-MS-MS) was performed in mouse hippocampal slices (Marcheselli et al., 2003; Chen and Bazan, 2005). Hippocampal slices were cut the same as for electrophysiological recordings and pretreated with or without N-[2-cyclohexyloxy-4-nitrophenyl]methanesulfonamide (NS398) (20 μm). Hippocampal slices were homogenized immediately in 1 ml of cold chloroform:methanol (1:1, v/v) and kept under nitrogen at -80°C until purification. To increase expression of COX-2, mice were injected with lipopolysaccharide (LPS; 3 mg/kg, i.p.). Animals were killed 4 and 12 h after LPS injection by head-focused microwave radiation that delivers 10 kW, 80% direct power, for 0.4 s duration to denature tissue proteins, and hippocampi were rapidly dissected out and homogenized in 1 ml of chloroform:methanol (1:1, v/v). Purification was performed by a solid-phase extraction technique (Marcheselli et al., 2003). In short, samples pre-equilibrated at pH 3.0 were loaded onto C18 columns (Varian, Palo Alto, CA) and eluted with 10 ml of 1% methanol in ethyl acetate (EM Science, Gibbstown, NJ). Samples were concentrated by nitrogen-stream evaporator before LC-MS analysis. Samples were loaded into a Surveyor MS pump (Thermo-Finnegan, Altrincham, UK) equipped with a C18 discovery column (inner diameter, 10 cm × 2.1 mm; internal phase, 5 μm; Supelco, Bellefonte, PA). Samples were eluted in a linear gradient [100% solution A (60:40:0.01 methanol/water/acetic acid) to 100% solution B (99.99:0.01 methanol/acetic acid)] and run at a flow rate of 300 μl/min for 45 min. LC effluents were diverted to an electrospray ionization probe on a TSQ Quantum (Thermo-Finnegan) triple quadrupole mass spectrometer running on negative ion-detection mode. PGE2 and PGD2 standards were used for calibration and optimization. The instrument was run on full-scan mode to detect parent ions and selected-reaction mode for quantitative analysis to detect daughter ions simultaneously.
PGE2, 17-phenyl trinor prostaglandin E2 (17-P-PGE2), butaprost, and sulprostone were purchased from Cayman Chemical, and N-[2-(P-bromocinnamylamino)ethyl]-5-isoquino-linesulfonamide dihydrochloride (H-89) and KT5720 ((9R,10S,12S)-2,3,9,10,11,12-hexahydro-10-hydroxy-9-methyl-1-oxo-9,12-epoxy-1H-diindolo[1,2,3-fg-3′,2′,1′-K1]pyrrolo[3,4-1][1,6]benzodiazocine-10-carboxylic acid) (KT) were purchased from Tocris (Ellisville, MO). All other drugs and chemicals were obtained from Sigma (St. Louis, MO), unless stated otherwise.
Data were presented as mean ± SEM. Unless stated otherwise, Student's t test and ANOVA with Student-Newman-Keuls test were used for statistical comparison when appropriate. Differences were considered significant when p < 0.05. The care and use of the animals reported in this study were approved by the Institutional Animal Care and Use Committee of Louisiana State University Health Sciences Center.
Results
PGE2 enhances the amplitude of EPSPs and frequency of mEPSCs
To assess how PGE2 modulates synaptic signaling, we recorded EPSPs both in dentate granule neurons in response to perforant path stimulus at a frequency of 0.05 Hz via a bipolar tungsten electrode and in CA1 pyramidal neurons in response to Schaffer collateral stimulus in hippocampal slices (Chen et al., 2002; Chen and Bazan, 2005). Bath application of PGE2 (5 μm) increased EPSP amplitudes by 29.4 ± 5.2% (averaged from 10 min application; n = 7) at perforant path-dentate granule cell synapses and by 67.3 ± 15.2% (n = 8) at Schaffer collateral-CA1 pyramidal cell synapses, respectively (Fig. 1a-c). Meanwhile, we used a paired-pulse protocol to determine whether there was a change in PPR. As indicated in Figure 1d, PGE2 significantly reduced PPR from the baseline of 1.12 ± 0.05 to 1.02 ± 0.03 (p < 0.05) at perforant path and from 1.58 ± 0.07 to 1.42 ± 0.04 (p < 0.05) at Schaffer collateral-CA1 pyramidal cell synapses. These results suggested that PGE2-induced potentiation of EPSPs may be mediated via a presynaptic mechanism. To explore this notion, we recorded spontaneous mEPSCs in primary hippocampal neurons in culture. As shown in Figure 1e-g, application of PGE2 (5 μm) enhanced the frequency of mEPSCs (196.4 ± 11.3% of baseline at 10 min after the application of PGE2; p < 0.01) but not the amplitude (96.8 ± 6.1% of baseline). The enhancement appeared to be reversible after 20 min of washing. Analysis of kinetics of mEPSCs in the absence and presence of PGE2 showed that there were no changes in rising and decay time constants (101.7 ± 9.4 and 91.4 ± 16.1% of baseline, respectively). This information provided additional evidence that the locus of the PGE2-produced action in enhancing synaptic transmission is at a presynaptic site. In addition, the PGE2-induced increase in the frequency of mEPSCs is concentration dependent (Figure 1l), and the EC50 value is 3.0 ± 0.6 μm. Because PGE2 has been shown to stimulate glutamate release from astrocytes (Bezzi et al., 1998), it is conceivable that the PGE2-induced increase in synaptic activity resulted from the release of glutamate from astrocytes. The use of Neurobasal/B27 medium limits the growth and/or proliferation of glial cells. This means that our culture was relatively purely neuronal. To determine the extent of glial cells in culture, we used GFAP, an astrocyte marker, and isolectin B4, a microglia marker. We found that microglial cells and astrocytes in cultures are 1.1 ± 0.3 and 0.8 ± 0.3% (n = 10) at 10 DIV, respectively. To further exclude the possibility of the involvement of glial astrocytes in the PGE2-induced effect, the hippocampal cultures were treated with Arac (10 μm) 24 h after plating. This treatment further decreased the extent of glial cells in cultures (microglial cells, 0.4 ± 0.2%; astrocytes, 0.2 ± 0.2%; n = 10). Using these cultures, PGE2 still increased the frequency of mEPSCs (215.5 ± 22.3% of baseline at 10 min after the application of PGE2; p < 0.01), whereas the amplitude of mEPSCs remained unchanged (104.4 ± 3.1% of baseline) (Fig. 2).
Figure 1.
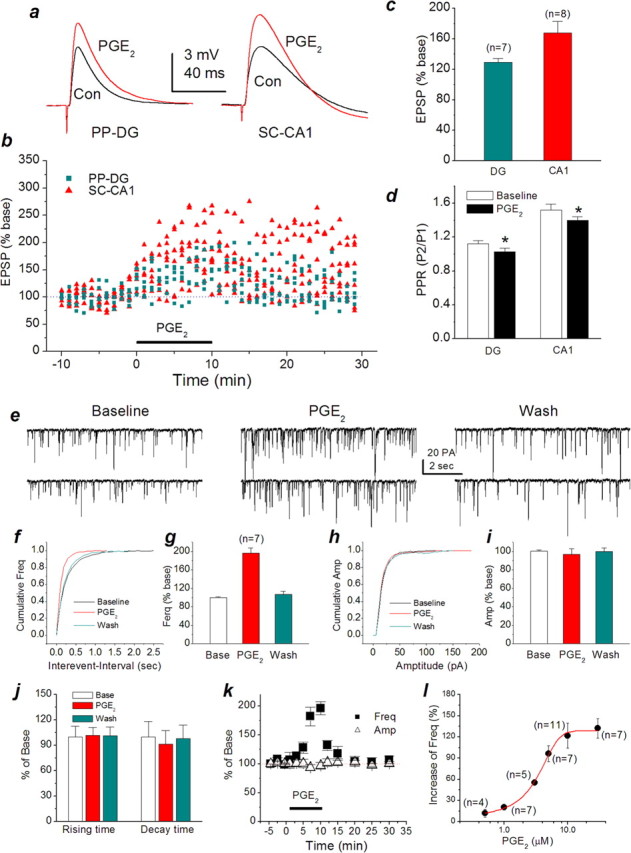
PGE2 enhances EPSPs and mEPSCs in the hippocampus. a, Representative EPSP waveforms recorded from a dentate granule neuron or a CA1 pyramidal neuron in response to perforant path or Schaffer collateral stimulus at a frequency of 0.5 Hz in hippocampal slices in the absence or presence of PGE2 (5 μm). b, Time courses of PGE2-induced changes in EPSPs recorded from dentate granule neurons in response to perforant path stimulus (PP-DG) and CA1 pyramidal neurons in response to Schaffer collateral (SC-CA1) stimulus. EPSP amplitude was normalized as percentage of average baseline EPSP amplitude. Each point represents averages of three consecutive trials recorded. c, Mean potentiation of EPSP calculated by the average EPSP amplitude during 10 min application of PGE2 plotted as percentage of baseline at two synaptic responses. PGE2 significantly enhances the amplitude of EPSPs at both synapses (p<0.01). d, Mean ratios of PPF before and after PGE2. The PPR was calculated as P2/P1 (P1, the amplitude of the first EPSP; P2, the amplitude of the second EPSP). PGE2 significantly reduces PPR at PP-DG and SC-CA1 synapses (*p<0.05). e, Representative sweeps of mEPSCs in the absence or presence of PGE2 and washout. Miniature EPSPs were recorded in primary hippocampal neurons in culture from 10 to 15 DIV. The membrane potential was held at -70 mV. Bicuculline (10 μm) and TTX (0.5 μm) were included in the external solution. The synaptic events were analyzed using the MiniAnalysis program. f, Cumulative probability of mEPSC frequency in the absence or presence of PGE2 and washout. g, Mean percentage changes (normalized to the baseline) in the frequency of mEPSCs at 10 min after the application of PGE2. PGE2 significantly enhances the frequency of mEPSCs (p < 0.01). h, Cumulative probability of mEPSC amplitude in the absence or presence of PGE2 and washout. i, Mean percentage changes (normalized to the baseline) in the amplitude of mEPSCs in the presence of PGE2 and washout. j, Mean percentage changes in rise and decay time constants in the presence of PGE2 and washout. k, Time courses of PGE2-induced changes in frequency and amplitude of mEPSCs. l, The dose-response curve of PGE2-induced increase in the frequency of mEPSCs. Con, Control; Freq, frequency; Amp, amplitude; Base, baseline; wash, washout. Error bars represent SEM.
Figure 2.

PGE2 increases synaptic transmission in primary hippocampal neurons in culture with fewer glial astrocytes. a, Representative sweeps of mEPSCs in the absence or presence of PGE2 (5 μm) and washout. The proliferation of glial astrocytes was inhibited by treatment of hippocampal neurons in culture with Arac (10 μm) 24 h after plating. b, Cumulative probability of mEPSC frequency in the absence or presence of PGE2 and washout. c, Mean percentage changes in the frequency of mEPSCs at 10 min after the application of PGE2. PGE2 significantly enhances the frequency of mEPSCs (n = 6; p < 0.01). d, Cumulative probability of mEPSC amplitude in the absence or presence of PGE2 and washout. e, Mean percentage changes in the amplitude of mEPSCs in the presence of PGE2 and washout. f, Time courses of PGE2-induced changes in frequency and amplitude of mEPSCs. Base, Baseline; Wash, washout; Freq, frequency; Amp, amplitude. Error bars represent SEM.
COX-2 and microsomal PGE synthases are colocalized with PSD-95
Recently, we identified that EP1, EP2, and EP4 are localized in presynaptic terminals of hippocampal neurons (Zhu et al., 2005). Because COX-2 is expressed in postsynaptic dendrites (Kaufmann et al., 1996), it is possible that PGE2 may serve as retrograde messenger in hippocampal synaptic signaling. To confirm the presence of COX-2 in postsynaptic dendritic spines and to seek evidence that prostaglandin E synthases (PGES, cytosolic PGES, microsomal PGES-1 and -2) are also localized in dendritic spines, we performed a double immunostaining of COX-2, cPGES, and mPGES-1 and -2 using either PSD-95, a postsynaptic marker, or synaptophysin, a presynaptic marker, in processes of primary hippocampal neurons in culture. As shown in Figure 3, COX-2 is colocalized with PSD-95 but rarely with synaptophysin (data not shown). This information confirms that COX-2 is present in postsynaptic dendritic spines (Kaufmann et al., 1996). Interestingly, mPGES-1 and -2 are well merged with PSD-95, whereas cPGES is mainly expressed in cell soma (data not shown) and rarely is seen in the processes. This is in harmony with the notion that cPGES-1 is mainly associated with COX-1, whereas mPGES-1 is preferentially coupled with COX-2 and mPGES-2 is linked with both COX-1 and COX-2 (Claveau et al., 2003; Murakami et al., 2003; Murakami and Kudo, 2004). These results indicate that COX-2 and mPGES are present in dendritic spines, suggesting that the postsynaptic dendritic spines are a source for PGE2 synthesis.
Figure 3.

COX-2 and microsomal prostaglandin E synthases are localized in postsynaptic dendritic spines. a, Double immunostaining of COX-2 antibody with PSD-95 in primary hippocampal neurons in culture. Top, COX-2 (red), PSD-95 (green), and merge of COX-2 and PSD-95 images; bottom, enlarged COX-2, PSD-95, and merge of COX-2 and PSD-95 images. b, Double immunostaining of cPGES antibody with PSD-95. Top, cPGES (red), PSD-95, and merge of cPGES and PSD-95; bottom, enlarged cPGES, PSD-95, and merge. c, Double immunostaining of mPGES-1 antibody with PSD-95. Top, mPGES-1 (red), PSD-95, and merge of mPGES-1 and PSD-95; bottom, enlarged mPGES-1, PSD-95, and merge. d, Double immunostaining of mPGES-2 antibody with PSD-95. Top, mPGES-2 (red), PSD-95, and merge of mPGES-2 and PSD-95; bottom, enlarged mPGES-2, PSD-95, and merge. The images were taken with a Zeiss laser confocal microscope fitted with a 63× oil objective using LSM 510 Meta software. Scale bars, 5 μm.
EP2 agonist mimics the PGE2 effect
To define the functional role of EPs in PGE2-mediated synaptic signaling, we individually applied 17-P-PGE2, an EP1 agonist, butaprost, an EP2 agonist, and sulprostone, an EP3 agonist (at present there are no selective EP4 agonists commercially available). Application of 17-P-PGE2 (5 μm) or sulprostone (5 μm) did not significantly induce changes either in the frequency (102.4 ± 2% of baseline, n = 6; 105.7 ± 8.5% of baseline, n = 8, respectively) or amplitude (99.6 ± 2.3% of base-line; 100.2 ± 4.4% of baseline, respectively) of mEPSCs (Fig. 4b,d). However, butaprost (5 μm) produced a significant enhancement of the frequency of mEPSCs (340.5 ± 26.4% of baseline; n = 7; p < 0.01) (Fig. 4c) in primary hippocampal neurons in culture but not the amplitude (108.6 ± 3.5% of control; p > 0.05). To further examine PGE2 signaling in synaptic transmission in situ, we recorded EPSPs in CA1 pyramidal neurons in response to Schaffer collateral stimulus in hippocampal slices in the presence of these EP agonists. As shown in Figure 4a, EP1 and EP3 agonists did not induce a change in amplitude of EPSPs (98.0 ± 9 and 99.0 ± 9% of baseline, respectively), whereas the EP2 agonist significantly enhanced EPSP amplitude (157.0 ± 15% of baseline; p < 0.01), similar to the PGE2-induced response (Fig. 1), suggesting that EP1 and EP3 may not be involved in basal synaptic transmission. The results from EP agonist experiments thus furnished conceivable evidence that PGE2 increases synaptic transmission, and this enhancement may be mediated via the EP2 receptor.
Figure 4.
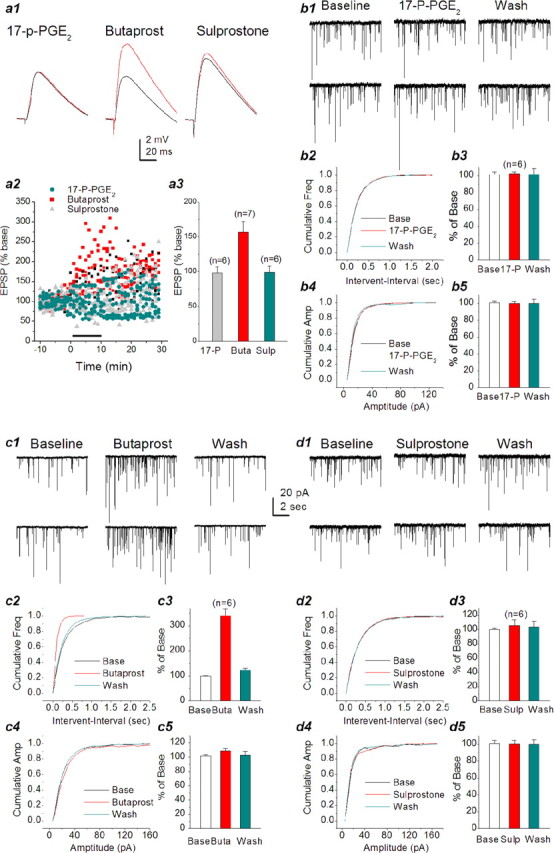
Activation of EP2 potentiates EPSPs and mEPSCs in hippocampal neurons. a1, Representative EPSP waveforms recorded in CA1 pyramidal neurons in response to Schaffer collateral stimulus at a frequency of 0.5 Hz in hippocampal slices in the absence or presence of 17-p-PGE2 (5 μm), butaprost (5 μm), or sulprostone (5 μm). a2, Time courses of EP receptor agonist-induced changes in EPSPs. a3, Mean potentiation of EPSP calculated by the average EPSP amplitude during 10 min application of EP agonists plotted as percentage of baseline. Butaprost significantly increases the amplitude of EPSPs (p < 0.01). b1, Representative sweeps of mEPSCs in the absence or presence of 17-p-PGE2 (5 μm) and washout. b2, Cumulative probability of mEPSC frequency in the absence or presence of 17-p-PGE2 and washout. b3, Mean percentage changes in the frequency of mEPSCs at 10 min after the application of 17-p-PGE2 and washout. b4, Cumulative probability of mEPSC amplitude in the absence or presence of 17-p-PGE2 and washout. b5, Mean percentage changes in the amplitude of mEPSCs at 10 min after the application of 17-p-PGE2 and washout. c1, Representative sweeps of mEPSCs in the absence or presence of butaprost (5 μm) and washout. c2, Cumulative probability of mEPSC frequency in the absence or presence of butaprost and wash. c3, Mean percentage changes in the frequency of mEPSCs at 10 min after the application of butaprost. EP2 agonist significantly augments the frequency of mEPSCs (p < 0.01). c4, Cumulative probability of mEPSC amplitude in the absence or presence of butaprost and washout. c5, Mean percentage changes in the amplitude of mEPSCs at 10 min after the application of butaprost. d1, Representative sweeps of mEPSCs in the absence or presence of sulprostone (5 μm) and washout. d2, Cumulative probability of mEPSC frequency in the absence or presence of sulprostone and washout. d3, Mean percentage changes in the frequency of mEPSCs at 10 min after the application of sulprostone. d4, Cumulative probability of mEPSC amplitude in the absence or presence of sulprostone and washout. d5, Mean percentage changes in the amplitude of mEPSCs at 10 min after the application of sulprostone. Wash, Washout; Base, baseline; Buta, butaprost; Sulp, sulprostone; Freq, frequency; Amp, amplitude. Error bars represent SEM.
Because EP2 and EP4 are linked to the Gs-cAMP/protein kinase A (PKA) pathway, we decided to use PKA inhibitors to examine whether the PGE2-induced response could be inhibited or attenuated (Fig. 5). First, we applied forskolin, an activator of adenylyl cyclase, which increases cAMP. Application of forskolin (20 μm) led to an increase in the frequency of mEPSCs to 196.8 ± 17.3% (n = 8) (supplemental Fig. 1, available at www.jneurosci.org as supplemental material). Then, we used H-89 and KT, relatively selective PKA inhibitors. Bath application of KT (1 μm) for 30 min significantly attenuated PGE2-induced increase in the frequency of mEPSCs (from 196.4 ± 11.3 to 140.7 ± 20.0%; n = 8; p < 0.05; one-way ANOVA) (Fig. 5a). Similarly, H-89 (1 μm) reduced the enhancement to 147.1 ± 11.9% (n = 19; p < 0.05; one-way ANOVA) (Fig. 5b). To determine whether application of PKA inhibitors alters basal synaptic transmission, we examined the effect of H-89 and KT on mEPSCs. We found that there were no significant differences in the frequency and amplitude of mEPSCs before and 20 min after application of H-89 or KT (data not shown). These data provided additional information that PGE2-enhanced synaptic is mediated via an EP2-Gs-cAMP/PKA pathway, although we cannot exclude the possible involvement of the EP4 receptor.
Figure 5.

PGE2-induced enhancement of synaptic transmission is mediated via a cAMP/PKA pathway. a1, Representative sweeps of mEPSCs in the absence or presence of PGE2 (5 μm) and washout recorded from a neuron pretreated with KT5720 (1 μm) for bath application at least 30 min. a2, Cumulative probability of mEPSC frequency in the absence or presence of PGE2 and PGE2 plus KT. a3, Mean percentage changes in the frequency of mEPSCs at 10 min after the application of PGE2 in neurons treated with KT. a4, Cumulative probability of mEPSC amplitude in the absence or presence of PGE2 and PGE2 plus KT. a5, Mean percentage changes in the amplitude of mEPSCs at 10 min after the application of PGE2 in neurons treated with KT. a6, Time courses of PGE2-induced changes in frequency and amplitude of mEPSCs in neurons treated with KT. KT significantly attenuates the PGE2-induced enhancement of the frequency of mEPSCs (p < 0.05). b1, Representative sweeps of mEPSCs in the absence or presence of PGE2 (5 μm) and washout recorded from a neuron pretreated with H-89 (1 μm) for bath application at least 30 min. b2, Cumulative probability of mEPSC frequency in the absence or presence of PGE2 and PGE2 plus H-89. a3, Mean percentage changes in the frequency of mEPSCs at 10 min after the application of PGE2 in neurons treated with H-89. a4, Cumulative probability of mEPSC amplitude in the absence or presence of PGE2 and PGE2 plus H-89. a5, Mean percentage changes in the amplitude of mEPSCs at 10 min after the application of PGE2 in neurons treated with H-89T. a6, Time courses of PGE2-induced changes in frequency and amplitude of mEPSCs in neurons treated with H-89. H-89 significantly attenuates the PGE2-induced enhancement of the frequency of mEPSCs (p < 0.05). Wash, Washout; H89, H-89; Cum, cumulative; Freq, frequency; Base, baseline; Amp, amplitude. Error bars represent SEM.
Elimination of the PGE2-induced presynaptic response by silencing EP2 gene expression
If the EP2 is the target of PGE2, then EP2 gene-expression silencing should eliminate or attenuate the PGE2-induced response. Therefore, we applied shRNA to primary hippocampal neurons in culture. For this purpose, we used the PGSU6-GFP plasmid (GeneSilencer shRNA Vectors kit; Gene Therapy Systems), which contains the human U6 RNA pol III promoter for the expression of shRNA and the CMV promoter carried with the GFP reporter gene for construction of the shRNA-encoding plasmids. These were generated by inserting annealed oligonucleotides (EP2 sense plus EP2 antisense) (supplemental Table 1, available at www.jneurosci.org as supplemental material) into GeneSilencer shRNA vectors between the BamHI and NotI restriction sites. The resultant plasmid that expressed shRNA targeting the EP2 (EP2-shRNA) was from three different oligonucleotides (number 1, nucleotides 495-513; number 2, nucleotides 593-611; and number 3, nucleotides 1438-1456; GenBank accession number, NM_008964). The plasmids were subjected to nucleotide sequencing for confirmation. For negative control plasmid, annealed oligonucleotides (luciferase sense and antisense; GeneSilencer shRNA Vectors kit, Gene Therapy Systems) were cloned into the vectors between the BamHI and NotI restriction sites (luciferase-shRNA). To test whether the EP2 gene was functionally targeted by the EP2-shRNA, real-time PCR and Western blot analyses were used to detect mRNA and protein in RAW264.7 macrophages (a cell line known to express EP2), where cells were transfected with the EP2-shRNA plasmids. A Lipofectamine 2000 kit (Invitrogen) was used to transfect the plasmid into RAW264.7 cells. Transfection efficiency was ∼70%. EP2-shRNA plasmid transfected into RAW264.7 cells significantly reduced expressions of both EP2 mRNA and protein (supplemental Fig. 2, available at www.jneurosci.org as supplemental material). Then, the shRNA-encoding plasmid was transfected into primary hippocampal neurons in culture using the calcium phosphate protocol (Xia et al., 1996). The recordings were made 72 h after the transfection in neurons synapsed with the neurons transfected with the plasmid containing shRNA targeting the EP2. Because we assumed that EP2 was presynaptically localized, neurons (not showing the GFP fluorescence) connected with three to four other neurons displaying GFP fluorescence were selected for recordings. Similar recordings were made in neurons connected with the neurons transfected with the luciferase-shRNA plasmid (negative control). As indicated in Figure 6b, application of PGE2 (5 μm) did not modify the frequency of mEPSCs (110.0 ± 11.3% of baseline; n = 10; p > 0.05) in neurons that connected with the neurons transfected with the EP2-shRNA plasmid, whereas PGE2 enhanced the frequency of mEPSCs (179.1 ± 27.9% of baseline; n = 6; p < 0.01) in neurons connected with neurons transfected with the luciferase-shRNA negative-control plasmid (Fig. 6a). In addition, EP2 knock-down was verified by immunostaining in neurons transfected with the EP2-shRNA and luciferase-shRNA plasmids (Fig. 6e,f).
Figure 6.

EP2 receptor silencing eliminates the PGE2-induced enhancement of synaptic transmission. a1, Representative sweeps of mEPSCs from hippocampal neurons transfected with the luciferase-shRNA plasmid (negative control) for 72 h in the absence or presence of PGE2 and washout. The recordings were made in neurons (not displaying GFP fluorescence) connected with three or four neurons that displayed GFP fluorescence. a2, Cumulative probability of mEPSC frequency in the absence or presence of PGE2 in neurons transfected with the luciferase-shRNA. a3, Mean percentage changes in the frequency of mEPSCs at 10 min after the application of PGE2 in neurons transfected with the luciferase-shRNA. a4, Cumulative probability of mEPSC amplitude in the absence or presence of PGE2 in neurons transfected with the luciferase-shRNA. a5, Mean percentage changes in the amplitude of mEPSCs at 10 min after the application of PGE2 in neurons transfected with the luciferase-shRNA. b1, Representative sweeps of mEPSCs from hippocampal neurons transfected with the EP2-shRNA plasmid for 72 h in the absence or presence of PGE2 and washout. The recordings were made in neurons (not displaying GFP fluorescence) connected with three or four neurons that displayed GFP fluorescence. b2, Cumulative probability of mEPSC frequency in the absence or presence of PGE2 in neurons transfected with the EP2-shRNA. b3, Mean percentage changes in the frequency of mEPSCs at 10 min after the application of PGE2 in neurons transfected with the EP2-shRNA. b4, Cumulative probability of mEPSC amplitude in the absence or presence of PGE2 in neurons transfected with the EP2-shRNA. b5, Mean percentage changes in the amplitude of mEPSCs at 10 min after the application of PGE2 in neurons transfected with the EP2-shRNA. c, Time courses of PGE2-induced changes in frequency and amplitude of mEPSCs in neurons transfected with luciferase-shRNA. d, Time courses of PGE2-induced changes in frequency and amplitude of mEPSCs in neurons transfected with EP2-shRNA. Reduction of EP2 expression through silencing EP2 gene expression diminishes the PGE2-induced increase in the frequency of mEPSCs. Error bars represent SEM. e, EP2 immunostaining in luciferase-shRNA (Luci-shRNA)-transfected neurons. EP2 is merged with GFP in neurons transfected with the luciferase-shRNA plasmid. f, EP2 immunostaining in EP2-shRNA-transfected neurons. EP2 rarely overlaps with the GFP in neurons transfected with the EP2-shRNA plasmid. Images were taken with a Zeiss deconvolution microscope using Slidebook 4.0 software with a magnification of 40×. Scalebars, 20 μm. Wash, Washout; Base, baseline; Freq, frequency; Amp, amplitude.
Because EP2 and EP4 couple with the Gs-AC-cAMP pathway and there are no reliable EP4 agonists available, we decided, therefore, to silence EP4 to define the involvement of EP4 in mediating PGE2-induced effect on basal synaptic transmission. Oligonucleotides (EP4 sense plus EP4 antisense) are shown in supplemental Table 2 (available at www.jneurosci.org as supplemental material). As shown in Figure 7b, application of PGE2 (5 μm) still significantly increased the frequency of mEPSCs in neurons transfected with the EP4-shRNA but not the amplitude, similar to that in neurons transfected with the luciferase-shRNA (Fig. 7a). There was no significant difference in the PGE2-induced increase in the frequency of mEPSCs between the EP4-shRNA (176.8 ± 7.9% of baseline; n = 10) and luciferase-shRNA (190.7 ± 11.9% of baseline; n = 10; p > 0.05). These data provided evidence that PGE2 acts on the presynaptic EP2 to increase the probability of glutamate release. Meanwhile, EP4 knock-down was verified by immunostaining in neurons transfected with the EP24-shRNA and luciferase-shRNA plasmids (Fig. 7c1,c2).
Figure 7.
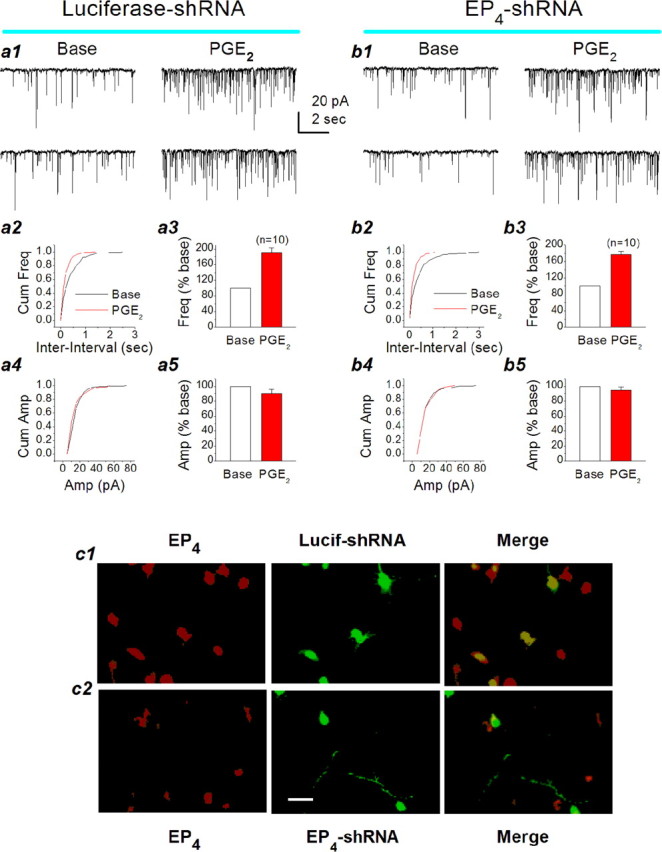
EP4 receptor silencing does not affect the PGE2-induced enhancement of synaptic transmission. a1, Representative sweeps of mEPSCs from hippocampal neurons transfected with the luciferase-shRNA plasmid (negative control) for 72 h in the absence or presence of PGE2. a2, Cumulative probability of mEPSC frequency in the absence or presence of PGE2 in neurons transfected with the luciferase-shRNA. a3, Mean percentage changes in the frequency of mEPSCs at 10 min after the application of PGE2 in neurons transfected with the luciferase-shRNA. a4, Cumulative probability of mEPSC amplitude in the absence or presence of PGE2 in neurons transfected with the luciferase-shRNA. a5, Mean percentage changes in the amplitude of mEPSCs at 10 min after the application of PGE2 in neurons transfected with the luciferase-shRNA. b1, Representative sweeps of mEPSCs from hippocampal neurons transfected with the EP4-shRNA plasmid for 72 h in the absence or presence of PGE2. b2, Cumulative probability of mEPSC frequency in the absence or presence of PGE2 in neurons transfected with the EP4-shRNA. b3, Mean percentage changes in the frequency of mEPSCs at 10 min after the application of PGE2 in neurons transfected with the EP4-shRNA. b4, Cumulative probability of mEPSC amplitude in the absence or presence of PGE2 in neurons transfected with the EP4-shRNA. b5, Mean percentage changes in the amplitude of mEPSCs at 10 min after the application of PGE2 in neurons transfected with the EP4-shRNA. Error bars represent SEM. c1, EP4 immunostaining in luciferase-shRNA (Lucif-shRNA)-transfected neurons. EP4 is merged with GFP in neurons transfected with the luciferase-shRNA plasmid. c2, EP4 immunostaining in EP4-shRNA-transfected neurons. EP4 rarely overlaps with the GFP in neurons transfected with the EP4-shRNA plasmid. **p< 0.01. Scale bar, 20 μm. Base, Baseline; Cum, cumulative; Freq, frequency; Amp, amplitude.
Interleukin-1β and LPS enhance synaptic transmission
If the hypothesis that PGE2 synthesized from the COX-2 pathway in dendritic spines functions as a retrograde messenger in synaptic signaling is correct, then an increase in the expression of COX-2 that increases production of PGE2 should enhance the synaptic transmission. To test this prediction, we treated neurons with interleukin-1β (IL-1β) or LPS, known COX-2 inducers. The expression of COX-2, cPGES, and mPGES-1 and -2 mRNAs was measured by real-time RT-PCR. Pretreatment with IL-1β (10 ng/ml) for 4 or 12 h, or LPS (1 μg/ml) for 24 or 48 h, potentiated the expression of COX-2 and mPGES-1 but not cPGES and only slightly increased mPGES-2 (Fig. 8c,d). These data demonstrate the concerted induction of COX-2 with mPGES-1. Because glial cells (microglial cells and astrocytes) in cultures without Arac were <2%, the extent of endothelial cells in our preparation was also at an undetectable level tested using von Willebrand factor, an endothelial cell marker. Thus, it is likely that the elevated expression of COX-2 and mPGES-1 may be mainly neuronal origin. Moreover, COX-2 inducers (Fig. 8a,b) enhanced the frequency of mEPSCs (179.1 ± 25.7% of baseline, n = 13, p < 0.01, treated with IL-1β for 6 h; 249.1 ± 41.0% of baseline, n = 7, p < 0.01, treated with LPS for 72 h). The IL-1β- or LPS-induced increase in the frequency of mEPSCs was inhibited in neurons pretreated with NS398 (20 μm), a selective COX-2 inhibitor (Chen et al., 2002; Chen and Bazan, 2005), for 4 h before recording (102.0 ± 14.9% of control, n = 9, treated with IL-1β for 6 h; 106.2 ± 18.0% of control, n = 11, treated with LPS for 72 h). Interestingly, LPS treatment did not alter the amplitude of mEPSCs (106.4 ± 18.6% of control) or rising and decay time constants (data not shown), whereas IL-1β significantly augmented the amplitude (126.7 ± 9.9% of control; p < 0.05) and decay time (167.1 ± 24.6% of control; p < 0.05) of mEPSCs. It is possible that IL-1β induces an alteration in postsynaptic glutamate receptor trafficking and increases the expression of postsynaptic glutamate receptors (Beattie et al., 2002; Stellwagen et al., 2005). Thus, increased expression of COX-2 and mPGES-1 enhances the synthesis of PGE2, which, after release, acts on the presynaptic EP2 receptor to stimulate the release of the neurotransmitter, thereby increasing the frequency of mEPSCs. To test whether there is a change in synthesis of PGE2 in neurons treated with COX-2 inducers or inhibitors, we measured PGE2 in mouse hippocampal tissue from animals that received LPS (3 mg/kg, i.p.) and in slices treated with NS398 (20 μm) using tandem LC-MS-MS-based lipidomic analysis as described previously (Marcheselli et al., 2003; Chen and Bazan, 2005a). As indicated in Figure 9, LPS significantly increased PGE2 and slightly elevated PGD2. On the other hand, NS398 significantly reduced the level of PGE2, whereas it had little effect on PGD2. We realized that glial and endothelial cells play an important role in induction of COX-2 expression and production of PGE2 during inflammation. Thus, when LPS was systemically administrated, glial and endothelial cells contributed significantly to the elevated level of PGE2 in hippocampal tissue from animals received LPS. These data provided additional evidence that PGE2 is derived mainly from the COX-2 pathway. A hypothetical cartoon illustrating COX-2-delivered PGE2 as a retrograde messenger in synaptic signaling is shown in supplemental Figure 3 (available at www.jneurosci.org as supplemental material).
Figure 8.

IL-1β or LPS increases hippocampal synaptic transmission. a1, Representative sweeps of mEPSCs recorded from control, LPS-, and LPS plus NS398-treated neurons. Neurons were treated with LPS (1 μg/ml) for 72 h. NS398 (20 μm) was added to cultures 4 h before recordings. a2, Cumulative probability of mEPSC frequency recorded from control, LPS-, and LPS plus NS398-treated neurons. a3, Mean percentage changes in the frequency of mEPSCs in LPS- and LPS plus NS398-treated neurons. LPS significantly increases the frequency of mEPSCs (p < 0.01), and the increase is blocked by NS398. a4, Cumulative probability of mEPSC amplitude recorded from control, LPS-, and LPS plus NS398-treated neurons. a5, Cumulative probability of mEPSC amplitude in LPS- and LPS plus NS398-treated neurons. b1, Representative sweeps of mEPSCs recorded from control, IL-1β-, and IL-1β plus NS398-treated neurons. Neurons were treated with IL-1β (10 ng/ml) for 16 h. NS398 (20 μm) was added into cultures 4 h before recordings. b2, Cumulative probability of mEPSC frequency recorded from control, IL-1β-, and IL-1β plus NS398-treated neurons. b3, Mean percentage changes in the frequency of mEPSCs in IL-1β- and IL-1β plus NS398-treated neurons. IL-1β significantly increases the frequency of mEPSCs (p < 0.01), and the increase is blocked by NS398. b4, Cumulative probability of mEPSC amplitude recorded from control, IL-1β-, and IL-1β plus NS398-treated neurons. b5, Mean percentage changes in the amplitude of mEPSC in IL-1β- and IL-1β plus NS398-treated neurons. IL-1β increases the amplitude of mEPSCs (p < 0.05). c, Real-time RT-PCR analysis of COX-2, cPGES, and mPGES-1 and -2 mRNA in LPS-treated (24 and 48 h) neurons. LPS (1 μg/ml) significantly increases expression of COX-2 and mPGES-1 (**p < 0.01; n = 3). LPS increases expression of mPGES-1 (*p < 0.05 in neurons treated with LPS for 12 h; **p < 0.01 in neurons treated with LPS for 24 h). d, Real-time RT-PCR analysis of COX-2, cPGES, and mPGES-1 and -2 mRNA in IL-1β-treated (4 and 12 h) neurons. IL-1β (10 ng/ml) significantly enhances expression of COX-2 and mPGES-1 (**p < 0.01; n = 3) and only slightly increases mPGES-2 (*p < 0.05). Results are from three independent cultures with duplicate wells. Freq, Frequency; Con, control; Amp, amplitude. Error bars represent SEM.
Figure 9.

LPS induces and COX-2 inhibitor blocks the synthesis of PGE2 in the hippocampus. a, b, Mass spectra of PGE2 and PGD2. m/z, mass/charge ratio. c, LPS elevates hippocampal PGE2. Mice were injected with LPS (3 mg/kg, i.p.) or vehicle (saline). Hippocampal PGE2 and PGD2 were determined at different time points (4 and 12 h) using tandem LC-MS-MS-based lipidomic analysis. Both PGE2 and PGD2 are elevated in animals that received LPS (p < 0.01 and p < 0.05; n = 4). d, NS398 reduces PGE2. Mouse hippocampal slices were pretreated with or without NS938 (20 μm) for 2 h. NS398 significantly reduced PGE2 (p < 0.01; n = 5), but it did not alter PGD2 (p > 0.05; n = 5). Error bars represent SEM.
Discussion
Our results reveal that postsynaptically synthesized PGE2 may serve as a retrograde messenger in synaptic transmission via a presynaptic EP2 receptor. This is supported by the following evidence: (1) the EP2 receptor is expressed in presynaptic terminals in hippocampal neurons (Zhu et al. 2005). (2) PGE2 increases the amplitude of EPSPs and reduces the PPR both at perforant path and Schaffer collateral synapses in hippocampal slices and enhances the frequency, but not the amplitude, of mEPSCs in hippocampal neurons in culture. These observations provide evidence that PGE2 increases the presynaptic probability of the release of the neurotransmitter glutamate. (3) An EP2 agonist mimics PGE2 actions, whereas EP1 or EP3 agonist does not elicit effects either on synaptic stimulus-evoked EPSPs or mEPSCs, and the PGE2-induced enhancement of the frequency of mEPSCs is attenuated by PKA inhibitors. (4) COX-2 and mPGES-1 and -2 are present in postsynaptic dendritic spines, suggesting that postsynaptic dendritic spines are the site of PGE2 synthesis. (5) Silencing EP2 gene expression, but not EP4, eliminates the PGE2-induced increase in the frequency of mEPSCs, confirming that EP2 mediates PGE2 signaling in synaptic transmission. (6) IL-1β and LPS enhance expression of COX-2 and mPGES-1, which produce PGE2, and augment the frequency of mEPSCs, and this enhancement is inhibited by a COX-2 inhibitor. These data demonstrate that the increased COX-2 expression causes enhanced production of PGE2, which in turn augments synaptic transmission via a presynaptic EP2-PKA pathway.
Three COX isozymes have been identified in brain (Vane, 1971; Kujubu et al., 1991; Hla and Neilson, 1992; O'Banion et al., 1992; Chandrasekharan et al., 2002) (for review, see Vane et al., 1998; Smith et al., 2000; Simmons et al., 2004). COX-1 is constitutively expressed in most tissues and is thought to mediate housekeeping functions. COX-3 is made from the COX-1 gene but retains intron 1. Thus, it is a COX-1 variant and the possible target of analgesic/antipyretic drugs such as acetaminophen. On the other hand, COX-2 expression is constitutive as well as inducible (Smith et al., 1996; Vane et al., 1998). The hippocampus expresses both forms of COX-2 (Vane et al., 1998). PGE2 is derived mainly through the initial conversion of AA by COX-2 (Yamagata et al., 1993; Brock et al., 1999; Chen et al., 2002; Vidensky et al., 2003; Chen and Bazan, 2005a). In the present study, we found that COX-2 and microsomal PGE synthases-1 and -2 are colocalized with PSD-95, indicating that postsynaptic dendritic spines are a site of PGE2 synthesis that in turn may be released to the synaptic cleft. In addition, IL-1β or LPS not only increases the expression of COX-2 but also significantly potentiates microsomal PGES-1. Colocalization of COX-2 and mPGES-1, the sequential biosynthetic enzymes for PGE2, in the same subcellular compartment (postsynaptic dendritic spines), allows efficient conversion of the short-lived, unstable substrate prostaglandin H2 (PGH2) to PGE2, indicating that PGE2 availability is tightly regulated by COX-2. Therefore, blockade of the microsomal PGES-1 may also reduce PGE2 production, particularly in conditions in which COX-2 expression and PGE2 are elevated (Murakami and Kudo, 2004).
Expression of G-protein-coupled EP1-4 receptors in hippocampus and their physiologic significance are not well understood (Zhu et al., 2005). All four EP1-4 receptors are heterogeneously expressed in the hippocampus. EP2 and EP4 are located at presynaptic terminals, in addition to their presence in paranuclear sites (Zhu et al., 2005). The present study shows that a presynaptic EP2 receptor may mediate PGE2 signaling at hippocampal synapses, whereas EP1 and EP3 may not be involved in the PGE2 modulation of basal synaptic transmission. However, the level of EP3 mRNA is significantly reduced in neurons treated with TTX or DNQX plus (+)-5-methyl-10,11-dihydro-5H-dibenzo
[a,d] cyclo-hepten-5,10-imine maleate (Zhu et al., 2005). EP3 is also the most abundant of the EPs in the hippocampus. Therefore, the role of EP3 in activity-dependent synaptic signaling cannot be ruled out. It is still not clear what functional role EP4 plays in synaptic transmission, because it is expressed at presynaptic terminals. Although we did not examine the effect of EP4 activation on synaptic transmission, EP4 expression level is relatively low in the hippocampus, and the decrease of EP4 expression through transient silencing of the EP4 gene did not significantly affect the PGE2-induced actions, suggesting that EP4 does not significantly contribute, if at all, to the PGE2 signaling in basal synaptic transmission. However, we cannot exclude the role of EP4 in mediating PGE2 signaling in activity-dependent events, such as occur in inflammation and synaptic plasticity. For instance, application of IL-1β or LPS increases EP2 and EP4 expression in brain (Zhang and Rivest, 1999). EP4 expression is enhanced in hippocampal neurons in culture exposed to IL-1β, high K+ (90 mm), or 4-AP and in hippocampal slices receiving HFS associated with LTP induction (Zhu et al., 2005).
Interestingly, we found that PGE2 significantly increases evoked EPSPs and the frequency of mEPSCs, whereas it slightly reduces the GABA receptor-mediated mIPSCs (including frequency and amplitude) in hippocampal neurons (data not shown). In rat spinal dorsal horn neurons, however, PGE2 decreases amplitudes of synaptic stimulus-evoked glycine receptor-mediated IPSCs and mIPSCs, whereas GABA-, AMPA-, and NMDA-receptor-mediated responses are unaffected (Ahmadi et al., 2002). The effect appears to be mediated via a postsynaptic EP2-like receptor. In addition, application of PGE2 produces a direct membrane depolarization through a postsynaptic EP2-like receptor in spinal dorsal horn neurons, whereas excitatory synaptic transmission remains unchanged (Baba et al., 2001). On the other hand, PGE2-produced inhibition of GABAergic synaptic transmission is attributed to presynaptic EP3-like receptors in rat supraoptic neurons (Ibrahim et al., 1999). These studies, together with our present observations, suggest a diversity of EP receptor distributions and functional roles of PGE2 in synaptic transmission.
RNA interference has become a powerful and widely used tool for the analysis of gene function in mammalian cells (Sharp, 2001; Meister and Tuschi, 2004; Mello and Conte, 2004). In the present study, we adopted the GeneSilencer shRNA vectors containing the U6 RNA polymerase III promoter and the CMV promoter carried with the GFP reporter gene, allowing optimal expression in a wide variety of cell types, including neurons, and easy determination of vector transfection efficiency and localization. Our results indicate that the decrease in EP2 expression through transfection with EP2-shRNA plasmid, silencing the EP2 gene, significantly reduces the level of mRNA and protein in RAW264.7macrophage cells (supplemental Fig. 1, available at www.jneurosci.org as supplemental material), and functionally eliminates PGE2-induced increase of the probability of release of the neurotransmitter. The recorded neurons mostly did not display green fluorescence, indicating that EP2 in these neurons remains intact. However, these neurons are synapsed with a few neurons transfected with the EP2-shRNA plasmid (showing the green fluorescence). We made similar recordings in luciferase-shRNA transfected cultures. PGE2 does not elicit significant changes either in the frequency or amplitude of mEPSCs in the EP2-shRNA-transfected cultures, whereas it does increase the frequency of mEPSCs in the luciferase-shRNA- and EP4-shRNA-transfected cultures, similar to that observed in normal cultures. This information provides evidence that the EP2-induced increase in synaptic activity is mediated via a presynaptic EP2 receptor.
Increasing evidence suggests that PGE2 and its receptors have multiple functions in the nervous system, including their roles in fever, pain, inflammation, sleep, regulation of membrane excitability, sexual behavior, and synaptic transmission, integration, and plasticity (Breyer et al., 2001; Chen et al., 2002; Amateau and McCarthy, 2004; Hayaishi and Huang, 2004; Murakami and Kudo, 2004; Simmons et al., 2004; Chen and Bazan, 2005a). A striking role of COX-2-derived PGE2 is in neuronal apoptosis and degenerative processes (Miettinen et al., 1997; Dubois et al., 1998; Nakayama et al., 1998; Ho et al., 1999; Hewett et al., 2000; Iadecola et al., 2001; McCullough et al., 2004). COX-2 expression or activity is enhanced in inflammatory and ischemic brain and in neurologic disorders such as epilepsy and Alzheimer's disease. Our previous studies demonstrate that PGE2, but not PGD2 or PGF2α, participates in hippocampal synaptic transmission and plasticity (Chen et al., 2002). This means that COX-2-derived PGE2 not only plays an important role as a messenger in synaptic physiology but also is involved in seizure and neurodegenerative diseases as a result of excessive activation of COX-2 and elevated PGE2. The results obtained from the present study indicate that PGE2 stimulates the release of the neurotransmitter glutamate. This may be one of the central mechanisms responsible for the neurodegeneration caused by enhanced COX-2 expression. Because COX-2 and mPGES are expressed in postsynaptic dendritic spines, the AA can be quickly converted to PGH2 and PGE2 (Bazan, 2003; Sun et al., 2004). In particular, both constitutive and inducible forms of COX-2 are present in dendritic spines. PGE2 derived from the constitutive COX-2 may dynamically regulate basal synaptic transmission, whereas PGE2 derived from the inducible COX-2 may contribute to activity-dependent synaptic plasticity, and, if COX-2 is overexpressed, to neurotoxicity. In addition, glial and endothelial cells are important cellular sources of PGE2 that contributes to neurodegenerative processes during inflammation. Therefore, our findings are relevant to understanding the roles of COX-2 and its derived PGE2 in synaptic physiology and raise an opportunity to explore mechanisms underlying neurologic disorders such as epilepsy and Alzheimer's disease.
Footnotes
This work was supported by United States Public Health Service Grant P20RR16816 from the Center of Biomedical Research Excellence Program, the National Center for Research Resources, the National Institutes of Health, and Alzheimer's Association Grant IIRG-05-13580.
Correspondence should be addressed to Dr. Chu Chen, Neuroscience Center of Excellence, Louisiana State University Health Sciences Center, 2020 Gravier Street, Suite D, New Orleans, LA 70112. E-mail: cchen@lsuhsc.edu.
Copyright © 2005 Society for Neuroscience 0270-6474/05/259858-13$15.00/0
References
- Ahmadi S, Lippross S, Neuhuber WL, Zeilhofer HU (2002) PGE2 selectively blocks inhibitory glycinergic neurotransmission onto rat superficial dorsal horn neurons. Nat Neurosci 5: 34-40. [DOI] [PubMed] [Google Scholar]
- Amateau SK, McCarthy MM (2004) Induction of PGE2 by estrodil mediates developmental masculinization of sex behavior. Nat Neurosci 7: 643-650. [DOI] [PubMed] [Google Scholar]
- Baba H, Kohno T, Moore KA, Woolf CJ (2001) Direct activation of rat spinal dorsal neurons by prostaglandin E2. J Neurosci 21: 1750-1756. [DOI] [PMC free article] [PubMed] [Google Scholar]
- Bazan NG (2001) COX-2 as a multifunctional neuronal modulator. Nat Med 7: 414-415. [DOI] [PubMed] [Google Scholar]
- Bazan NG (2003) Synaptic lipid signaling: significance of polyunsaturated fatty acids and platelet-activating factor. J Lipid Res 44: 2221-2233. [DOI] [PubMed] [Google Scholar]
- Bazan NG, Flower RJ (2002) Lipid signals in pain control. Nature 420: 135-138. [DOI] [PubMed] [Google Scholar]
- Beattie EC, Stellwagen D, Morishita W, Bresnahan JC, Ha BK, Zastrow MV, Beattie MS, Malenka RC (2002) Control of synaptic strength by glial TNFα. Science 295: 2282-2285. [DOI] [PubMed] [Google Scholar]
- Bezzi P, Carmignoto G, Pasti L, Vesce S, Rossi D, Rizzini BL, Pozzan T, Volterra A (1998) Prostaglandins stimulate calcium-dependent glutamate release in astrocytes. Nature 391: 281-285. [DOI] [PubMed] [Google Scholar]
- Boie Y, Stocco R, Sawyer N, Slipetz DM, Ungrin MD, Neuschäfer-Rube F, Puschel G, Metters KM, Abramovitz M (1997) Molecular cloning and characterization of the four rat prostaglandin E2 prostanoid receptor subtypes. Eur J Pharmacol 340: 227-241. [DOI] [PubMed] [Google Scholar]
- Breyer RM, Bagdassarian CK, Myers SA, Breyer MD (2001) Prostanoid receptors: subtypes and signaling. Annu Rev Pharmacol Toxicol 41: 661-690. [DOI] [PubMed] [Google Scholar]
- Brock TG, McNish RW, Peters-Golden M (1999) Arachidonic acid is preferentially metabolized by cyclooxygenase-2 to prostacyclin and prostaglandin E2 J Biol Chem 274: 11660-11666. [DOI] [PubMed] [Google Scholar]
- Caplen NJ, Mousses S (2003) Short interfering RNA (siRNA)-mediated RNA interference (RNAi) in human cells. Ann NY Acad Sci 1002: 56-62. [DOI] [PubMed] [Google Scholar]
- Chandrasekharan N, Dai H, Roos KLT, Evanson NK, Tomsik J, Elton TS, Simmons DL (2002) COX-3, a cyclooxygenase-1 variant inhibited by acetaminophen and other analgesic/antipyretic drugs: cloning, structure, and expression. Proc Natl Acad Sci USA 99: 13926-13931. [DOI] [PMC free article] [PubMed] [Google Scholar]
- Chen C (2004) ZD7288 inhibits postsynaptic glutamate receptor-mediated responses at hippocampal perforant path-granule cell synapses. Eur J Neurosci 19: 643-649. [DOI] [PubMed] [Google Scholar]
- Chen C, Bazan NG (1999) Platelet-activating factor inhibits ionotropic GABA receptor activity in cultured hippocampal neurons. NeuroReport 10: 3831-3835. [DOI] [PubMed] [Google Scholar]
- Chen C, Bazan NG (2005a) Endogenous PGE2 regulates membrane excitability and synaptic transmission in hippocampal CA1 pyramidal neurons. J Neurophysiol 93: 929-941. [DOI] [PubMed] [Google Scholar]
- Chen C, Bazan NG (2005b) Lipid signaling: sleep, synaptic plasticity, and neuroprotection. Prostaglandins Other Lipid Mediat 77: 65-76. [DOI] [PubMed] [Google Scholar]
- Chen C, Magee JC, Marcheselli V, Hardy M, Bazan NG (2001) Attenuated long-term potentiation in hippocampal dentate gyrus neurons of mice deficient in the platelet-activating factor receptor. J Neurophysiol 85: 384-390. [DOI] [PubMed] [Google Scholar]
- Chen C, Magee JC, Bazan NG (2002) Cyclooxygenase-2 regulates prostaglandin E2 signaling in hippocampal long-term synaptic plasticity. J Neurophysiol 87: 2851-2857. [DOI] [PubMed] [Google Scholar]
- Claveau D, Sirinyan M, Guay J, Gordon R, Chan C-C, Bureau Y, Riendeau D, Mancini JA (2003) Microsomal prostaglandin E synthase-1 is a major terminal synthase that is selectively up-regulated during cyclooxygenases-2-dependent prostaglandin E2 production in the rat adjuvant-induced arthritis model. J Immunol 170: 4738-4744. [DOI] [PubMed] [Google Scholar]
- Dubois RN, Abramson SB, Crofford L, Gupta RA, Simon LS, Van de Putte LBA, Lipsky PE (1998) Cyclooxygenase in biology and disease. FASEB J 12: 1063-1073. [PubMed] [Google Scholar]
- Hayaishi O, Huang ZL (2004) Role of orexin and PGE(2) in activating histaminergic neurotransmission. Drug News Perspect 17: 105-109. [DOI] [PubMed] [Google Scholar]
- Hewett S, Uliasz TF, Vidwans AS, Hewett JA (2000) Cyclooxygenase-2 contributes to N-methyl-d-aspartate-mediated neuronal cell death in primary cortical cell culture. J Pharmacol Exp Ther 293: 417-425. [PubMed] [Google Scholar]
- Hla T, Neilson K (1992) Human cyclooxygenases-2 cDNA. Proc Natl Acad Sci USA 89: 7384-7388. [DOI] [PMC free article] [PubMed] [Google Scholar]
- Ho L, Pieroni C, Winger D, Purohit DP, Aisen PS, Pasinetti GM (1999) Regional distribution of cyclooxygenase-2 in the hippocampal formation in Alzheimer's disease. J Neurosci Res 57: 295-303. [DOI] [PubMed] [Google Scholar]
- Iadecola C, Niwa K, Nogawa S, Zhao X, Nagayama M, Araki E, Morham S, Ross ME (2001) Reduced susceptibility to ischemic brain injury and N-methyl-d-aspartate-mediated neurotoxicity in cyclooxygenase-2 deficient mice. Proc Natl Acad Sci USA 98: 1294-1299. [DOI] [PMC free article] [PubMed] [Google Scholar]
- Ibrahim N, Shibuya I, Kabashima N, Sutarmo S, Ueta Y, Yamashita H (1999) Prostaglandin E2 inhibits spontaneous inhibitory postsynaptic currents in rat supraoptic neurons via presynaptic receptors. J Neuroendocrinol 11: 879-886. [DOI] [PubMed] [Google Scholar]
- Kaufmann WE, Worley PF, Pegg J, Bremer M, Isakson P (1996) COX-2, a synaptically induced enzyme, is expressed by excitatory neurons at postsynaptic sites in rat cerebral cortex. Proc Natl Acad Sci USA 93: 2317-2321. [DOI] [PMC free article] [PubMed] [Google Scholar]
- Kujubu DA, Fletcher BS, Varnum BC, Lim RW, Herschman HR (1991) TIS 10, a phorbol ester tumor promoter-inducible mRNA from Swiss 3T3 cells, encodes a novel prostaglandin synthase/cyclooxygenase homologue. J Biol Chem 266: 12866-12872. [PubMed] [Google Scholar]
- Marcheselli VL, Hong S, Lukiw WJ, Tian XH, Gronert K, Musto A, Hardy M, Gimenez JM, Chiang N, Serhan CN, Bazan NG (2003) Novel docosanoids inhibits brain ischemia-reperfusion-mediated leukocyte infiltration and pro-inflammatory gene expression. J Biol Chem 278: 43807-43817. [DOI] [PubMed] [Google Scholar]
- McCullough L, Wu L, Haughey N, Liang X, Hand T, Wang Q, Breyer RM, Andreasson K (2004) Neuroprotective function of the PGE2 EP2 receptor in cerebral ischemia. J Neurosci 24: 257-266. [DOI] [PMC free article] [PubMed] [Google Scholar]
- Meister G, Tuschi T (2004) Mechanisms of gene silencing by double-stranded RNA. Nature 431: 343-349. [DOI] [PubMed] [Google Scholar]
- Mello CC, Conte D (2004) Revealing the world of RNA interference. Nature 431: 338-342. [DOI] [PubMed] [Google Scholar]
- Miettinen S, Fusco FR, Yrjänheikki J, Keinänen R, Hirvonen T, Roivainen R, Närhi M, Hökfelt T, Koistinaho J (1997) Spreading depression and focal brain ischemia induce cyclooxygenase-2 in cortical neurons through N-methyl-d-aspartic acid-receptors and phospholipase A2 Proc Natl Acad Sci USA 94: 6500-6505. [DOI] [PMC free article] [PubMed] [Google Scholar]
- Murakami M, Kudo I (2004) Recent advance in molecular biology and physiology of the prostaglandin E2-biosynthetic pathway. Prog Lipid Res 43: 3-35. [DOI] [PubMed] [Google Scholar]
- Murakami M, Nakashima K, Kamei D, Masuda S, Ishikawa Y, Ishii T, Ohmiya Y, Watanabe K, Kudo I (2003) Cellular prostaglandin E2 production by membrane-bound prostaglandin E synthase-2 via both cyclooxygenases-1 and -2. J Biol Chem 278: 37937-37947. [DOI] [PubMed] [Google Scholar]
- Nakayama M, Uchimura K, Zhu RL, Nagayama T, Rose ME, Stetler RA, Isakson PC, Chen J, Graham SH (1998) Cyclooxygenase-2 inhibition prevents delayed death of CA1 hippocampal neurons following global ischemia. Proc Natl Acad Sci USA 95: 10954-10959. [DOI] [PMC free article] [PubMed] [Google Scholar]
- Narumiya S, Sugimoto Y, Ushikubi F (1999) Prostanoid receptors: structure, properties, and functions. Physiol Rev 79: 1193-1226. [DOI] [PubMed] [Google Scholar]
- O'Banion MK, Winn V, Young DA (1992) cDNA cloning and functional activity of a glucocorticoid-regulated inflammatory cyclooxygenase. Proc Natl Acad Sci USA 89: 4888-4892. [DOI] [PMC free article] [PubMed] [Google Scholar]
- Sharp PA (2001) RNA interference-2001. Genes Dev 15: 485-490. [DOI] [PubMed] [Google Scholar]
- Simmons D, Botting RM, Hla T (2004) Cyclooxygenase isozymes: the biology of prostaglandin synthesis and inhibition. Pharmacol Rev 56: 387-437. [DOI] [PubMed] [Google Scholar]
- Smith WL, Garavito RM, DeWitt DL (1996) Prostaglandin endoperoxide H synthases (cyclooxygenase)-1 and -2. J Biol Chem 271: 33157-33160. [DOI] [PubMed] [Google Scholar]
- Smith WL, DeWitt DL, Garavito RM (2000) Cyclooxygenases: structural, cellular and molecular biology. Annu Rev Biochem 69: 145-182. [DOI] [PubMed] [Google Scholar]
- Stellwagen D, Beattie E, Seo JY, Malenka RC (2005) Differential regulation of AMPA receptor and GABA receptor trafficking by tumor necrosis factor-α. J Neurosci 25: 3219-3228. [DOI] [PMC free article] [PubMed] [Google Scholar]
- Sun GY, Xu J, Jensen MD, Simonyi A (2004) Phospholipase A2 in the central nervous system: implications for neurodegenerative diseases. J Lipid Res 45: 205-213. [DOI] [PubMed] [Google Scholar]
- Vane JR (1971) Inhibition of prostaglandin synthesis as a mechanism of action for aspirin-like drugs. Nature 231: 232-235. [DOI] [PubMed] [Google Scholar]
- Vane JR, Bakhle YS, Botting RM (1998) Cyclooxygenase 1 and 2. Annu Rev Pharmacol Toxicol 38: 97-120. [DOI] [PubMed] [Google Scholar]
- Vidensky S, Zhang Y, Hand T, Goellner J, Shaffer A, Isakson P, Andreasson K (2003) Neuronal overexpression of COX-2 results in dominant production of PGE2 and altered fever response. Neuromolecular Med 3: 15-27. [DOI] [PubMed] [Google Scholar]
- Xia Z, Dudek H, Miranti CK, Greenberg ME (1996) Calcium influx via the NMDA receptor induced immediate early gene transcription by a MAP kinase/ERK-dependent mechanism. J Neurosci 16: 5425-5436. [DOI] [PMC free article] [PubMed] [Google Scholar]
- Yamagata K, Andreasson KI, Kaufmann WE, Barnes CA, Worley PF (1993) Expression of a mitogen-inducible cyclooxygenase in brain neurons: regulation by synaptic activity and glucocorticoids. Neuron 11: 371-386. [DOI] [PubMed] [Google Scholar]
- Zhang J, Rivest S (1999) Distribution, regulation and colocalization of the genes encoding the EP2- and EP4-PGE2 receptors in the rat brain and neuronal responses to systemic inflammation. Eur J Neurosci 11: 2651-2668. [DOI] [PubMed] [Google Scholar]
- Zhu P, Genc A, Zhang X, Zhang J, Bazan NG, Chen C (2005) Heterogeneous expression and regulation of PGE2 receptors in the hippocampus. J Neurosci Res 81: 817-826. [DOI] [PubMed] [Google Scholar]
- Zucker RS (1989) Short-term synaptic plasticity. Annu Rev Neurosci 12: 13-31. [DOI] [PubMed] [Google Scholar]