

Abstract
Microarray analysis of oligodendrocyte lineage cells purified by fluorescence-activated cell sorting (FACS) from 2′,3′-cyclic nucleotide 3′-phosphodiesterase (CNP)–enhanced green fluorescent protein (EGFP) transgenic mice revealed Sox17 (SRY-box containing gene 17) gene expression to be coordinately regulated with that of four myelin genes during postnatal development. In CNP–EGFP-positive (CNP–EGFP+) cells, Sox17 mRNA and protein levels transiently increased between postnatal days 2 and 15, with white matter O4+ preoligodendrocytes expressing greater Sox17 levels than Nkx2.2+ (NK2 transcription factor related, locus 2) NG2+, or GalC+ (galactocerebroside) cells. In spinal cord, Sox17 protein expression was undetectable in the primary motor neuron domain between embryonic days 12.5 and 15.5 but was evident in Nkx2.2+ and CC1+ cells. In cultured oligodendrocyte progenitor cells (OPCs), Sox17 levels were maximal in O4+ cells and peaked during the phenotypic conversion from bipolar to multipolar. Parallel increases in Sox17 and p27 occurred before MBP protein expression, and Sox17 upregulation was prevented by conditions inhibiting differentiation. Sox17 downregulation with small interfering RNAs increased OPC proliferation and decreased lineage progression after mitogen withdrawal, whereas Sox17 overexpression in the presence of mitogen had opposite effects. Sox17 overexpression enhanced myelin gene expression in OPCs and directly stimulated MBP gene promoter activity. These findings support important roles for Sox17 in controlling both oligodendrocyte progenitor cell cycle exit and differentiation.
Keywords: gene profiling, cell lineage, CNP–EGFP mouse, cell cycle, myelin genes, cell differentiation
Introduction
Oligodendrocyte progenitor cells (OPCs) arise from ventricular zones (VZs) of the embryonic spinal cord (Rowitch, 2004; Vallstedt et al., 2005) and the ganglionic eminences of the embryonic forebrain (Kessaris et al., 2006). In the postnatal forebrain, the VZ and subventricular zones generate OPCs, which differentiate to myelinate axons (Rogister et al., 1999; Noble, 2000; Miller, 2002; Aguirre and Gallo, 2004; Richardson et al., 2006). Oligodendrocyte maturation is a continuum of events requiring the synchronized and timely expression of numerous genes that coordinate each phase of OPC development (Baumann and Pham-Dinh, 2001; Miller, 2002).
Critical steps in the regulation of OPC development are timing of cell cycle arrest, exit, and initiation of differentiation (Casaccia-Bonnefil and Liu, 2003). Previous studies have identified the G1-to-S transition, the cyclin E/cdk2 (cyclin-dependent kinase) complex, and the cyclin-dependent kinase inhibitors p27 and p21 as crucial regulators of OPC proliferation (Casaccia-Bonnefil et al., 1999; Ghiani et al., 1999a,b; Ghiani and Gallo, 2001; Belachew et al., 2002). In contrast with molecular mechanisms that regulate OPC proliferation, the intrinsic factors involved in OPC differentiation remain elusive, and little is known about the relationship between cell cycle-related pathways and oligodendroglial differentiation (Tokumoto et al., 1999, 2001, 2002; Zezula et al., 2001; Huang et al., 2002). Although cell cycle withdrawal is required for OPC differentiation, it is by itself insufficient to initiate OPC maturation and myelination (Casaccia-Bonnefil et al., 1999). The control of OP maturation must involve additional intracellular factors that operate between cell cycle exit and differentiation.
Oligodendrocyte development is regulated by chromatin conformation and gene transcription (Hudson, 2001; Marin-Husstege et al., 2002; Shen et al., 2005). A growing list of transcription factors with roles in neural cell maturation is being identified in cells of the oligodendrocyte lineage, but only a limited subset of these factors has been functionally analyzed to define their role in OP development (Wegner, 2000, 2001; Hudson, 2001; Stolt et al., 2002, 2004, 2005). Novel and potentially important oligodendrocyte transcription factors whose expression is not restricted to the oligodendrocyte lineage may have eluded detection and identification in vivo because of the cellular heterogeneity of the brain and technical difficulties in isolating selected cell types. To overcome these obstacles, we generated a transgenic mouse in which expression of the enhanced green fluorescent protein (EGFP) was targeted to oligodendrocyte lineage cells by the 2′,3′-cyclic nucleotide 3′-phosphodiesterase (CNP) gene promoter (Yuan et al., 2002). In these mice, EGFP-positive (EGFP+) oligodendrocytes can be effectively and reliably purified from dissociated brain tissue at different prenatal and postnatal developmental stages (Belachew et al., 2002, 2003; Yuan et al., 2002).
In this study, we sought to identify new transcription factors that regulate cell cycle exit and/or initiation of differentiation in OP cells. We used microarray analysis to first establish a developmental gene expression profile of oligodendrocytes ex vivo by isolating RNA from EGFP+ cells fluorescence-activated cell sorting (FACS) purified from CNP–EGFP mouse brains at different postnatal developmental stages. We hypothesized that transcription factors with a potential role in OP maturation would (1) be expressed and developmentally regulated in oligodendrocyte lineage cells, and (2) display an expression profile that clustered with that of myelin genes. Using this approach, we selected Sox17 (SRY-box containing gene 17) (Kanai et al., 1996), which is expressed at its highest levels during early phases of myelination. We correlated Sox17 expression with developmental processes that occur during OPC lineage progression and tested the functional effects of modulating Sox17 expression on cell proliferation and differentiation. Our observations are consistent with dual roles for Sox17 in OPC cell cycle control and maturation.
Materials and Methods
Antibodies.
The following antibodies were used: NG2 (1:1000; Chemicon, Temecula, CA), A2B5, O4, and O1 (1:10 on cultures or 1:50 on sections; all from American Type Culture Collection, Manassas, VA), LB1 (1:10; Dr Giulio Levi, Istituto Superiore di Sanita, Rome, Italy) (Levi et al., 1986), anti-Nkx2.2 (NK2 transcription factor related, locus 2) (1:25; Developmental Studies Hybridoma Bank, University of Iowa, Iowa City, IA), anti-GFAP (1:500; Sigma, St. Louis, MO), anti-neuronal-specific nuclear protein (NeuN) (1:500; Chemicon), anti-Olig2 (1:100,000; Dr. David Rowitch, Dana-Farber Cancer Institute, Boston, MA), anti-CNP (1:500; Covance/Sternberger Monoclonals, Lutherville, MD), anti-galactocerebroside (GalC) (1:50; Chemicon), anti-bromodeoxyuridine (BrdU) (1:20; DakoCytomation, Carpinteria, CA), anti-Ki67 (1:500; Novocastra Lab, Newcastle, UK), anti-active caspase-3 (1:500; Cell Signaling Technology, Beverly, MA), anti-p27 (1:500; Santa Cruz Biotechnology, Santa Cruz, CA), anti-myelin basic protein (MBP) (1:500; Sternberger Monoclonals), and anti-GFP (1:1000; Chemicon). The anti-Sox17 antibody was an anti-recombinant Sox17 antiserum (Kanai et al., 1996) and was used at 1:6,000 (Kanai-Azuma et al., 2002). The specificity of this antiserum was confirmed by performing (1) immunoblotting on the protein extracts of COS cells transfected with pCDM/Sox17 and (2) immunostaining on COS cells and rodent adult testis tissue sections (Kanai et al., 1996). A band corresponding to Sox17 and nuclear localization were detected in Western blot and immunofluorescence analysis, respectively (Kanai et al., 1996). In immunofluorescence, the Sox17 signal was abolished by coincubation of antiserum with the immunogen (glutathione S-transferase–Sox17) (Kanai et al., 1996). In addition, Western blotting of COS7 cells transiently transfected with cytomegalovirus (CMV)–Sox17 or CMV5Sox10 expression plasmids showed no difference between our antibody and the R & D Systems (Minneapolis, MN) anti-human Sox17 antibody in specifically detecting a 60–70 kDa band (supplemental Fig. S1A, available at www.jneurosci.org as supplemental material). These antibodies did not cross-react with Sox10 (supplemental Fig. S1A, available at www.jneurosci.org as supplemental material), which is detected as a 50 kDa band. Furthermore, both anti-Sox17 antibodies showed very similar immunohistochemical staining in postnatal day 5 (P5) mouse spinal cord white matter (supplemental Fig. S1B,C, available at www.jneurosci.org as supplemental material).
Transgenic mice.
The CNP–EGFP transgenic mice have been described previously (Yuan et al., 2002; Belachew et al., 2003; Aguirre et al., 2004). All animal procedures were performed according to the Institutional Animal Care and Use Committee, Children's National Medical Center, and National Institutes of Health guidelines.
Fluorescence-activated cell sorting.
Brain tissue dissociation and FACS procedures were as described previously (Belachew et al., 2003; Aguirre et al., 2004).
Immunocytochemistry and cell counting in FACS-purified cells.
FACS-purified cells were plated on poly-lysine-coated (5 μg/ml) 12 mm glass coverslips at a density of 30,000 cells per coverslip and stained 1 h after plating with NG2, O4, and O1 antibodies as described previously (Yuan et al., 2002; Belachew et al., 2003). After staining, images were acquired using a 40× objective, and an average of 20–35 microscopic fields were counted. The number of total cells counted ranged between 420 and 1150.
Cell cultures.
Purified rat cortical OPC cultures were prepared as previously described from embryonic day 20 (E20) Sprague Dawley rats, using a standard experimental protocol (McCarthy and de Vellis, 1980) with slight modifications (Ghiani et al., 1999a,b). OP cells were plated at a density of 200,000 cells per dish on poly-ornithine-coated 30 mm plastic Petri dishes and cultured in Dulbecco's modified Eagle's DME–N1 supplemented with 10 ng/ml platelet-derived growth factor (PDGF) (human AB, heterodimer form; Upstate Biotechnology, Lake Placid, NY), unless otherwise stated.
mRNA expression profiling.
Approximately 1 million of FACS-isolated CNP–EGFP+ cells were homogenized in RNeasy lysis buffer (Qiagen, Valencia, CA). Total RNA was extracted following the standard protocol of RNeasy Mini kit (Qiagen). DNA was digested with DNase I (Ambion, Austin, TX), followed by clean-up using RNeasy Mini kit. Double-stranded cDNA was synthesized from 0.3 μg of total RNA with an oligo-dT primer containing T7 RNA polymerase promoter (Geneset, La Jolla, CA) and SuperScript Choice system (Invitrogen, Carlsbad, CA). After purification by ethanol precipitation, the double-stranded cDNA was resuspended in 8 μl of DEPC H2O. First-round cRNA was synthesized from double-stranded cDNA by in vitro transcription using a MEGAscript T7 transcription kit (Ambion). A portion (0.2 μg) of purified cRNA was subjected to a second round of cDNA synthesis using a random pd(N6) primer (Roche, Indianapolis, IN) to synthesize the first-strand cDNA and a T7-(dT)24 primer for the second-strand cDNA. The resulting double-stranded cDNA was purified via a phase lock gel (Brinkman Instrument, Westbury, NY), followed by ethanol precipitation. Biotinylated cRNA was produced by in vitro transcription using BioArray HighYield RNA Transcript Labeling Kit (Enzo, New York, NY). Second-round cRNA was purified and then fragmented. Biotinylated cRNA (15 μg) was hybridized to murine U74Av2 oligonucleotide microarray (12,488 probe sets; Affymetrix, Santa Clara, CA), and signal intensity was calculated using Affymetrix GeneChip software MAS 5.0 as described previously (Natale et al., 2003). Each microarray underwent a stringent quality control evaluation as reported previously (Natale et al., 2003). All values obtained from the microarrays in this experiment fell within the quality control range, including the following: cRNA fold change from two rounds of amplification ranged from 400- to 700-fold, scaling factors ranged from 0.4 to 0.9, percentage of probe sets reliably detected (“present”) ranged from 42 to 50%, mean signal value indicating the relative abundance of a probe set ranged from 1700 to 2200, and correlation coefficient of mean signal values for each transcript between microarrays at the same experimental time point ranged from 0.92 to 0.98.
Data filtering and statistical analysis.
As described previously, all analyses of mRNA expression is based on the subset of probe sets detected (present) on at least one of the eight total microarrays used in this experiment (Di Giovanni et al., 2003; Natale et al., 2004). The levels for signal sensitivity detection and signal-to-noise ratio are optimized for each project (Tumor Analysis Best Practices Working Group, 2004). Based on the known timing of oligodendrocyte development, we designed our study to examine oligodendrocyte mRNA expression at four key time points: P2, P8, P15, and P30. However, because developmentally regulated genes may be reliably expressed at only one of these selected stages, a less stringent data-filtering strategy was chosen, which provides the more important benefit of identifying genes that are significantly regulated at one stage despite increasing the number of falsely positive regulated genes. Experiment normalization and statistical analysis were performed using GeneSpring software, version 5.0 (Silicon Genetics, Redwood, CA). Signal intensity for each probe set was normalized to the median intensity across all chips in the experiment.
Immunohistochemistry and confocal microscopy.
Freshly cut, floating tissue sections (50 μm) from P15 CNP–EGFP transgenic mice were prepared as described previously (Yuan et al., 2002; Aguirre et al., 2004). Briefly, sections were incubated for 1 h at room temperature with blocking solution (10% normal goat serum, 1% bovine serum albumin, and 0.3% Tween 20 in 1× PBS, pH 7.4) and then incubated at 4°C overnight with primary antibody. Sections were washed with carrier solution (1% normal goat serum, 1% bovine serum albumin, and 0.3% Tween 20 in 1× PBS, pH 7.4) and then incubated for 1 h at room temperature with secondary antibody (goat anti-rabbit). Slices were washed with carrier solution before mounting in Mowiol. For analysis in tissue sections, a Bio-Rad (Hercules, CA) VMRC 1024 confocal laser-scanning microscope equipped with a krypton–argon laser and an Olympus Optical (Melville, NY) IX-70 inverted microscope were used to image localization of FITC (488 nm laser line excitation; 522/35 emission filter), Texas Red (568 nm excitation; 605/32 emission filter), or cyanine 5 (647 excitation; 680/32 emission filter). Optical sections (Z = 0.5 μm) of confocal epifluorescence images were sequentially acquired using a 40× [numerical aperture (NA) of 1.35], a 60× (NA of 1.40), or a 100× (NA of 1.35) oil objective with Bio-Rad LaserSharp version 3.2 software. Confocal Assistant 4.02 and NIH ImageJ1.26t (http://rsb.info.nih.gov) software were subsequently used to merge images and to perform orthogonal studies, respectively. Merged images were processed in Photoshop 7.0 (Adobe Systems, San Jose, CA) with minimal manipulation of contrast.
Fluorescence intensity or luminosity was determined by drawing a region (box) around an Nkx2.2+, O4+, or CNP+ cell body and measuring the mean luminosity value from the Histogram command in the Image pull-down menu of Adobe Photoshop or NIH ImageJ software. Cell processes were not included, and the whole cell body was taken, regardless of Sox17 distribution. The histogram feature calculates the average luminosity levels and SD of the pixels in the selected field. Recording and analysis of the digital images were performed with fixed settings. Background values taken from unlabeled areas were subtracted from Sox17 values for every section or field analyzed and averaged in each case to control for staining variation. Six separate sections were analyzed for each case, and SigmaStat software (Systat Software, Point Richmond, CA) was used for statistical analysis, using Student's t test to determine significance levels. Values were expressed relative to Sox17 readings in Nkx2.2+ cells. For cell counting of endogenous EGFP+ cells in P15 subcortical white matter (SCWM), we determined that 100% of the EGFP+ cells were Olig2+, confirming that cells being analyzed belonged to the OPC lineage. The analysis of the SCWM was performed on coronal sections. An average of four to five sections from three different brains (9–12 sections total) were counted for the SCWM to obtain an estimate of the total number of EGFP+ cells. The anatomical distribution of CNP–EGFP+ cells was analyzed in Z-series confocal scanning images [20–30 μm thickness; step size of 0.5 μm between successive images of the same field (228 μm2)]. Cell counting data in tissue sections was expressed as averages ± SEM. Statistical analysis was performed by paired t test.
For immunocytochemical analysis of Sox17 in spinal cord, embryos between days 8.5 and 16.5 (days of vaginal plug was designated as day 0.5) were dissected in cold PBS and fixed in 4% paraformaldehyde (PFA) overnight. For postnatal stages P0–P5, animals were perfused with 4% PFA. Spinal cords were dissected, cryoprotected in 20% sucrose overnight, and embedded in TissueTek OCT compound (Sakura, Tokyo, Japan) according to standard protocols. Coronal cryostat sections (10–12 μm thickness) were performed using a Reichert-Jung cryostat (Leica, Nussloch, Germany) and collected on Superfrost plus slides. For immunohistochemistry, slides were rehydrated in PBS with 0.1% Triton X-100 and 10% v/v normal goat serum for 1 h at room temperature before incubation with the following primary antibodies: rabbit polyclonal anti-EGFP (1:400; Invitrogen) for studies with the CNP–EGFP transgenic mice, mouse monoclonal anti-adenomatous polyposis coli (APC) (1:200, clone CC1, antibody 7, 1:200; Oncogene Sciences, Uniondale, NY), mouse monoclonal anti-Nkx2.2 (1:2; Developmental Studies Hybridoma Bank), and rabbit polyclonal anti-Sox17 (Kanai et al., 1996) (1:500) or goat polyclonal anti-Sox17 (R & D Systems). The sections were incubated with primary antibodies diluted in PBS, 10% v/v normal goat serum, and 0.1% Triton X-100 overnight at room temperature. Subsequently, the sections were washed three times for 5 min in PBS and incubated with adequate volumes of secondary antibodies diluted in PBS with 10% normal goat serum for 2 h at room temperature. During incubation with secondary antibodies, cell nuclei were labeled with bisbenzimide (diluted 1:105; Sigma). After three additional washes in PBS, the sections were mounted in Fluoromount (Southern Biotechnology, Birmingham, AL).
In spinal cord, quantification of cells expressing Sox17 at various stages of the oligodendrocyte lineage was performed with NIH ImageJ software using 10 serial cord sections (100 μm apart) and at least three slides for each stage analyzed. Sox17 fluorescence intensity was measured at Nkx2.2, APC/CC1, and CNP stages of the oligodendrocyte lineage with NIH ImageJ software. For these experiments, double immunolabeling for Sox17 and Nkx2.2 or APC/CC1 was performed on coronal spinal cord sections from P5 CNP–EGFP transgenic mice. For each oligodendrocyte marker, Sox17 fluorescence intensity was expressed as the averaged value of the measurement performed on at least 100 labeled nuclei. Results are expressed as a percentage of Nkx2.2 fluorescence intensity.
Immunocytochemistry in cultured oligodendrocyte lineage cells.
Live staining for cell surface antigens with LB1, O4, and O1 antibodies was performed as described previously (Gallo and Armstrong, 1995; Gallo et al., 1996; Yuan et al., 1998; Belachew et al., 2003). Briefly, live cells were incubated at room temperature for 1 h with primary antibodies diluted 1:10 in DMEM, followed by fluorescein-conjugated goat anti-mouse IgM (1:200; Jackson ImmunoResearch, West Grove, PA) for 45 min. After three washes in PBS, cells were fixed in 4% paraformaldehyde (pH 7.3 in PBS) for 10 min at room temperature and washed. Cells were permeabilized with 0.1% Triton X-100 for 10 min at room temperature. For dual staining with cell surface antigens and Sox17, cells were blocked in 10% normal goat serum in DMEM for 30 min at room temperature before incubation with primary antibody to Sox17 (1:1000) for 2 h at room temperature. Anti-Sox17 primary antibody was diluted in 0.1 m phosphate buffer, pH 7.4, 0.1% gelatin, 1% BSA, 0.1% Triton X-100, 0.002% sodium azide, and 5% goat serum in PBS. This was followed by incubation with rhodamine-conjugated goat anti-rabbit IgG (1:200; Jackson ImmunoResearch) for 1 h at room temperature. The cells were then washed and mounted in Vectashield with 4′,6′-diamidino-2-phenylindole (DAPI). An Olympus Optical BX60 fluorescence inverted microscope was used to visualize immunofluorescence in cultured cells. Images were acquired using a 40× objective. For cell counting, 10 microscopic fields were counted for each coverslip, and two coverslips for each experiment were analyzed. At least three independent experiments (separate cell culture batches) were performed for each antibody staining. All data are presented as averages ± SEM. Luminosity measurements were performed with Adobe Photoshop 7.0. using LB1+, O4+, and O1+ cells as described above for tissue sections.
Real-time reverse-transcription PCR.
Total RNA (500 ng) was used to synthesize cDNA using oligo-dT primer (Invitrogen) in a 20 μl reaction. cDNA (1–2 μl) was then used for PCR in a 25 μl reaction. PCR was performed at 95°C for 15 s, 55°C for 30 s, and 72°C for 30 s for 40 cycles. For ex vivo experiments in Figure 3, multiplex real-time PCR was conducted in a 96-well spectrofluorometric thermal cycler (ABI PRISM 7700 Sequence detector system; Applied Biosystems, Foster City, CA). Fluorophore-labeled mouse Sox17 primer (forward, 5′ CGCAGCTACCAGGGACACGACTG[FAM]G 3′) and its unlabeled counterpart (reverse, 5′ GGACACCACGGAGGAAATGG 3′) were used for real-time quantitative PCR (qPCR). The primers were designed using the on-line LUX primer design site (Invitrogen). As a normalization control, β-actin primers (Invitrogen) were combined in each PCR mix. Fluorescence was monitored during every PCR cycle at the annealing or extension step and during the post-PCR temperature ramp.
Figure 3.

Developmental expression and regulation of Sox17 mRNA and protein in the oligodendrocyte lineage ex vivo. FACS-purified CNP–EGFP+ cells were collected at different developmental stages (P4–P30), and mRNA or total protein were analyzed for Sox 17 expression by RT-qPCR (A) and Western blot (B). A, The developmental pattern of Sox 17 expression was confirmed by RT-qPCR analysis, which showed a 2.5-fold increase between P4 and P15, followed by a decrease between P15 and P30 (levels at P30 showed a 1.5-fold increase compared with P4). Values for Sox17 expression are normalized to actin mRNA expression. Data shown are averages ± SEM of three independent experiments. *p < 0.005 compared with P4. B, Western blot analysis for Sox17 and actin proteins at P4, P15, and P30. Normalized densitometric readings show that Sox17 is increased twofold at P15 and decreased to 1.47-fold at P30 relative to P4 values.
For culture experiments in Figure 10, monoplex real-time PCR was conducted in a 96-well spectrofluorometric thermal cycler (ABI PRISM 7900 Sequence detector system; Applied Biosystems). Primers used for PCR are as follows: CNP I forward, 5′-CAAAGACAAGGGTTTGGTGCTT-3′; CNP I reverse, 5′-CGGGGAGGAGGAGATGTTAGCC[FAM]G-3′; myelin associated glycoprotein (MAG) forward, 5′-CGGAATGGGAGGCAAATACTATTTC[FAM]G-3′; MAG reverse, 5′- GCTCCGAGAAGGTGTACTGGTTG 3′; MBP forward, 5′-CGACCCTCCCCGTGTACCTTGGT[FAM]G- 3′; and MBP reverse, 5′-GGGTGAACTTGAAAGGGTGTCC-3′. β-Actin was also used as a normalization control. Fluorescence was monitored during every PCR cycle at the annealing or extension step and during the post-PCR temperature ramp. Fold changes were then measured according to instructions of the manufacturer (Invitrogen).
Figure 10.

Sox17 regulates MBP gene transcription. Purified OPCs were cultured in PDGF (10 ng/ml) for 1–2 d before transient transfection. A, OPCs were transiently transfected with pCMV–Sox17–IRES2–AcGFP or pCMV–IRES2–AcGFP as in Figure 9 and analyzed by RT-qPCR 48 h after transfection (24 h in PDGF, followed by 24 h in DME–N1). After normalization with actin, MBP, CNP, and MAG RNA levels are expressed as fold over vector-transfected samples. *p < 0.05, **p < 0.01 versus vector controls, Student's t test. B, COS7 cells were transiently transfected with 0.4 μg of SoxBSLuc, SV40Luc, or MBPLuc, together with 0.8 μg of pCMV–Sox17–IRES2–AcGFP or pCMV5–Sox10 expression plasmids. SoxBSLuc contains four copies of the Sox consensus binding site AACAAT cloned upstream of the SV40 promoter of SV40Luc. Controls were cotransfected with 0.8 μg of empty vector CMV–TnT or pCMV–IRES2–AcGFP. Luciferase activities measured at 48 h after transfection in PDGF were normalized with total protein concentration and/or cotransfected SV40β-galactosidase plasmid. Fold change in luciferase activity is expressed as a ratio of normalized luciferase activity with Sox17 or Sox10 to normalized vector-cotransfected controls. All data represent means ± SEM of three to five independent experiments. *p < 0.005 versus vector control, Student's t test. C, Primary OPCs and CG4 cells were transiently transfected with MBPLuc in the presence of PDGF. Luciferase activity was measured at 48 h after transfection in PDGF. Data are expressed as in B. *p < 0.005, **p < 0.001 versus vector control, Student's t test.
Western blot.
Cell lysates were prepared as described previously (Ghiani et al., 1999a,b). Sample separation on SDS polyacrylamide gels and Western blotting were performed as described previously (Ghiani et al., 1999a,b). Protein bands were detected using the Amersham Biosciences (Arlington Heights, IL) ECL kit with horseradish peroxidase-conjugated secondary antibodies (1:10,000; BD PharMingen, San Diego, CA).
Loss- and gain-of-function studies.
Double-stranded Sox17 small interfering RNA (siRNA) and siRNA-negative control (scrambled sequences; catalog #4615) were obtained from Ambion. A combination of three Sox17 siRNA sequences was used: ID101960 sense, GAGCUAAGCAAGAUGCUAGtt and antisense, CUAGCAUCUUGCUUAGCUCtg; ID 69339 sense, GGCUGUUCAAAAAUUUCGGtt and antisense, CCGAAAUUUUUGAACAGCCtC; ID 101869 sense, GAACCCAGAUCUGCACAACtt and antisense, GUUGUGCAGAUCUGGGUUCtg. Purified OPCs (cultured in 60 mm dishes; 6 × 10⁵ cells per dish) were treated with PDGF (10 ng/ml) for 36–40 h and then transfected in serum- and antibiotic-free DME–N1 medium with a 1:1:1 mixture of Sox17 siRNAs (final concentration, 70 nm) or the siRNA control (at equivalent concentration) using Lipofectamine 2000 (Invitrogen) for 6 h. The medium was then replaced with fresh DME–N1 supplemented with PDGF (10 ng/ml), and the cells were harvested at 24 and 48 h after transfection for Sox17 Western blot analysis. Under these conditions, transfection efficiency with a labeled siRNA control sequence (catalog #1027098; Qiagen) was estimated at 88 ± 2.4% after 12 h. For cell cycle exit and differentiation experiments, the siRNA-transfected cells (in chamber slides; Nunc, Naperville, IL) were treated with PDGF (10 ng/ml) in DME–N1 medium for 24 h, and the mitogen was then withdrawn. O4, O1, Ki67, BrdU, and caspase-3 immunostaining were performed at 2 and 4 d after mitogen withdrawal.
For gain-of-function experiments, 1–1.5 × 10⁵ cells were maintained in PDGF for 48 h in chamber slides before being transfected with 2.4 μl of Fugene and 0.8 μg of pCMV–Sox17–internal ribosome entry site 2 (IRES2)–Aequorea coerulescence (Ac)GFP or pCMV–IRES2–AcGFP for 8–12 h in DME–N1 plus PDGF. After transfection, medium was replaced and cells maintained in DME–N1 plus PDGF for an additional 24, 48, or 72 h before immunocytochemical or RNA analysis. We determined by qPCR analysis that this transfection procedure, which averaged an efficiency of 5%, resulted in 3.2-fold elevation of Sox17 RNA levels over vector-transfected controls (data not shown). For GFP and Ki67 double immunostaining, the transfected cells were fixed with 4% paraformaldehyde for 10 min and treated with 0.1% Triton X-100 for 8 min for permeabilization. GFP immunostaining was then performed, followed by Ki67 staining. For GFP and A2B5, O4, or O1 double immunostaining, the transfected cells were fixed and permeabilized as above and subjected to surface antigen staining. After the slides were blocked with 10% goat serum for 30 min, GFP staining was performed. For GFP and capase-3 double immunostaining, the transfected cells were fixed, permeabilized, and blocked as above. GFP staining was then performed, followed by caspase-3 staining.
Plasmid construction, transient transfection, and reporter assays.
SoxBSLuciferase reporter plasmid (Luc) contains four copies of the H4 site (two inverted AACAAT motifs separated by 4 bp) and was modified from pH4x4Luc reporter plasmid (Kanai et al., 1996) by cloning the sequence 5′ATCTAGACGAATTCAACAATCATCATTGTTGGGGCCAACAATCTACATTGTTCAGATCTAGAA 3′ into the BglII site of pGL3promoter vector (Promega, Madison, WI). This insert contains an additional EcoRI site close to the 5′ end. Simian virus 40–Luc (SV40Luc) refers to the parent pGL3 promoter vector that does not contain the insert (Promega). The 1.3 kb SphI–PstI fragment containing the mouse Sox17 cDNA from pGEMT-Easy Sox17 (Kanai et al., 1996) was subcloned into pLIT39 (New England Biolabs, Beverly, MA), and the SpeI fragment from this subclone was inserted into the NheI site of pCMV–IRES2–AcGFP (BD Biosciences Clontech, Palo Alto, CA). A separate Sox17 expression plasmid in pCMV–IRES2–discosoma red (dsRed) (BD Biosciences Clontech) was generated via inserting the SpeI fragment into pCMV–TnT (XbaI; Promega) and subsequently cloning into the SalI site of pCMV–IRES2–dsRed. Both AcGFP and dsRed plasmids produced similar results. The mouse MBP luciferase plasmid was generated by subcloning a 1.9 kb SacI–BamHI fragment from pMG2–MBP (Gow et al., 1992) between the SacI and BglII sites of pGL3Basic vector (Promega).
For transient transfection, COS7 cells were plated at 2.7 × 10⁵ per well in six-well tissue culture dishes 18 h before transfection. Transfection was performed with Lipofectamine 2000 (Invitrogen) according to the instructions of the manufacturer. Specifically, cells in 1.5 ml OptiMEM received 0.4 μg of luciferase reporter plasmid, 0.8 μg of expression vector or Sox17 plasmid, and 0.02 μg of SV40–β-galactosidase in 500 μl of OptiMEM with 2.4 μl of Lipofectamine 2000. After 5 h, the OptiMEM was replaced with DMEM plus 10% FBS, and cells were cultured in PDGF and harvested 48 h after the start of transfection. CG4 cells and purified OPCs were plated in N1 plus 30% B104-conditioned medium and in N1 plus PDGF, respectively, at 2.3 × 10⁵ cells per well in six-well poly-l-lysine-coated tissue culture dishes for 1–2 d before transfection. For reporter assays, transfected cells were collected in 200 μl of reporter lysis buffer (Promega) and 30 μl of lysate assayed for luciferase activity (Promega) on a Turner 20/20n Luminometer (Turner Biosystems, Sunnyvale, CA). Luciferase activity expressed as relative light units was normalized with total protein content by BCA assay (Pierce, Rockford, IL) and β-galactosidase activity, as described by Sambrook and Gething (1989).
Results
FACS purification and immunocytochemical characterization of CNP–EGFP+ cells at different developmental stages
One of the advantages of selective EGFP expression in specific neural cell types in vivo is that FACS can be used to obtain pure populations of EGFP-expressing cells directly from brain tissue. We demonstrated previously that this approach can be applied to different postnatal developmental stages (Belachew et al., 2002, 2003; Yuan et al., 2002). Therefore, we used FACS to purify EGFP-expressing cells from CNP–EGFP mouse brains between P4 and P30 and analyzed their antigenic properties (i.e., the relative proportion of different subtypes of oligodendrocyte lineage cells) by using specific markers. Immunocytochemistry was performed on EGFP+ cells plated for 1–2 h after FACS purification. Supplemental Figure S2 (available at www.jneurosci.org as supplemental material) shows that, as expected, at P4 the majority of the EGFP+ cells displayed a progenitor phenotype, because ∼60% of the cells were NG2+ and ∼30% of the EGFP+ cells were O4+. At P15, the percentage of NG2+ progenitors present in the EGFP+ fraction decreased, whereas the percentage of O1+ oligodendrocytes increased proportionally (supplemental Fig. S2, available at www.jneurosci.org as supplemental material). The reduction in the percentage of NG2+ cells and the increase in O1+ cells continued at P30. At this age, the NG2+/EGFP+ cell population represents the previously identified NG2+ adult progenitor cell type (Belachew et al., 2002; Yuan et al., 2002; Chittajallu et al., 2004). Altogether, these data indicate that (1) FACS-purified EGFP+ cells comprised cells of the oligodendrocyte lineage and (2) the changes in the proportion of NG2+ and O1+ cells observed in the EGFP+ cell fractions during development are consistent with the changes that occur in vivo.
The developmental gene expression profile of CNP–EGFP+ cells reflects in vivo expression patterns
EGFP+ cell fractions isolated at different developmental stages were used to purify mRNA for microarray analysis. We did not subsort EGFP+ cells for different antigenic markers (NG2, O4, or O1) for the following reasons: (1) because of the overlap between NG2 and O4, and O4 and O1 expression in the oligodendrocyte lineage, subsorting NG2+, O4+, or O1+ cell fractions would yield cell populations that are still heterogeneous, and (2) we wanted to obtain a developmental gene profile of oligodendrocyte lineage cells and capture dynamic changes in gene expression during oligodendrocyte maturation during the first 30 d after birth.
We first wanted to determine whether gene expression in FACS-purified CNP–EGFP+ cells was consistent with in vivo expression. Therefore, we examined the developmental expression of mRNAs associated with the process of myelination by microarray analysis (Fig. 1A). Of the 12,000 genes and expressed sequence tags examined, 7289 were reliably expressed in at least one of the four stages of oligodendroglial development from P2 to P30. As expected, we observed an upregulation of myelin transcription factors, including myelin transcription factor (Myt1) (Nielsen et al., 2004) and myelin gene expression factor (Myef2) preceding the expression of genes encoding myelin structural proteins, such as MBP, myelin oligodendrocyte glycoprotein (MOG), MAG, myelin oligodendrocyte basic protein, proteolipid protein (PLP), and its splice variant (DM20) (Fig. 1A). Similarly, we examined the developmentally regulated expression of a group of transcription factors, most of which are known to be expressed in the oligodendrocyte lineage, including a member of the E subgroup of the SRY-related HMG-box family, Sox10 (Fig. 1B). Based on developmental expression pattern, these 24 mRNAs clustered into four groups, consistent with their previously described timing of expression in vivo. These findings suggest that the process of FACS purification does not alter the known timing of expression of genes linked to specific stages of oligodendrocyte development or the expression of related Sox family members. Importantly, the subcluster designated by the red branches, which contains all of the members of the phylogenetically identified Sox family subgroup F (Sox7, Sox17, and Sox18) (Bowles et al., 2000) also displayed a developmentally regulated pattern of expression in the oligodendroglial lineage (Fig. 1B).
Figure 1.

Developmental expression of myelin-associated genes and transcription factors in FACS-isolated oligodendrocyte lineage cells. CNP–EGFP+ cells were isolated from whole mouse brain at P2, P8, P15, and P30 using FACS. A, Hierarchical clustering of transcripts (standard correlation) from the FACS-isolated oligodendrocyte lineage cells identified four expression patterns (colored branches) reflecting the known timing of myelin-associated gene expression in vivo. B, Hierarchical clustering of transcripts (standard correlation) from the FACS-isolated CNP–EGFP+ cells identified four major groups of transcription factors based on the timing of gene regulation (colored branches). The red branch contains all members of the Sox family subgroup F (black box). Each mRNA was normalized to the median expression level across all probe sets and all chips. Legend shows the color code for mRNA expression levels (red, upregulation; blue, downregulation). Gene symbol and GenBank accession numbers are listed on right side.
Coordinate clustering identifies Sox17 as a transcription factor not previously linked to oligodendrocyte development
To identify novel transcription factors associated with oligodendrocyte differentiation, we selected four myelin proteins, MAG, MOG, PLP, and its splice variant DM20, as anchor genes for temporally related coordinate clustering. MBP was not included in the original anchoring gene group that identified Sox17 as a putative regulator of oligodendrocyte development, but this gene was found to be coordinately regulated with MAG, MOG, PLP, and DM20 (r = 0.97). Therefore, we used MBP as a marker of OPC maturation (see below).
Using each anchor gene, we imposed standard coordinate clustering (r = 0.97) across the 7289 genes that fulfilled the requirement of >12.5% of the microarrays showing a present call for each probe set in the experiment. Among the 27 genes coordinately regulated in all four clusters, Sox17 was the only transcription factor coordinately regulated to all four myelin genes (Fig. 2). Within the same gene family, Sox18 (also part of the same group F) (Bowles et al., 2000) displayed correlation coefficients with the same myelin genes ranging between 0.90 and 0.94. Sox10 displayed even lower correlation coefficients, ranging between 0.75 and 0.81, resulting in its exclusion from clustering (Fig. 2). These findings on Sox17 expression and regulation in isolated CNP–EGFP+ cells prompted us to more fully define, using higher-resolution approaches, its regulation in cells of the oligodendrocyte lineage in situ and in culture and to determine whether Sox17 is involved in oligodendrocyte cell cycle regulation and/or differentiation.
Figure 2.
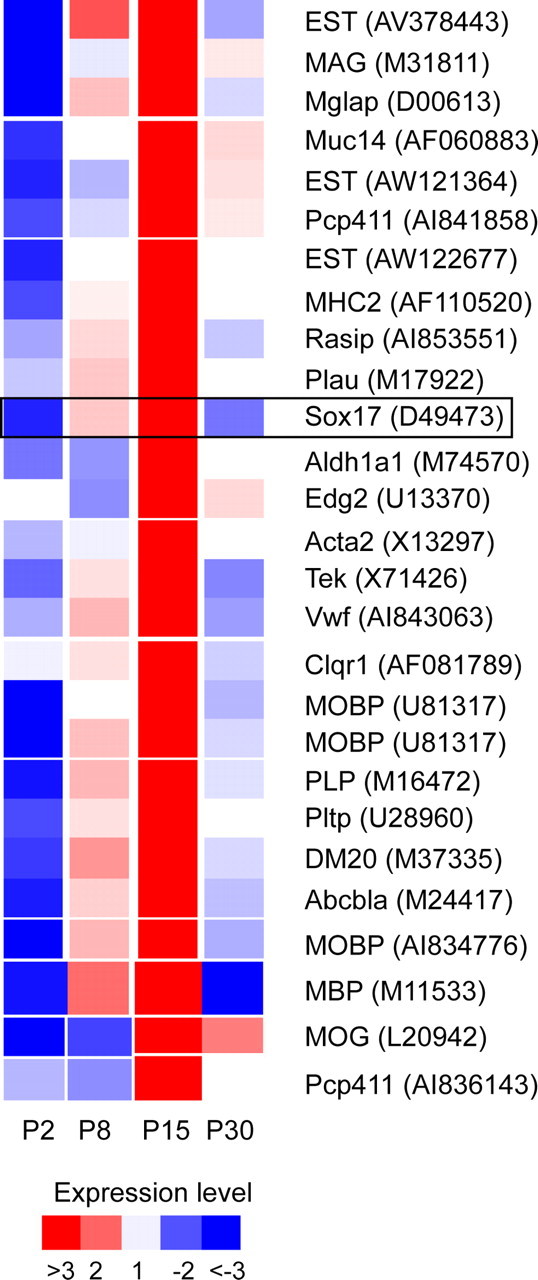
Coordinate clustering using myelin genes identifies Sox17 as a candidate regulator of oligodendrocyte development. Gene tree containing 27 mRNAs with an expression pattern highly correlated (Pearson's correlation, r = 0.97) with the expression of MAG, MOG, PLP, and its splice variant DM20 in CNP–EGFP+ cells. Each mRNA was normalized to the median expression level across all probe sets and all chips in this experiment. Legend shows the color code for mRNA expression levels (red, upregulation; blue, downregulation). Gene symbol and GenBank accession numbers are listed on right side.
Sox17 expression and regulation in the oligodendrocyte lineage ex vivo and in situ
Microarray analysis of EGFP+ oligodendrocyte lineage cells demonstrated that Sox17 mRNA levels significantly changed during postnatal development. Microarray analysis also showed that Sox17 mRNA levels were not significantly modified between P2 and P8 but displayed an approximate fourfold increase between P8 and P15. Interestingly, mRNA levels returned to baseline values between P15 and P30 (data not shown). Specifically, the Sox17 signal was reliably present for both arrays only at P15, so that validation and quantitation of the developmental pattern had to be performed using a different strategy. The Sox17 developmental expression pattern was confirmed by reverse transcription (RT)-qPCR performed on separate sets of mRNA samples purified from EGFP+ cells at different developmental stages (Fig. 3A). An increase in Sox17 mRNA was observed between P4 and P15, followed by a decrease between P15 and P30 (Fig. 3A). Consistent with the mRNA data, Western blot analysis of EGFP+ cell proteins (Fig. 3B) with the anti-Sox17 recombinant antiserum (Kanai et al., 1996) and subsequent densitometric analysis demonstrated that Sox17 protein levels increased by more than two-fold between P4 and P15 and then decreased, at P30, to 1.47-fold relative to P4 levels. The magnitude of these changes in Sox17 protein levels agree well with the quantified levels of RNA determined by qPCR (Fig. 3B).
Sox17 expression was analyzed in the developing SCWM by immunostaining with anti-Sox17 antibodies and antibodies that identify different phenotypic stages of the oligodendrocyte lineage. Figure 4 shows that, in the CNP–EGFP mouse SCWM at P15, the vast majority of EGFP+ cells expressed Sox17 and that, in the oligodendrocyte lineage in situ, Sox17 expression was developmentally regulated. In the majority of the EGFP+ cells that were immunolabeled with anti-Nkx2.2 or anti-NG2 antibodies, Sox17 immunoreactivity appeared to be diffused in speckles over the cell nucleus (Fig. 4A,B). Sox17 expression was also demonstrated in a large percentage of Olig2-expressing EGFP+ cells (Fig. 4C). In contrast to more immature OPCs, Sox17 immunoreactivity was more intense and concentrated in a nuclear pattern in O4+–EGFP+ cells (Fig. 4D). Strikingly, in mature EGFP+ cells labeled with the CNP antibody, low levels of Sox17 were observed in an extranuclear distribution (Fig. 4E). Some GFAP+ astrocytes in the SCWM colocalized with Sox17 (Fig. 4F), as did many cortical NeuN+ cells abutting the SCWM, albeit at low levels (Fig. 4G). In these EGFP-negative cell types, the diffuse Sox17 staining appeared to be of a homogeneous intensity, suggesting lack of regulation.
Figure 4.
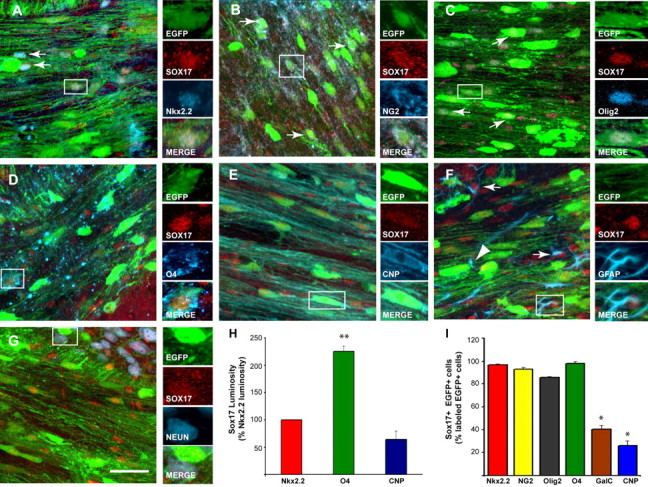
Immunohistochemical analysis of Sox17 expression in the white matter. Sox17 expression was analyzed in the SCWM of the CNP–EGFP mouse at P15. A, Nkx2.2+ (blue)–EGFP+ (green) OPCs express Sox17 (red). B, NG2+(blue)–EGFP+(green) oligodendrocyte progenitors also express Sox17 (red). In both Nkx2.2+ and NG2+ progenitors, Sox17 immunoreactivity displays a diffused distribution. C, Olig2+(blue)–EGFP+(green) oligodendrocyte lineage cells express Sox17 (red). D, In O4+ (blue)–EGFP+(green) cells, Sox17 immunolabeling (red) was less diffuse and displayed a more intense and nuclear pattern than in Nkx2.2+ and NG2+ cells. E, Sox17 (red) was not nuclear in CNP+(blue)–EGFP+ (green) cells. Arrows in A–C indicate triple-labeled cells (green/red/blue), whereas cells shown in the small panels are enlarged from respective boxed areas. Scale bar, 50 μm. F, Sox17 is detectable in some GFAP+ astrocytes (box and arrows) and absent from others (arrowhead) in white matter. G, NeuN+ neurons (blue) are EGFP negative (green) and express uniformly low levels of Sox17 (red). H, Luminosity measurements of oligodendrocyte lineage cells immunostained with anti-Sox17 antibodies and developmental markers show that O4+ cells express significantly higher levels of Sox17 than Nkx2.2+ and CNP+ cells. Data are presented as a percentage of Sox17 luminosity in Nkx2.2+ cells. Averages ± SEM were obtained from a total of 85–136 cells analyzed for each antibody marker. **p < 0.03, Student's t test versus Nkx2.2. I, Numbers of triple-labeled Sox17+–EGFP+ cells in P15 SCWM, expressed as a percentage of EGFP+ cells labeled with each oligodendrocyte lineage marker. The total number of cells analyzed ranged between 520 and 872 for each antibody marker. *p < 0.01 (compared with Nkx2.2 cells).
Semiquantitative luminosity analysis revealed that Sox17 immunoreactivity was twofold higher in O4+–EGFP+ preoligodendrocytes than in Nkx2.2+–EGFP+ cells or in CNP+–EGFP+ cells (Fig. 4H). Direct cell counting of Sox17+–EGFP+ cells in the P15 SCWM demonstrated that only a small percentage of GalC+–EGFP+ and CNP+–EGFP+ oligodendrocytes expressed detectable levels of Sox17 protein, whereas virtually all NG2+–EGFP+, Nkx2.2+–EGFP+ OPCs, and O4+–EGFP+ preoligodendrocytes expressed the Sox17 transcription factor (Fig. 4I). This downregulation of Sox17 in fully differentiated oligodendrocytes is consistent with the RNA and protein data obtained from FACS-purified EGFP+ cells (Fig. 3) and suggests that Sox17 may not be involved in the maintenance of mature oligodendrocytes.
In addition to analysis in postnatal SCWM, Sox17 expression was examined in embryonic spinal cord tissue. Sox17 was not detected at early embryonic stages (E9–E12.5) in the ventricular zone of the neural tube. Figure 5 shows that, at E12.5, very few Sox17+ cells were present, but, from E15.5 onward, when Sox17+ cells became more abundant, colocalization was clearly detected with Nkx2.2 (Fig. 5A–C) and CC1 (Fig. 5D–F). Despite colocalization with Nkx2.2, Sox17+ cells were found primarily in the p0/p1 domains and not in motor neuron progenitor (pMN) or p3 between E12.5 and E15.5, indicating that Sox17 expression does not occur at early stages of gliogenesis. The intracellular distribution of Sox17 in CC1+ cells at P0 (Fig. 5F) appeared more distinctly nuclear than in Nkx2.2+ cells (Fig. 5C). In the spinal cord of the CNP–EGFP mouse at P5, Sox17 was detectable in EGFP+ cells, in which it was also colocalized with Nkx2.2 (Fig. 5H) and with CC1 (Fig. 5J). However, similar to the case in the brain, Sox17 expression was not restricted to white matter oligodendrocyte lineage cells (EGFP-negative cells in Fig. 5G,I). Luminosity measurements in spinal cord tissue demonstrated that, similar to subcortical white matter, Sox17 expression was higher at intermediate stages of the oligodendrocyte lineage identified by the CC1 antibody and lower in differentiated CNP+ oligodendrocytes [Sox17 luminosity: CC1+ cells, 117 ± 3.1% of Nkx2.2+ cells (p < 0.05); CNP+ cells, 68.6 ± 5.3% of Nkx2.2+ cells (p < 0.05)].
Figure 5.
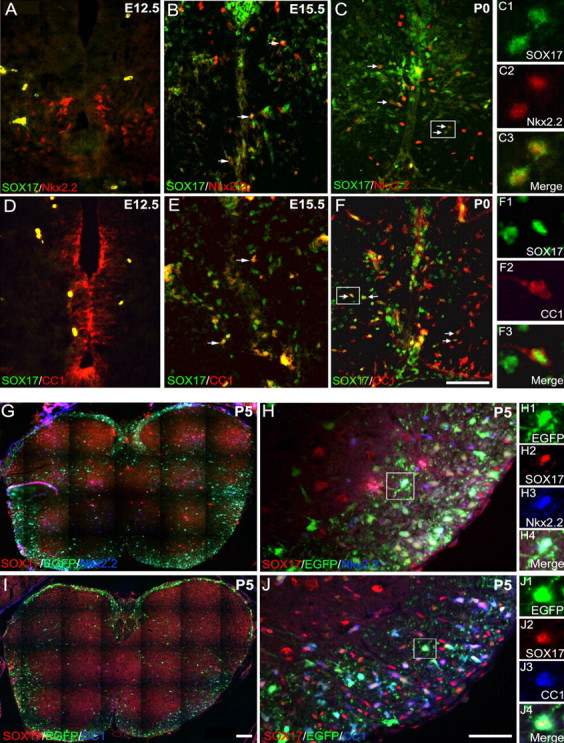
Regulation of Sox17 expression in spinal cord. Sox17 expression was analyzed in embryonic and postnatal spinal cord of wild-type (E12.5, E15.5, and P0; A–F) and CNP–EGFP (P5; G–J) mice. A–C, Nkx2.2+ (red) OPCs express Sox17 (green) at E15.5 and P0. Importantly, Sox17 is not expressed in the pMN or p3 domains. D–F, Sox17 (green) was also detected in CC1+ (red) cells. Arrows indicate colocalization of Sox17 with Nkx2.2 or CC1. G–J, In the CNP–EGFP mouse, Sox17 (red) expression was detected in both Nkx2.2+(blue)–EGFP+(green) cells (G, H) and in CC1+(blue)–EGFP+(green) cells (I, J). Cells shown in small panels (C1–C3, F1–F3, H1–H4, and J1–J4) are enlarged from respective boxed areas. Scale bars, 50 μm.
In summary, the data in Figures 4 and 5 indicate that, in the oligodendrocyte lineage, Sox17 expression in situ is higher in O4+ preoligodendrocytes than in Nkx2.2+, NG2+ progenitors, or GalC+–CNP+ oligodendrocytes. The absence of Sox17 from cells of the pMN or p3 domains in the E12.5 spinal cord indicates its lack of involvement in the early events of progenitor generation. Our analysis thus far is consistent with the notion that Sox17 upregulation is coincident with the increase in myelin gene expression at the RNA level but precedes the appearance of markers of terminally differentiated oligodendrocytes. Therefore, it is possible that its function in this lineage may be specifically associated with the intermediate stages of oligodendrocyte progenitor maturation rather than with progenitor specification or mature oligodendrocyte maintenance.
Sox 17 expression and regulation in the oligodendrocyte lineage in culture
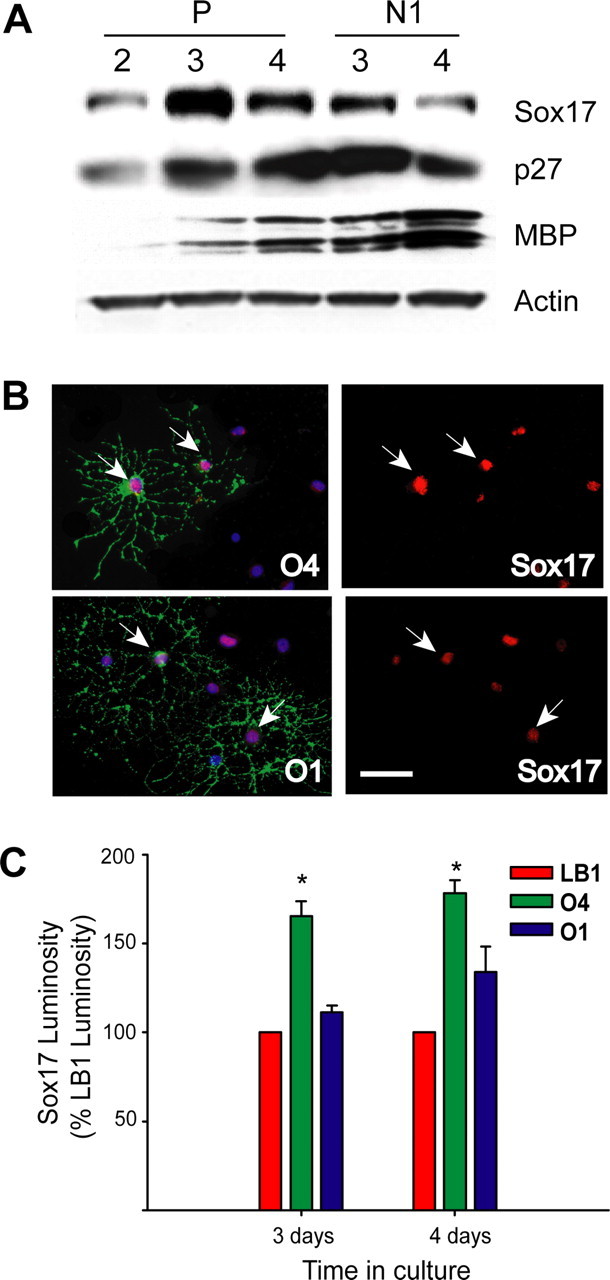
Our ex vivo and in vivo Sox17 expression data obtained in FACS-purified EGFP+ cells and in mouse tissue sections suggest that this transcription factor may play a role in the transition between immature/proliferative and mature/postmitotic stages of the lineage. To define a functional role for Sox17 in oligodendrocyte development, we first analyzed its expression in purified rat OPCs that were maintained in culture under conditions that support cell proliferation and allow limited spontaneous cell differentiation, i.e., in the presence of PDGF. It should be noted that the experiments described in Figures 6,,,–10 used primary cortical oligodendrocyte progenitor cultures prepared from perinatal rats. Figure 6A shows that, under these conditions, Sox17 protein accumulated with time in culture, and its levels peaked between days 2 and 4 in vitro, corresponding temporally to the well characterized OPC morphological transition between a highly proliferative/bipolar/motile and a nondividing/multipolar/nonmigratory phenotype (Fig. 6B) (Gallo and Armstrong, 1995). Although the peak occurs transiently at approximately day 3, the levels of Sox17 at day 4 still stabilized at levels higher than those at day 2. Densitometry of multiple Western blots revealed that Sox17 protein peaked at day 3 with levels 4.02 ± 0.55-fold (n = 4) relative to those at day 2 and declined, at day 4, to 2.44 ± 0.34-fold (n = 5) of day 2 (Student's t test: P3 vs P2, p < 0.0005; P4 vs P2, p < 0.005; P4 vs P3, p < 0.05). The peak of Sox17 expression temporally coincided with an increase of p27 (Figs. 6A, 7A) levels between 2 and 3 d in vitro and preceded an increase in MBP expression (Fig. 6A, 7A). This suggests that Sox17 upregulation is associated with cell cycle arrest or exit and the initiation of differentiation.
Figure 6.

Regulation of Sox17 protein expression in proliferating oligodendrocyte progenitors in culture. A, Representative Western blot comparing Sox17, p27, and MBP expression and regulation in OPCs maintained in PDGF (P; 10 ng/ml) or in PDGF plus bFGF (P+F; both at 10 ng/ml) for 2–4 d. The increase in Sox17 expression observed in cells cultured in PDGF was not observed in cells cultured in PDGF plus bFGF. B, Images of living OPCs at 2, 3, and 4 d of culture in PDGF, showing morphological changes between days 2 and 4 in vitro. Scale bar, 1 mm. C, Purified oligodendrocyte lineage cells at different developmental stages were identified using specific markers. OPCs were exposed to PDGF for 4 d. The top left panel shows merged images of surface marker LB1 in green, nuclear DNA stained with DAPI in blue, and Sox17 immunoreactivity in red. The bottom left panel shows merged images of surface marker O4 in green, nuclear DNA stained with DAPI in blue, and Sox17 immunoreactivity in red. The right panels show Sox17 immunostaining alone, with arrows that indicate representative LB1+ and O4+ cells in corresponding fields. Exposure times were standardized at image acquisition. Scale bar, 50 μm. D, Sox17 luminosity measurements of LB1+ and O4+ cells at each time point expressed as a percentage of Sox17 luminosity in LB1+ cells at the same time points. OPCs with PDGF (10 ng/ml) were analyzed by double immunostaining at 3 and 4 d in culture. Sox17 luminosity was significantly higher in O4+ than in LB1+ cells at both 3 and 4 d in culture. Results are expressed as mean ± SEM of four experiments, with total numbers of cells counted ranging between 98 and 211 for each antibody. *p < 0.01, Student's t test.
Figure 7.
Regulation of Sox17 protein expression in differentiating oligodendrocyte progenitors in culture. A, Western blot data comparing Sox17 expression and regulation in OPCs maintained in PDGF (P; 10 ng/ml) or in the absence of mitogens (DME–N1). Cells were maintained in PDGF for 2 d, followed by either 2 more days in PDGF or N1–PDGF-free medium. The increase in Sox17 expression observed in cells cultured in PDGF was higher than in cells cultured in DME–N1. B, Purified oligodendrocyte lineage cells at different developmental stages were identified using specific markers. OPCs were exposed to PDGF for 2 d, followed by 2 d in N1–PDGF-free medium. The top left panel shows merged images of surface markers O4 in green, nuclear DNA stained with DAPI in blue, and Sox17 immunoreactivity in red. The bottom panel shows merged images of surface markers O1 in green, nuclear DNA stained with DAPI in blue, and Sox17 immunoreactivity in red. The right panels show Sox17 immunostaining alone, with arrows that indicate representative O4+ and O1+ cells in corresponding fields. Exposure times were standardized at image acquisition. Scale bar, 50 μm. C, Sox17 luminosity measurements in LB1+, O4+, and O1+ cells expressed as a percentage of Sox17 levels in LB1+ cells at the same time points. OPCs treated as in A (N1 medium) were analyzed by double immunostaining at 3 and 4 d in culture. Sox17 luminosity was significantly higher in O4+ than in LB1+ or O1+ cells at both 3 and 4 d in culture. Results are expressed as mean ± SEM of three experiments, with total numbers of cells counted ranging between 44 and 118 for each antibody. *p ≤ 0.05, Student's t test.
Figure 8.
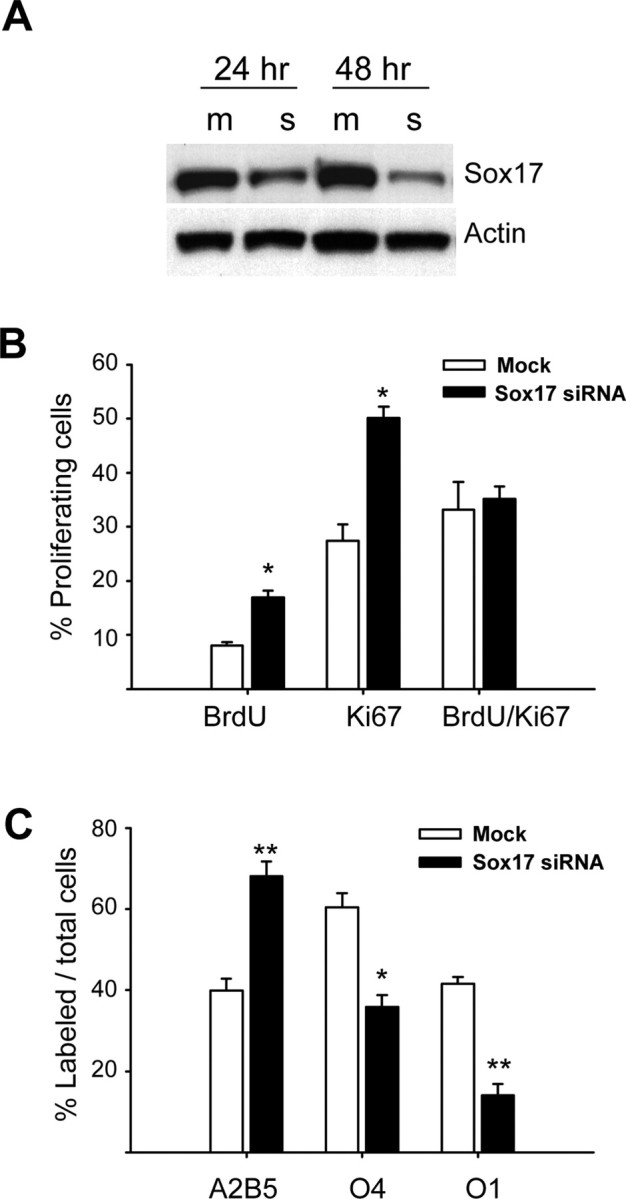
Sox17 loss-of-function reveals a role in cell cycle exit and differentiation. Purified OPCs were cultured in the presence of PDGF (10 ng/ml) and transfected with Sox 17 siRNAs. A, Representative Western blot of Sox 17 protein levels shows a 60 and 80% reduction in Sox 17 expression at 24 and 48 h after transfection in PDGF, respectively. Numbers indicate hours after transfection. m, Mock transfected with scrambled sequence; s, Sox17 siRNA transfected. B, Downregulation of Sox17 expression induces an increase in OPC proliferation, as measured by anti-Ki67 and anti-BrdU staining (3 d after transfection). Cells were incubated with BrdU (20 μm) for 1.5 h before staining. Values represent percentage of total cells, as determined by DAPI counterstaining. Results are expressed as mean ± SEM of three to four experiments with a total number of cells counted ranging between 1475 and 2174 for each antibody. *p ≤ 0.005 (compared with mock-transfected cells), Student's t test. C, Downregulation of Sox 17 expression prevents OPC lineage progression, as determined by A2B5 and O4 (3 d after transfection) and O1 immunostaining (5 d after transfection). Values represent percentage of total cells, as determined by DAPI counterstaining. Results are expressed as mean ± SEM of three to four experiments with total numbers of cells counted ranging between 1381 and 1630 for each antibody. *p < 0.01 and **p ≤ 0.005 (compared with mock-transfected cells), Student's t test.
Figure 9.
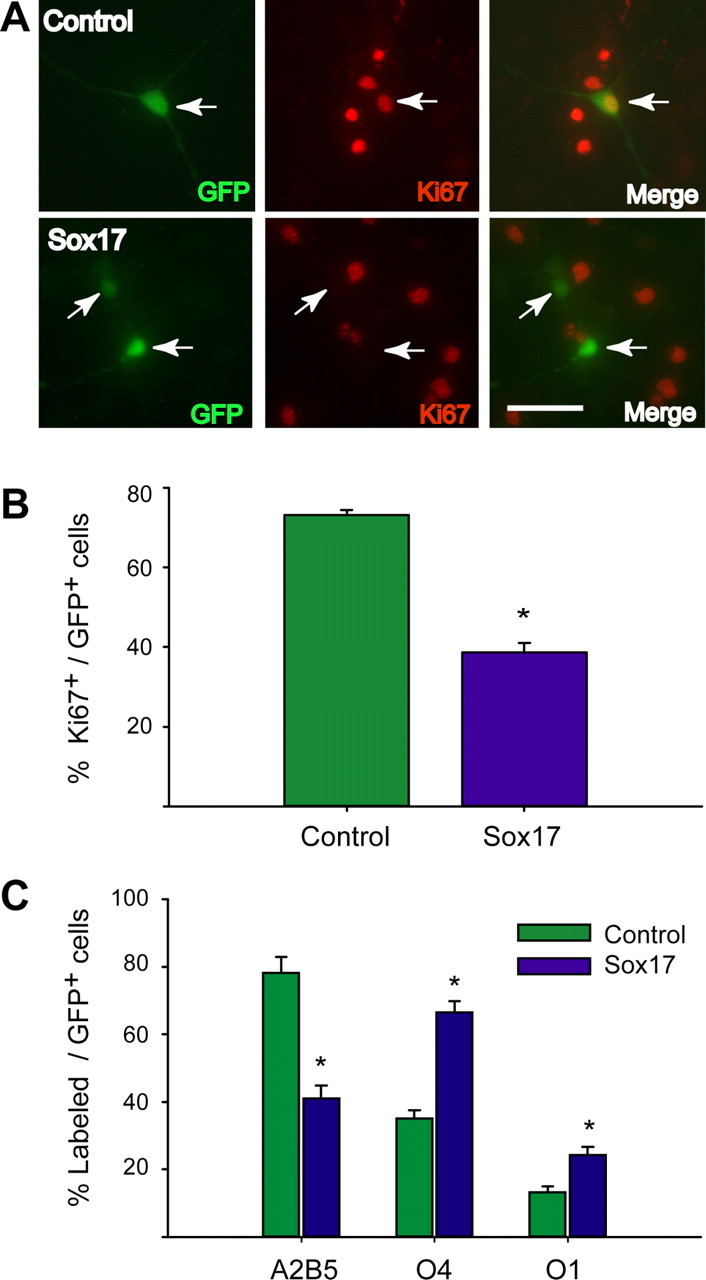
Sox17 gain-of-function confirms a role in cell cycle exit and differentiation. Purified OPCs were cultured in the presence of PDGF (10 ng/ml) and transfected with pCMV–Sox17–IRES2–AcGFP or pCMV–IRES2–AcGFP. A, Example of anti-Ki67 staining (red fluorescence) in control (green fluorescence, top row) or Sox17-overexpressing (green fluorescence, bottom row) cells at 24 h after transfection in PDGF. Scale bar, 50 μm. B, Overexpression of Sox 17 expression induces a decrease in OPC proliferation, as measured by anti-Ki67 staining 24 h after transfection in PDGF. Values represent percentage of GFP+ cells. Results are expressed as mean ± SEM of three independent experiments with a total number of cells counted as 403 (Sox17) and 529 (control). *p ≤ 0.001 (compared with control), Student's t test. C, Sox 17 overexpression promotes OPC lineage progression, as determined by A2B5 and O4 (2 d after transfection) and O1 (3 d after transfection) immunostaining. Values represent percentage of EGFP+ cells. Results are expressed as mean ± SEM of three to four independent experiments with total numbers of cells counted ranging between 350 and 420 for each antibody. *p < 0.001 (compared with mock-transfected cells), Student's t test.
In support of this hypothesis, under culture conditions that prevented OPC differentiation and maintained cells in a bipolar morphology [i.e., in PDGF plus basic fibroblast growth factor (bFGF)] (Bogler et al., 1990; McKinnon et al., 1990), Sox17 levels were lower than in OPCs cultured in PDGF alone and displayed only a small increase between 3 and 4 d in vitro (Fig. 6A). The behavior of Sox17 under these conditions not only emphasizes its putative role in OPC lineage progression but also suggests that cell proliferation per se does not control Sox17 expression, because similar percentages of proliferating OPCs (∼70%) were observed in PDGF or in PDGF plus bFGF (data not shown) (Gallo et al., 1996).
To further correlate Sox17 expression with developmental stage at the single-cell level, we immunostained oligodendrocyte lineage cells cultured in PDGF with Sox17 antibodies and the developmental markers LB1 for OPCs and O4 for preoligodendrocytes (Gallo and Armstrong, 1995; Yuan et al., 1998). Because of the low percentage of O1+ cells in OPCs cultured in PDGF for 4 d, Sox17 expression levels were quantified only in LB1+ and O4+ cells. Figure 6, C and D, shows that Sox17 was detected in all LB1+ and O4+ cells, but its expression was ∼60% higher in O4+ preoligodendrocytes than in LB1+ OPCs, as determined by luminosity measurements after double immunostaining.
Finally, to analyze O1+ cells, we studied Sox17 expression in OPCs that were induced to exit the cell cycle and differentiate by PDGF withdrawal (Ghiani and Gallo, 2001; Tokumoto et al., 2001). Figure 7A shows that PDGF withdrawal caused an increase in Sox17 expression at 3 d under conditions that induced considerable OPC differentiation, as indicated by p27 and MBP upregulation (Fig. 7A). Double immunostaining and luminosity measurements demonstrated that, after PDGF withdrawal, Sox17 was detected in all LB1+, O4+, and O1+ cells. Consistent with in situ data and observations in PDGF, its expression was still significantly higher in O4+ preoligodendrocytes than in LB1+ OPCs or O1+ oligodendrocytes (Fig. 7B,C).
Attenuation of Sox 17 expression in oligodendrocyte progenitors prevents cell cycle exit and cell differentiation
To demonstrate a functional role for Sox17 in regulating OPC development, we performed loss-of-function experiments using siRNAs. Figure 8A shows that transient transfection of cultured OPCs with Sox17 siRNAs caused a consistent 60–80% decrease in Sox17 protein levels. Furthermore, qPCR analysis confirmed that Sox17 siRNA reduced Sox17 RNA levels by 78 ± 7% compared with mock control (data not shown). Under these conditions, OPC viability was not affected by siRNA transfection, as measured by cleaved caspase-3 immunostaining 48 h after transfection (percentage of total DAPI-stained nuclei that were positive for cleaved caspase-3: mock, 5.9 ± 1.06%; Sox17 siRNA, 5.7 ± 1.56%; mean ± SEM of three experiments). Under conditions that favored OP cell cycle exit, downregulation of Sox17 expression caused a significant increase in the percentage of OPCs that continued to proliferate, as determined by anti-Ki67 (total proliferating cells) and anti-BrdU (S-phase cells) stainings (Fig. 8B). Figure 8B shows that the percentage of proliferating cells that were Ki67+ or BrdU+ was significantly higher in siRNA-transfected OPCs compared with mock-transfected controls. However, the BrdU/Ki67 ratio, which is an indirect measurement of Ts/Tc (in which Ts is the S-phase length and Tc is the total cell cycle length, respectively) (Nowakowski et al., 1989; Takahashi et al., 1995) was not modified by Sox17 transfection. These results indicate that downregulation of Sox17 expression did not interfere with the kinetics of OP cell cycle progression. Moreover, the percentage of O4+ and O1+ cells was significantly lower in Sox17 siRNA-transfected cells than in mock-transfected controls, which corresponded to a higher percentage of cells that maintained an A2B5+ OPC phenotype in Sox17 siRNA-treated cells (Fig. 8C). In summary, these results indicate that downregulating Sox17 expression maintained OPCs in a proliferating state and reduced cell cycle exit and differentiation.
Sox17 overexpression in oligodendrocyte progenitors promotes cell cycle exit and cell differentiation
To further define a functional role for Sox17 in OPC development, we also applied a gain-of-function approach. We constructed Sox17 expression plasmids by subcloning Sox17 cDNA into the pCMV–IRES2–dsRed and pCMV–IRES2–AcGFP vectors. Cultured OPCs were then transfected with the pCMV–Sox17–IRES2–AcGFP (Sox17) construct or a pCMV–IRES2–AcGFP (control) vector (Fig. 9A), and the transfected cells were analyzed by dual immunostaining for AcGFP and Ki67. Figure 9A shows that >75% of GFP+ control cells were Ki67+ in the presence of PDGF, whereas only 40% of Sox17–GFP+ cells were Ki67+. We also determined that cell survival under these conditions was not adversely affected. The percentage of GFP+ cells immunostained for active caspase 3 was found to be comparable in vector-transfected (4.54%) and Sox17-transfected cells (4.66%) (data not shown). As shown in Figure 9B, cell counts revealed that the percentage of Ki67+ cells was significantly lower (∼50% of controls) in the Sox17-transfected cells than in the controls. Furthermore, A2B5 immunoreactivity was detected in a much smaller percentage of Sox17-overexpressing cells than in cells transfected with the empty GFP vector at 2 d after transfection in PDGF (Fig. 9C). Finally, consistent with these findings, the percentage of both O4+ and O1+ cells was higher in cells overexpressing Sox17 compared with controls at 2 and 3 d after transfection, respectively (Fig. 9C). In conclusion, these data are in agreement with the loss-of-function analysis shown in Figure 8 and clearly indicate that Sox17 plays a role in promoting OP cell cycle exit and differentiation.
Sox17 regulates MBP gene transcription
To determine whether Sox17 affects myelin gene expression, we performed RT-qPCR in OPCs transfected with Sox17–AcGFP. Figure 10A shows that, after mitogen removal, MBP, CNP, and MAG RNAs were coordinately upregulated after Sox17 overexpression. We analyzed total rat MBP transcripts by using primers complementary to exon VII, which is common to all MBP isoforms (Fig. 10A). In addition, we also observed significant increases (p < 0.01, Student's t test vs GFP vector) in MBP (1.39 ± 0.093-fold over vector), CNP (1.2 ± 0.034), and MAG (1.2 ± 0.033) RNA levels with Sox17 overexpression in the presence of PDGF. These results suggested that Sox17 might directly promote myelin gene transcription. To confirm functional activity and specificity of the Sox17 expression plasmids generated, we constructed a luciferase reporter plasmid containing four copies of the two inverted Sox17 binding motifs (AACAAT) immediately upstream of the SV40 promoter (SoxBSLuc) (Fig. 10B). A similar reporter plasmid has been used previously to validate Sox17 transcriptional activity (Kanai et al., 1996). Figure 10B shows that cotransfection of the pCMV–Sox17–dsRed construct with SoxBSLuc activated luciferase activity in COS7 fibroblasts but had no effect on the parent SV40 vector (SV40Luc), confirming that the Sox17 construct was functionally active on enhancer-bearing constructs. Identical results were obtained with the pCMV–Sox17–IRES2–AcGFP (data not shown).
In transiently transfected COS7 fibroblasts, both the Sox17 construct and a Sox10 expression construct that had been shown previously to strongly activate MBP transcription (Stolt et al., 2002) were equally active on the cognate Sox recognition element (pSoxBSLuc), as demonstrated by luciferase reporter assays (Fig. 10B). In the same cells, both Sox10 and Sox17 potently induced MBP promoter activity (Fig. 10B). In cultured OPCs and CG4 cells (Fig. 10C), MBP-luciferase activity was increased by ∼6-fold and 13-fold after cotransfection with the Sox10 construct, respectively. Under the same experimental conditions, the Sox17 constructs increased MBP promoter activity by ∼5-fold and 14-fold in OPCs and CG-4 cells, respectively (Fig. 10C). These data indicate that Sox17 induces MBP gene expression in all of the cell types tested.
Discussion
The pattern of Sox17 expression in the nervous system has remained uncharacterized to date. Sox17 was originally defined as a transcriptional activator during mouse spermatogenesis (Kanai et al., 1996). Analysis of Sox17-deficient mice demonstrated that Sox17 plays a pivotal role in endoderm formation (Kanai-Azuma et al., 2002) by cooperating with β-catenin, to regulate transcription of essential endodermal target genes (Sinner et al., 2004). However, Sox17 deletion is embryonic lethal, which prevents any study of the postnatal events of oligodendrogenesis and myelination. In the absence of a viable Sox17 conditional mutant, we first analyzed Sox17 expression and regulation in the oligodendrocyte lineage at the cellular level and determined its functional role in OPC development by performing gain- and loss-of-function studies.
Oligodendrocyte development in the CNS is known to depend on three members of the E subgroup of HMG-containing Sox transcription factors, i.e., Sox8, Sox9, and Sox10 (Stolt et al., 2002, 2003, 2004). Sox9 is directly involved in oligodendrocyte specification (Stolt et al., 2003), whereas Sox10 is required for terminal differentiation (Stolt et al., 2002, 2004). During development, Sox8 is expressed after Sox9 and before Sox10 and cooperates with Sox9 in oligodendrocyte specification (Stolt et al., 2005). In both the CNS and PNS, the MBP and PLP genes are under direct positive control of Sox10 (Peirano and Wegner, 2000; Peirano et al., 2000). In the brain, the developmental profile of Sox17 expression in the oligodendroglial lineage culminated at P15, at both the mRNA and protein levels, which correlates with initiation of OPC differentiation in various brain regions and active myelination in corpus callosum.
This finding, combined with our immunocytochemical analysis in situ, suggested that changes in Sox17 expression in the oligodendrocyte lineage could be associated with differentiation events rather than with early oligodendrocyte specification. Indeed, Sox17 is detectable in OPC-containing regions of the embryonic spinal cord and not in the pMN/p3 domains, in which early progenitors are believed to be generated in the mouse (Fu et al., 2002). Sox17 is detectable in OPCs of the corpus callosum, but, at P15, its levels are higher in O4+ preoligodendrocytes than in NG2+ OPCs or CNP+ oligodendrocytes. We demonstrated that, in the CNP–EGFP mouse, expression of O4 in white matter regions corresponds to a postmitotic stage of the oligodendrocyte lineage (Chittajallu et al., 2005). These findings are further supported by our analysis in cultured OPCs, demonstrating that (1) Sox17 protein levels increase during the morphological conversion of bipolar OPCs to multipolar preoligodendrocytes, and (2) Sox17 immunoreactivity is significantly higher in O4+ preoligodendrocytes that in OPCs or oligodendrocytes.
Analysis of Sox17 protein expression in OPCs cultured in the presence of PDGF also indicated that the levels of the transcription factor increased during the first few days in culture, in parallel with an increase in p27 levels. In the presence of PDGF, MBP expression continued to increase after the peak of Sox17 protein expression. Furthermore, in OPCs exposed to PDGF withdrawal, Sox17 expression transiently increased concomitantly with an increase in p27 and MBP expression. Finally, in cells cultured in PDGF plus bFGF, which prevents cell cycle exit and differentiation, Sox17 levels remained low and did not display significant changes. These data indicate that a transient increase in Sox17 levels precedes OP cell cycle exit and initiation of differentiation, and therefore Sox17 could play a direct role in regulating these phases of OPC development.
This hypothesis is corroborated by our loss- and gain-of-function studies that directly demonstrate a functional role for Sox17 in OPC proliferation and differentiation. Sox17 siRNA transfection greatly reduced expression of the transcription factor and, at the same time, significantly prevented OP cell cycle exit and differentiation. Conversely, Sox17 overexpression decreased OPC proliferation and induced OPC differentiation. Interestingly, the cell cycle kinetics of Sox17 siRNA-transfected OPCs was similar to that of mock-transfected cells, suggesting that Sox17 might not interfere with cell cycle kinetics per se but rather constitutes a component of the timing mechanism that regulates cell cycle exit and/or initiation of OPC differentiation (Barres et al., 1994; Bogler and Noble, 1994). This hypothesis is also consistent with the finding that Sox17 levels do not directly correlate with OPC proliferation rates. In fact, (1) after 2 d, OPCs cultured in PDGF displayed higher levels of Sox17 expression than cells cultured in PDGF plus bFGF but similar proliferation rates (Gallo et al., 1996), and (2) immunostaining of cultured OPCs indicated that the levels of Sox17 expression do not correlate with Ki67 intensity (J. Sohn, J. Lytle, L.J. Chew, and V. Gallo, unpublished observations).
The molecular mechanism by which Sox17 regulates cell cycle exit in oligodendrocytes is presently unclear, but, based on previous studies of Sox genes, we speculate that it may involve modulation of β-catenin activity. As a downstream effector of the canonical Wnt (wingless-type MMTV integration site family) pathway (for review, see Nelson and Nusse, 2004), β-catenin transactivates the cyclin D1 promoter together with T cell factor (TCF)/lymphoid enhancing factor (LEF), resulting in increased progression into the cell cycle (Shtutman et al., 1999; Tetsu and McCormick, 1999). Sox1 has been shown to promote neuronal lineage commitment through inhibition of β-catenin–TCF/LEF signaling and subsequent exit of cells from the cell cycle (Kan et al., 2004). Of the Sox F members, Sox7 also prevents the transcriptional activity of β-catenin in TCF reporter assays (Takash et al., 2001), suggesting that conservation within and across subfamilies predicts similar functions. Indeed, the Sox17 binding site on β-catenin overlaps with that for TCF/LEF (Zorn et al., 1999), and Sox17 has been shown to cooperate with β-catenin to regulate the expression of endodermal genes (Zorn et al., 1999; Sinner et al., 2004). Given our observation that Sox17 regulates myelin gene expression, such dual activity of Sox17 may operate in OPCs to promote lineage progression, but its molecular targets in OP cell cycle control still await identification.
In cultured OPCs, Sox17 protein levels increase before MBP protein expression, and, in FACS-purified EGFP+ cells, the increase of Sox17 mRNA observed at P15 coincides with the developmental increase in MBP RNA. Furthermore, after Sox17 overexpression in OPCs, MBP RNA levels were significantly increased. These findings prompted us to determine whether, as described previously for Sox10 (Stolt et al., 2002), Sox17 also directly regulates myelin gene expression. Transient transfection of OPCs and CG4 cells demonstrated that Sox17 activates MBP gene transcription to the same extent as Sox10. It is striking that Sox17 is barely detectable in CNP+ cells in vivo, suggesting that it is not essential for maintenance of a mature oligodendrocyte phenotype. Consistent with findings of lower PLP and MBP RNA levels in adults (P30–P40) than in actively myelinating postnatal animals (P15–P20) (Montague et al., 1997), our observations by microarray analysis suggest that high levels of transcription are not sustained and that posttranscriptional processes could later gain greater importance. A similar function may be ascribed to the proneural factor Sox21 in the chick neural tube, in which it suppresses progenitor traits, such as proliferation, but is itself suppressed before the upregulation of definitive neuronal markers (Sandberg et al., 2005). Loss of Sox21 hindered differentiation, and its overexpression represses Pax6 (paired box gene 6), allowing the premature appearance of Lim2/Lhx5 (Lin-11, Isl-1, Mec-3) and NeuN neuronal proteins (Sandberg et al., 2005).
We have observed that Sox17 not only promotes exit from the OPC cell cycle but also stimulates myelin gene expression and differentiation. However, whether it functions in both of these aspects exclusively via activation remains to be addressed. Our data suggest that, although both Sox10 and Sox17 promote MBP expression, Sox17 may not regulate the same repertoire of myelin genes as has been demonstrated for Sox10 (Stolt et al., 2002) and that distinct roles are likely to emerge. Future experiments in Sox17 mutant mice will determine not only whether Sox17 and Sox10 play a partially redundant role in oligodendrocyte differentiation but also whether the developmental role of Sox17 in these cells might partially overlap with that of Sox8 and Sox9.
In conclusion, our study shows that Sox17 plays an important role in regulating OP cell cycle exit and differentiation and in MBP gene expression. Our data are consistent with the notion that coordinate expression of different Sox E and F genes contributes to the regulation of distinct phases of oligodendrocyte development. Although Sox genes play redundant roles in distinct cell types during development (Wegner and Stolt, 2005), our loss-of-function studies indicate that Sox17 might play a crucial role in the differentiation of oligodendrocytes that could not be compensated by other Sox factors, at least in vitro. Because we found Sox18 to be undetectable in Western blots of the same OPC cultures analyzed for Sox17 (Lytle, Chew, and Gallo, unpublished observations), any overlapping roles among Sox7, Sox17, and Sox18 in OPC development presently remain unknown.
Our finding that Sox17 expression promotes the maturation of OPCs might be relevant to designing new strategies aimed at repair of demyelinating lesions, in which it is well established that endogenous OPCs are present (Wolswijk, 1997, 1998, 2000, 2002; Chang et al., 2000). Therapeutic approaches using genes that promote oligodendrocyte differentiation, including Sox17, might be used to genetically manipulate quiescent OPCs in the lesions to reestablish cell cycle characteristics of terminal differentiation and to restore myelin gene expression.
Footnotes
This work was supported by National Institutes of Health (NIH) Grants R21NS048238 (V.G.) and K08NS41273 (J.N.), NIH Mental Retardation and Developmental Disability Research Center Grant P30HD40677, National Multiple Sclerosis Society Grant RG3712A1 (V.G.), the European Leukodystrophy Association (S.B., V.G.), the Wadsworth Foundation (V.G.), Institut National de la Santé et de la Recherche Médicale (B.N.-O.), and the French Multiple Sclerosis Society (B.N.-O.). S.B. was supported by Fonds National de la Recherche Scientifique. We are grateful to Dr. Michael Wegner (University of Erlangen-Nuernberg, Erlangen, Germany) for the pCMV5Sox10 expression plasmid and to Dr. David Rowitch (Dana-Farber Cancer Institute and Harvard Medical School, Boston, MA) for the generous gift of the rabbit polyclonal Olig2 antibody. We thank W. King for assistance with FACS. We thank Stacy Roundtree for transgenic colony maintenance and for performing some of the transient transfection experiments and luciferase assays. We are particularly grateful to Dr. Anne Baron-Van Evercooren for her continuous support of this project and for discussion. We thank Drs. R. Armstrong, A. Chiaramello, and M. Sutherland for discussion.
References
- Aguirre A, Gallo V. Postnatal neurogenesis and gliogenesis in the olfactory bulb from NG2-expressing progenitors of the subventricular zone. J Neurosci. 2004;24:10530–10541. doi: 10.1523/JNEUROSCI.3572-04.2004. [DOI] [PMC free article] [PubMed] [Google Scholar]
- Barres BA, Lazar MA, Raff MC. A novel role for thyroid hormone, glucocorticoids and retinoic acid in timing oligodendrocyte development. Development. 1994;120:1097–1108. doi: 10.1242/dev.120.5.1097. [DOI] [PubMed] [Google Scholar]
- Baumann N, Pham-Dinh D. Biology of oligodendrocyte and myelin in the mammalian central nervous system. Physiol Rev. 2001;81:871–927. doi: 10.1152/physrev.2001.81.2.871. [DOI] [PubMed] [Google Scholar]
- Belachew S, Aguirre AA, Wang H, Vautier F, Yuan X, Anderson S, Kirby M, Gallo V. Cyclin-dependent kinase-2 controls oligodendrocyte progenitor cell cycle progression and is downregulated in adult oligodendrocyte progenitors. J Neurosci. 2002;22:8553–8562. doi: 10.1523/JNEUROSCI.22-19-08553.2002. [DOI] [PMC free article] [PubMed] [Google Scholar]
- Belachew S, Chittajallu R, Aguirre AA, Yuan X, Kirby M, Anderson S, Gallo V. Postnatal NG2 proteoglycan-expressing progenitor cells are intrinsically multipotent and generate functional neurons. J Cell Biol. 2003;161:169–186. doi: 10.1083/jcb.200210110. [DOI] [PMC free article] [PubMed] [Google Scholar]
- Bogler O, Noble M. Measurement of time in oligodendrocyte-type-2 astrocyte (O-2A) progenitors is a cellular process distinct from differentiation or division. Dev Biol. 1994;162:525–538. doi: 10.1006/dbio.1994.1106. [DOI] [PubMed] [Google Scholar]
- Bogler O, Wren D, Barnett SC, Land H, Noble M. Cooperation between two growth factors promotes extended self-renewal and inhibits differentiation of oligodendrocyte-type-2 astrocyte (O-2A) progenitor cells. Proc Natl Acad Sci USA. 1990;87:6368–6372. doi: 10.1073/pnas.87.16.6368. [DOI] [PMC free article] [PubMed] [Google Scholar]
- Bowles J, Schepers G, Koopman P. Phylogeny of the SOX family of developmental transcription factors based on sequence and structural indicators. Dev Biol. 2000;227:239–255. doi: 10.1006/dbio.2000.9883. [DOI] [PubMed] [Google Scholar]
- Casaccia-Bonnefil P, Liu A. Relationship between cell cycle molecules and onset of oligodendrocyte differentiation. J Neurosci Res. 2003;72:1–11. doi: 10.1002/jnr.10565. [DOI] [PubMed] [Google Scholar]
- Casaccia-Bonnefil P, Hardy RJ, Teng KK, Levine JM, Koff A, Chao MV. Loss of p27Kip1 function results in increased proliferative capacity of oligodendrocyte progenitors but unaltered timing of differentiation. Development. 1999;126:4027–4037. doi: 10.1242/dev.126.18.4027. [DOI] [PubMed] [Google Scholar]
- Chang A, Nishiyama A, Peterson J, Prineas J, Trapp BD. NG2-positive oligodendrocyte progenitor cells in adult human brain and multiple sclerosis lesions. J Neurosci. 2000;20:6404–6412. doi: 10.1523/JNEUROSCI.20-17-06404.2000. [DOI] [PMC free article] [PubMed] [Google Scholar]
- Chittajallu R, Aguirre A, Gallo V. NG2-positive cells in the mouse white and grey matter display distinct physiological properties. J Physiol (Lond) 2004;561:109–122. doi: 10.1113/jphysiol.2004.074252. [DOI] [PMC free article] [PubMed] [Google Scholar]
- Chittajallu R, Aguirre AA, Gallo V. Downregulation of platelet-derived growth factor-α receptor-mediated tyrosine kinase activity as a cellular mechanism for K+-channel regulation during oligodendrocyte development in situ. J Neurosci. 2005;25:8601–8610. doi: 10.1523/JNEUROSCI.2122-05.2005. [DOI] [PMC free article] [PubMed] [Google Scholar]
- Di Giovanni S, Knoblach SM, Brandoli C, Aden SA, Hoffman EP, Faden AI. Gene profiling in spinal cord injury shows role of cell cycle in neuronal death. Ann Neurol. 2003;53:454–468. doi: 10.1002/ana.10472. [DOI] [PubMed] [Google Scholar]
- Fu H, Qi Y, Tan M, Cai J, Takebayashi H, Nakafuku M, Richardson W, Qiu M. Dual origin of spinal oligodendrocyte progenitors and evidence for the cooperative role of Olig2 and Nkx2.2 in the control of oligodendrocyte differentiation. Development. 2002;129:681–693. doi: 10.1242/dev.129.3.681. [DOI] [PubMed] [Google Scholar]
- Gallo V, Armstrong RC. Developmental and growth factor-induced regulation of nestin in oligodendrocyte lineage cells. J Neurosci. 1995;15:394–406. doi: 10.1523/JNEUROSCI.15-01-00394.1995. [DOI] [PMC free article] [PubMed] [Google Scholar]
- Gallo V, Zhou JM, McBain CJ, Wright P, Knutson PL, Armstrong RC. Oligodendrocyte progenitor cell proliferation and lineage progression are regulated by glutamate receptor-mediated K+ channel block. J Neurosci. 1996;16:2659–2670. doi: 10.1523/JNEUROSCI.16-08-02659.1996. [DOI] [PMC free article] [PubMed] [Google Scholar]
- Ghiani C, Gallo V. Inhibition of cyclin E-cyclin-dependent kinase 2 complex formation and activity is associated with cell cycle arrest and withdrawal in oligodendrocyte progenitor cells. J Neurosci. 2001;21:1274–1282. doi: 10.1523/JNEUROSCI.21-04-01274.2001. [DOI] [PMC free article] [PubMed] [Google Scholar]
- Ghiani CA, Eisen AM, Yuan X, DePinho RA, McBain CJ, Gallo V. Neurotransmitter receptor activation triggers p27(Kip1)and p21(CIP1) accumulation and G1 cell cycle arrest in oligodendrocyte progenitors. Development. 1999a;126:1077–1090. doi: 10.1242/dev.126.5.1077. [DOI] [PubMed] [Google Scholar]
- Ghiani CA, Yuan X, Eisen AM, Knutson PL, DePinho RA, McBain CJ, Gallo V. Voltage-activated K+ channels and membrane depolarization regulate accumulation of the cyclin-dependent kinase inhibitors p27(Kip1) and p21(CIP1) in glial progenitor cells. J Neurosci. 1999b;19:5380–5392. doi: 10.1523/JNEUROSCI.19-13-05380.1999. [DOI] [PMC free article] [PubMed] [Google Scholar]
- Gow A, Friedrich VL, Jr, Lazzarini RA. Myelin basic protein gene contains separate enhancers for oligodendrocyte and Schwann cell expression. J Cell Biol. 1992;119:605–616. doi: 10.1083/jcb.119.3.605. [DOI] [PMC free article] [PubMed] [Google Scholar]
- Huang Z, Tang XM, Cambi F. Down-regulation of the retinoblastoma protein (rb) is associated with rat oligodendrocyte differentiation. Mol Cell Neurosci. 2002;19:250–262. doi: 10.1006/mcne.2001.1077. [DOI] [PubMed] [Google Scholar]
- Hudson L. Control of gene expression by oligodendrocytes. In: Jessen KR, Richardson WD, editors. Glial cell development. New York: Oxford UP; 2001. pp. 209–221. [Google Scholar]
- Kan L, Israsena N, Zhang Z, Hu M, Zhao LR, Jalali A, Sahni V, Kessler JA. Sox1 acts through multiple independent pathways to promote neurogenesis. Dev Biol. 2004;269:580–594. doi: 10.1016/j.ydbio.2004.02.005. [DOI] [PubMed] [Google Scholar]
- Kanai Y, Kanai-Azuma M, Noce T, Saido TC, Shiroishi T, Hayashi Y, Yazaki K. Identification of two Sox17 messenger RNA isoforms, with and without the high mobility group box region, and their differential expression in mouse spermatogenesis. J Cell Biol. 1996;133:667–681. doi: 10.1083/jcb.133.3.667. [DOI] [PMC free article] [PubMed] [Google Scholar]
- Kanai-Azuma M, Kanai Y, Gad JM, Tajima Y, Taya C, Kurohmaru M, Sanai Y, Yonekawa H, Yazaki K, Tam PP, Hayashi Y. Depletion of definitive gut endoderm in Sox17-null mutant mice. Development. 2002;129:2367–2379. doi: 10.1242/dev.129.10.2367. [DOI] [PubMed] [Google Scholar]
- Kessaris N, Fogarty M, Iannarelli P, Grist M, Wegner M, Richardson WD. Competing waves of oligodendrocytes in the forebrain and postnatal elimination of an embryonic lineage. Nat Neurosci. 2006;9:173–179. doi: 10.1038/nn1620. [DOI] [PMC free article] [PubMed] [Google Scholar]
- Levi G, Gallo V, Ciotti MT. Bipotential precursors of putative fibrous astrocytes and oligodendrocytes in rat cerebellar cultures express distinct surface features and “neuron-like” GABA transport. Proc Natl Acad Sci USA. 1986;83:1504–1508. doi: 10.1073/pnas.83.5.1504. [DOI] [PMC free article] [PubMed] [Google Scholar]
- Marin-Husstege M, Muggironi M, Liu A, Casaccia-Bonnefil P. Histone deacetylase activity is necessary for oligodendrocyte lineage progression. J Neurosci. 2002;22:10333–10345. doi: 10.1523/JNEUROSCI.22-23-10333.2002. [DOI] [PMC free article] [PubMed] [Google Scholar]
- McCarthy KD, de Vellis J. Preparation of separate astroglial and oligodendroglial cell cultures from rat cerebral tissue. J Cell Biol. 1980;85:890–902. doi: 10.1083/jcb.85.3.890. [DOI] [PMC free article] [PubMed] [Google Scholar]
- McKinnon RD, Matsui T, Dubois-Dalcq M, Aaronson SA. FGF modulates the PDGF-driven pathway of oligodendrocyte development. Neuron. 1990;5:603–614. doi: 10.1016/0896-6273(90)90215-2. [DOI] [PubMed] [Google Scholar]
- Miller RH. Regulation of oligodendrocyte development in the vertebrate CNS. Prog Neurobiol. 2002;67:451–467. doi: 10.1016/s0301-0082(02)00058-8. [DOI] [PubMed] [Google Scholar]
- Montague P, Dickinson PJ, McCallion AS, Stewart GJ, Savioz A, Davies RW, Kennedy PGE, Griffiths IR. Developmental expression of the murine MOBP gene. J Neurosci Res. 1997;49:133–143. doi: 10.1002/(sici)1097-4547(19970715)49:2<133::aid-jnr2>3.0.co;2-a. [DOI] [PubMed] [Google Scholar]
- Natale JE, Ahmed F, Cernak I, Stoica B, Faden AI. Gene expression profile changes are commonly modulated across models and species after traumatic brain injury. J Neurotrauma. 2003;20:907–927. doi: 10.1089/089771503770195777. [DOI] [PubMed] [Google Scholar]
- Natale JE, Knight JB, Cheng Y, Rome JE, Gallo V. Metallothionein I and II mitigate age-dependent secondary brain injury. J Neurosci Res. 2004;78:303–314. doi: 10.1002/jnr.20265. [DOI] [PubMed] [Google Scholar]
- Nelson WJ, Nusse R. Convergence of Wnt, beta-catenin, and cadherin pathways. Science. 2004;303:1483–1487. doi: 10.1126/science.1094291. [DOI] [PMC free article] [PubMed] [Google Scholar]
- Nielsen JA, Berndt JA, Hudson LD, Armstrong RC. Myelin transcription factor 1 (Myt1) modulates the proliferation and differentiation of oligodendrocyte lineage cells. Mol Cell Neurosci. 2004;25:111–123. doi: 10.1016/j.mcn.2003.10.001. [DOI] [PubMed] [Google Scholar]
- Noble M. Precursor cell transitions in oligodendrocyte development. J Cell Biol. 2000;148:839–842. doi: 10.1083/jcb.148.5.839. [DOI] [PMC free article] [PubMed] [Google Scholar]
- Nowakowski RS, Lewin SB, Miller MW. Bromodeoxyuridine immunohistochemical determination of the lengths of the cell cycle and the DNA-synthetic phase for an anatomically defined population. J Neurocytol. 1989;18:311–318. doi: 10.1007/BF01190834. [DOI] [PubMed] [Google Scholar]
- Peirano RI, Wegner M. The glial transcription factor Sox10 binds to DNA both as monomer and dimer with different functional consequences. Nucleic Acids Res. 2000;28:3047–3055. doi: 10.1093/nar/28.16.3047. [DOI] [PMC free article] [PubMed] [Google Scholar]
- Peirano RI, Goerich DE, Riethmacher D, Wegner M. Protein zero gene expression is regulated by the glial transcription factor Sox10. Mol Cell Biol. 2000;20:3198–3209. doi: 10.1128/mcb.20.9.3198-3209.2000. [DOI] [PMC free article] [PubMed] [Google Scholar]
- Richardson WD, Kessaris N, Pringle N. Oligodendrocyte wars. Nat Rev Neurosci. 2006;7:11–18. doi: 10.1038/nrn1826. [DOI] [PMC free article] [PubMed] [Google Scholar]
- Rogister B, Ben-Hur T, Dubois-Dalcq M. From neural stem cells to myelinating oligodendrocytes. Mol Cell Neurosci. 1999;14:287–300. doi: 10.1006/mcne.1999.0790. [DOI] [PubMed] [Google Scholar]
- Rowitch DH. Glial specification in the vertebrate neural tube. Nat Rev Neurosci. 2004;5:409–419. doi: 10.1038/nrn1389. [DOI] [PubMed] [Google Scholar]
- Sambrook J, Gething MJ. Protein structure. Chaperones, paperones. Nature. 1989;342:224–225. doi: 10.1038/342224a0. [DOI] [PubMed] [Google Scholar]
- Sandberg M, Källström M, Muhr J. Sox21 promotes the progression of vertebrate neurogenesis. Nat Neurosci. 2005;8:995–1001. doi: 10.1038/nn1493. [DOI] [PubMed] [Google Scholar]
- Shen S, Li J, Casaccia-Bonnefil P. Histone modifications affect timing of oligodendrocyte progenitor differentiation in the developing rat brain. J Cell Biol. 2005;169:577–589. doi: 10.1083/jcb.200412101. [DOI] [PMC free article] [PubMed] [Google Scholar]
- Shtutman M, Zhurinsky J, Simcha I, Albanese C, D'Amico M, Pestell R, Ben-Ze'ev A. The cyclin D1 gene is a target of the beta-catenin/LEF-1 pathway. Proc Natl Acad Sci USA. 1999;96:5522–5527. doi: 10.1073/pnas.96.10.5522. [DOI] [PMC free article] [PubMed] [Google Scholar]
- Sinner D, Rankin S, Lee M, Zorn AM. Sox17 and beta-catenin cooperate to regulate the transcription of endodermal genes. Development. 2004;131:3069–3080. doi: 10.1242/dev.01176. [DOI] [PubMed] [Google Scholar]
- Stolt CC, Rehberg S, Ader M, Lommes P, Riethmacher D, Schachner M, Bartsch U, Wegner M. Terminal differentiation of myelin-forming oligodendrocytes depends on the transcription factor Sox10. Genes Dev. 2002;16:165–170. doi: 10.1101/gad.215802. [DOI] [PMC free article] [PubMed] [Google Scholar]
- Stolt CC, Lommes P, Sock E, Chaboissier MC, Schedl A, Wegner M. The Sox9 transcription factor determines glial fate choice in the developing spinal cord. Genes Dev. 2003;17:1677–1689. doi: 10.1101/gad.259003. [DOI] [PMC free article] [PubMed] [Google Scholar]
- Stolt CC, Lommes P, Friedrich RP, Wegner M. Transcription factors Sox8 and Sox10 perform non-equivalent roles during oligodendrocyte development despite functional redundancy. Development. 2004;131:2349–2358. doi: 10.1242/dev.01114. [DOI] [PubMed] [Google Scholar]
- Stolt CC, Schmitt S, Lommes P, Sock E, Wegner M. Impact of transcription factor Sox8 on oligodendrocyte specification in the mouse embryonic spinal cord. Dev Biol. 2005;281:309–317. doi: 10.1016/j.ydbio.2005.03.010. [DOI] [PubMed] [Google Scholar]
- Takahashi T, Nowakowski RS, Caviness VS., Jr The cell cycle of the pseudostratified ventricular epithelium of the embryonic murine cerebral wall. J Neurosci. 1995;15:6046–6057. doi: 10.1523/JNEUROSCI.15-09-06046.1995. [DOI] [PMC free article] [PubMed] [Google Scholar]
- Takash W, Canizares J, Bonneaud N, Poulat F, Mattei MG, Jay P, Berta P. SOX7 transcription factor: sequence, chromosomal localisation, expression, transactivation and interference with Wnt signalling. Nucleic Acids Res. 2001;29:4274–4283. doi: 10.1093/nar/29.21.4274. [DOI] [PMC free article] [PubMed] [Google Scholar]
- Tetsu O, McCormick F. Beta-catenin regulates expression of cyclin D1 in colon carcinoma cells. Nature. 1999;398:422–426. doi: 10.1038/18884. [DOI] [PubMed] [Google Scholar]
- Tokumoto YM, Durand B, Raff MC. An analysis of the early events when oligodendrocyte precursor cells are triggered to differentiate by thyroid hormone, retinoic acid, or PDGF withdrawal. Dev Biol. 1999;213:327–339. doi: 10.1006/dbio.1999.9397. [DOI] [PubMed] [Google Scholar]
- Tokumoto YM, Tang DG, Raff MC. Two molecularly distinct intracellular pathways to oligodendrocyte differentiation: role of a p53 family protein. EMBO J. 2001;20:5261–5268. doi: 10.1093/emboj/20.18.5261. [DOI] [PMC free article] [PubMed] [Google Scholar]
- Tokumoto YM, Apperly JA, Gao FB, Raff MC. Posttranscriptional regulation of p18 and p27 Cdk inhibitor proteins and the timing of oligodendrocyte differentiation. Dev Biol. 2002;245:224–234. doi: 10.1006/dbio.2002.0626. [DOI] [PubMed] [Google Scholar]
- Tumor Analysis Best Practices Working Group. Expression profiling: best practices for data generation and interpretation in clinical trials. Nat Rev Genet. 2004;5:229–237. doi: 10.1038/nrg1297. [DOI] [PubMed] [Google Scholar]
- Vallstedt A, Klos JM, Ericson J. Multiple dorsoventral origins of oligodendrocyte generation in the spinal cord and hindbrain. Neuron. 2005;45:55–67. doi: 10.1016/j.neuron.2004.12.026. [DOI] [PubMed] [Google Scholar]
- Wegner M. Transcriptional control in myelinating glia: the basic recipe. Glia. 2000;29:118–123. [PubMed] [Google Scholar]
- Wegner M. Expression of transcription factors during oligodendroglial development. Microsc Res Tech. 2001;52:746–752. doi: 10.1002/jemt.1059. [DOI] [PubMed] [Google Scholar]
- Wegner M, Stolt CC. From stem cells to neurons and glia: a Soxist's view of neural development. Trends Neurosci. 2005;28:583–588. doi: 10.1016/j.tins.2005.08.008. [DOI] [PubMed] [Google Scholar]
- Wolswijk G. Oligodendrocyte precursor cells in chronic multiple sclerosis lesions. Mult Scler. 1997;3:168–169. doi: 10.1177/135245859700300221. [DOI] [PubMed] [Google Scholar]
- Wolswijk G. Chronic stage multiple sclerosis lesions contain a relatively quiescent population of oligodendrocyte precursor cells. J Neurosci. 1998;18:601–609. doi: 10.1523/JNEUROSCI.18-02-00601.1998. [DOI] [PMC free article] [PubMed] [Google Scholar]
- Wolswijk G. Oligodendrocyte survival, loss and birth in lesions of chronic-stage multiple sclerosis. Brain. 2000;123:105–115. doi: 10.1093/brain/123.1.105. [DOI] [PubMed] [Google Scholar]
- Wolswijk G. Oligodendrocyte precursor cells in the demyelinated multiple sclerosis spinal cord. Brain. 2002;125:338–349. doi: 10.1093/brain/awf031. [DOI] [PubMed] [Google Scholar]
- Yuan X, Eisen AM, McBain CJ, Gallo V. A role for glutamate and its receptors in the regulation of oligodendrocyte development in cerebellar tissue slices. Development. 1998;125:2901–2914. doi: 10.1242/dev.125.15.2901. [DOI] [PubMed] [Google Scholar]
- Yuan X, Chittajallu R, Belachew S, Anderson S, McBain CJ, Gallo V. Expression of the green fluorescent protein in the oligodendrocyte lineage: a transgenic mouse for developmental and physiological studies. J Neurosci Res. 2002;70:529–545. doi: 10.1002/jnr.10368. [DOI] [PubMed] [Google Scholar]
- Zezula J, Casaccia-Bonnefil P, Ezhevsky SA, Osterhout DJ, Levine JM, Dowdy SF, Chao MV, Koff A. p21cip1 is required for the differentiation of oligodendrocytes independently of cell cycle withdrawal. EMBO Rep. 2001;2:27–34. doi: 10.1093/embo-reports/kve008. [DOI] [PMC free article] [PubMed] [Google Scholar]
- Zorn AM, Barish GD, Williams BO, Lavender P, Klymkowsky MW, Varmus HE. Regulation of Wnt signaling by Sox proteins: XSox17 alpha/beta and XSox3 physically interact with beta-catenin. Mol Cell. 1999;4:487–498. doi: 10.1016/s1097-2765(00)80200-2. [DOI] [PubMed] [Google Scholar]