

SUMMARY
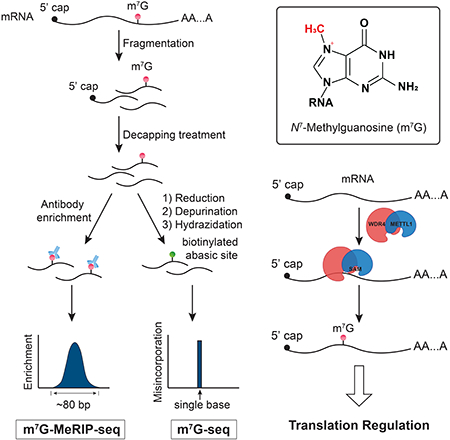
N7-methylguanosine (m7G) is a positively-charged, essential modification at the 5’ cap of eukaryotic messenger RNA (mRNA), regulating mRNA export, translation, and splicing. m7G also occurs internally within transfer RNA (tRNA) and ribosomal RNA (rRNA), but its existence and distribution within eukaryotic mRNA remains to be investigated. Here, we show the presence of internal m7G sites within mammalian mRNA. We then performed transcriptome-wide profiling of internal m7G methylome using m7G -MeRIP-seq. To map this modification at base resolution, we developed a chemical-assisted sequencing approach that selectively converts internal m7G sites into abasic sites, inducing misincorporation at these sites during reverse transcription. This base-resolution m7G-seq enabled transcriptome-wide mapping of m7G in human tRNA and mRNA, revealing distribution features of the internal m7G methylome in human cells. We also identified METTL1 as a methyltransferase that installs a subset of m7G within mRNA and showed that internal m7G methylation could affect mRNA translation.
eTOC Blurb
Zhang et al. discovered the presence of internal N7-methylguanosine (m7G) within mammalian mRNA. Both antibody-based and chemical-assisted methods were developed for transcriptome-wide mapping of internal m7G, with the latter reaching single-base resolution. METTL1/WDR4 was identified as a writer complex that installs a subset of m7G on mRNA, which affects translation.
Graphical Abstract
INTRODUCTION
Modifications on messenger RNA contribute to post-transcriptional regulation of mRNA fate (Zhao et al., 2017; Gilbert et al., 2016; Helm et al., 2017; Frye et al., 2018). While N6-methyladenosine (m6A) is widely observed to impact mRNA metabolism in mammals (Roundtree et al., 2017), we have also reasoned that positively charged base modifications such as N1-methyladenosine (m1A) could tune RNA secondary structures or protein-RNA interactions within mRNA through a combination of electrostatic and steric effects (Dominissini et al., 2016; Li et al., 2016). Another positively charged modification is the ubiquitous mRNA cap N7-methylguanosine (m7G) (Figure 1A) (Furuichi, 2015). m7G is installed at the 5’ cap co-transcriptionally during transcription initiation (Cowling, 2009). This essential cap modification stabilizes transcripts against exonucleolytic degradation (Furuichi et al., 1977; Shimotohno et al., 1977; Murthy et al., 1991) and modulates nearly every stage of the mRNA life cycle, including transcription elongation (Pei and Shuman, 2002), pre-mRNA splicing (Konarska et al., 1984; Lindstrom et al., 2003), polyadenylation (Drummond et al., 1985), nuclear export (Lewis and Izaurralde, 1997), and translation (Muthukrishnan et al., 1975).
Figure 1. Quantitative Detection of Internal m7G Sites in Mammalian Messenger RNA and MeRIP-seq Profile in Mammalian Cells.

(A) Chemical structure of N7-methylguanosine (m7G).
(B) LC-MS/MS quantification of m7G/G levels in polyA+ RNA (HEK293T cells) using a three-step RNA digestion (red) or a two-step digestion (blue). Mean values ± s.d. are shown, n = 3.
(C) LC-MS/MS quantification of m7G/G and m6A/A levels in cap-depleted polyA+ mRNA isolated from human and mouse cells. Mean values ± s.d. are shown, n = 3.
(D) LC-MS/MS quantification of m7G/G, Gm/G, m6A/A, Am/A, m1A/A levels showing enrichment of m7G after immunoprecipitation using anti-m7G specific antibody (MBL), without enriching other modifications. Cap-depleted polyA+ mRNA (HEK293T cells) was used as the input control. Mean values ± s.d. are shown, n = 3.
(E) The overlap of m7G-MeRIP-seq m7G peaks among three human cell lines (left) and two mouse cell lines (right) (fold change (FC) ≥ 3, false discovery rate (FDR) ≤ 0.05, FPKM ≥ 1.0).
(F) The percentage of methylated genes with 1, 2, 3, 4 or 5+ peaks per gene in the indicated human and mouse cell types.
(G) Top three motifs identified with m7G-MeRIP-seq by HOMER software.
Besides as a part of the cap structure, m7G also exists internally within transfer RNA (Guy and Phizicky, 2014) and ribosomal RNA (Sloan et al., 2017). m7G is found at position 46 of yeast and human cytoplasmic tRNAs, installed by the heterodimers Trm8-Trm82 and METTL1-WDR4, in yeast and mammals respectively; it also occurs at position 1639 of human 18S rRNA, installed by human WBSCR22. These internal m7G modifications impacts RNA processing and function and have been suggested associated with human diseases. WBSCR22 (Haag et al., 2015) is involved in late nuclear pre-ribosomal RNA processing and the biosynthesis of the 40S ribosomal subunit (Õunap et al., 2013; Létoquart et al., 2014). Mutations of the m7G46 methyltransferase complex (Trm8-Trm82) in yeast (Leulliot et al., 2008; Alexandrov et al., 2002) resulted in rapid degradation of tRNAs, followed by growth deficiency (Alexandrov et al., 2005); mutations in the human homologs (METTL1-WDR4) are associated with microcephalic primordial dwarfism (Shaheen et al., 2015).
Here, we demonstrate the presence of internal m7G sites within mammalian mRNA via mass spectrometry quantification and m7G-MeRIP-seq, a high-throughput sequencing approach based on antibody-based immunoprecipitation. To more accurately map this modification transcriptome-wide, we developed a chemical-assisted sequencing method that takes advantage of the unique chemical reactivity of m7G, which eventually induces misincorporation at m7G sites during reverse transcription and thus enables us to reveal distribution features of the m7G methylome in human cells at base resolution. We found internal sites on human mRNA that appear to be highly m7G modified. We also identified METTL1 as a methyltransferase that installs a subset of m7G within mRNA and showed that internal m7G methylation could impact mRNA translation. Collectively, we present a method to precisely map the m7G methylomes in RNA and obtained base-resolution m7G maps in human mRNA, suggesting potential functional roles of internal m7G within the mammalian mRNA.
DESIGN
We started with quantitative detection by mass spectrometry to investigate the existence of internal m7G in mammalian mRNA. The m7G/G level was found to be around 0.02%–0.05% in mRNAs isolated from mammalian cells after the removal of the cap m7G (Figure 1 and Figure S1). To map the distribution of internal m7G sites along mRNA, we employed specific antibody for m7G and performed MeRIP-seq in human and mouse cell lines and observed similar distribution patterns (Figure 2 and Figure S2). In order to obtain higher resolution mapping of m7G down to single-base resolution, eliminate non-specific signals introduced by antibody pulldown, and estimate the exact methylation fraction at each modified site, we designed a chemical-assisted method that takes advantage of the unique chemical reactivity of m7G. The positive charge on m7G makes it more susceptible to chemical reduction. The reduced m7G is prone to depurination and can be converted to an abasic site (Figure 3A), which induces misincorporation upon reverse transcription. The misincorporation site and level can be used to determine the m7G site and its potential modification fraction using high-throughput sequencing (Figure 3 and Method S1).
Figure 2. m7G-MeRIP-seq Mapped Transcriptome-wide Distributions of Internal m7G Sites in Human and Mouse Cell Lines.

(A) The percentages of methylated genes out of all genes (within one expression bin) in HepG2 and mESC cells exhibit a progressively larger fraction as gene expression level increases (the expression level is equally divided into ten bins in a range of 1≤FPKM≤50).
(B) Pie charts presenting the fraction of m7G peaks in each of three transcript segments in HeLa and MEF cells.
(C) Metagene profiles of the distribution of the antibody-enriched m7G peaks in HeLa cells along a normalized transcript composed of three rescaled non-overlapping segments (5’ UTR, CDS, and 3’ UTR)(fold change (FC) ≥ 4, false discovery rate (FDR) ≤ 0.05, FPKM ≥ 1.0).
(D) Human–mouse m7G conservation shown as percent of orthologous positions versus shared m7G peaks according to their locations in the transcript (between HepG2 cells and mESC cells).
(E) Gene ontology (GO) analysis of internal m7G-methylated transcripts relative to all adequately expressed genes in HEK293T and mESC cells (FPKM ≥ 1.0).
Figure 3. m7G-seq Chemical Principle and Sequencing Protocol Design.

(A) Schematic diagram showing the chemical reactivity of m7G under reduction and biotin labeling conditions in m7G-seq. Only the reduced form of m7G can generate biotinylated AP sites with biotin hydrazide under mildly acidic conditions. Biotinylated AP sites could induce misincorporation when using HIV reverse transcriptase.
(B) Schematic outline of m7G-seq. RNA fragments are firstly ligated at 3’ end before the chemical reactions. They, whether undergo biotin pulldown or not, are then subject to reverse transcription before 3’ adaptor ligation to the resulting cDNA. Only those fragments with internal m7G sites are expected to generate misincorporation during reverse transcription that can be further detected using high-throughput sequencing.
RESULTS
Quantitative Detection of Internal N7-methylguanosine Sites within Mammalian mRNA
To assess the possible presence of m7G in mRNA internally, we employed a liquid chromatography-tandem mass (LC-MS/MS) method to quantify the modification level of thoroughly purified poly(A)-tailed RNA (with two rounds of poly(A) enrichment followed by rRNA depletion). Aiming to monitor m7G signals from both internal and 5’-cap regions, we applied a 3-step method for RNA digestion (Chu et al., 2018), which includes the endonuclease cleavage (nuclease S1) followed by a treatment with phosphodiesterase I to completely expose m7G signal from the cap structure (Figure S1A). We observed an m7G/G level of approximately 0.45% in HEK293T cells (“polyA+ RNA” on the left in Figure 1B), including m7G sites at both the 5’-cap and internal regions. We then removed the cap using tobacco decapping enzyme to specifically quantify the internal m7G level (see STAR Methods). The m7G level decreased dramatically after the first round of decapping treatment but remained at a stable level around 0.03% consistently, which did not diminish after two more rounds of cap removal (Figure 1B). We also performed RNA digestion in a two-step manner without phosphodiesterase I digestion, and found the m7G level detected was comparable to that after two to three rounds of decapping treatments (“polyA+ RNA” on the right in Figure 1B), which suggests the digestion of mRNA with only endonuclease cleavage (nuclease S1) would not affect cap structure and can ensure reliable exposure of internal m7G level in mRNA. We measured m7G/G levels ranging from approximately 0.02% – 0.05% across several human and mouse cell lines (Figure 1C), which represent roughly 5–10% of the m6A/A ratios in the same cells. Thus, m7G is present internally within mammalian mRNA.
Transcriptome-wide Mapping of Internal N7-methylguanosine with m7G-MeRIP-seq
To study the distribution of internal m7G methylome, we performed m7G-MeRIP-seq to map the transcriptome-wide distributions of internal m7G sites. We first conducted dot blot to characterize that the selected antibody (MBL) binds to m7G specifically over all known methylated G (including m1G, m2G, m22G, and m6G) or unmethylated G (Figure S1B). Then we briefly immunoprecipitated methylated RNA after cap removal (with two rounds of decapping treatments) using the anti-m7G specific antibody (MBL), followed by high-throughput sequencing (Figure S1C). All the sequencing samples for mRNA were prepared from total RNA with two rounds of polyA+ enrichment where tRNAs were depleted and rRNAs were eliminated to below 0.1% of the original abundance (Figure S1D). Based on m7G-MeRIP-seq, we found that m7G was enriched around 12 folds in the anti-m7G antibody-bound fraction, starting with cap-depleted and fragmented poly(A)-tailed RNA from HEK293T cells. In contrast, other known mRNA modifications including m6A, Nm (Gm and Am) or m1A, were not enriched (Figure 1D). By applying m7G-MeRIP-seq to poly(A)-tailed RNA (cap- and rRNA-depleted) from human and mouse cells in two replicates, we identified 7,469, 7,911, 9,243, 6,184 and 6,743 potential internal m7G peaks in HeLa, HEK293T, HepG2, MEF and mES cells, respectively, in adequately expressed transcripts shared in replicates. We detected 3,823 m7G peaks that overlapped in the three human cell lines, indicating a relatively high confidence of antibody enrichment, and 2,217 m7G peaks overlapped in the two mouse cell lines (Figure 1E). About 50% of the methylated transcripts are methylated once, and each of them carries around 1.9 peaks on average (Figure 1F). A statistically significant GA-rich motif was found in the MeRIP-seq peak regions (Figure 1G).
We investigated the distribution of methylated genes (1≤FPKM≤50) in ten averagely divided expression bins. When calculating the percentage ratio of methylated genes versus all genes in each expression decile, the methylated transcripts exhibit a progressively larger fraction as gene expression level increases in both human and mouse cell lines (Figure 2A); we thus excluded the possibility that the increased fractions of the methylated genes are likely due to increased detection of highly expressed genes (Figure S2A). We detected internal m7G peaks in all three transcript segments of 5′ untranslated regions (UTR), coding sequences (CDS), and 3′ UTRs. Similar distribution patterns of internal m7G peaks were observed among all three human cell lines and two mouse cell lines (Figure 2B and Figure S2B), with the same case for the distributions of the genes bearing m7G (Figure S2C). We also plotted the fractions of genes with m7G peaks in each of the segments relative to expression level and found that the transcripts of relatively high expressed genes were more likely to be methylated at CDS and 3’ UTR segments than 5’ UTR (Figure S2D). Meta-gene profiles of internal m7G peaks along mRNA demonstrated a major accumulation area located at 3’ UTR and a minor one within 5’ UTR (Figure 2C). Although m7G is enriched at the 3’ UTR, there is nearly no overlap between m6A and m7G methylated peaks in HeLa cell line (Figure S2E). Furthermore, we investigated the peak conservation between human and mouse, and found that 2,557 identified m7G peaks in mESC could be mapped faithfully to adequately expressed orthologous in human HepG2 cells; 1,016 of them had an m7G peak at the orthologous positions, representing 39.7% overall conservation. The CDS regions exhibited the highest degree of conservation with around 41–43% conserved peaks, compared to other gene segments with nearly 15–20% conservation (Figure 2D, and Figure S2F). Gene ontology (GO) analysis revealed that the methylated genes are enriched under GO terms related to RNA splicing, mRNA processing, cell-cell adhesion and cell division (Figure 2E).
Design and Development of m7G-seq at Base Resolution
To achieve mapping of m7G at base-resolution with an orthogonal approach, as has been done for other modifications (Li et al., 2017), we developed m7G-seq by taking advantage of the unique chemical reactivity of m7G in a reduction-induced depurination reaction (Figure 3A). The positive charge on the five-membered ring makes m7G (3a–1 in Figure 3A) especially susceptible to NaBH4-mediated reduction, which eliminates the aromaticity of the five-membered ring attached to the ribose without affecting unmodified G (Wintermeyer and Zachau, 1970). Subsequent heating (55 °C) at pH 4.5 induces depurination of the reduced m7G alone (3a–2 in Figure 3A) and generates an RNA abasic site (3a–3), which can be further captured by biotin-ligated hydrazide to yield a biotinylated RNA in a one-pot reaction (3a–4). After pull-down and reverse transcription using HIV reverse transcriptase, the biotinylated sites would be mutated to predominantly T as well as other bases (Küpfer and Leumann, 2005; Küpfer and Leumann, 2007), and thus we can identify the internal m7G sites based on these mutations at single-base resolution.
We validated the m7G-seq assay including the chemical reactions as well as the pull-down enrichment step using model RNAs (Figure S3A). 125-mer RNA probes with a single G (unmodified or m7G modified) incorporated site-specifically were synthesized and subjected to dephosphorylation, reduction and biotinylation consecutively. Dephosphorylation was necessary to avoid potential side reactions of free phosphate groups (at the 5’ end of the RNA) with biotin-ligated reagents. After biotin pull-down and reverse transcription, the oligos with m7G modification presented a highly enriched signal compared with the unmodified ones at full length (Figure S3B), which indicated that the reverse transcriptase could read through the biotinylated abasic sites with misincorporation at those sites as demonstrated by Sanger sequencing of the further PCR-amplified products (Figure S3C).
We then optimized the chemical assay to be compatible with library construction and sequencing (Figure 3B). mRNA fragments (around 60–80 mer) were subject to cap removal and PNK end repair to leave the hydroxyl group at the 3’ end. Then dephosphorylation further ensured the depletion of phosphate groups at both ends. After the 3’ adapter installation to fragmented poly(A)-tailed RNA, the ligated mRNA fragments underwent a two-step chemical treatment before further enrichment by the biotin tag. We then performed the reverse transcription followed by cDNA 3’-adaptor ligation and PCR amplification (see STAR Methods). In this way, as m7G sites were converted to biotinylated abasic sites, we can observe misincorporation at the specific sites that were further enriched in the pull-down samples compared with input samples and those before biotin enrichment. To evaluate this method before applying it to mRNA, we designed a 60-mer RNA oligo sequence which is similar to mRNA fragment size and bears one single fully methylated m7G in the AAGAU sequence. After applying the aforementioned protocol, we observed substantial mutations at the modified site after generation of the abasic site (~28% overall mutation rate), and higher mutation rates after further pull-down enrichment (~51% overall mutation rate), whereas the adjacent bases did not exhibit any misincorporation above background signals (Figure S3D). Note that the chemical reduction and depurination reactions are not stoichiometric with fractions of m7G escaping reduction and depurination. The pull-down step further enriches modified abasic sites, leading to increased mutation rates.
While the biotin-based enrichment allows confident assignments of the modified m7G sites, the modification fraction could in principle be measured using the misincorporation rate before enrichment and correlate with a calibration curve generated using RNA probes that bear m7G at different modification fractions and undergo the same chemical treatment and high-throughput sequencing. A series of probes with the same AAGAU sequence but different m7G/G ratios was prepared from in vitro transcription and then subjected to the base-resolution m7G-seq protocol (Figure 3B). A calibration curve was generated that can normalize the misincorporation rate (before enrichment) to the methylation status, which can then be used to estimate internal m7G methylation fraction in biological RNA samples (Figure S3E).
Single-Nucleotide Resolution m7G Maps in Human rRNA and tRNAs
We first applied m7G-seq to rRNA and tRNAs isolated from human cells and examined the known m7G1639 site in human rRNA (Haag et al., 2015). We observed highly increased mutation only at the known m7G site. With reduction and biotinylation, we could obtain a misincorporation pattern of 18.0% G→T, 9.9% G→C, and 2.8% G→A (~31% overall mutation rate) at m7G1639 site in HeLa rRNA; after pull-down enrichment of biotinylated fragments, we detected a distribution of misincorporation with 38.2% G→T, 13.0% G→C and 3.7% G→A (~55% overall mutation rate) (Figure S4A), implying a predominant G to T or C mutation pattern induced by the chemical treatment followed by RT using HIV reverse transcriptase. The overall mutation rate is around 30% at the m7G1639 site before enrichment across all three human cell lines (Figure S4A), suggesting nearly 100% modification at this site (Figure S3E).
Our method also identified m7G sites in 22 human tRNAs at the position 46 (Figure 4A, Figure S4B, and S4C). These tRNAs, with different sequence contexts around m7G46, varied in the misincorporation rate in a range of 5–31% before biotin enrichment, suggesting an estimated high methylation status ranging from 60%–100% (Figure 4A, 4B, and Figure S3E). Our observation of m7G modification in tRNA is also consistent with a recent report based on a cleavage assay (Lin et al., 2018).
Figure 4. Base-resolution Mappings of m7G in Human rRNA and tRNAs by m7G-seq.

(A) The misincorporation rates (without enrichment) for m7G1639 in human 18S ribosomal RNA and 22 cytoplasmic tRNAs containing internal m7G46 are shown in bars for three human cell lines. Mean values ± s.d. are shown, n = 2. The corresponding estimated methylation levels are shown in dot.
(B) The misincorporation distribution pattern (without enrichment) shown for different internal m7G motifs in tRNAs and 18S rRNA. Mean values ± s.d. are shown, n = 2.
(C) The misincorporation distribution patterns (input, before pulldown and after pulldown) for other G modifications in tRNAs. Mean values ± s.d. are shown, n = 2.
(D) The misincorporation levels for m7G46 in 22 human tRNAs upon METTL1 transient knockdown vs control in HeLa cells are shown in bars. Mean values ± s.d. are shown, n = 2. P values were determined using two-tailed Student’s t test for paired samples. *p < 0.05; **p < 0.01. The corresponding estimated methylation levels are shown in dots.
(E) The misincorporation levels for m7G46 in 22 human tRNAs upon METTL1 stable knockdown vs control in HepG2 cells are shown in bars. Mean values ± s.d. are shown, n = 2. P values were determined as Figure 4D. The corresponding estimated methylation levels are shown in dots.
As tRNAs tend to be heavily modified, we also characterized various mutation patterns of other G modifications to avoid potential mis-assignments (Figure 4C). The dimethylated m22G26, which blocks Watson-Crick base pairing, showed high misincorporation rates throughout all three samples with a majority of G→T mutation up to around 90% as expected; however, the monomethylated m2G10 showed relatively low mutation rates below 5%. When we examined m1G, the misincorporation patterns differed based on the modification locations. While both m1G9 and m1G37 displayed the overall mutation rate around 40–60%, m1G9 tended to give higher G→T mutation but m1G37 caused more G→C mutation in our assay. Importantly, none of these G methylations showed an increased misincorporation after reduction and depurination treatment compared with m7G; we observed nearly no mutation in input samples, but high mutation in samples before enrichment and after pull-down only for m7G. Therefore, we compare mutation rates of Gs before and after our chemical manipulation as a criterion to identify m7G sites in our later analysis to exclude other guanosine modifications. As O6-methylguanosine (m6G) was also observed in both DNA and RNA as a highly mutagenic base (Hudson et al., 2015), we constructed a 60-mer probe with one O6-methylguanosine (m6G) in the middle by in vitro transcription. We subjected this probe to m7G-seq treatment and high-throughput sequencing. The m6G sited exhibited a mutation pattern with mainly G→A mutation (~7.5%) in both input and before pulldown samples but could not be enriched with biotin pulldown (Figure S4D). Therefore, we can further exclude m6G in m7G-seq.
Because mammalian m7G46 sites in tRNAs are known to be installed by the METTL1/WDR4 complex (Lin et al., 2018; Alexandrov et al., 2002; Cartlidge et al., 2005). We applied m7G-seq to METTL1 knockdown cells with both transient knockdown (siRNA) in HeLa cells and stable knockdown (shRNA) in HepG2 cells to further validate the applicability of our method. Both siMETTL1 and shMETTL1 cells showed obvious decreases in misincorporation rate at all m7G46 sites (Figure 4D and 4E), showing reduced m7G modification fraction at these sites with METTL1 knockdown. Interestingly, the extent of reduction of m7G is not universal with METTL1 knockdown: while tRNAAla(UGC) and tRNAThr(UGU) showed nearly 30% decreases in the methylation level, tRNAPro(HGG) and tRNAVal(AAC) only showed a few percent m7G decreases. Either METTL1/WDR4 has preferential tRNA targets or there could be additional m7G methyltransferase(s) that could compensate m7G methylation by METTL1, which should be investigated in the future.
Single-Nucleotide Resolution mRNA m7G Methylomes
We next applied m7G-seq without pull-down enrichment to mRNAs purified from HeLa and HepG2 cells, as an attempt to identify frequently methylated sites. We used 3% mutation rate above background input mutation as a cutoff and computationally identified over 90 sites in mRNA without the enrichment step; these sites potentially possess estimated methylation levels around or above 20% based on estimations using our calibration curve (Figure S3E) and comparison to tRNAs. We further identified ~50 sites manually with modifications estimated to be around or above 50% (Table S2). These sites showed misincorporation rates and possess m7G methylation levels approaching those in tRNAs (Figure 4 and Figure 5A). Representative mRNA internal m7G sites conserved in HeLa and HepG2 cells are shown in Figure 5A. The AG(m7G)A motif shown in CNOT2 (5’ UTR) and EIF2S2 (CDS) resembles the same motif for rRNA m7G1639. Our m7G-MeRIP-seq found dominant GA-enriched motif, which was also discovered in a number of purine-enriched region, with GG(m7G)AA in 3’ UTR of GPR107 and UA(m7G)AA in 3’ UTR of RTN4 as examples. We also found motifs such as AUCG(m7G)A and UU(m7G)AU with high modification fractions conserved in both cell lines, suggesting presence of multiple methyltransferases that specifically install these sites.
Figure 5. Single-nucleotide Resolution m7G Maps in Human Messenger RNAs.

(A) Ten representative internal m7G sites shared in both HeLa and HepG2 cells are identified by m7G-seq in replicates (without enrichment). Sequence motifs at base resolution and the estimated methylation levels in two human cell lines are shown.
(B) GO analysis for 801 m7G sites from high confident base-resolution m7G-seq results shared between HeLa and HepG2 cells in replicates as well as overlapping with m7G-MeRIP peaks.
(C) Pie chart showing the fraction of 801 m7G peaks shown in Figure 5B in each of three non-overlapping transcript segments.
(D) Pie chart displaying the fraction of main internal m7G motifs in mRNA based on confident targets shown in Figure 5B.
(E) m7G peak distribution of the top seven m7G motifs in mRNA along a normalized transcript composed of three rescaled segments.
Considering that m7G may play functions at specific cellular locations (i.e. chromatin associated RNA or nascent RNA), we also wanted to identify lowly to moderately modified m7G sites from the whole-cell mRNA and compare with m7G-MeRIP-seq results. We then performed enrichment of the biotin-tagged mRNA fragments obtained from m7G reduction and depurination, followed by reverse transcription using HIV RT enzyme. We used 8.0% mutation rate increase over the background input control as our cutoff because the modified m7G sites show higher mutation rate after enrichment. We identified around 3500 internal mRNA m7G sites in HeLa cells from overlap of two replicates. We then overlaid HeLa m7G sites to those shared in HepG2 replicates and identified 801 overlapped ones (Table S3). Nearly 70% of these 801 single sites overlap with targets revealed from m7G-MeRIP-seq results, showing consistency between two orthogonal approaches. It should be noted that m7G-MeRIP-seq can enrich m7G sites ranging from low modification fraction to high modification fraction, as well as potential non-specific binding. The base resolution m7G-seq utilizes mutation over background input to detect m7G with much higher accuracy, but it may miss most lowly modified sites due to inadequate sequencing depth and our stringent mutation cutoff criterion. HIV reverse transcriptase itself is known to generate baseline mutation rate, thus applying a stringent mutation rate cutoff is important to ensure reliable assignments of m7G sites despite potential loss of lowly modified sites.
We reasoned that some of the m7G sites identified by m7G-seq without overlap with m7G-MeRIP-seq peaks may still be genuine m7G sites. They may exist in structured RNA which hindered the antibody-based pulldown. Nevertheless, to obtain more accurate assignments we decided to assign m7G sites not only shared in two human cell lines but also overlapped with m7G-MeRIP-seq peaks as confident sites (Figure S5A). Gene ontology (GO) analysis uncovered the similar enriched GO terms of cell-cell adhesion and RNA splicing from these 801 sites, which correlates well with the m7G-MeRIP-seq data (Figure 5B).
Around half of the more confident m7G sites or m7G methylated genes exist in CDS, while 5’ UTR showed a little increase in distribution rate, but still lower than that of 3’UTR (Figure 5C and Figure S5B). On average we observed mostly one methylated peak per gene and this is true to all three transcript segments (Figure S5C). The general misincorporation level ranged from 8%−35% after pull-down enrichment (Figure S5D). We then analyzed the sequence motifs of the base-resolution mRNA internal m7G sites. The main motifs were found to be G(m7G)A, A(m7G)A, C(m7G)C, G(m7G)G, C(m7G)U and G(m7G)C, which showed wider variations than those in tRNAs (Figure 5D). We picked up seven representative motifs and plotted them along 5’ UTR, CDS, and 3’ UTR. The G(m7G)G motif appears to be more likely at 3’ UTR, while the C(m7G)C motif accumulates more at 5’ UTRs and barely appears at 3’ UTR (Figure 5E).
A Subset of Internal m7G sites are Installed by METTL1
The similarity of some of the m7G motifs observed within mRNA to the known AG(m7G)H motifs (Okamoto et al., 2004; Lin et al., 2018) identified in tRNAs suggested that the METTL1-WDR4 heterodimer complex, the known tRNA m7G methyltransferase (Alexandrov et al., 2002), might introduce some of these internal m7G modifications in mammalian mRNAs. To test this hypothesis, we knocked down METTL1 in HeLa cells and quantified the corresponding internal m7G level within cap- and rRNA-depleted mRNA. We observed a ~25% reduction of the m7G/G ratio in siMETTL1 cells compared to controls (Figure S6A). To map changes in m7G peaks, we applied m7G-MeRIP-seq to mRNAs isolated from siControl vs. siMETTL1 HeLa cells as well as shControl vs. shMETTL1 HepG2 cells. The knockdown efficiency in both mRNA and protein levels was validated with RT-qPCR and western blotting, respectively (Figure S6B). We uncovered 1,563 altered peaks in transient knockdown cells and 3,939 in stable knockdown ones; in each case, around 74–77% of peaks became hypo-methylated upon METTL1 knockdown (fold change (FC) ≥ 1) (Figure S6C). In these 1,227 hypo-methylated peaks in HeLa cells, a majority were enriched in CDS and 3’ UTR, while METTL1 stable knockdown HepG2 cells showed a high enrichment of these potential METTL1 target m7G peaks in CDS (Figure 6A and Figure S6D). The metagene profile of these hypo-regulated targets (affected by METTL1 knockdown) also demonstrated a broad cumulation near stop codon both in CDS and 3’ UTR (Figure S6E). METTL1-related internal m7G peaks identified in two different cell lines upon knockdown shared similar GA-enrich motifs (Figure 6B) as the top motifs that were also found by m7G-MeRIP-seq (Figure 1G). The METTL1 knockdown resulted in ~54% global reduction of these 1,227 m7G peaks in HeLa cells, and ~61% reduction in HepG2 cells (Figure 6C), with the reduction occurring consistently in all three transcript segments (Figure S6F and S6G).
Figure 6. METTL1 Mediates Internal mRNA m7G Methylation.

(A) Pie chart showing the fraction of hypo-methylated m7G peaks from m7G-MeRIP-seq of siMETTL1 HeLa and shMETTL1 HepG2 cells in each of three non-overlapping transcript segments.
(B) Top two motifs identified from hypo-methylated m7G peaks for siMETTL1 HeLa cells and shMETTL1 HepG2 cells.
(C) A global reduction of m7G-meRIP-seq intensity was observed within hypo-methylated peaks upon METTL1 knockdown. Two sided Mann-Whitney test.
(D) GO analysis for potential METTL1 target transcripts that contains hypo-methylated peaks in siMETTL1 HeLa cells.
(E) Left (light blue): LC-MS/MS results of internal m7G/G levels in HepG2 small RNA (<200 nt) from shControl vs shMETTL1 vs Treated. Right (dark blue): LC-MS/MS results of internal m7G/G levels in HeLa mRNA from siControl vs siMETTL1 vs Treated. Mean values ± s.d. are shown, n = 3.
To further investigate whether the METTL1-WDR4 complex installs m7G onto mRNA, we performed photoactivatable ribonucleoside-enhanced crosslinking and immunoprecipitation (PAR-CLIP) of both proteins. We found that both proteins bind mRNA, with over 35% and around 4% of METTL1-dependent m7G-MeRIP-seq peaks overlapping with WDR4 or METTL1 PAR-CLIP peaks, respectively, while the whole set of HeLa m7G-MeRIP-seq peaks (Figure 1E) exhibits much lower overlap with these CLIP peaks (Figure S6H), implying the existence of other potential mRNA m7G methyltransferases. The observed hypo-methylation upon METTL1 knockdown and the correlation between METTL1 and WDR4 targets suggest that METTL1, together with WDR4, act as a “writer” complex of m7G within mRNA. WDR4 might facilitate RNA binding, with a stronger or direct interaction with RNA as suggested by the larger number of overlapped targets between its PAR-CLIP sites with the METTL1-dependent m7G-MeRIP-seq peaks, whereas METTL1 could serve as the catalytic component for methylation.
Gene Ontology analysis of the 1,227 hypo-methylated transcripts (upon siMETTL1 knockdown) uncovered a potential correlation of m7G methylation with RNA splicing as well as cell adhesion (Figure 6D). We then further conducted biochemistry to treat small RNA fraction (<200 nt; mostly tRNAs) isolated from shMETTL1 and mRNA isolated from siMETTL1 cells, respectively, using the recombinant protein complex of METTL1/WDR4 prepared with the transfection of both FLAG-METTL1 and FLAG-WDR4 plasmids in human HEK293T cells. Substantially elevated m7G/G levels were observed after incubation in the presence of SAM (Figure 6E). The m7G/G level was recovered to 0.8 % when small RNAs from shMETTL1 HepG2 cell were treated with the complex (Figure 6E), confirming tRNA methylation activity of METTL1/WDR4 complex. The mRNA m7G/G ratio went up to ~0.22% compared with the original 0.03% in the input mRNA, indicating in vitro mRNA methylation activity of the same complex. When we treated the same METTL1/WDR4 complex with 12–17 mer RNA probes bearing the consensus motif for m7G we failed to observe any activity (see STAR Methods). We then constructed a 144-mer RNA oligo probe that mimic the sequence of a m7G site in mRNA UTRs, and subjected it to the same biochemistry assay. A m7G/G level of 0.40% was obtained, which afforded 0.26 equivalent of m7G in each probe on average (Figure S6I). These results confirmed the m7G methylation activity of METTL1/WDR4 complex and suggested that METTL1/WDR4 does not work on short RNA probes and may recognize tRNA-like structures in order to mediate m7G methylation on mRNA.
METTL1 Knockdown Decreases Translation Efficiency of m7G-Modified Transcripts
To investigate potential functions of METTL1-mediated internal m7G mRNA methylation, we first assessed mRNA-ribosome association by performing ribosome profiling in HeLa cells transfected by either siMETTL1 or control siRNAs. We sequenced both the input and the ribosome-bound mRNA fragments, and analyzed translation efficiency (ribosome-bound mRNA normalized by the whole cell mRNA level) of five groups of transcripts: 1) 1,437 non-target mRNAs containing m7G-MeRIP-seq peaks that were unaffected by METTL1 knockdown; 2) 972 METTL1 potential target (PT) mRNAs including m7G-MeRIP-seq peaks that were hypomethylated upon METTL1 knockdown; 3) 397 PT mRNAs that overlap with either WDR4 or METTL1 PAR-CLIP peaks; and 4) 101 high confidence PT mRNAs that overlap with m7G base-resolution sites and METTL1/WDR4 PAR-CLIP peaks. We found that METTL1 depletion decreased translation efficiency of all four PT groups, suggesting that loss of METTL1 and thus reduction of internal m7G may suppress translation of some of METTL1 target transcripts relative to non-targets (Figure 7A and 7B, Figure S7A).
Figure 7. Internal m7G Promotes Translation of m7G-modified mRNA.

(A) Cumulative distribution log2-fold changes of the translation efficiency between siMETTL1 and siControl transfection for non-targets (grey), potential targets (METTL1 hypo-methylated targets) (red). P values were calculated from a two-sided Mann-Whitney test compared to non-targets.***p<0.001
(B) Cumulative distribution log2-fold changes of translation efficiency (ratio of ribosome bound fragments to mRNA input) between siMETTL1 and siControl transfection for non-targets (grey), potential targets (red).
(C) Redistribution of representative targets in non-ribosome and polysome portions of mRNPs upon depletion of METTL1 measured by RT-qPCR. DDAH1, SCL20A1, SNAP23, and VCL are potential METTL1 m7G targets, and ACTB is a non-target control. Mean values ± s.d. are shown, n = 2, technical replicates. P values were determined using two-tailed Student’s t test for paired samples. *p < 0.05; **p < 0.01.
We next performed polysome profiling to examine the distribution of translating METTL1 target mRNAs in METTL1-knockdown cells versus control cells. Three groups of mRNA-protein particles (mRNPs) were separated: non-ribosome, 40S-80S, and polysome. Western blotting of each fraction showed that the cytoplasmic METTL1 and WDR4 were distributed mainly in the non-ribosome and 40S mRNPs portions (Figure S7B). We quantified changes in the distribution of specific mRNAs among non-ribosome fractions and polysome fractions using RT-qPCR. Upon METTL1 knockdown, the mRNA levels within polysome fractions decreased for the METTL1 targets (DDAH1, SLC20A1, SNAP23, and VCL), but not for a non-target control (ACTB) (Figure 7C and Figure S7C). These profiling results provided support that the METTL1-dependent internal m7G methylation could promote translation of the corresponding transcripts.
To investigate whether METTL1 knockdown influences the translation of target mRNAs via altered tRNA methylation, we examined the enrichment folds of specific tRNA codons related to m7G-methylated tRNAs within the METTL1 targets (group 2) vs. randomly selected non-targets (Figure S7D). We observed no enrichment of these tRNA codons in METTL1 targets vs. non-targets. These data suggest that METTL1 knockdown could specifically reduce the translation of METTL1 target mRNAs independently of effects on global translation and tRNA methylation.
DISCUSSION
Although m6A is the most prevalent modification in mammalian mRNA (Roundtree et al., 2017; Desrosiers et al., 1974; Fu et al., 2014; Li et al., 2014; Frye et al., 2018), other modifications have been shown to exist in mRNA and play functional roles (Carlile et al., 2014; Schwartz et al., 2014; Li et al., 2015; Dominissini et al., 2016; Li et al., 2016; Safra et al., 2017; Li et al., 2017; Sakurai et al., 2014; Yang et al., 2017; Cui et al., 2017; David et al., 2017; Delatte et al., 2016; Shen et al., 2018; Guallar et al., 2018; Dai et al., 2017; Xu et al., 2017). In this study, we show that a decapping/mass-spec protocol can expose signals only from internal m7G modifications. We found m7G/G levels of ~0.02% to ~0.05% across human and mouse cell lines as internal N7-methylguanosine within mammalian mRNA. We then profiled its distribution within mammalian mRNA using m7G-MeRIP-seq and unveiled GA- or GG-enriched sequence motifs. Similar distribution patterns and high conservations between human and mouse cell lines were observed. We then developed m7G-seq to achieve transcriptome-wide mapping of internal m7G at single-nucleotide resolution in human cells without antibody enrichment. The chemical-assisted m7G-seq takes advantage of the unique reactivity of the five-membered ring of m7G that is prone to reduction and depurination, leading to further structural transformation that could generate misincorporation during reverse transcription to identify the m7G site. The method offers two noticeable advantages of: (1) converting m7G sites to abasic sites for biotin-based enrichment followed by RT-mediated mutation to map m7G sites at base resolution; and (2) determining the methylation status of highly methylated sites (without enrichment) to uncover frequently modified m7G sites in human mRNA. Therefore, this new approach enables us to map the precise location and sequence motif of the internal m7G modification with high specificity and fidelity. Without enrichment the method also allowed assessment of the modification fraction at m7G sites by correlating the misincorporation rate to the methylation level based on a calibration curve generated using m7G-containing RNA standards.
Frequently Modified m7G Sites in Human tRNA and mRNA
Applying the m7G-seq approach (without enrichment) to tRNAs, we successfully characterized the base-resolution human cytosolic tRNA m7G46 methylation, which clearly distinguished m7G from other guanosine modifications. These tRNA m7G sites all exist with high modification fractions. We also performed m7G-seq in METTL1 knockdown cells, and confirmed the tRNA m7G methylation function of METTL1. The ability to monitor the m7G methylation status by m7G-seq may aid future functional studies of tRNA and rRNA m7G methylation and monitor potential dynamics of these modified sites during cellular processes.
Our method also uncovered over 90 internal m7G sites within human mRNA that may exhibit around to above 20% modification fraction. Approximately 50 of them can be considered as highly methylated internal m7G sites in human mRNA. The identification of these highly methylated sites, conserved in two different human cell lines, will stimulate further functional characterizations of these modifications and the target mRNAs. We found internal m7G with high modification levels displays GA-enriched motifs near start codon and stop codon. Potential effects on translation regulation could be studied in the future with proper assays (Karijolich et al., 2011).
We further conducted biotin pull-down enrichment to unveil additional internal m7G sites and to verify the sites discovered before enrichment. After pull-down enrichment, the misincorporation rate difference (above the input baseline mutation rate potentially introduced by HIV RT) was elevated to 8–35%. After applying stringent cutoff, we were able to identify more than 800 sites shared by two human cell lines, from which we performed statistical analysis for features of these confident internal m7G sites. These sites exhibit additional sequence motifs beyond the known GA- or GG-containing motifs found in tRNA and uncovered for mRNA using m7G-MeRIP-seq, suggesting potential presence of multiple m7G methyltransferases that may install mRNA m7G.
METTL1-WDR4 as a m7G Methyltransferase Complex for mRNA
We found that the known tRNA m7G modification complex, METTL1-WDR4 (Leulliot et al., 2008; Alexandrov et al., 2002; Lin et al., 2018), while participating in tRNA methylation as also verified in our knockdown results, also installs a subset of internal m7G sites in human mRNA. The simultaneous methylation of the position 46 at the extra loop in human tRNAs and human mRNA by the METTL1-WDR4 complex may not be surprising. Other mRNA modification machineries such as eukaryotic ψ synthases PUS1, PUS7 and TRUB1 have been shown to work on both tRNA and mRNA (Carlile et al., 2014; Li et al., 2015; Lovejoy et al., 2014; Safra et al., 2017; Schwartz et al., 2014). NSun family m5C methyltransferases bind quite extensively to mRNA as well (Hussain et al., 2013; Yang et al., 2017; Khoddami et al., 2013). Here, we show that the heterodimer METTL1-WDR4 is responsible for a portion of internal mRNA m7G methylation. Besides our observation that the knockdown of METTL1 led to reduced m7G methylation within mRNA, the METTL1-WDR4 PAR-CLIP results also revealed the binding of this complex to mRNA and a substantial overlap of the binding sites with m7G-MeRIP-seq sites in the same cell line (Figure S6H). WDR4 appears to possess more binding sites in mRNA and may contribute to stabilizing the heterodimer complex and RNA binding, whereas METTL1 may mediate m7G methylation. In vitro methylation assay using tRNA and mRNA purified from METTL1-depleted cells revealed good m7G methylation activity of METTL1-WDR4 towards both tRNA and mRNA. This complex also mediates m7G methylation of a long synthetic RNA probe that mimics internal mRNA m7G sites; however, the complex failed to react with several RNA probes ranging from 12-mer to 17-mer, suggesting that this methylase complex may require tRNA-like structures with a stem loop of a minimum length to facilitate substrate recognition. Please note that our m7G-seq identified diverse sequence motifs around internal m7G sites in mRNA (Figure 5D), suggesting involvements of additional methyltransferase(s) for m7G installation.
Functional roles of m7G within mRNA could be diverse. We found that the knockdown of METTL1 decreases the translation efficiency of transcripts that contain METTL1-affected hypomethylated m7G sites. Because of the unique nature of positive charge, internal m7G could reorganize local RNA structure, modulate protein-RNA interactions, and be better recognized through aromatic stacking. It could be recognized by different reader proteins and modulate local RNA structure to affect protein-RNA interactions, which might lead to regulation of mRNA translation or other processing and functions of mRNA, such as nuclear pre-mRNA processing, export, and stability. Perhaps different methyltransferases install m7G to distinct mRNA sequences and/or secondary structural motifs to further modulate the fate of the target mRNA. The identification of more frequently m7G methylated mRNAs and the availability of the new m7G-seq method should allow future functional studies and mechanistic investigations.
Limitations
The current m7G-seq protocol can still be improved in the future. We noticed that the mild chemical reactions for selective m7G reduction and depurination could not achieve quantitative yields, with a portion of m7G sites converted to abasic sites and then a portion of these abasic sites labeled with biotin hydrazide. These non-stoichiometric labeling chemical reactions explain higher mutation rates after enrichment of biotin-labeled RNA than those before enrichment. This limitation will affect accurate measurements of the modification levels of individual m7G sites. We have performed reactions on calibration and real biological samples under consistent conditions that should normalize variations introduced by the depurination and labeling chemistry. However, further improvement of the reaction efficiency and robustness as well as calibration consistency would further improve the quantitative feature of m7G-seq.
In summary, we discovered and mapped internal m7G sites within mammalian mRNA. Our single-nucleotide-resolution m7G sequencing technology allows precise mapping of m7G transcriptome-wide. This method could be widely used to detect m7G not only in tRNA and rRNA, but also within mRNA and various non-coding RNAs. We provide the first base-resolution m7G maps in human cell lines. Importantly, we show that certain internal m7G sites accumulate relatively high m7G fractions, suggesting functional roles. We identified METTL1 as one writer that can install a subset of internal m7G within mRNA and show that m7G might facilitate translation promotion of METTL1-affected transcripts. We propose that m7G could exhibit diverse functions on target mRNA, perhaps through modulating structure and protein-RNA interactions. This work provides critical resources for future investigations of m7G that may impact diverse biological processes and human diseases.
STAR METHODS
CONTACT FOR REAGENT AND RESOURCE SHARING
Requests should be directed to and will be fulfilled by the Lead Contact, Chuan He (chuanhe@uchicago.edu), after execution of a Materials Transfer Agreement.
EXPERIMENTAL MODEL AND SUBJECT DETAILS
Cells culture
Human HeLa, HepG2, and HEK293T cell lines and mouse embryonic stem cells (mESC) and mouse embryonic fibroblasts (MEF) used in this study were all purchased from ATCC (the American Type Culture Collection). HeLa cell line was grown in DMEM (Gibco, 11965) media supplemented with 10% FBS and 1% 100X Pen/Strep (Gibco), while HepG2, HEK293T and MEF cell lines were maintained in DMEM (Gibco, 11995), supplemented with 10% FBS and 1% 100X Pen/Strep (Gibco). mESC cells were grown under a typical feeder-free culture condition: cells were cultured in DMEM (Gibco, 11995), supplemented with 15% FBS, 1% Pen/Strep (Gibco), 1X Glutamax (Gibco), 1X non-essential amino acids (Gibco), 1X 2-Mercaptoethanol (Gibco), and 1000 U/ml leukemia inhibitory factor (Millipore, ESG1107), together with two inhibitors: 3 μM CHIR99021 (STEMCELL Technologies, dissolved in DMSO) and 1 μM PD0325901 (STEMCELL Technologies, dissolved in DMSO). mESC cells were distinctively cultured on gelatinized culture plates (0.2% Gelatin). The culture of mESC cells were passaged every 2 days. All cells were cultured at 37 °C under 5.0% CO2.
METHOD DETAILS
Antibodies
The antibodies used in this study are listed below in the format of name (catalog; supplier; dilution fold): Mouse anti-m7G (RN017M; MBL; 1000). Mouse anti-METTL1 (11525-MM05; Sino Biological; 1000). Rabbit anti-m6A (E1610S; NEB; 1000). Mouse anti-WDR4 (sc-100894; Santa Cruz; 100). Mouse anti-RPS6 (sc-74459; Santa Cruz; 500). Goat anti-mouse lgG-HRP (sc-2005; Santa Cruz; 3000). Goat anti-GAPDH-HRP (A00192; Genscript; 2000).
RNA isolation
Generally, with harvesting cells as the first step, the media was aspirated, and the cells were washed once with proper volume of ice-cold DPBS buffer for each plate. Then total RNA was isolated from cells with TRIzol reagent (Invitrogen) and then extracted following manufacturer’s protocol by isopropanol precipitation. Total RNA isolation for RT-qPCR: total RNA was isolated from wild-type or transiently transfected cells with TRIzol reagent (Invitrogen) and then extracted with Direct-zol RNA MiniPrep (Zymo Research), including an on-column DNase I digestion. mRNA isolation for LC-MS/MS: total RNA was extracted as described previously. mRNA was extracted by two rounds of polyA+ purification with Dynabeads mRNA DIRECT kit (Ambion). mRNA concentration was measured using Qubit RNA HS Assay Kit (Thermo Fisher Scientific) with Qubit 2.0 fluorometer. General procedures for ethanol precipitation: 0.1 volume of 3M NaOAc (pH=5.5), 3 volumes of 100% ethanol and 1 μL GlycoBlue Coprecipitant (15 mg ml−1, Thermo Fisher Scientific) were added to the RNA solution for precipitation. The solution was stored at −80 °C for 1 h or up to overnight, and was then centrifuged at 15,000 g for 15 min. The supernatant was removed, and the pellet was washed with 1 ml 80% ethanol once, air dried and finally dissolved in nuclease-free water.
rRNA and tRNA depletion evaluation
Four-leaf clover qRT-PCR was performed as previously reported (Honda et al., 2015) for RNA after two rounds of polyA+ purification to check the remaining level of tRNALysCUU and tRNAValAAC/CAC, two tRNAs known to bear m7G. Mature tRNAs in total RNA were first subjected to deacylation treatment. Then the DNA/RNA hybrid SL-adaptors were specifically hybridized to the deacylated tRNA, followed by ligation with T4 RNA ligase 2 (NEB) to form a “four-leaf clover” structure. Two biological replicates and three technical replicates were applied. All tRNA samples (total RNA or mRNA) after the ligation were subject to 50 cycles of RT-qPCR amplifications with corresponding pairs of forward and reverse primers. RT-qPCR was performed to test the rRNA depletion. The two RT-qPCR primer pairs for 18S rRNA detection listed as shown in Table S4.
The two replicates for both total RNA and mRNA were subjected to 25-cycle amplification of RT-qPCR with technical triplicates. The Cq value of 18S rRNA was normalized to GAPDH and the depletion level was calculated.
LC-MS/MS
Around 200–300 ng mRNA was digested in a three-step manner with nuclease S1 (1uL, Sigma-Aldrich) in 20 μL reaction buffer containing 10 mM of NH4OAc (pH= 5.3) at 42 °C for 2 h. To detect m7G level, including the cap of mRNA, a second digestion with phosphodiesterase I (0.001U, Sigma-Aldrich) was performed, with the addition of 2.5ul NH4HCO3 (1M, freshly prepared in water) at 37 °C for 1 h. Then, 1 μL of shrimp alkaline phosphatase (rSAP, NEB) was added along with 2.5 μL of 10X CutSmart buffer (NEB) and incubated at 37 °C for 2 h. After the incubation, the sample was diluted with additional 35 μL water and filtered with 0.22 μm filters (4mm diameter, Millipore) and 8 μl of the entire solution was injected into LC-MS/MS as one sample. The two-step digestion simply excludes the phosphodiesterase I digestion. For all the quantification, a mock control with only digestion buffers and enzymes was included each time and was later used for subtraction of baseline signals. Nucleosides were separated, by reverse phase ultra-performance liquid chromatography, on a C1 column with on-line mass spectrometry detection by an Agilent 6410 QQQ triple-quadrupole LC mass spectrometer, in positive electrospray ionization mode. The nucleosides were quantified with retention time and the nucleoside-to-base ion mass transition of 284–152 (G), 282.1–150.1 (m6A), 268–136 (A), 298.1–166.1 (m7G). Quantification was performed in comparison with the standard curve, obtained from pure nucleoside standards running with the same batch of samples. The m7G level and m6A level were calculated as the ratio of m7G to G and m6A to A based on calibrated concentration curves.
Decapping of mRNA
Decapping of mRNA was performed with Tobacco Decapping Plus 2 (#94, Enzymax). The reaction was prepared, with a maximum of 6 μg fragmented mRNA in nuclease-free water with 5 μL 10X Decapping Reaction Buffer (100 mM Tris-HCl pH 7.5, 1.0 M NaCl, 20 mM MgCl2, 10 mM DTT), 1uL 50 mM MnCl2, 2.5 μL SUPERase-In RNase Inhibitor (Thermo Fisher Scientific) and 8 μL Tobacco Decapping Plus 2 enzyme, diluted to a final volume of 50 μL. The reaction was incubated at 37 °C for 2 hours. Decapped RNA was extracted from the solution with Oligo Clean & Concentrator (Zymo Research).
Dot blot assay
Four 9-mer RNA oligos were synthesized in-house with either G, m1G, m2G, or m22G at a single internal site (5’-GAGCXUUAG-3’, X = G, m1G, m2G or m22G). Three 60-mer oligos (5’-CCAATAAAATATTAACCACCAATAAAATATTAACCAAGATCCACCAATAAAATATTAACC-3’) were synthesized by in vitro transcription using MEGAshortscript T7 Transcription Kit (AM1354, Thermo Fisher Scientific) with GTP or m7GTP (M6133, Sigma Aldrich) or m6GTP (N-1031, TriLink) as sources for the single G site in the middle. All seven oligos were used to test the specificity of the commercially available m7G antibodies used in m7G-MeRIP-seq. Serial portions, in two-fold dilution of each oligo, were denatured and spotted on the nylon membrane (GE Healthcare) followed by UV-crosslinked. The membranes were then blocked with 5% non-fat milk in 1X PBST for 30 min at room temperature and incubated overnight afterward at 4 °C in 1% non-fat milk with the addition of anti-m7G antibody (RN017M, MBL). After extensive washing, three times with 1X PBST, the membranes were incubated with anti-mouse IgG HRP conjugated secondary antibody diluted 1:3000 in 1% nonfat milk in 1X PBST for 1 hour at 25 °C. After three more washes and developing with SuperSignal West Dura Extended Duration kit (Thermo Fisher Scientific), the membranes were finally imaged and analyzed using the FluorChem R imager (Protein Simple).
m7G-MeRIP-seq
Around 4–6 μg human or mouse mRNA (two rounds of polyA+ purification) was fragmented into 50–100 nt using RNA Fragmentation Reagents (AM8740, Invitrongen) following the manufacturer’s standard protocol. The fragmented mRNA was further decapped with the standard decapping procedure (Tobacco Decapping Plus 2, Enzymax) and then concentrated with RNA Clean & Concentrator (Zymo Research).
The end structures of these RNA fragments were repaired by T4 Polynucleotide Kinase (EK0032, Thermo Fisher Scientific): (1) 3’ de-phosphorylation: RNA was mixed with 5 μL 10X T4 Polynucleotide Kinase Reaction Buffer (B0201S, NEB) and 5 μL T4 PNK, diluted to a final volume of 50 μL and incubated at 37°C for 1 hour; (2) 5’-phosphorylation: to the reaction mixture, 5 μL 10 mM ATP (P0756S, NEB) and 2.5 μL extra T4 PNK were added, and the mixture was kept at 37 °C for 30 min.
The repaired mRNA fragments (~2 ug) was then incubated with 4 μL anti-m7G antibody (MBL) in 250 μL 1X IPP buffer (10mM Tris-Cl, pH=7.4; 150 mM NaCl; 0.1% NP-40) with freshly added 5% SUPERase-In RNase inhibitor (Thermo Fisher Scientific) at 4 °C for 2–4 hours. Then 40 μL Dynabeads Protein G resins (Thermo Fisher Scientific) were washed twice with 1X IPP buffer, resuspended in 20 μL IPP buffer and added into the antibody-RNA mixture for another 2 hours at 4 °C. The resins were then washed with 1X IPP buffer at 4 °C for four times. RNA was finally eluted with Proteinase K (recombinant, PCR grade, EO0491, Thermo Fisher Scientific) digestion. 45 μL 1X Proteinase K digestion buffer (2X recipe: 2% SDS, 12.5 mM EDTA, 100 mM Tris-Cl (pH=7.4), 150 mM NaCl) with 5 μL Proteinase K was used to resuspend the resins, and the solution was incubated at 55 °C for 30 min. The second round of the digestion was prepared in the same way and incubated at 55 °C for another 15 min. Both flow-throughs were combined, and m7G-containing RNA was recovered with RNA Clean & Concentrator (Zymo Research). Decapped and fragmented polyA+ RNA (as “input”) and immunoprecipitated RNA (as “IP”) were subjected to small RNA library construction following manufacturer’s instructions of NEBNext Small RNA Library Prep Set for Illumina (NEB). All libraries were sequenced on Illumina NextSeq 500 with single-end 80 bp read length.
m7G-seq
Around 4–6 μg human mRNA (two rounds of polyA+ purification) was fragmented into 50–100 nt using RNA Fragmentation Reagents (AM8740, Invitrongen) following the manufacturer’s standard protocol. The fragmented mRNA was further decapped with the standard decapping procedure (Tobacco Decapping Plus 2, Enzymax) and then concentrated with Oligo Clean and Concentrator (Zymo Research). The end repair/3’-dephosphorylation was performed with T4 Polynucleotide Kinase (EK0032, Thermo Fisher Scientific): RNA was mixed with 5 μL 10X T4 Polynucleotide Kinase Reaction Buffer (B0201S, NEB) and 5 μL T4 PNK, diluted to a final volume of 50 μL and incubated at 37°C for 1 hour. Then a further 5’-/3’-dephosphorylation step was conducted at 37 °C for 1.5 hour in 50 μL 1X CutSmart Buffer (NEB) with 5 μL Shrimp Alkaline Phosphatase (rSAP, NEB). Starting with the 3’-adapter ligation, repaired and dephosphorylated RNA fragments (20 μL) were incubated with 1.6 μL 100 μM (2 equivalents) 3’ linker (5’rApp-AGATCGGAAGAGCGTCGTG-3SpC3) at 70 °C for 2 min and transferred to ice immediately. 5 μL 10X T4 RNA Ligase Reaction Buffer, 15 μL 50% PEG8000 and 4 μL T4 RNA ligase 2 truncated KQ (NEB) were added accordingly to the RNA-adaptor mixture, then the reaction was diluted to a final volume of 50 μL and incubated at 25 °C for 2 hours followed by 16 °C for 8 hours or more. The reaction was then diluted to 97 μL, and the excessive adaptors were digested with 3 μL 5’ Deadenylase (NEB) at 30 °C for 1 h followed by adding 1.5 μL RecJf (NEB) for ssDNA digestion at 37 °C for another hour. 3’-end ligated RNA was extracted using RNA Clean & Concentrator (Zymo Research).
To enrich m7G sites, RNA was reduced, biotinylated, and pulled-down in a row. RNA was subjected to reduction by 1 M NaBH4 (freshly prepared in water) as a 5X reaction buffer and incubated at 25 °C for 45~60 min, with occasional low-speed shaking. RNA was recovered with 7 volumes (to quench the reaction) of RNA Binding Buffer provided by RNA Clean & Concentrator (Zymo Research) and the rest steps remained the same as the protocol. We added 5 μL 1 M MES buffer (pH=4.5) to the eluted RNA in a volume of 35 μL and mixed it immediately followed by adding 10 μL EZ-Link Hydrazide-Biotin (Thermo Fisher Scientific, 50 mM solution in DMSO). The solution was incubated at 55 °C for 1 hour. RNA was purified quickly and proceeded to pull-down assay with Dynabeads MyOne Streptavidin C1 beads (Thermo Fisher Scientific). 20 μL resins was added. Respectively, resins were washed twice with 1X B&W buffer (as the manufacturer’s protocol), resuspended in 2X B&W buffer (with a volume equal to the sample), and incubated with the sample at 4 °C for 20 min. After pull-down, the resins were washed five times with 1X Wash buffer (50 mM Tris, pH 7.4, 300 mM KCl, 0.05% (v/v) NP-40) and subjected to proteinase K digestion. The digestion reaction was prepared as previously mentioned and incubated at 55 °C for 30 min. The flow-through was saved and RNA was recovered with RNA Clean & Concentrator (Zymo Research).
The 3’ ligated RNA (as “input”), the RNA before pull-down assay (as “before pulldown”), and final elution after pull-down (as “pulldown”) were subjected to reverse transcription. RNAs were first incubated with 1 μL of 2.0 μM RT primer (5’-ACACGACGCTCTTCCGATCT-3’) at 65 °C for 2 min and cooled on ice immediately. The reactions were then prepared with RNA mixture, 2 μL 10 mM dNTP (Deoxynucleotide (dNTP) Solution Mix, NEB), 1X AMV Reverse Transcriptase Reaction Buffer (NEB), 1–2 μL Recombinant HIV reverse transcriptase (Worthington), and 1 μL RNaseOUT recombinant ribonuclease inhibitor (Thermo Fisher Scientific) and then incubated at 37 °C for 1 hour. The enzymes were deactivated by incubation at 75 °C for 5 min and stored on ice. The cDNAs were purified with Oligo Clean and Concentrator (Zymo Research). Purified cDNA was then subject to cDNA 3’-adaptor ligation. The cDNA was first denatured with 1 μL of 50 μM cDNA linker (5’ Phos-NNNNNNNNNNAGATCGGAAG AGCACACGTCTG-3SpC3) at 75 °C for 2 min. 2 μL 10X T4 RNA Ligase Reaction Buffer, 10 μL 50% PEG8000, 2 μL 10mM ATP and 1 μL T4 RNA ligase 1 (high concentration, NEB) were added accordingly to the cDNA-adaptor mixture, then the reaction was incubated at 25 °C for 12 hours. The library was then amplified with the universal and indexed primers from NEBNext Multiplex Oligos for Illumina (NEB). All libraries were sequenced on Illumina NextSeq 500 with single-end 80 bp read length.
Misincorporation-Methylation calibration curve with synthetic 60-mer probe
A 60-mer RNA probe with the sequence as CCAATAAAATATTAACCACCAATAAAATATTAACCAAGATCCACCAATAAAATATTAACC was synthesized with MEGAshortscript T7 Transcription Kit (Thermo Fisher Scientific) by in vitro transcription. A series of probes with different methylation levels was prepared by manipulating m7GTP/GTP ratio during the in vitro transcription. All these probes were subjected to m7G-seq and the misincorporation pattern of each was analyzed and a fitting curve was plotted based on misincorporation rate-methylation level relation. All libraries were sequenced on Illumina NextSeq 500 with single-end 80 bp read length.
Ribosome profiling.
Ribosome profiling was performed according to the procedure reported previously (Wang et al., 2014). Four 15-cm plates of HeLa cells were prepared for 48 h knockdown (siControl vs siMETTL1, two plates each). Cycloheximide (CHX) was added to the media at 100 mg ml−1 and incubated at 37 °C for 7 min. After removing the media and washed with cold PBS, the cells were collected by cell lifter with 5 ml ice-cold PBS with CHX (100 mg ml−1). The cell pellet was collected by centrifugation at 500 g for 5 min. 1 ml lysis buffer (10 mM Tris, pH 7.4, 150 mM KCl, 5 mM MgCl2, 100 mg ml−1 CHX, 0.5% Triton-X-100, freshly add 1:100 protease inhibitor and 40 U ml−1 RNasin® Ribonuclease Inhibitors (Promega)) was added to suspend the cell pellets and kept on ice for 15 min. After centrifugation at 13,000 g for 15 min, the supernatant was collected, and its absorbance was tested at 260 nm. 8 μL TURBO DNase (Thermo Fisher Scientific) was added to the lysate and the lysate was then split by the ratio of 1:4 as Portion I and Portion II. 4 μL SUPERase-In RNase inhibitor was then added to Portion I. 40 μL MNase buffer and 3 μL MNase (6,000 gel units, NEB) was added to Portion II. Both portions were kept at room temperature for 15 min, and 8 μL SUPERase-In RNase inhibitor was then added to Portion II to stop the reaction. Portion I was saved and mixed with 1 ml TRIzol to purify input mRNA. A 10/50% w/v sucrose gradient was prepared in a lysis buffer without Triton-X-100. Portion II was loaded onto the sucrose gradient and centrifuged at 4 °C for 3 h at 28,000 rpm. (Beckman, rotor SW28). The sample was then fractioned and analyzed by Gradient Station (BioCamp) equipped with ECONO UV monitor (BioRad) and fraction collector (FC203B, Gilson). The fractions corresponding to 80S were collected, combined, and mixed with an equal volume of TRIzol to purify the RNA. The RNA pellet was dissolved in 20 μL water, mixed with 20 μL 2X TBE-urea loading buffer (Invitrogen), and separated on a 10% TBE-urea gel. A 21-nt and a 42-nt ssRNA oligo were used as size markers, and the gel band between 21 and 42 nt was cut. 600 μL extraction buffer (300 mM NaOAc, pH 5.5, 1 mM EDTA, 0.1 U ml−1 SUPERase-In RNase inhibitor) was added to the gel. The gel slurry was heated at 65 °C for 10 min with shaking, and then filtered through gel filter. RNA was concentrated by ethanol precipitation and finally dissolved in 10 μL of RNase-free water. Input mRNA: the input RNA was first purified by TRIzol and the input mRNA was prepared as previously described. The mRNA was then fragmented by RNA fragmentation kit (Ambion). All samples were subjected to small RNA library construction following manufacturer’s instructions of NEBNext Small RNA Library Prep Set for Illumina (NEB). All libraries were sequenced on Illumina NextSeq 500 with single-end 80 bp read length.
Polysome profiling.
Polysome profiling was performed according to the procedure reported previously (Wang et al., 2014; Gandin et al., 2014). Eight 15-cm plates of HeLa cells were prepared for 48h knockdown (transfected with siControl or siMETTL1, two replicates for each siRNA and two plates for each replicate). Before collection, cycloheximide (CHX) was added to the media at 100 μg ml−1 for 7 min. The medium was removed, and the cells were washed with ice-cold PBS once. The cells were then collected with ice-cold PBS with CHX at 100 μg ml−1, followed by centrifugation at 500 g for 5 min. 500 μL lysis buffer (20 mM HEPES, pH 7.6, 100 mM KCl, 5 mM MgCl2, 100 μg ml−1 CHX, 1% Triton-X-100, and 1:100 protease inhibitor (Roche); 40 U ml−1 RNasin® Ribonuclease Inhibitors (Promega) were added prior to use) was added to resuspend cell pellets for each sample and was kept on ice for 20 min with periodic perturbation. After the incubation, the lysate was centrifuged at 15,000 g for 15 min. The supernatant was collected. An addition of 4 μL TURBO DNase (Thermo Fisher Scientific) was applied to each sample followed by another incubation at room temperature for 15 min. The treated lysate was centrifuged, and the clear supernatant was saved and tested with A260 absorbance to adjust and dilute the samples to the same OD value. Part of the clear lysate was kept as input for western blotting.
A 10/50% w/v sucrose gradient was prepared in lysis buffer without Triton-X-100. The rest lysate was loaded onto the sucrose gradient and centrifuged at 4 °C at 28,000 rpm (Beckman, rotor SW28) for 3 hr. The samples were then fractioned and the A260 absorbance of each fraction was analyzed by Nanodrop. Part of each sucrose fraction was used for western blotting. Total RNAs of different fractions (non-ribosome, 40S–80S and polysome) were extracted by TRIzol (Invitrogen) and purified with ethanol precipitation as described before. Total RNAs were then subjected to reverse transcription with PrimeScript RT Reagent Kit (Takara) to check the mRNA levels of each gene of interest with RT-qPCR (also see RT-qPCR at the Experimental Procedure section).
PAR-CLIP.
We followed the previously reported protocol (Wang et al., 2014; Hafner et al., 2010). Ten 15-cm plates of HEK293T cells were seeded for each replicate and grown to 80% confluency before the addition of 4 μL 1 M 4SU to each plate. After 14 hours incubation, the media was aspirated; the cells were washed once with 5 ml ice-cold PBS for each plate and crosslinked by 0.15 J cm−2 365 nm UV light twice when on ice. The crosslinked cells were collected with cell lifters. 3 volumes of the lysis buffer (50 mM HEPES, pH 7.5; 150 mM KCl; 2 mM EDTA; 0.5% (v/v) NP-40, with 1:100 protease inhibitor (Roche) and 40 U ml−1 RNasin® Ribonuclease Inhibitors (Promega) added freshly) was added to the cell pellet and incubated on ice for 10 min with periodic perturbation. The cell lysate was then centrifuged at 15,000 g for 15 min and the clear supernatant was collected. RNase T1 (1,000 U μL−1, Thermo Fisher Scientific) was added to the clear lysate to a final concentration of 0.1 U μL−1 and an incubation at room temperature was performed for 15 min. The reaction was then quenched on ice. After 5 min, 4.5 μg mouse anti-METTL1 or WDR4 antibody were added to each sample. The antibody and the lysate were incubated at 4 °C for 2 hours under periodic rotation. Protein G beads (Thermo Fisher Scientific) were washed (45 μL for each sample) with IP wash buffer (50 mM HEPES, pH 7.5, 300 mM KCl, 0.05% (v/v) NP-40, with 1:100 protease inhibitor (Roche) and 40 U ml−1 RNasin® Ribonuclease Inhibitors (Promega) added freshly) for 2 times. The beads were resuspended in 50 μL lysis buffer for each sample and added to the antibody-lysate mixture subsequently. Another one-hour incubation at 4 °C was performed with low-speed rotation.
After the incubation, the beads were washed three times with IP wash buffer (50 mM HEPES, pH 7.5, 300 mM KCl, 0.05% (v/v) NP-40, with 1:100 protease inhibitor (Roche) added freshly) and then resuspended with 200 μL IP wash buffer per sample. The beads were treated with a second round of RNase T1 digestion under a final concentration of 10 U μL−1 for 15 min at room temperature. The reaction was then quenched with the addition of 10 μL SUPERase-In followed by a 5-min incubation on ice. The beads were washed three times with high-salt wash buffer (50 mM HEPES, pH 7.5, 500 mM KCl, 0.05% (v/v) NP-40, with 1:100 protease inhibitor (Roche) added freshly) and twice with 1X PNK buffer (NEB) afterwards.
The beads were resuspended with 200 μL of 1X PNK buffer (NEB) and underwent T4 PNK (Thermo Fisher Scientific) end repair with standard procedures as previously mentioned under 37 °C. After the incubation, the beads were washed once with 1X PNK buffer followed by proteinase K digestion as described before. The RNA was recovered with RNA Clean & Concentrator (Zymo Research) before library construction by NEBNext Small RNA Library Prep Set for Illumina (NEB). All libraries were sequenced on Illumina NextSeq 500 with single-end 80 bp read length.
RT-qPCR.
All RNA templates used for RT-qPCR were digested with DNase I in the purification step. RT-qPCR primers were designed to cover exon-exon junctions shared in all isoforms of the matured mRNAs. About 500 ng RNAs were first reverse-transcribed into cDNAs with PrimeScript™ RT reagent Kit (Takara), and then the cDNAs were subjected to qPCR analysis with FastStart SYBR Green Master Mix (Roche) in machine LightCycler 96 (Roche). Actb or gapdh were used as internal controls in different cases. The sequences of primers used in this study are listed in Table S4.
In vitro methylation assay.
In vitro methylation assay was carried out with mRNA purified from siMETTL1 HeLa cells, and small RNA (<200 nt) purified from shMETTL1 HepG2 cells, and the synthetic probe mimicking the UTR region of certain genes. mRNA was purified as described previously. Small RNA fraction was purified from total RNA with mirVana miRNA Isolation Kit (Thermo Fisher Scientific) following manufacturer’s protocol. The synthetic probe mimicking the structure of 5’UTR of MPZL1 was prepared by in vitro transcription as previously described. The DNA template was directly ordered from Integrated DNA Tech Inc as two ssDNA with the sequences as shown in Table S4.
The ssDNAs were dissolved in Nuclease-free Duplex Buffer and mixed in equal molar amounts. The annealing was performed with denaturation at first at 94 °C for 2 min, followed by gradual cooling at the speed of −1 °C per min. The annealing products were purified with agarose gel and recovered with MinElute Gel Extraction kit (Qiagen). The RNA was then prepared with MEGAscript T7 Transcription Kit (Thermo Fisher Scientific) according to manufacturer’s protocol including TURBO DNase digestion step at 37 °C for 1 hour. The RNA yielded was later purified with RNA Clean and Concentrator (Zymo Research).
Several short RNA probes were also synthesized for in vitro methylation assay with the sequences shown in Table S4.
The recombinant FLAG-tag protein complex was purified from HEK293T cells with FLAG-METTL1/ FLAG-WDR4 double overexpression. The plasmids for Flag-tag METTL1 and Flag-tag WDR4 were acquired directly from Vector Builder with the ID as VB180605–1094fas and VB180605–1181pjz respectively. The overexpression was performed with Lipofectamine 2000 Reagent (Thermo Fisher Scientific) following manufacturer’s protocol. Cells were harvested after 24 hr overexpression and the proteins were purified using Anti-FLAG M2 magnetic beads (Sigma Aldrich) following the manufacturer’s protocol. The in vitro methylation assay was performed according to previous method (Liu et al., 2014) for methyltransferase validation but instead of d3-SAM, SAM (NEB) was used and m7G/G level (LC-MS/MS) was detected to show activity of the methyltransferase.
QUANTIFICATION AND STATISTICAL ANALYSIS
Peak calling
Peak calling is adopted in the analysis of MeRIP-seq data. Adaptors and low-quality reads (length shorter than 15) were trimmed from raw sequencing reads using cutadapt software (https://cutadapt.readthedocs.io/en/stable/#). Reads were then aligned to the relevant genome (human-hg19 or mouse-mm10) using Tophat2 (version 2.2.1) without any gaps and allowed for at most two mismatches. Peaks enriched in immunoprecipitation over input experiments were identified using exomePeak and MeTPeak packages (Meng et al., 2013; Cui et al., 2016). For each cell line, only peaks identified (FDR≤0.05) in both replicates were considered as a candidate target. The further annotation of peaks was made use of PAVIS tool and HOMER software (http://homer.ucsd.edu/homer/ngs/rnaseq/index.html). For the human-mouse conservation, MEF and mESC mRNA m7G peaks were converted to the homologous coordinates in the human hg19 genome, using the LiftOver tool of the UCSC genome browser (https://genome.ucsc.edu/cgi-bin/hgLiftOver). The converted peaks were compared with human internal mRNA m7G peaks with bedtools (https://bedtools.readthedocs.io/en/latest/). METTL1-regulated internal m7G peaks were analyzed by exomePeak and MeTDiff packages (Meng et al., 2013; Cui et al., 2018), based on the MeRIP-seq data from HeLa siMETTL1 vs siControl samples or HepG2 shMETTL1 vs siControl samples.
Identification of m7G-seq induced mutation
Identification of m7G-seq induced mutation. RNA input samples (without reduction or biotinylation, as “input”), with reduction and biotinylation samples (before biotin pull-down, as “before-pulldown”), and biotin pull-down samples (as “pulldown”) were all trimmed with cutadapt tool to remove adapters and low-quality reads (length shorter than 15). Reads were then processed with BBMap tool (https://sourceforge.net/projects/bbmap/) to remove PCR duplicates. The harvested reads were further trimmed the random barcode using cutadapt tool and remove low-quality reads again. Reads were then aligned to the relevant genome (human-hg19) using Tophat2 (version 2.2.1) with at most four mismatches (Arango et al., 2018). Identification of sequence variants was carried out by determining the base composition at each position using fine-tuned bam-readcount (https://github.com/genome/bam-readcount). The generated bamreadcount results were parsed and analyzed by in-house scripts. Variants at base ‘G’ were initially collected in before-pulldown or pulldown sample if (1) the sum of G→T or G→C misincorporation count is equal to or larger than 2; (2) the sum of G→T or G→C misincorporation rate is no less than two percent; (3) overall coverage at base ‘G’ was at least 18 reads. Identified guanosine positions (according to the encoding DNA strand) were then filtered to exclude known genomic polymorphism sites (dbSNP). The generated preliminary mutations sites must appear in two replicates of “before-pulldown” or “pulldown” samples (mutation sites with a G to T misincorporation rate ≥ 40% were removed). 3% misincorporation rate of G→T or G→C (above the background mismatch rate in RNA input samples) was set for “before-pulldown” samples and 8% was set for “pulldown” samples. Variants at base ‘G’ in “input” samples serve for removing natural mutations or false positives from both “before-pulldown” and “pulldown” samples. The further analysis to uncover high-confident internal m7G site candidates is based on the comprehensive mutation patterns across input, before-pulldown and pulldown samples.
Gene ontology (GO) enrichment
For GO analysis, the list of RefSeq IDs of target genes was first uploaded into DAVID Bioinformatics Resources (http://david.abcc.ncifcrf.gov) and analyzed with functional annotation clustering. The resulting file was downloaded and extracted with GO terms and corresponding P values. The new list containing GO terms with P< 0.01 was imported into REVIGO and visualized with the interactive graph, which was used as the final output figures.
DATA AND SOFTWARE AVAILABILITY
RNA sequencing data listed in Table S1 are available in the Gene Expression Omnibus (http://www.ncbi.nlm.nih.gov/geo) under accession number GSE112276.
Supplementary Material
Method S1. Detailed protocol describing m7G-seq in this study, Related to Figure 3.
Table S3. 801 confident m7G sites showing in m7G-seq across both replicates of the two cell lines (HeLa and HepG2), Related to Figure 5 and Figure S5.
HIGHLIGHTS.
Presence of internal m7G in mammalian mRNA
Chemical-assisted m7G-seq maps m7G methylome at single-base resolution
Highly modified internal m7G sites were identified in human mRNA
METTL1 acts as a methyltransferase for a subset of internal m7G sites in mRNA
ACKNOWLEDGEMENT
This work was supported by National Institutes of Health HG008935 (C.H.). The Mass Spectrometry Facility of the University of Chicago is funded by National Science Foundation (CHE-1048528). C. H. is an investigator of the Howard Hughes Medical Institute. L.Z. is an HHMI International Student Research Fellow. We would like to thank Life Science Editors for Editorial Assistance. We thank Dr. Pieter W. Faber and Genomics Facility of the University of Chicago for generous help with high-throughput sequencing. We thank Dr. Jordi Tauler for help on writing and grammar.
Footnotes
Publisher's Disclaimer: This is a PDF file of an unedited manuscript that has been accepted for publication. As a service to our customers we are providing this early version of the manuscript. The manuscript will undergo copyediting, typesetting, and review of the resulting proof before it is published in its final citable form. Please note that during the production process errors may be discovered which could affect the content, and all legal disclaimers that apply to the journal pertain.
DECLARATION OF INTERESTS
C.H. is a scientific founder and a scientific advisory board member of Accent Therapeutics. Inc. and a shareholder of Epican Genetech.
REFERENCES
- Zhao BS, Roundtree IA, and He C (2017). Post-transcriptional gene regulation by mRNA modifications. Nat. Rev. Mol. Cell Biol. 18, 31–42. [DOI] [PMC free article] [PubMed] [Google Scholar]
- Gilbert WV, Bell1 TA, and Schaening C (2016). Messenger RNA modifications: Form, distribution, and function. Science 352, 1408–1412. [DOI] [PMC free article] [PubMed] [Google Scholar]
- Helm M, and Motorin Y (2017). Detecting RNA modifications in the epitranscriptome: predict and validate. Nat. Rev. Genet 18, 275–291. [DOI] [PubMed] [Google Scholar]
- Frye M, Harada BT, Behm M, and He C (2018). RNA modifications modulate gene expression during development. Science 361, 1346–1349. [DOI] [PMC free article] [PubMed] [Google Scholar]
- Roundtree IA, Evans ME, Pan T, and He C (2017). Dynamic RNA modifications in gene expression regulation. Cell 169, 1187–1200. [DOI] [PMC free article] [PubMed] [Google Scholar]
- Dominissini D, Nachtergaele S, Moshitch-Moshkovitz S, Peer E, Kol N, Ben-Haim MS, Dai Q, Segni AD, Salmon-Divon M, Clark WC et al. (2016). The dynamic N1-methyladenosine methylome in eukaryotic messenger RNA. Nature 530, 441–446. [DOI] [PMC free article] [PubMed] [Google Scholar]
- Li X, Xiong X, Wang K, Wang L, Shu X, Ma S, and Yi C (2016). Transcriptome-wide mapping reveals reversible and dynamic N1-methyladenosine methylome. Nat. Chem. Biol 12, 311–316. [DOI] [PubMed] [Google Scholar]
- Furuichi Y (2015). Discovery of m(7)G-cap in eukaryotic mRNAs. Proc. Jpn. Acad. Ser. B. Phys. Biol. Sci 91, 394–409. [DOI] [PMC free article] [PubMed] [Google Scholar]
- Cowling VH (2009). Regulation of mRNA cap methylation. Biochem J. 425, 295–302. [DOI] [PMC free article] [PubMed] [Google Scholar]
- Furuichi Y, LaFiandra A, Shatkin AJ (1977). 5’-Terminal structure and mRNA stability. Nature 266, 235–239. [DOI] [PubMed] [Google Scholar]
- Shimotohno K, Kodama Y, Hashimoto L, and Miura KI (1977). Importance of 5’-terminal blocking structure to stabilize mRNA in eukaryotic protein synthesis. Proc. Natl. Acad. Sci. U.S.A. 74, 2734–2738. [DOI] [PMC free article] [PubMed] [Google Scholar]
- Murthy KG, Park P, and Manley JL (1991). A nuclear micrococcal-sensitive, ATP-dependent exoribonuclease degrades uncapped but not capped RNA substrate. Nucleic Acids Res. 19, 2685–2692. [DOI] [PMC free article] [PubMed] [Google Scholar]
- Pei Y, and Shuman S (2002). Interactions between fission yeast mRNA capping enzymes and elongation factor Spt5. J. Biol. Chem 277, 19639–19648. [DOI] [PubMed] [Google Scholar]
- Konarska MM, Padgett RA, and Sharp RA (1984). Recognition of cap structure in splicing in vitro of mRNA precursors. Cell 38, 731–736. [DOI] [PubMed] [Google Scholar]
- Lindstrom DL, Squazzo SL, Muster N, Burckin TA, Wachter KC, Emigh CA, McCleery JA, Yates JR 3rd., and Hartzog GA (2003). Dual roles for Spt5 in pre-mRNA processing and transcription elongation revealed by identification of Spt5-associated proteins. Mol. Cell. Biol 23, 1368–1378. [DOI] [PMC free article] [PubMed] [Google Scholar]
- Drummond DR, Armstrong J, and Colman A (1985). The effect of capping and polyadenylation on the stability, movement and translation of synthetic messenger RNAs in Xenopus oocytes. Nucleic Acids Res. 13, 7375–7394. [DOI] [PMC free article] [PubMed] [Google Scholar]
- Lewis JD, and Izaurralde E (1997). The role of the cap structure in RNA processing and nuclear export. Eur. J. Biochem 247, 461–469. [DOI] [PubMed] [Google Scholar]
- Muthukrishnan S, Both GW, Furuichi Y, and Shatkin AJ (1975). 5’-Terminal 7-methylguanosine in eukaryotic mRNA is required for translation. Nature 255, 33–37. [DOI] [PubMed] [Google Scholar]
- Guy MP, and Phizicky EM (2014). Two-subunit enzymes involved in eukaryotic post-transcriptional tRNA modification. RNA Biol. 11, 1608–1618. [DOI] [PMC free article] [PubMed] [Google Scholar]
- Sloan KE, Warda AS, Sharma S, Entian KD, Lafontaine DLJ, and Bohnsack MT (2017). Tuning the ribosome: The influence of rRNA modification on eukaryotic ribosome biogenesis and function. RNA Biol. 14, 1138–1152. [DOI] [PMC free article] [PubMed] [Google Scholar]
- Haag S, Kretschmer J, and Bohnsack MT (2015). WBSCR22/Merm1 is required for late nuclear pre-ribosomal RNA processing and mediates N7-methylation of G1639 in human 18S rRNA. RNA 21, 180–187. [DOI] [PMC free article] [PubMed] [Google Scholar]
- Õunap K, Kasper L, Kurg A, and Krug R (2013) The human WBSCR22 protein is involved in the biogenesis of the 40S ribosomal subunits in mammalian cells. PLoS One 8, e75686. [DOI] [PMC free article] [PubMed] [Google Scholar]
- Létoquart J, Huvelle E, Wacheul L, Bourgeois G, Zorbas C, Graille M, Heurgue-Hamard V, Lafontaine DL (2014). Structural and functional studies of Bud23-Trm112 reveal 18S rRNA N7-G1575 methylation occurs on late 40S precursor ribosomes. Proc. Natl. Acad. Sci. U.S.A. 111, E5518–E5526. [DOI] [PMC free article] [PubMed] [Google Scholar]
- Leulliot N, Chaillet M, Durand D, Ulryck N, Blondeau K, and van Tilbeurgh H (2008). Structure of the yeast tRNA m7G methylation complex. Structure 16, 52–61. [DOI] [PubMed] [Google Scholar]
- Alexandrov A, Martzen MR, and Phizicky EM (2002). Two proteins that form a complex are required for 7-methylguanosine modification of yeast tRNA. RNA 8, 1253–1266. [DOI] [PMC free article] [PubMed] [Google Scholar]
- Alexandrov A, Elizabeth JG, and Phizicky EM (2005). tRNA m7G methyltransferase Trm8p/Trm82p: evidence linking activity to a growth phenotype and implicating Trm82p in maintaining levels of active Trm8p. RNA 11, 821–830. [DOI] [PMC free article] [PubMed] [Google Scholar]
- Shaheen R, Abdel-Salam GMH, Guy MP, Alomar R, Abdel-Hamid MS, Afifi HH, Ismail SI, Emam BA, Phizicky EM, and Alkuraya FS (2015). Mutation in WDR4 impairs tRNA m7G46 methylation and causes a distinct form of microcephalic primordial dwarfism. Genome Biol. 16, 210. [DOI] [PMC free article] [PubMed] [Google Scholar]
- Chu JM, Ye TT, Ma CJ, Lan MD, Liu T, Yuan BF, and Feng YQ (2018). Existence of Internal N7-Methylguanosine Modification in mRNA Determined by Differential Enzyme Treatment Coupled with Mass Spectrometry Analysis. ACS Chem. Biol 13, 3243–3250. [DOI] [PubMed] [Google Scholar]
- Li X, Xiong X, Zhang M, Wang K, Chen Y, Zhou J, Mao Y, Lv J, Yi D, Chen X et al. (2017). Base-resolution mapping reveals distinct m1A methylome in nuclear- and mitochondrial-encoded transcripts. Mol. Cell 68, 993–1005. [DOI] [PMC free article] [PubMed] [Google Scholar]
- Wintermeyer W, and Zachau HG (1970). A specific chemical chain scission of tRNA at 7-methylguanosine. FEBS Lett. 11, 160–164. [DOI] [PubMed] [Google Scholar]
- Küpfer PA, and Leumann CJ (2005). RNA abasic sites: preparation and trans-lesion synthesis by HIV-1 reverse transcriptase. ChemBioChem. 6, 1970–1973. [DOI] [PubMed] [Google Scholar]
- Küpfer PA, and Leumann CJ (2007). The chemical stability of abasic RNA compared to abasic DNA. Nucleic Acids Res. 35, 58–68. [DOI] [PMC free article] [PubMed] [Google Scholar]
- Okamoto H, Watanabe K, Ikeuchi Y, Suzuki T, Endo Y, and Hori H (2004). Substrate tRNA recognition mechanism of tRNA (m7G46) methyltransferase from Aquifex aeolicus. J. Biol. Chem 279, 49151–49159. [DOI] [PubMed] [Google Scholar]
- Lin S, Liu Q, Lelyveld VS, Choe J, Szostak JW, and Gregory RI (2018). Mettl1/Wdr4-mediated m7G tRNA methylome is required for normal mRNA translation and embryonic stem cell self-renewal and differentiation. Mol Cell. 71, 244–255. [DOI] [PMC free article] [PubMed] [Google Scholar]
- Hudson BH, and Zaher HS (2015). O6-methylguanosine leads to position-dependent effects on ribosome speed and fidelity. RNA 21, 1648–1659. [DOI] [PMC free article] [PubMed] [Google Scholar]
- Alexandrov A, Martzen MR, and Phizicky RM (2002). Two proteins that form a complex are required for 7-methylguanosine modification of yeast tRNA. RNA 8, 1253–1266. [DOI] [PMC free article] [PubMed] [Google Scholar]
- Cartlidge RA, Knebel A, Peggie M, Alenandrov A, Phizicky EM, and Cohen P (2005). The tRNA methylase METTL1 is phosphorylated and inactivated by PKB and RSK in vitro and in cells. EMBO J. 24, 1696–1705. [DOI] [PMC free article] [PubMed] [Google Scholar]
- Mamane Y, Petroulakis E, Rong L, Yoshida K, Ler LW and Sonenberg N (2004). eIF4E-from translation to transformation. Oncogene. 23, 3172–3179. [DOI] [PubMed] [Google Scholar]
- Ray PS, Grover R, and Das S (2006). Two internal ribosome entry sites mediate the translation of p53 isoforms. EMBO Rep. 7, 404–410. [DOI] [PMC free article] [PubMed] [Google Scholar]
- Varshney D, Petit AP, Bueren-Calabuig JA, Jansen C, Fletcher DA, Peggie M, Weidlich S, Scullion P, Pisliakov AV, and Cowling VH (2016). Molecular basis of RNA guanine-7 methyltransferase (RNMT) activation by RAM. Nucleic Acids Res. 44, 10423–10436. [DOI] [PMC free article] [PubMed] [Google Scholar]
- Desrosiers R, Friderici K, and Rottman F (1974). Identification of methylated nucleosides in messenger RNA from Novikoff Hepatoma Cells. Proc. Nat. Acad. Sci 71, 3971–3975. [DOI] [PMC free article] [PubMed] [Google Scholar]
- Schwartz S, Bernstein DA, Mumbach MR, Jovanovic M, Herbst RH, Leon-Ricardo BX, Engreitz JM, Guttman M, Satija R, Lander ES et al. (2014). Transcriptome-wide mapping reveals widespread dynamic regulated pseudouridylation of ncRNA and mRNA. Cell 159, 148–162. [DOI] [PMC free article] [PubMed] [Google Scholar]
- Li X, Zhu P, Ma S, Song J, Bai J, Sun F, Yi C (2015). Chemical pulldown reveals dynamic pseudouridylation of the mammalian transcriptome. Nat. Chem. Biol 11, 592–597. [DOI] [PubMed] [Google Scholar]
- Safra M, Sas-Chen A, Nir R, Winkler R, Nachshon A, Bar-Yaacov D, Erlacher M, Rossmanith W, Stern-Ginossar N, and Schwartz S (2017). The m1A landscape on cytosolic and mitochondrial mRNA at single-base resolution. Nature 551, 251–255. [DOI] [PubMed] [Google Scholar]
- Carlile TM, Rojas-Duran MF, Zinshteyn B, Shin H, Bartoli KM, and Gilbert WV (2014). Pseudouridine profiling reveals regulated mRNA pseudouridylation in yeast and human cells. Nature 515, 143–146. [DOI] [PMC free article] [PubMed] [Google Scholar]
- Yang X, Yang Y, Sun BF, Chen YS, Xu JW, Lai WY, Li A, Wang X, Bhattarai DP, Xiao W et al. (2017). 5-methylcytosine promotes mRNA export - NSUN2 as the methyltransferase and ALYREF as an m5C reader. Cell Res. 27, 606–662. [DOI] [PMC free article] [PubMed] [Google Scholar]
- Cui X, Liang Z, Shen L, Zhang Q, Bao S, Geng Y, Zhang B, Leo V, Vardy LA, Lu T et al. (2017). 5-Methylcytosine RNA Methylation in Arabidopsis Thaliana. Mol. Plant 10, 1387–1399. [DOI] [PubMed] [Google Scholar]
- David R, Burgess A, Parker B, Li J, Pulsford K, Sibbritt T, Preiss T, and Searle IR (2017). Transcriptome-Wide Mapping of RNA 5-Methylcytosine in Arabidopsis mRNAs and Noncoding RNAs. Plant Cell 29, 445–460. [DOI] [PMC free article] [PubMed] [Google Scholar]
- Khoddami V, and Cairns BR (2013). Identification of direct targets and modified bases of RNA cytosine methyltransferases. Nat. Biotechnol 31, 458–464. [DOI] [PMC free article] [PubMed] [Google Scholar]
- Sakurai M, Ueda H, Yano T, Okada S, Terajima H, Mitsuyama T, Toyoda A, Fujiyama A, Kawabata H, and Suzuki T (2014). A biochemical landscape of A-to-I RNA editing in the human brain transcriptome. Genome Res. 24, 522–534. [DOI] [PMC free article] [PubMed] [Google Scholar]
- Delatte B, Wang F, Ngoc LV, Collignon E, Bonvin E, Deplus R, Calonne E, Hassabi B, Putmans P, Awe S et al. (2016). Transcriptome-wide distribution and function of RNA hydroxymethylcytosine. Science. 351, 282–285. [DOI] [PubMed] [Google Scholar]
- Xu L, Liu X, Sheng N, Oo KS, Liang J, Chionh YH, Xu J, Ye F, Gao YG, Dedon PC et al. (2017). Three distinct 3-methylcytidine (m3C) methyltransferases modify tRNA and mRNA in mice and humans. J. Biol. Chem 292, 14695–14703. [DOI] [PMC free article] [PubMed] [Google Scholar]
- Karijolich J, and Yu Y (2011). Converting nonsense codons into sense codons by targeted pseudouridylation. Nature. 474, 395–398. [DOI] [PMC free article] [PubMed] [Google Scholar]
- Fu Y, Dominissini D, Rechavi G and He C (2014). Gene expression regulation mediated through reversible m6A RNA methylation. Nat. Rev. Genet 15, 293–306. [DOI] [PubMed] [Google Scholar]
- Li S, and Mason C (2014). The pivotal regulatory landscape of RNA modifications. Annu. Rev. Genomics Hum. Genet 15, 127–150. [DOI] [PubMed] [Google Scholar]
- Dai Q, Moshitch-Moshkovitz S, Han D, Kol N, Amariglio N, Rechavi G, Dominissini D, and He C (2017). Nm-seq maps 2’-O-methylation sites in human mRNA with base precision. Nat. Methods 14, 695–698. [DOI] [PMC free article] [PubMed] [Google Scholar]
- Shen QC, Zhang Q, Shi Y, Shi QZ, Jiang YY, Gu Y, Li ZQ, Li X, Zhao K et al. (2018). Tet2 promotes pathogen infection-induced myelopoiesis through mRNA oxidation. Nature 554, 123–127. [DOI] [PubMed] [Google Scholar]
- Guallar D, Bi X, Pardavila JA, Huang X, Saenz C, Shi X, Zhou H, Faiola F, Ding J, Haruehanroengra P et al. (2018). RNA-dependent chromatin targeting of TET2 for endogenous retrovirus control in pluripotent stem cells. Nat. Genet 50, 443–451. [DOI] [PMC free article] [PubMed] [Google Scholar]
- Sonenberg N, and Hinnebusch AG (2009). Regulation of Translation Initiation in Eukaryotes: Mechanisms and Biological Targets. Cell 136, 731–745. [DOI] [PMC free article] [PubMed] [Google Scholar]
- Lovejoy AF, Riordan DP, and Brown PO (2014) Transcriptome-wide mapping of pseudouridines: pseudouridine synthases modify specific mRNAs in S. cerevisiae. PLoS One. 9, e110799. [DOI] [PMC free article] [PubMed] [Google Scholar]
- Hussain S, Aleksic J, Blanco S, Dietmann S, and Frye M (2013). Characterizing 5-methylcytosine in the mammalian epitranscriptome. Genome Biol. 14, 215–224. [DOI] [PMC free article] [PubMed] [Google Scholar]
- Mazumber B, Sechadri V, and Fox PL (2003) Translational control by the 3’-UTR: the ends specify the means. Trends Biochem Sci. 28, 91–98. [DOI] [PubMed] [Google Scholar]
- Honda S, Shigematsu M, Morichika K, Telonis AG, and Kirino Y (2015). Four-leaf clover qRT-PCR: a convenient method for selective quantification of mature tRNA. RNA Biol. 12, 501–508. [DOI] [PMC free article] [PubMed] [Google Scholar]
- Meng J, Cui X, Rao MK, Chen Y, and Huang Y (2013). Exome-based analysis for RNA epigenome sequencing data. Bioinformatics, 12, 1565–1567. [DOI] [PMC free article] [PubMed] [Google Scholar]
- Cui X, Meng J, Zhang S, Chen Y, and Huang Y (2016). A novel algorithm for calling mRNA m6A peaks by modeling biological variances in MeRIP-seq data. Bioinformatics, 32, i378–i385. [DOI] [PMC free article] [PubMed] [Google Scholar]
- Cui X, Zhang L, Meng J, Rao MK, Chen Y, Huang Y (2018) MeTDiff: A Novel Differential RNA Methylation Analysis for MeRIP-Seq Data. IEEE/ACM Trans Comput Biol Bioinform. 15, 526–534. [DOI] [PubMed] [Google Scholar]
- Wang X, Lu Z, Gomez A, Hon GC, Yue Y, Han D, Fu Y, Parisien M, Dai Q, Jia G et al. (2014). N6-methyladenosine-dependent regulation of messenger RNA stability. Nature, 505, 117–120. [DOI] [PMC free article] [PubMed] [Google Scholar]
- Gandin V, Sikstrom K, Alain T, Morita M, McLaughlan S, Larsson O, and Topisirovic I (2014). Polysome fractionation and analysis of mammalian translatomes on a genome-wide scale. J. Vis. Exp 87, 1–10. [DOI] [PMC free article] [PubMed] [Google Scholar]
- Hafner M, Landthaler M, Burger L, Khorshid M, Hausser J, Berninger P, Rothballer A, Ascano M, Jungkamp AC, Munschauer M et al. (2010). PAR-Clip - a method to identify transcriptome-wide the binding sites of RNA binding proteins. J. Vis. Exp 41, e2034. [DOI] [PMC free article] [PubMed] [Google Scholar]
- Liu J, Yue Y, Han D, Wang X, Fu Y, Zhang L, Jia G, Yu M, Lu Z, Deng X, Dai Q, Chen W, and He C (2014). A METTL3-METTL14 complex mediates mammalian nuclear RNA N6-adenosine methylation. Nat Chem Biol. 10, 93–95. [DOI] [PMC free article] [PubMed] [Google Scholar]
- Arango D, Sturgill D, Alhusaini N, Dillman AA, Sweet TJ, Hanson G, Hosogane M, Sinclair WR, Nanan KK, Mandler MD et al. (2018) Acetylation of Cytidine in mRNA Promotes Translation Efficiency. Cell. 175, 1872–1886. [DOI] [PMC free article] [PubMed] [Google Scholar]
Associated Data
This section collects any data citations, data availability statements, or supplementary materials included in this article.
Supplementary Materials
Method S1. Detailed protocol describing m7G-seq in this study, Related to Figure 3.
Table S3. 801 confident m7G sites showing in m7G-seq across both replicates of the two cell lines (HeLa and HepG2), Related to Figure 5 and Figure S5.
Data Availability Statement
RNA sequencing data listed in Table S1 are available in the Gene Expression Omnibus (http://www.ncbi.nlm.nih.gov/geo) under accession number GSE112276.