

Abstract
Neurons of neocortical layers II–VI in the dorsomedial cortex of the mouse arise in the pseudostratified ventricular epithelium (PVE) through 11 cell cycles over the six embryonic days 11–17 (E11–E17). The present experiments measure the proportion of daughter cells that leave the cycle (quiescent or Q fraction or Q) during a single cell cycle and the complementary proportion that continues to proliferate (proliferative or P fraction or P; P = 1 − Q). Q and P for the PVE become 0.5 in the course of the eighth cycle, occurring on E14, and Q rises to ∼0.8 (and P falls to ∼0.2) in the course of the 10th cycle occurring on E16. This indicates that early in neuronogenesis, neurons are produced relatively slowly and the PVE expands rapidly but that the reverse happens in the final phase of neuronogenesis. The present analysis completes a cycle of analyses that have determined the four fundamental parameters of cell proliferation: growth fraction, lengths of cell cycle, and phases Q and P. These parameters are the basis of a coherent neuronogenetic model that characterizes patterns of growth of the PVE and mathematically relates the size of the initial proliferative population to the neuronal population of the adult neocortex.
Keywords: neocortical neuronogenesis, cell cycle, proliferation, mouse, ventricular zone
The neocortical histogenetic sequence is initiated with generations of neurons (neuronogenesis) in the pseudostratified ventricular epithelium (PVE) at the margin of the ventricular cavities (Fig. 1) (His 1889; Schaper 1897; Sauer 1935; Sauer et al., 1959; Fujita 1963; Stensaas and Stensaas, 1968; Hinds and Ruffett, 1971; Sidman and Rakic, 1982; Takahashi et al., 1993, 1995a). Within the cortex, the earliest formed postmitotic neurons migrate to the deepest cortical layers and progressively later-arising neurons migrate past them to progressively more superficial layers (Sidman and Rakic, 1973; Caviness, 1982). Once neurons take up their final positions, their numbers are reduced by histogenetic cell death (Finlay and Slattery, 1983; Finlay and Pallas, 1989). Thus, the events of neocortical histogenesis are extended in time and proceed in widely separated zones that are greatly different in structure. Yet these events are regulated coordinately to arrive at a neuronal density that is approximately the same from region to region of the same brain and in the brains of diverse mammalian species (Rockel et al., 1980;Schüz and Palm, 1989; Finlay and Darlington, 1995; Caviness, 1995).
Fig. 1.

Schematic representation of the developmental changes associated with the PVE in the neocortical cerebral wall during the neuronogenetic interval. The PVE is approximately coextensive with the ventricular zone (VZ) lying at the ventricular margin. Young postmitotic neurons migrate across the intervening cerebral wall (broken arrows) to the developing cortex (CTX). The cells of the PVE undergo interkinetic nuclear migration (curved arrows) in the course of the cell cycle, which begins with the G1 phase and progresses through S and G2 and is completed with the M phase. Postmitotic cells either exit the cell cycle (Q fraction,Q1–Q11) or elongate throughG1 phase to reenter S phase (P fraction,P1–P11). Before the onset of neuronogenesis, the P fraction is 1.0, and theQ fraction is 0. Q becomes >0 with the onset of neuronogenesis (i.e., Q1 > 0) and eventually reaches 1.0 at the end of the neuronogenetic interval, which corresponds to 11 integer cell cycles (CC1–CC11) in mouse. Reciprocally,P follows a path from 1.0 to 0. The PVE gradually increases in height, but over the final cycles it involutes and ceases to exist with the termination of CC11. At the completion of CC11, all postmitotic cells exit the VZ asQ (Terminal Output).
The present analysis is a pivotal link in a series of investigations that are concerned with the regulation of neocortical neuron numbers (Takahashi et al., 1992, 1993, 1994, 1995a,b). In previous studies, we have determined that the length of the cell cycle (TC) increases in the dorsomedial cerebral wall of the mouse, and we have established that the neuronogenetic interval, which extends from embryonic day 11 (E11) through early E17 in mice, corresponds to approximately 11 cell cycles (Takahashi et al., 1995a). We have also established that the growth fraction of the PVE remains at 1.0 throughout the course of neuronogenesis (Takahashi et al., 1995a). These measures in themselves, however, are insufficient as a basis from which to estimate the cellular productivity of the PVE. Missing are measures of the proportion of daughter cells that “elect” either to exit the cycle as terminally postmitotic neurons (the quiescent or Q fraction of postmitotic cells or Q) or remain in the cycle (the proliferative or P fraction of postmitotic cells or P), that is, to replenish or even enlarge the proliferative pool (Fig. 1) (Takahashi et al., 1993).
The specific objective of the experiments reported here is to determine P and Q across the neuronogenetic interval. With those values, taken together with cell cycle parameters determined earlier, we arrive at a quantitative characterization of PVE proliferative behavior that we refer to as a neocortical neuronogenetic model. This neuronogenetic model will serve as an analytic tool for estimating other parameters of histogenesis, such as the total number of neurons to be formed and the rate that they will be formed over the course of neocortical neuronogenesis. The model will also be used to make specific predictions about the behavior of the proliferating cells and their progeny, which will be amenable to experimental validation. Finally, it will serve as a general formulation applicable to neocortical histogenesis across mammalian species (Caviness et al., 1995).
MATERIALS AND METHODS
Animals. CD1 mice were maintained on a 12 hr (7:00 A.M.-7:00 P.M.) light/dark cycle. Conception (E0) was ascertained by plug-checks conducted at 9:00 A.M.
Experimental design. The experimental design is identical to one used previously in analysis of proliferative behavior of small, strictly specified cohorts of cells of the PVE (Takahashi et al., 1994). Experiments were initiated at 7:00 A.M. on each of E12–E16, inclusive, corresponding to the greater part but not the entire neuronogenetic interval. Proliferating cells of the embryonic cerebral wall are exposed sequentially, by intraperitoneal injection into pregnant dams, to the S-phase marker tritiated thymidine (3H-TdR; 5 μCi/gm body weight) and the thymidine analog BUdR (50 μg/gm body weight; Sigma, St. Louis, MO). Two separate tracer injection protocols make possible the experimental determination of separate values for the number of Q and P cells (NQ+P) (Fig. 2, Protocol 1) and the number of Q cells (NQ) (Fig. 2, Protocol 2) in a primary cohort of proliferative cells that exit S phase in synchrony over a 2 hr interval (Takahashi et al., 1994) (for details, see legend to Fig. 2). By using the two injection protocols in two subsets of animals, NQ+P is determined from Protocol 1 for one subset of animals and NQis determined from Protocol 2 for the second subset of animals. The Q fraction itself can then be calculated as the ratio ofNQ to NQ+P, and the P fraction is equal to 1 − Q.
Fig. 2.
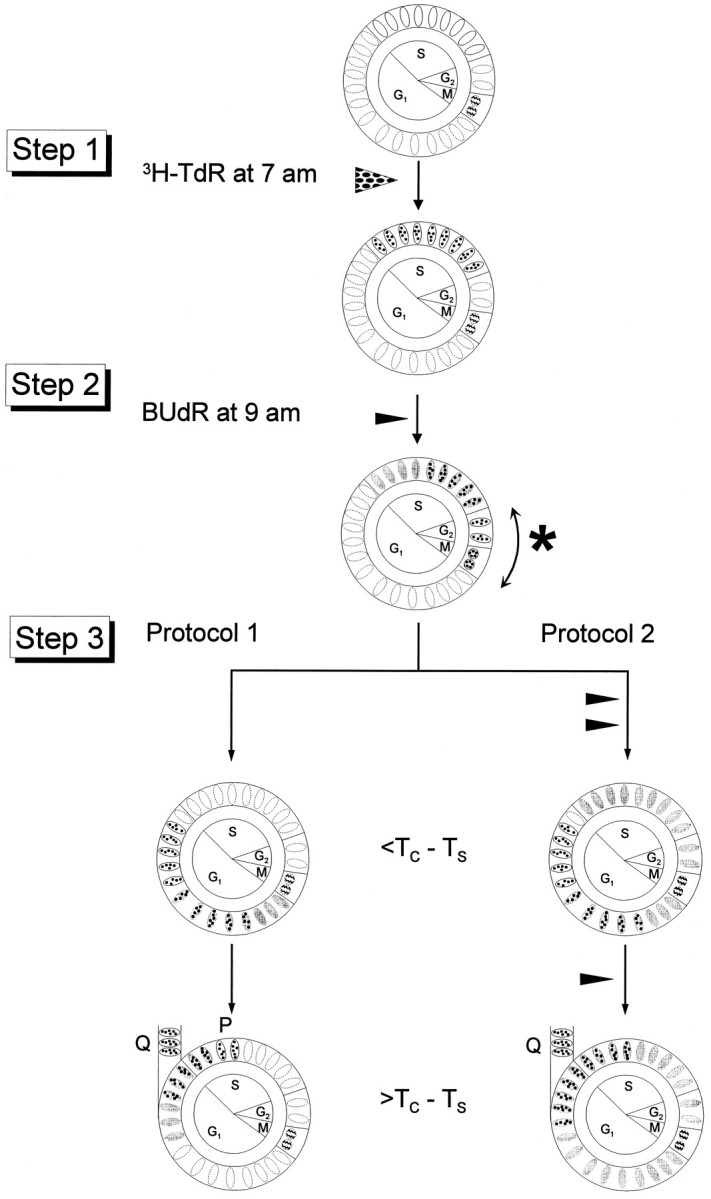
Labeling protocols for determining the number of cells in the combined Q+P fractions (Protocol 1) and those in the Q fraction (Protocol 2). Step 1, The embryos are exposed to tritiated thymidine (3H-TdR) at 7:00 A.M. on each of E12–E16. The3H-TdR labels the cells in S, as indicated by the dots over the nuclei. Step 2, 2 hr later at 9:00 A.M. the embryo is exposed to BUdR, which again labels cells in S phase (gray-filled nuclei). The sequence of 3H-TdR and BUdR exposures results in three types of labeled cells: (1) cells that leftS for G2 during the 2 hr interinjection interval, referred to as the 2 hr cohort of cells (∗), will be labeled only with 3H-TdR (dots in the nucleus); (2) cells that entered S during the 2 hr interinjection interval will be labeled only with BUdR (gray-filled nuclei); and (3) cells that remained in S during the interinjection interval (gray-filled nuclei and black dots). Embryos labeled in this way are then partitioned into two subsets (Step 3). Step 3, Protocol 1(left), Embryos receive no further exposure to BUdR. At an interval after the initial BUdR exposure, which is longer than the duration of the cell cycle minus the duration of S phase (>TC–TS), both the Q and P fraction cells of the 2 hr cohort will be labeled only with3H-TdR. That is, the number of cells labeled only with3H-TdR with Protocol 1 corresponds to the number of cells of the cohort in the combined Q and P fractions (NQ+P). Step 3, Protocol 2(right), Embryos will receive a sequence of additional exposures to BUdR (Step 3, right). At an interval >TC–TS, the P fraction cells of the 2 hr cohort will reenter S phase and become labeled with BUdR, and thus are eliminated from the cohort. That is, the number of cells labeled only with 3H-TdR withProtocol 2 corresponds to the number of cells of the cohort in the Q fraction (NQ) .
Embryos labeled by either of the two injection protocols were removed by hysterotomy from dams anesthetized deeply by an intraperitoneal injection of a mixture of ketamine (50 mg/kg body weight) and xylazine (10 mg/kg). At E12–E14, the embryos were decapitated, and the whole heads were fixed with 70% ethanol overnight. E15 and E16 embryos were perfused via the left ventricle with 70% ethanol. They were dehydrated and embedded in paraffin as described previously (Takahashi et al., 1992, 1993, 1994). Immunocytochemistry and autoradiography were performed on 4 μm coronal sections as described previously (Takahashi et al., 1992, 1993,1994).
Limits to the temporal window of the methods. The study design and methods used here do not permit us to specify with direct experiment measurements more accurately than did earlier “time-of-origin experiments” the time of initiation and termination of the neuronogenetic interval that we considered to begin early on E11 and to continue until early on E17 (Takahashi et al., 1995a). Thus, we made no attempt to determine with the present or earlier experiments the precise moments when the first and last neurons arise from the dorsomedial neocortical PVE. Furthermore, we made no attempt to measure Q and P experimentally on E11 because there would have been so few3H-TdR-only cells (with Q ≪ 0.1) that the results, in our opinion, would have been unreliable. We also made no attempt in these experiments to define Q and P through the early hours of E17 because Q would have reached 1.0, and P would have reached zero. Indeed, the experimental design suitable for the analyses on E12–E16 could not have been repeated from 9:00 A.M. on E17. This is because the PVE would have become exhausted as a pool of neuronal precursors before completion of the requiredTC–TSinterval.
Analysis. The analysis is undertaken in a standard coronal sector of the dorsomedial cerebral wall (Takahashi et al., 1992, 1993). The sector is 100 μm in its medial–lateral dimension and 4 μm (corresponding to section thickness) in its rostral–caudal dimension. The sector is divided in its radial dimension into bins 10 μm in height, and the bins are numbered 1, 2, 3, and so on from the ventricular margin (Takahashi et al., 1992, 1993). Cells labeled only with 3H-TdR (distinguishable from background, typically four or more grains per nucleus) were scored with respect to their bin location in the cerebral wall.
Data were collected from the standard coronal sector from the brains of 16 embryos at each age: eight brains (four brains from each of two separate litters treated by Protocol 1) were used to obtainNP+Q, and eight brains (four brains from each of two separate litters treated by Protocol 2) were used to obtainNQ. The number of 3H-TdR-only labeled cells was counted on six nonadjacent sections for each brain, and then the average and SEM values for each set of eight embryos were calculated to obtain NP+Q andNQ for each day of the neuronogenetic interval (Takahashi et al., 1994).
This basic analytic method was modified slightly to deal with the differential distributions and proliferative behaviors of the PVE and the secondary proliferative populations (SPP) at different times of development. Thus, the PVE is approximately co-extensive with the ventricular zone (VZ) during the entire neuronogenetic interval, but the distribution of the SPP changes markedly (Takahashi et al., 1995a,b). The SPP is first detectable on E13 as a few rare abventricular mitotic figures at the border between the VZ and the primitive plexiform zone (PPZ). Thus, the measurements ofNQ+P and NQ obtained on E12 and E13 in essence are direct measurements of the behavior of the PVE cells. The SPP then enlarges rapidly and populates the entire subventricular (SVZ)–intermediate (IZ) zone continuum after these two strata emerge in the dorsomedial cerebral wall in the course of E14 (Takahashi et al., 1995a,b). Concurrently the SPP increases substantially as a proportion of the total proliferative population of the cerebral wall. By E14 the PVE comprises ∼89% and the SPP 11% of the total proliferative population of the dorsomedial cerebral wall, and by E16 these proportions are 65% and 35% (Table 4, column 3) (Takahashi et al., 1995b)).
Table 4.
Values for Q and P for the PVE and for the SPP E14–E16
| (1) Age | (2) Proliferative population | (3) % of total proliferative population | (4) | (5) NP+Q | (6) NP | (7) P | (8) Q |
|---|---|---|---|---|---|---|---|
| PVE | 89 | 17.30 | 10.8–11.3 | 0.62–0.66 | 0.34–0.38 | ||
| E14 | SPP | 11 | 19.40 | 2.10 | 1.54–2.10 | 0.73–1.0 | 0–0.27 |
| PVE | 86 | 15.66 | 5.19 | 0.33 | 0.67 | ||
| E15 | SPP | 14 | 18.21 | 2.55 | 2.29 | 0.90 | 0.10 |
| PVE | 65 | 12.14 | 2.59 | 0.21 | 0.79 | ||
| E16 | SPP | 35 | 18.68 | 6.54 | 5.93 | 0.91 | 0.09 |
The PVE and the SPP as fractions of the total proliferative population (column 3) have been determined previously (Takahashi et al., 1995b). The total numbers of cell in the 2 hr cohort, including those in the P and Q fractions (NP+Q, column 4), are assigned to either the PVE or the SPP and entered in column 5. These values are derived as the products of the values in columns 3 and 4. The number of cells of the P fraction (NP) are determined separately for the PVE and SPP and are entered in column 6. For the derivation of these values, see P and Q fractions of the PVE and of the SPP in Results. The P fraction (column 7) is the values in column 6 divided by those in column 5; the Q fraction (column 8) is the complement of the P fraction (1.0 minus the values in column 7; i.e., 1 − P).
The difficulty for the present analysis is that from E14 to E16, cells of the PVE and SPP intermingle with each other at the interface of VZ and SVZ (Takahashi et al., 1993, 1995a,b), and in this small portion of the developing cerebral wall the two populations cannot be separated by cytoarchitectonic criteria. For this reason, after E14 separate measures of the values of P and Q for the PVE and for the SPP were obtained by following a strategy that will be described in detail in Results.
RESULTS
The dorsomedial cerebral wall is ∼50 μm in thickness at the initiation of these experiments on E12 (Fig. 3). The thickness increases nearly eightfold to ∼400 μm at the time that the experiments are completed on E16 (Takahashi et al., 1995a). Before E14 the VZ is ∼80-90% of the thickness of the cerebral wall, with only a narrow PPZ interposed between VZ and pia. Late on E14 several histogenetic transitions occur essentially simultaneously. First, the cortical strata, including molecular layer, cortical plate, and subplate, emerge at the surface of the cerebral wall. Second, the IZ intervenes between cortical strata and VZ. Third, the SVZ becomes distinguishable in the depths of the IZ at its interface with the VZ.
Fig. 3.

Growth of strata of the murine dorsomedial cerebral wall during the neuronogenetic interval E11–E17 (modified from Takahashi et al., 1995a). The height of each stratum was obtained by direct measurement in histological sections. The ventricular surface is at 0 on the y-axis. The upper border of the ventricular zone (VZ) is indicated byclosed circles, the pial surface by X, the subventricular zone and intermediate zone (SVZ, IZ) border by open circles, the border betweenIZ and the developing cortex (CTX) by closed squares, and the border betweenCTX and the molecular layer (ML) byclosed triangles. The contours tracing progressive growth of strata were made initially by a least-squares fit to a fourth-order curve and then smoothed by eye. Through early E14, the cerebral wall has only two strata, the primitive plexiform zone (PPZ) and the VZ. The VZ approaches maximum height by E15, which then declines ∼50% by the end of E16 as it involutes. The cortical strata (ML + CTX), by contrast, increase progressively in height. The period of most rapid growth of the IZ is completed early on E14.
The PVE, although approximately co-extensive with the VZ, must be distinguished as a specific proliferative population from the VZ, which is an architectonically defined stratum (Takahashi et al., 1992). The VZ includes three separate populations: proliferative PVE cells (i.e., P fraction), Q fraction cells of the PVE exiting through the VZ, and the cells of the SPP. The importance of this distinction is that in the outer region of the VZ, the SPP overlaps with the PVE (Takahashi et al., 1993, 1995a).
P and Q fractions of the overall proliferative population (PVE + SPP)
From the microscopic perspective, the cells labeled only with 3H-TdR define the P+Q and Q-only populations, depending on the experiment. For data analysis at each of E12–E16, sections similar to the ones shown in Figure 4were used to obtain the distribution of P+Q cells and of Q cells only, which were mapped with respect to depth in the cerebral wall (per 10 μm bin; see Materials and Methods). The distribution of P cells was obtained by taking the difference between the number of P+Q cells and the number of Q cells on a bin-by-bin basis (Figs. 5, 6) (Takahashi et al., 1994). The quantitative distributions that were obtained confirm the impression derived from sections shown in Figure 4that the cells of the P+Q fractions are distributed widely from the ventricular surface throughout the IZ. As expected from our choice of survival times (Table 2), none of the P+Q fraction cells was observed to be in mitosis.
Table 1.
Abbreviations used
| CC1–11 | Integer cell cycles 1–11 |
| CTX | Neocortex |
| IZ | Intermediate zone |
| ML | Molecular layer |
| NQ | Number of Q fraction cells |
| NQ+P | Number of Q and P fraction cells |
| P | P fraction |
| PPZ | Primordial plexiform zone |
| PVE | Pseudostratified ventricular epithelium |
| Q | Q fraction |
| SPP | Secondary proliferative population |
| SVZ | Subventricular zone |
| TC | Length of cell cycle |
| TS | Length of S phase |
| VZ | Ventricular zone |
Fig. 4.
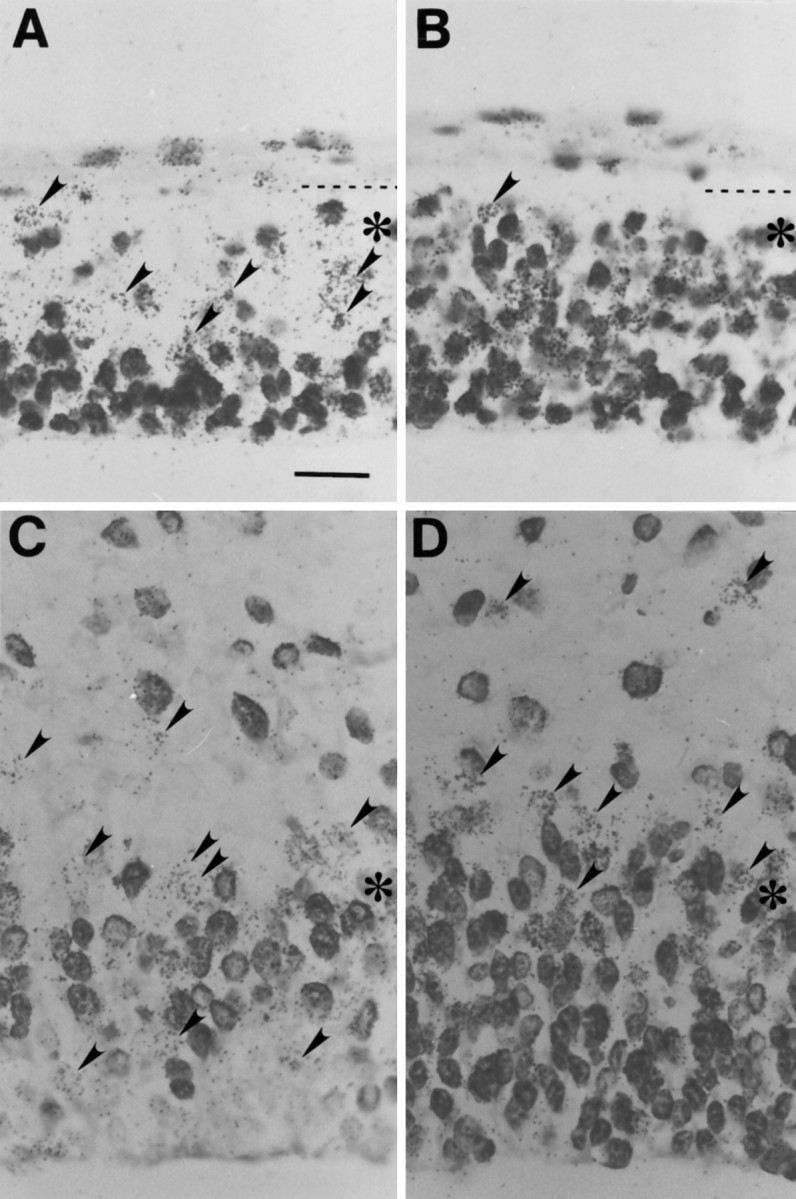
A, C, Representative micrographs of preparations labeled according to Protocol 1 in Figure2; B, D, those labeled according to Protocol 2 in Figure2. These micrographs show comparative distributions of cells of the combined Q + P (A, C) and Q fractions (B, D) in the 2 hr cohort at E12 (A, B) and E15 (C, D). At E12, the micrograph includes the full height of the cerebral wall. The pial surface is indicated by a dashed line, and the border between the VZ and SVZ zones is indicated by asterisks. At E15, the micrograph includes only the VZ and the adjacent SVZ and IZ. Cells marked only by 3H-TdR are recognized as accumulations of silver grains over the cell nucleus (arrowheads). Cells labeled with BUdR or BUdR and3H-TdR have darkly stained nuclei. Scale bar (shown inA): 20 μm.
Fig. 5.

The distributions of cells of the P, Q, and P+Q fractions on E12 and E13. The analysis is undertaken in a coronal sector of the dorsomedial cerebral wall that is 100 μm in its medial–lateral dimension and 4 μm (corresponding to section thickness) in its rostral–caudal dimension. The sector is divided in its radial dimension into bins (x-axis) 10 μm in height and numbered 1, 2, 3, and so on from the ventricular margin (Takahashi et al., 1992, 1993). The number of cells in the Q (NQ) and P+Q fractions (NP+Q) for each bin (y-axis) are determined according to the method illustrated and described in Figure 2. The values for P fraction cells (NP) are estimated asNP+Q − NQ. On E12 and E13, the dorsomedial cerebral wall is formed of only two strata, the VZ and the PPZ (see Fig. 3). Error bars represent SEM.
Fig. 6.

The distributions of cells of the P, Q, and P+Q fractions on E14–E16. See legend to Figure 5 for details. On E14–E16, the dorsomedial cerebral wall is formed of the VZ, the IZ, and the developing cortex (CTX; see Fig. 3). The bins 10 μm in height (see legend to Fig. 5) are the x-axis. Error bars represent SEM.
Table 2.
Summary of PVE cell cycle phase durations (hours) and experimental intervals
| Embryonic days | TC–TS | TC | Experimental interval (after initial BUdR) |
|---|---|---|---|
| E12 | 5.3 | 10.2 | 6.5 |
| E13 | 7.5 | 11.4 | 9.5 |
| E14 | 11.3 | 15.1 | 12.5 |
| E15 | 13.8 | 17.5 | 15 |
| E16 | 14.4 | 18.4 | 17 |
TC, Length of cell cycle;TS, length of S phase.TC–TS andTC have been established previously (Takahashi et al., 1995a). For the present experiments, the duration of survival after the initial (or only) injection of BUdR was greater thanTC–TS but shorter than would be required for the P fraction to complete a second M phase, i.e., shorter than TC.
For each age, the total number of cells in the entire cohort (i.e.,NP+Q for PVE and SPP collectively) and the total number of cells in the Q fraction only (NQ) are shown in Table 3 (columns 2 and 3, respectively). The Q fraction for the overall proliferative population (PVE + SPP collectively), i.e., the fraction of cells exiting the cell cycle, for each embryonic date from E12 through E16, isNQ/NP+Q. Q increases from 0.11 on E12 to ∼0.6 on E15 and E16 (Table 3, column 4). The P fraction, 1 − Q (Table 3, column 5), decreases from just under 0.9 on E12 to ∼0.4 on E15 and E16.
Table 3.
Estimate of Q and P for the entire proliferative population (PVE + SPP)
| (1) Embryonic days | (2) NP+Q | (3) NQ | (4) Q | (5) P |
|---|---|---|---|---|
| E12 | 17.23 | 1.94 | 0.11 | 0.89 |
| E13 | 25.90 | 4.96 | 0.19 | 0.81 |
| E14 | 19.40 | 6.52 | 0.34 | 0.66 |
| E15 | 18.21 | 10.73 | 0.59 | 0.41 |
| E16 | 18.68 | 10.60 | 0.54 | 0.46 |
The total number of cells in the 2 hr synchronous cohort, including those in the P and Q fractions (NP+Q) estimated by labeling protocol 1 in Figure 2 and the number of cells in the Q fraction alone (NQ) estimated by labeling protocol 2 are entered, for each of E12–E16, in columns 2 and 3, respectively. The Q fraction (=NQ/NP+Q, values in column 3 divided by those in column 2) and the P fraction (= 1 − Q) are entered in columns 4 and 5, respectively.
P and Q fractions of the PVE and the SPP
As mentioned briefly in Materials and Methods, developmental changes in the magnitude and distribution of the SPP require that early and late periods be treated differently. On E12 and E13, the entire proliferative population is PVE. Thus, NP+Q andNQ for the SPP are 0 on both E12 and E13. For this reason the values for Q and P estimated for the overall population may be taken to be the values of Q and P for the PVE on these two dates (Table 3, columns 4 and 5). Over the interval E14–E16, however, the SPP increases from ∼11% to 35% of the total proliferative population (Table 4, column 3) (Takahashi et al., 1995b). For this later interval, Q and P must be estimated separately for the PVE and the SPP. These estimates require two steps, each of which depends on (1) our previous determinations of the sizes of PVE and SPP as fractions of the total proliferative population (Takahashi et al., 1994, 1995b) and (2) the patterns of distribution of PVE and SPP within the cerebral wall.
The first step is a partition of NP+Q of the overall proliferative population into its PVE and SPP components by taking the product of NP+Q of the overall proliferative population (Table 4, column 4) and the fractional contribution of PVE and SPP, respectively (Table 4, column 3). For example, at E14 NP+Q is 19.40 cells, of which 89% (17.30 cells) is apportioned to the PVE and 11% (2.10 cells) is apportioned to the SPP (Table 4, column 5).
The second step is determination of NP for the PVE and for the SPP. On E15 and E16, the P fractions are distributed bimodally with one distribution entirely within the VZ and the other distribution in the SVZ and IZ (Fig.6B,C). On these two dates the P fraction cells can be counted separately for the VZ and the SVZ–IZ. Those of the VZ are assigned by definition to the PVE, whereas those of the SVZ–IZ are assigned by definition to the SPP (Table 4, column 6). The P fraction for PVE and for SPP for each of E15 and E16 is then derived as NP divided byNP+Q (Table 4, column 7); the Q fraction is derived as 1 − P (Table 4, column 8).
On E14, however, the separation of P fraction cells belonging to the PVE and SPP is incomplete, with a small but continuous distribution of the P fraction spanning VZ and SVZ–IZ (Fig. 6A). For this reason, a range of plausible estimates forNP of the PVE and SPP was made as described previously (Takahashi et al., 1994). Briefly, the range is determined by moving imaginary “dividing lines” between bins where the P fraction cells are assigned either totally to the SPP or totally to the PVE. The minimum plausible estimate for P of 0.62 for the PVE was obtained when the dividing line between PVE and SPP was taken to lie between bins 6 and 7. The maximum estimate of 0.66 was obtained when the line was set between bins 7 and 8 (Table 4, column 7); the Q fraction is derived as 1 − P (Table 4, column 8).
Progression of Q over the neuronogenetic interval
The Q fraction for the PVE, determined by the series of experiments, follows a monotonic ascent through the interval E12–E16 (Fig. 7). The values for the SPP (Table 4, columns 7 and 8) are indistinguishable from those obtained previously by a totally different method [and discussed in an earlier report (Takahashi et al., 1995b)] and will not be considered further here, where the focus is on values for the PVE.
Fig. 7.

The progression of Q during the neuronogenetic interval of the dorsomedial cerebral PVE. A, Experimentally determined values for Q for E12–E16 are positioned bysolid circles. Open circles at 0 on E11 and at 1.0 on E17 mark the approximate time of initiation and termination of the neuronogenetic interval as estimated from autoradiographic cell birth date experiments (Caviness, 1982).B, The curvilinear ascending progression of Q is plotted with respect to both E11 and E17 and the elapsed integer cell cycles that comprise the neuronogenetic interval. Two fits are shown inB, both incorporating the experimentally determined values of Q plotted for E12–E16 in A (i.e., thesolid circles in A). For the solid line plot, a least-squares curvilinear fit was made to the experimentally determined data plus the initial 0 and terminal 1.0 values of Q for E11 and E17, respectively. For the dashed line plot, a least-squares curvilinear fit was made to the experimentally determined data without considering the initial 0.0 and terminal 1.0 values of Q. Note that the two fits are essentially identical, indicating that the estimates of Q = 0 and Q = 1.0 at E11 and E17, respectively, must be quite close to the actual values.
The onset of the neuronogenetic interval is by definition the moment when Q first becomes nonzero and P becomes <1.0. Correspondingly, the termination of the neuronogenetic interval is by definition the moment when Q reaches 1.0 and P becomes zero (Fig. 1). In our previous analyses, concerned principally with the progression in the length of the cell cycle and its phases across the neuronogenetic interval, we specified the time of initiation and termination of neuronogenesis only approximately as occurring at 9:00 A.M. on E11 and at 9:00 A.M. on E17, respectively (Caviness, 1982; Takahashi et al., 1995a). Here we are able to estimate the moment of initiation and termination somewhat more accurately through recourse to the progression of Q and P. For this more accurate estimate, we construct a best fit curve to the values of Q obtained experimentally on E12–E16. We extrapolate to an initial value for Q of zero, i.e., the x-intercept of the curve, which is found to correspond to late on E10, a starting point consistent with observations of the time of origin of neurons destined for layer I and the subplate (Wood et al., 1992). At the other end of the curve we extrapolate to a terminal value for Q of 1.0, which occurs early on E17. This revised estimate of the time of initiation and termination of the neuronogenetic interval, like our earlier approximation, provides for a neuronogenetic interval of approximately 11 integer cell cycles (precisely, 10.8 cycles). For convenience, we refer to each cell cycle using an abbreviation, CCn, in which the subscript ndesignates the integer cell cycle number (Fig. 1).
At least to the resolution of our methods, the progression of Q (and the complementary descent of P) seems not to pause at the 0.5 or steady-state point. Rather Q continues to increase as a function of time (i.e., Embryonic Days, Fig. 7A) or of integer cell cycle number (Fig. 7B) over the entire course of the neuronogenetic interval. During the middle 2 d of the neuronogenetic interval (i.e., E13 and E14), from CC5through CC8, Q ascends and P descends rapidly, reaching the steady-state level of 0.5, which is the critical turning point in the overall process of waxing and then waning of the proliferative capacity of the PVE, as will be discussed in more detail below. This critical turning point is reached after ∼60% of the neuronogenetic interval, or 70% of the integer cell cycles (i.e., in the course of CC8), has been completed (Fig. 7B).
The critical turning point of the progression of Q above 0.5 and P below 0.5 marks the beginning of the involution of the PVE. The reason for this is simply because if p < 0.5, then fewer cells reenter S phase than have left it, with the necessary consequence that the PVE becomes smaller with each cell cycle. The smaller the value of P (and the larger the value of Q), the more rapid the involution. At the latest developmental age measured, E16, Q is ∼0.8 and P is ∼0.2. The consequence of this is that in the course of a cell cycle the PVE would be reduced in size by 40–60% (2 × P = 2 × 0.2 = 0.4; see legend to Fig. 8for explanation) of its size at the beginning of the cycle. By extrapolation we have determined that during the 24 hr subsequent to E16 (i.e., just over one cell cycle), Q continues to rise toward 1.0, and P continues to fall toward zero. Appropriately, the height of the VZ declines precipitously through E16 and early E17 (Fig. 3).
Fig. 8.

Growth of cortical strata and PVE occurring in the course of the first three integer cell cycles. Growth of the cortical strata reflects the fate and contributions of the Q fraction (broken arrows), whereas the expansion and growth of the PVE reflects the fate of the P fraction (thick arrows). For this illustration, a “unit” population of PVE at the beginning of the first cell cycle (CC1, founder population) is shown as a cube with a volume of 1. The events occurring during each cell cycle are enclosed inbrackets. At the conclusion ofCC1, the postmitotic population is partitioned according to its Q and P fates. Cells with Q fate exit the VZ and migrate to the cortex (dashed arrows). Cells of P fate remain in the PVE (thick arrow), now corresponding to a volume of P1, and will form the proliferative population for CC2. DuringCC2, the premitotic population (size now = P1) will double in size (=P1∗2, shown as two separate blocks). Again, a proportion of cells equal to Q2for CC2 exit the VZ so that the exiting population will be (P1∗2)∗Q2, i.e., the volume of the PVE at the beginning of CC2 × Q for CC2. As the population exits, the size of the population that will progress to CC3 will be(P1∗2)∗P2, where P2is P for CC2. The cumulative output from CC1and CC2 will be the sum of the output of the two cycles, that is, Q1 + (P1∗2)∗Q2. The same process repeats itself during the third cell cycle (CC3): the size of the population that will progress to CC4will be[{(P1∗2)∗P2}∗2]∗P3and the cumulative output will be Q1 + (P1∗2)∗Q2 + [{(P1∗2)∗P2}∗2]∗Q3. Note that this is a highly schematic representation that describes the behavior of a unit of PVE in which proliferative activity is perfectly synchronized.
DISCUSSION
Neocortical neuronogenetic model
Elementary parameters
Four parameters govern the growth and output of a founder proliferative population. These are (1) the growth fraction, i.e., the proportion of PVE cells that is proliferating [determined previously to be essentially 1.0 (Takahashi et al., 1995a)]; (2) the number of integer cell cycles comprising the neuronogenetic interval [approximately 11 for the PVE) (Takahashi et al., 1995a)]; and (3) Q and (4) P at each integer cell cycle. Cell death, if substantial in the PVE, would obviously also affect both growth and output. We will return to this consideration in a subsequent section.
Growth of the PVE
Growth of the PVE can be calculated for an arbitrarily sized founder “unit” (Fig. 8). The unit can be either theaverage single cell or, because cell density in the PVE is constant (Takahashi et al., 1993, 1995a), a unit volume of the PVE present at the beginning of G1 of CC1. Before the outset of neuronogenesis (Q = 0 and P = 1), the PVE would double in cell number and volume with each cell cycle.
Once Q becomes nonzero, the PVE will grow by a factor equal to twice the P for each integer cell cycle (see legend to Fig. 8 for details). Cycle-to-cycle growth is multiplicative, so that the size of the PVE (PVEN) derived from a unit founder population over the course of N cell cycles is:
| Equation 1 |
where Pn is the P fraction of cell cyclen. (⊓ is a mathematical symbol that means take the product of the elements in a series.) The founder unit of the PVE will increase until Pn becomes 0.5, that is, over the first eight cell cycles. It reaches its maximum size after an increase of >55 times its initial size (Fig. 9). Growth must be accommodated principally by tangential expansion of the epithelium, because our data show that the radial expansion of the epithelium is limited to a 2.7-fold increase (30 μm on E11 to 80 μm on early E15) (Fig. 3). Radial rather than tangential contraction will be the consequence of the rapid reduction in the number of proliferative cells after P declines below 0.5.
Fig. 9.

Expansion and involution of a founder PVE population and cell output over the course of the neuronogenetic interval. The volume of the PVE (Volume of PVE), the cell output from a single cell cycle (PVE Output), and the cumulative cell output (Cumulative Output) are calculated from Equations 1 and 2 in the Discussion. The values are plotted with respect to both the elapsed cell cycles,CC1–CC11, and embryonic days on the abscissa. At the beginning of the neuronogenetic interval, where 0 cell cycles have elapsed (i.e., the beginning of CC1) at 9:00 A.M. on E11, the PVE volume is set at the arbitrary unit value of 1.0, and cell output at this point is by definition 0. The vertical dashed linedivides the neuronogenetic interval with respect to where Q and P reach the critical turning point of 0.5. To the left of thevertical dashed line, Q < 0.5 and the PVE is expanding; to the right of the vertical dashed line, Q > 0.5 and the PVE is involuting. The PVE size reaches its maximum value at this point, and cell output/cycle is maximum beyond this point. The P fraction cells ofCC11 will divide to produce two daughter cells, all of which (Q = 1.0) will exit the cell cycle as the terminal output (TO on the abscissa). The contribution of Q from the first half of the 11 cell cycles (CC1–6) is only ∼6%, whereas that of the last two cycles (CC10–11) and the terminal output is ∼50% of the total neuronal population of the cortex at the end of the neuronogenetic interval. Our previous estimate of the cumulative output throughout the full neuronogenetic interval (Caviness et al., 1995) was approximately twice that represented here. This is because the unit founder population was considered to be the population of the cell cycle preceding CC1 for the previous estimate but was considered to be the population at the beginning of G1 ofCC1 in this plot.
Neuronal output
The cumulative output of a one-unit size founder population through N cell cycles (OUTN) is the sum of the output from CC1 (= Q1) and those from each of CC2–CCn or:
| Equation 2 |
where Qn is the Q fraction of CCn and PVEn − 1 is the size of the PVE at the beginning of the preceding cell cycle (= CCn − 1; see legend to Fig. 8 for explanation). As the final cell cycle is completed (i.e., at the end of CC11), all of the P fraction cells from CC11will divide into two daughter cells giving rise to 2 × PVE11 cells. These will exit the VZ as the terminal output (Fig. 1). Thus, the average founder cell will give rise to OUT11 + 2 × PVE11 or approximately 140 cells over the full neuronogenetic interval (Fig. 9). Taken together, Equations 1 and 2 describe the neuronogenetic model and an entire dynamic process, including growth and involution of the PVE and the fractional contribution of each of the 11 cell cycles to the postmigratory neuronal population of the cortex (presented graphically in Fig. 10).
Fig. 10.

Graphic representation of the entire set of dynamic events of the PVE. This schema shows the growth and involution of the PVE and the output of the PVE at each of the 11 cell cycles comprising the neuronogenetic interval. The fractional contribution of the PVE output to the postmigratory neuronal population of the cortical plate is also shown. The PVE continues to enlarge as long as p > 0.5, that is, throughCC8. Thereafter, in the course ofCC9–11, the PVE becomes progressively smaller and eventually is replaced by the ependyma, which will line the ventricle in the adult animal. The contribution of Q to theCortical Strata is minimal initially but increases with successive integer cycles and is maximum withCC10. The relative contribution of the final cycle, CC11, and the terminal output (TO) to the neuronal population of the cortex lessens with exhaustion of the PVE. Note that the schema ignores the consequences of cell death on the final proportions of neurons to arise from the successive integer cycles.
Cell death
This simple neuronogenetic model does not provide for cell death in the proliferative population. Estimates based on pyknotic or necrotic cells by light and electron microscopy (Stensaas and Stensaas, 1968; Hinds and Ruffett, 1971; Nowakowski and Rakic, 1981; Gressens et al., 1991; Takahashi et al., 1992; Reznikov and van der Kooy, 1995) have varied from 0% to a few percent. A recent estimate, on the basis of staining with ISEL+, places cell death in the VZ at 50–70% (Blaschke et al., 1996). This high rate of cell death would preclude growth of the PVE and also an acceleration in the output of neurons from the PVE over the course of the neuronogenetic interval. That both phenomena occur is incontrovertible (Rakic, 1974; Luskin and Shatz, 1985; Bayer and Altman, 1991). Because 100% of PVE cells are proliferating (Waechter and Jaensch, 1972; Takahashi et al., 1993,1995a), the suggested clearance time of dead cells of 24–48 hr implies that dying cells synthesize DNA, execute multiple cell cycles, and also undergo interkinetic nuclear migration. Thus the meaning of the ISEL+-labeled cells is unclear, and the actual rate of cell death within the PVE must be viewed, for the present, as unknown but probably small. Whatever the true rate, if the clearance time of dying cells is short compared with Tc and involves only the Q fraction, cell death would reduce output but not growth of the PVE. If it involves the P fraction, the estimate of the rate of growth of the PVE (Eq. 1) would require a corresponding reduction in the factor P.
Proliferative fates: symmetric and asymmetric cell divisions
With respect to proliferative fate, a cell division may be “symmetric,” where both daughter cells are either Q or P, or it may be “asymmetric,” with one daughter cell Q and one P (Rakic, 1988). In the neuronogenetic model, at any given time during the neuronogenetic interval the relative proportions of the three types of cell division would be given by the binomial theorem and determined by the Q and P (Fig. 11). Observations consistent with the predictions of our model have been made by Chenn and McConnell (1995), who suggested that when the plane of separation of daughter cells is parallel to the ventricular surface (horizontal division), the daughter cells will have opposite (P+Q) proliferative fates, and when the plane of separation of daughter cells is orthogonal to the ventricular surface (vertical division), the daughter cells will have the same (P+P or Q+Q) proliferative fates. Early in the neuronogenetic interval of the ferret (Chenn and McConnell, 1995), the proportion of vertical divisions is ∼80% and that of horizontal divisions is ∼20%; later, the proportions are changed, in a direction consistent with the neuronogenetic model, to ∼50% and 30%, respectively.
Fig. 11.

P and Q in relation to proliferative fate. Theupper bar of the double abscissa marks the elapsed integer cell cycles CC1–11 of the dorsomedial murine cerebral PVE; the lower bar of the abscissa marks the elapse of time in Embryonic Days. The ordinate provides a calculation, on the basis of the data shown in Figure 7 and the binomial theorem, for the proportion of total mitotic divisions at each integer cycle that will give rise only to P cells (P+P symmetric proliferative fate), only to Q cells (Q+Q symmetric proliferative fate), or to P + Q cells (P+Q asymmetric proliferative fate). For example, if Q = 0.3 and P = 0.7, there will be Q2 = (0.3)2 = 0.09 and P2 = (0.7)2 = 0.49 symmetric divisions and 2 × P × Q = 2 × 0.3 × 0.7 = 0.42 asymmetric divisions. All three types of mitoses could exist at all times, but the sum of their proportions will be equal to 1.0. Early in the neuronogenetic period, the P+P symmetric cell divisions should predominate. Late in the neuronogenetic interval, the Q+Q symmetric cell divisions should predominate. The proportion of asymmetric cell divisions should reach its maximum when P = Q = 0.5, i.e., at approximately CC8, at which time the proportion of Q+Q- and P+P-type symmetric cell divisions should be equal.
Lineage continuity
Neocortical histogenesis requires lineage continuity from founder population throughout the neuronogenetic interval. Paradoxically, the majority of lineages traced by viral insertion of the Xgalreporter gene becomes extinct after a single mitosis or within two to four cycles of viral genome insertion. Clone size is small, and only rarely are marked cells among the last formed in upper layers III and II.
The neuronogenetic model provides insight into these lineage experiments. The cumulative probability of extinction of a lineage originating from a single founder cell, i.e., the probability that at any time all of its descendants would leave the PVE, in CC1 is only ∼4% over the first 11 cell cycles (CC1–11) of the neuronogenetic interval (Fig.12A; for calculations and details, see the legend to Fig. 12A). The probability of extinction of a polyclonal set of founder cells decreases exponentially as the number of cells included in the founder polyclone is increased (Fig. 12A). For example, the probability of extinction before CC11 of a two-cell founder polyclone is 0.16%, but of a seven-cell founder polyclone it is 10−10. This low probability of extinction virtually guarantees that one small area of the PVE will contribute to the entire thickness of the overlying cortex.
Fig. 12.

Lineage continuity. A, TheProbability of Extinction of a hypothetical monoclonal lineage derived from a single PVE founder cell (open circles) is plotted through CC11 of the neuronogenetic interval. The founder cell is presumed to be at the beginning of G1 at the beginning of CC1. The probability that such a lineage will become extinct by CC11 is 0.04 (arrow with dashed line), which means that it has a 96% chance of continuing to exist over the entire neuronogenetic interval and thus to contribute to each of cortical layers VI through II. The cumulative probabilities of extinction of hypothetical polyclonal lineages of two, three, or seven cells barely rise above 0 by CC11. Thus, such polyclonal lineages would have virtually a 100% chance of sustaining histogenesis of cortical layers VI–II. B, The cumulative probabilities of extinction of hypothetical monoclonal lineages arising from single founder cells present at the beginning of G1 at the beginning of each of the integer cell cycles of the neuronogenetic interval. The probability of lineage extinction mounts rapidly with initiation at each successive integer cycle. The lowest probability of extinction is associated with a monoclonal lineage initiated atCC1 (open circle plot inA), but a lineage initiated atCC4 will have a cumulative probability of extinction of ∼0.57 through CC11(arrowhead). These extinction probabilities become quite high even before the final three cell cycles of the neuronogenetic interval, after which a substantial proportion of the neurons of the cortex are still to be produced (Figs. 9, 10). Thedarker lines represent lineages of the sort initiated in retroviral studies (for details, see the text).
Where the lineage is considered to be initiated later than at the onset of CC1, the apparent probability of extinction is much greater. For lineages initiated at CC2 with a single founder cell, the extinction probability by CC11 is ∼15% and 57% for initiation at CC4. A family of curves reflecting a dramatically increasing probability of extinction associated with “delay” in lineage initiation from the actual start of neuronogenesis is shown in Figure 12B. By way of illustration, consider the experiments of Walsh and Cepko (1988, 1993)in rat, which were initiated with retroviral injections at E17 and E14 corresponding approximately to E15 and E12 in mouse, respectively. Allowing a couple of cell cycles after injection before the insertion of the Xgal gene into a single founder cell (Cepko, 1988), we estimate that Xgal-marked lineage founder cells would appear, at the earliest, at CC9 and CC5, respectively. The mounting probability of extinction with successive cell cycles for such lineages is indicated by the darker lines in Figure 12B.
Similar considerations also clarify the prominence of “one-cell clones” and the generally small sizes of the “clones” observed with retroviral experiments (Luskin et al., 1988; Price and Thurlow, 1988; Walsh and Cepko, 1988; Austin and Cepko, 1990; Walsh and Cepko, 1990; Parnavelas et al., 1991; Walsh and Cepko, 1992, 1993; Mione et al., 1994). Because only one daughter cell carries the reporter gene at the first cell division after gene insertion, the probability that this cell will leave the cycle with apparent lineage extinction is Q. For example, Q is ∼0.42 at CC7; this means that ∼42% of the clones marked by a reporter gene at this cell cycle would have only one cell. Even if the daughter cell carrying the reporter gene at CC7 is P, the rapid increase in Q after CC7dictates that the average lineage will rapidly become extinct (Fig.12B). Thus, the average multicellular clone size will be small. Large clones reflecting lineage continuity over more than two to three integer cell cycles have been achieved only when the experiments have been initiated early enough to allow insertion at an earlier integer cell cycle (Austin and Cepko, 1990; Mione et al., 1994;Reid et al., 1995). Thus, the important conclusion is that the low values of Q and high values of P over the first several cell cycles of the neuronogenetic interval and the resultant expansion of the PVE and the founder-cell population are critical to the production of a “full thickness” neocortex.
The proliferative model and neocortical histogenesis: a look ahead
The fundamental parameters of cell proliferation measured by these investigations have lead to a quantitative neuronogenetic model characterizing patterns of growth of the PVE and neuronal production. Elsewhere (Caviness et al., 1995) the neuronogenetic model has been used to “explain” the expansion of neocortex in primates. The parameters P and Q provide clarifying links to mitotic spindle behavior, the continuity of proliferative lineages, and the relatively small size of retrovirally labeled clones. Thus, the neuronogenetic model provides a method for generating experimentally verifiablequantitative hypotheses about cortical development and is applicable to the interpretation of data collected with other methods.
Footnotes
This work was supported by National Institutes of Health Grants NS12005 and NS28061 and National Aeronautics and Space Administration Grant NAG2-950. T.T. was supported by a Fellowship of The Medical Foundation, Inc., Charles A. King Trust, Boston, MA. Valuable discussions with Pradeep Bhide and Sahoko Miyama are gratefully acknowledged.
Correspondence should be addressed to Dr. Takao Takahashi, Department of Neurology, Massachusetts General Hospital, 25 Fruit Street, Boston, MA 02114.
REFERENCES
- 1.Austin CP, Cepko CL. Cellular migration patterns in the developing mouse cerebral cortex. Development. 1990;110:713–732. doi: 10.1242/dev.110.3.713. [DOI] [PubMed] [Google Scholar]
- 2.Bayer SA, Altman J. Raven; New York: 1991. Neocortical development. . [Google Scholar]
- 3.Blaschke A, Staley K, Chun J. Widespread programmed cell death in proliferative and postmitotic regions of the fetal cerebral cortex. Development. 1996;122:1165–1174. doi: 10.1242/dev.122.4.1165. [DOI] [PubMed] [Google Scholar]
- 4.Caviness VS., Jr Neocortical histogenesis in normal and reeler mice: a developmental study based upon [3H]thymidine autoradiography. Dev Brain Res. 1982;4:293–302. doi: 10.1016/0165-3806(82)90141-9. [DOI] [PubMed] [Google Scholar]
- 5.Caviness VS, Jr, Takahashi T, Nowakowski RS. Numbers, time and neocortical neuronogeneis: a general developmental and evolutionary model. Trends Neurosci. 1995;18:379–383. doi: 10.1016/0166-2236(95)93933-o. [DOI] [PubMed] [Google Scholar]
- 6.Cepko CL. Retrovirus vectors and their applications in neurobiology. Neuron. 1988;1:345–353. doi: 10.1016/0896-6273(88)90184-5. [DOI] [PubMed] [Google Scholar]
- 7.Chenn A, McConnell SK. Cleavage orientation and the asymmetric inheritance of Notch 1 immunoreactivity in mammalian neuronogenesis. Cell. 1995;82:631–641. doi: 10.1016/0092-8674(95)90035-7. [DOI] [PubMed] [Google Scholar]
- 8.Finlay BL, Darlington RB. Linked regularities in the development and evolution of mammalian brains. Science. 1995;268:1578–1584. doi: 10.1126/science.7777856. [DOI] [PubMed] [Google Scholar]
- 9.Finlay BL, Pallas SL. Control of cell number in the developing mammalian visual system. Prog Neurobiol. 1989;32:207–234. doi: 10.1016/0301-0082(89)90017-8. [DOI] [PubMed] [Google Scholar]
- 10.Finlay BL, Slattery M. Local differences in the amount of early cell death in neocortex predict adult local specializations. Science. 1983;219:1349–1351. doi: 10.1126/science.6828866. [DOI] [PubMed] [Google Scholar]
- 11.Fujita S. The matrix cell and cytogenesis in the developing central nervous system. J Comp Neurol. 1963;120:37–42. doi: 10.1002/cne.901200104. [DOI] [PubMed] [Google Scholar]
- 12.Gressens P, Gofflot F, Van Maele-Fabry G, Misson J-P, Gadisseux J-F, Evrard P, Picard JJ. Early neurogenesis and teratogenesis in whole mouse embryo cultures. J Neuropathol Exp Neurol. 1991;51:206–219. doi: 10.1097/00005072-199203000-00010. [DOI] [PubMed] [Google Scholar]
- 13.Hinds JW, Ruffett TL. Cell proliferation in the neural tube: an electron microscopic and Golgi analysis in the mouse cerebral vesicle. Z Zellforsch. 1971;115:226–264. doi: 10.1007/BF00391127. [DOI] [PubMed] [Google Scholar]
- 14.His W. Die Neuroblasten und deren Entstehung im embryonalen Mark. Abh Math Phys Cl Kgl Saechs Ges Wissensch. 1889;15:313–372. [Google Scholar]
- 15.Luskin MB, Shatz CJ. Neurogenesis of the cat’s primary visual cortex. J Comp Neurol. 1985;242:611–631. doi: 10.1002/cne.902420409. [DOI] [PubMed] [Google Scholar]
- 16.Luskin MB, Pearlman AL, Sanes JR. Cell lineage in the cerebral cortex of the mouse studied in vivo and in vitro with a recombinant retrovirus. Neuron. 1988;1:635–647. doi: 10.1016/0896-6273(88)90163-8. [DOI] [PubMed] [Google Scholar]
- 17.Mione MC, Danevic C, Boardman P, Harris B, Parnavelas JG. Lineage analysis reveals neurotransmitter (GABA or glutamate) but not calcium-binding protein homogeneity in clonally related cortical neurons. J Neurosci. 1994;14:107–123. doi: 10.1523/JNEUROSCI.14-01-00107.1994. [DOI] [PMC free article] [PubMed] [Google Scholar]
- 18.Nowakowski RS, Rakic P. The site of origin and route and rate of migration of neurons to the hippocampal region of the rhesus monkey. J Comp Neurol. 1981;196:129–154. doi: 10.1002/cne.901960110. [DOI] [PubMed] [Google Scholar]
- 19.Parnavelas J, Barfield JA, Franke E, Luskin MB. Separate progenitor cells give rise to pyramidal and nonpyramidal neurons in the rat telencephalon. Cereb Cortex. 1991;1:463–468. doi: 10.1093/cercor/1.6.463. [DOI] [PubMed] [Google Scholar]
- 20.Price J, Thurlow L. Cell lineage in the rat cerebral cortex: a study using retrovirus-mediated gene transfer. Development. 1988;104:473–482. doi: 10.1242/dev.104.3.473. [DOI] [PubMed] [Google Scholar]
- 21.Rakic P. Neurons in rhesus monkey visual cortex: systematic relation between time of origin and eventual disposition. Science. 1974;183:425–427. doi: 10.1126/science.183.4123.425. [DOI] [PubMed] [Google Scholar]
- 22.Rakic P. Specification of cerebral cortical areas. Science. 1988;241:170–176. doi: 10.1126/science.3291116. [DOI] [PubMed] [Google Scholar]
- 23.Reid CB, Liang I, Walsh C. Systematic widespread clonal organization in cerebral cortex. Neuron. 1995;15:299–310. doi: 10.1016/0896-6273(95)90035-7. [DOI] [PubMed] [Google Scholar]
- 24.Reznikov K, van der Kooy D. Variability and partial synchrony of the cell cycle in the germinal zone of the early embryonic cerebral cortex. J Comp Neurol. 1995;360:536–554. doi: 10.1002/cne.903600313. [DOI] [PubMed] [Google Scholar]
- 25.Rockel AJ, Horns RW, Powell TPS. The basic uniformity of structure of the neocortex. Brain. 1980;103:221–244. doi: 10.1093/brain/103.2.221. [DOI] [PubMed] [Google Scholar]
- 26.Sauer FC. Mitosis in the neural tube. J Comp Neurol. 1935;62:377–405. [Google Scholar]
- 27.Sauer ME, Walker BE. Radioautographic study of interkinetic nuclear migration in the neural tube. Proc Soc Exp Biol Med. 1959;101:557–560. doi: 10.3181/00379727-101-25014. [DOI] [PubMed] [Google Scholar]
- 28.Schaper A. Die frühesten Differenzierungsvorgänge im Centralnervensystem. Arch Entwicklungsmech Org. 1897;5:81–132. [Google Scholar]
- 29.Schüz A, Palm G. Density of neurons and synapses in the cerebral cortex of the mouse. J Comp Neurol. 1989;286:442–455. doi: 10.1002/cne.902860404. [DOI] [PubMed] [Google Scholar]
- 30.Sidman RL, Rakic P. Neuronal migration, with special reference to developing human brain: a review. Brain Res. 1973;62:1–35. doi: 10.1016/0006-8993(73)90617-3. [DOI] [PubMed] [Google Scholar]
- 31.Sidman RL, Rakic P. Development of the human central nervous system. In: Haymaker W, Adams RD, editors. Histology and histopathology of the nervous system. Charles C. Thomas; Springfield, IL: 1982. pp. 3–145. [Google Scholar]
- 32.Stensaas LJ, Stensaas SS. An electron microscope study of cells in the matrix and intermediate laminae of the cerebral hemisphere of the 45 mm rabbit embryo. Z Zellforsch. 1968;91:341–365. doi: 10.1007/BF00440763. [DOI] [PubMed] [Google Scholar]
- 33.Takahashi T, Nowakowski RS, Caviness VS., Jr BUdR as an S-phase marker for quantitative studies of cytokinetic behaviour in the murine cerebral ventricular zone. J Neurocytol. 1992;21:185–197. doi: 10.1007/BF01194977. [DOI] [PubMed] [Google Scholar]
- 34.Takahashi T, Nowakowski RS, Caviness VS., Jr Cell cycle parameters and patterns of nuclear movement in the neocortical proliferative zone of the fetal mouse. J Neurosci. 1993;13:820–833. doi: 10.1523/JNEUROSCI.13-02-00820.1993. [DOI] [PMC free article] [PubMed] [Google Scholar]
- 35.Takahashi T, Nowakowski RS, Caviness VS., Jr Mode of cell proliferation in the developing mouse neocortex. Proc Natl Acad Sci USA. 1994;91:375–379. doi: 10.1073/pnas.91.1.375. [DOI] [PMC free article] [PubMed] [Google Scholar]
- 36.Takahashi T, Nowakowski RS, Caviness VS., Jr The cell cycle of the pseudostratified ventricular epithelium of the murine cerebral wall. J Neurosci. 1995a;15:6046–6057. doi: 10.1523/JNEUROSCI.15-09-06046.1995. [DOI] [PMC free article] [PubMed] [Google Scholar]
- 37.Takahashi T, Nowakowski RS, Caviness VS., Jr Early ontogeny of the secondary proliferative population of the embryonic murine cerebral wall. J Neurosci. 1995b;15:6058–6068. doi: 10.1523/JNEUROSCI.15-09-06058.1995. [DOI] [PMC free article] [PubMed] [Google Scholar]
- 38.Waechter RV, Jaensch B. Generation times of the matrix cells during embryonic brain development: an autoradiographic study in rats. Brain Res. 1972;46:235–250. doi: 10.1016/0006-8993(72)90018-2. [DOI] [PubMed] [Google Scholar]
- 39.Walsh C, Cepko CL. Clonally related cortical cells show several migration patterns. Science. 1988;242:1342–1345. doi: 10.1126/science.3137660. [DOI] [PubMed] [Google Scholar]
- 40.Walsh C, Cepko CL. Cell lineage and cell migration in the developing cerebral cortex. Experientia. 1990;46:940–947. doi: 10.1007/BF01939387. [DOI] [PubMed] [Google Scholar]
- 41.Walsh C, Cepko CL. Widespread dispersion of neuronal clones across functional regions of the cerebral cortex. Science. 1992;255:434–440. doi: 10.1126/science.1734520. [DOI] [PubMed] [Google Scholar]
- 42.Walsh C, Cepko CL. Clonal dispersion in proliferative layers of developing cerebral cortex. Nature. 1993;362:632–635. doi: 10.1038/362632a0. [DOI] [PubMed] [Google Scholar]
- 43.Wood JG, Martin S, Price DJ. Evidence that the earliest generated cells of the murine cerebral cortex form a transient population in the subplate and marginal zone. Dev Brain Res. 1992;66:137–140. doi: 10.1016/0165-3806(92)90150-u. [DOI] [PubMed] [Google Scholar]