Abstract
Pancreatic ductal adenocarcinoma (PDAC) has a dismal prognosis largely due to inefficient diagnosis and tenacious drug resistance. Activation of pancreatic stellate cells (PSCs) and consequent development of dense stroma are prominent features accounting for this aggressive biology1,2. The reciprocal interplay between PSCs and pancreatic cancer cells (PCCs) not only enhances tumour progression and metastasis but also sustains their own activation, facilitating a vicious cycle to exacerbate tumourigenesis and drug resistance3–7. Moreover, PSC activation occurs very early during PDAC tumourigenesis8–10, and activated PSCs comprise a significant fraction of the tumour mass, providing a rich source of readily detectable factors. Therefore, we hypothesized that the communication between PSCs and PCCs could be an Achilles’ heel exploitable to develop effective strategies for PDAC therapy and diagnosis. Here, starting with systematic proteomic investigation of secreted disease mediators and underlying molecular mechanisms, we reveal that leukemia inhibitory factor (LIF) is a key paracrine factor from activated PSCs acting on cancer cells. Both pharmacologic LIF blockade and genetic Lifr deletion significantly slow tumour progression and augment chemotherapy efficacy to prolong survival of PDAC mouse models, mainly by modulating cancer cell differentiation and EMT status. Moreover, we show that, consistently in both mouse models and human PDAC, aberrant production of LIF in the pancreas is unique to pathological conditions and correlates with PDAC pathogenesis, and circulating LIF level changes correlate well with tumour response to therapy. Collectively, these findings uncover a previously unappreciated function of LIF in PDAC tumourigenesis, and suggest its translational potential as an attractive therapeutic target and circulating marker. These studies underscore how a better understanding of cell-cell communications within the tumour microenvironment promotes novel strategies for cancer therapy.
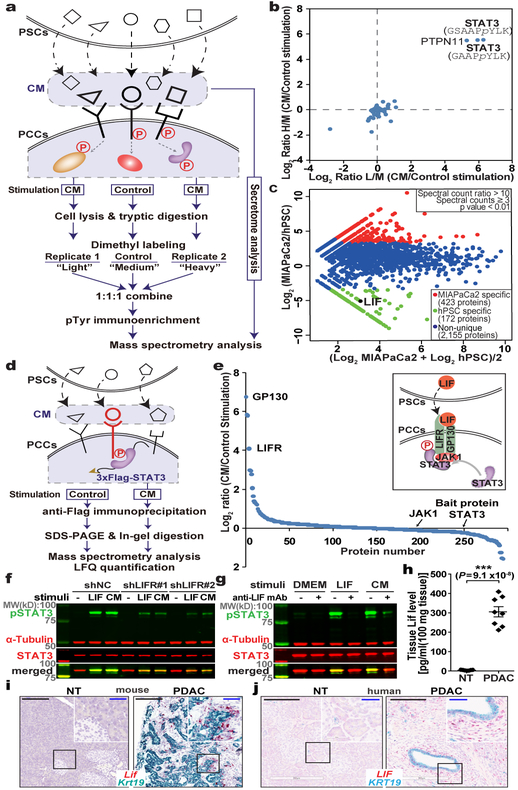
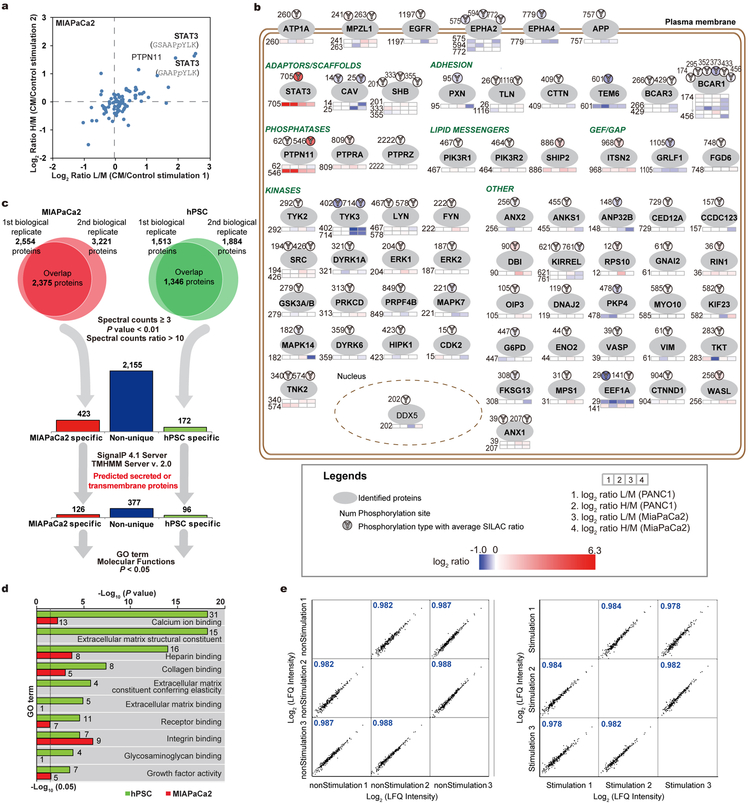
To comprehensively characterize the paracrine communication between PCCs and PSCs, we carried out integrated mass spectrometry (MS)-based quantitative proteomic analyses combining secretome profiling with phosphoproteomics (Fig. 1a). Phosphotyrosine proteomic analysis, performed to explore intracellular signaling events, revealed STAT3 activation as a prominent event in PCCs in response to PSC conditioned medium (CM) stimulation, and in parallel secretomes of each cell type, MIAPaCa2 and hPSCs11 as representative lines, were individually profiled to quantitatively catalog the complete protein composition in the CM (Fig. 1b,c and Extended Data Fig. 1a–d). We then conducted IP-MS assays to explore STAT3-associated proteins, especially receptor(s), and found the LIF receptor (LIFR) and its co-receptor IL6ST/GP130 as the only receptors pulled down by STAT3 in a strictly CM stimulation-dependent manner (Fig. 1d,e and Extended Data Fig. 1e). Consistently, LIF was produced by hPSC in copious amounts, but not by MIAPaCa2, pinpointing LIF as the key paracrine factor for STAT3 activation in PCCs (Fig. 1c).
Figure 1 |. Combinatorial MS analyses identified LIF as a key paracrine factor.
a, Schematic workflow of the MS strategy combining secretome and phosphoproteomic analyses. Matched serum-free medium was used as control stimulation. b, Phosphotyrosine proteomic analysis of CM-stimulated intracellular signalling in PANC1 cells. c, Proteomic analysis and comparison of MIAPaCa2 and hPSC secretome presented as an MA plot. n=2 biological replicates (b,c). d,e, IP-MS assay on 3xFlag-STAT3-expressing PANC1 cells to identify CM stimulation-dependent STAT3-associated proteins. n=3 biological replicates. f,g, IB analyses of pSTAT3 in KP4 cells with LIF blockade by LIFR knockdown or anti-LIF mAb. CM harvested from hPSC. h, Lif levels in mouse pancreatic normal and tumour tissues by ELISA. NT=7; PDAC=8. i,j, RNAscope assays to examine cellular sources of LIF mRNA expression in mouse (i) and human (j) pancreatic tissues. Krt19 mRNA was co-stained to mark cancer cells. NT, mouse normal pancreatic tissues or non-tumour parts resected from the human tumour trunks; PDAC, tumour tissues collected from KPf/fCL mice or PDAC patients. Scale bars: black, 200 μm; blue, 50 μm. Representative images from at least three biological replicates per experiment were presented (f,g,i,j).
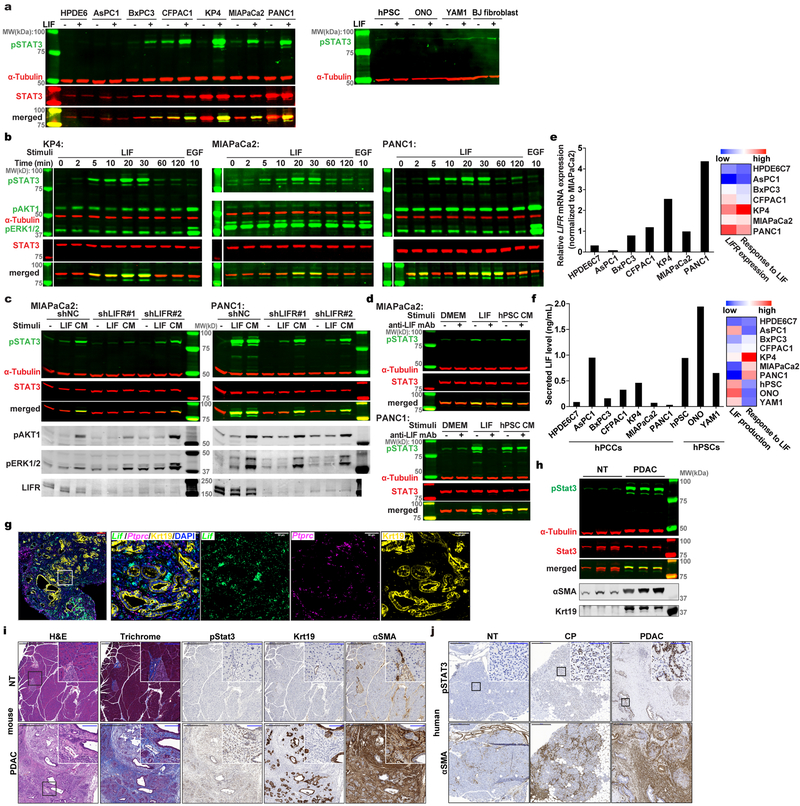
LIF is a pleiotropic cytokine regulating cell differentiation, proliferation and survival in the embryo and the adult12, and is also involved in cancer development13–16. LIF production by PSCs was reported recently17–19, but its physiological significance in PDAC tumourigenesis is unclear. We firstly assessed LIF actions in vitro and found widespread response in PCCs but not in activated PSCs and normal fibroblasts, and among three reported downstream pathways12, mainly STAT3, but not ERK and AKT, was robustly activated (Extended Data Fig. 2a,b). Intriguingly, LIF signaling blockade by either LIFR knockdown in PCCs or LIF ligand immunodepletion from PSC CM effectively abolished STAT3 activation, corroborating LIF as the predominant paracrine factor for PCCs’ STAT3 activation (Fig. 1f,g and Extended Data Fig. 2c,d). Moreover, the variable response of PCCs to LIF was determined by LIFR level, and paracrine interaction was the predominant means of LIF action (Extended Fig. 2e,f). We then validated LIF dysregulation in vivo, and observed that LIF protein level was undetectable in normal pancreas but dramatically elevated in PDAC tissues (Fig. 1h). Furthermore, in both mouse and human PDAC tissues LIF mRNA was abundant in activated PSCs, especially in those adjacent to cancer cell nests, but sporadic in a small fraction of cancer cells, and barely detectable in CD45+ immune cells or normal pancreatic tissues, reaffirming activated PSCs as the major LIF-producing cells (Fig. 1i,j and Extended Data Fig. 2g). Correspondingly, STAT3 was also dramatically activated in PDAC tissues (Extended Data Fig. 2h–j). Together, these findings implicate the LIF involvement in PDAC pathogenesis.
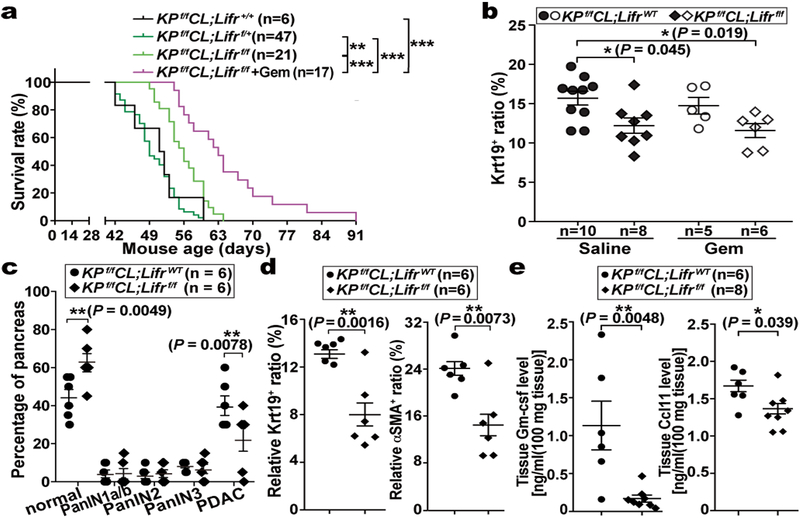
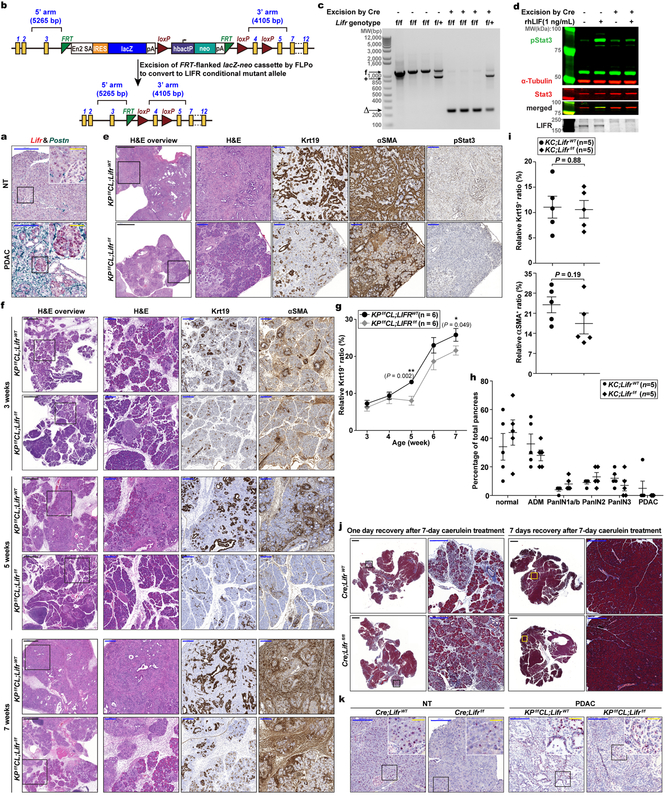
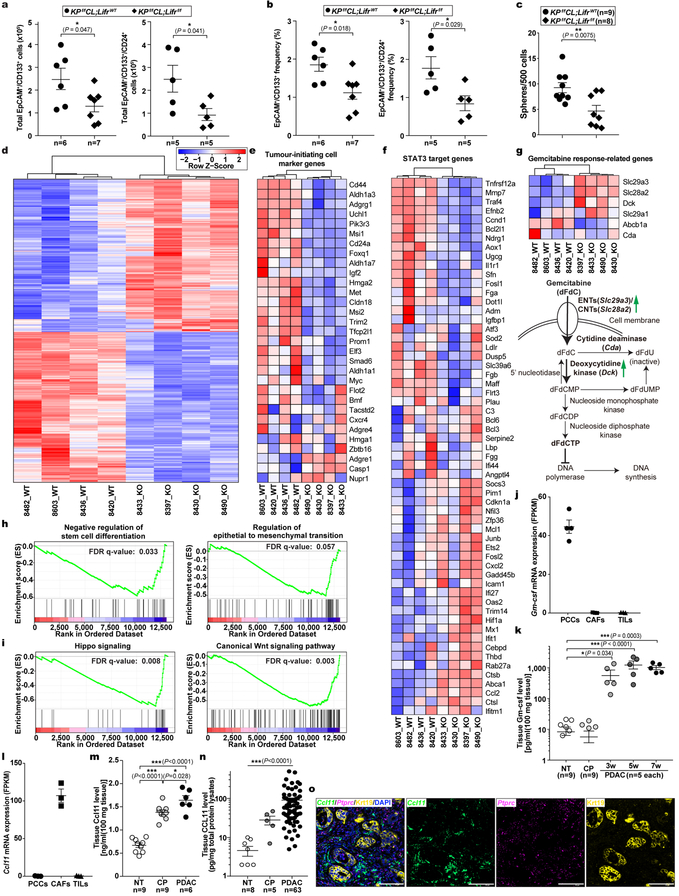
Although STAT3 activation has been documented to be essential for PDAC tumourigenesis, the underlying mechanisms and the cellular source(s) of STAT3-activating cytokines have been debated8–10,20. Based on our finding that PSC-produced LIF is a key STAT3 activator we evaluated its physiological significance in PDAC. Since PCCs are the major Lifr-expressing cells and therefore presumably the main target of LIF action, we generated Lifrf/f;KPf/fCL compound mutant mice to assess the importance of PCC-intrinsic LIFR signaling for PDAC development physiologically (Extended Data Fig. 3a–d,k). The overall survival of Lifrf/f;KPf/fCL mice was significantly increased, indicating that LIFR signaling in PCCs per se plays an important role in PDAC development, and was further prolonged by gemcitabine (Gem) administration, implying an additional role in increasing chemoresistance (Fig. 2a). Correspondingly, the relative abundance of PCCs in tumours was significantly decreased in Lifr-deficient mice and by Gem treatment (Fig. 2b). Notably, although almost all pancreatic epithelial cells were transformed into cancer cells in LifrWT;KPf/fCL mice, distinct regions of pancreatitis and PanINs were still found in the pancreas of Lifrf/f;KPf/fCL mice at the study endpoint (Extended Data Fig. 3e). By comparing histopathological status of pancreatic tissues at various ages, corresponding to distinct stages of tumourigenesis, we found that, although at three weeks of age comparable amounts of PanINs and activated PSCs had evolved, by five weeks tumour progression in Lifrf/f;KPf/fCL mice was retarded with many fewer PCCs and activated PSCs, substantiated by dramatically lower tissue levels of PCC-produced Gm-csf21,22 and PSC-produced Ccl11 (Fig. 2c–e and Extended Data Fig. 3f,g, 4j–o). Furthermore, when we accelerated PanINs initiation with caerulein in LifrWT;KC and Lifrf/f;KC mice to directly evaluate LIF effect on tumour initiation, comparable PanIN grades were induced (Extended Data Fig. 3h,i). Moreover, no apparent differences were observed in the formation and resolution of acinar-ductal metaplasia between caerulein-treated LifrWT;Pdx1-Cre and Lifrf/f;Pdx1-Cre mice (Extended Data Fig. 3j). Altogether, these genetic studies demonstrated that LIF mainly acts on PCCs to facilitate tumour progression but not initiation.
Figure 2 |. LIF acted on PCCs to affect tumour progression.
a, Kaplan–Meier survival curve. b, Relative abundance of Krt19+ cancer cell in tumours at the endpoint of the survival study. c-e, Pathological grade of tumour stage, histological quantification of cancer and stromal PSC cell abundance, and levels of PCC-produced Gm-csf and PSC-produced Ccl11 by Luminex multiplex ELISA assays in tumour tissues collected from five-week LifrWT- or Lifrf/f- KPf/fCL mice. Statistical significance was determined by one-way ANOVA with Tukey’s multiple comparisons test (a,b), two-way ANOVA (c), or two-tailed unpaired Student’s t-test (d,e).
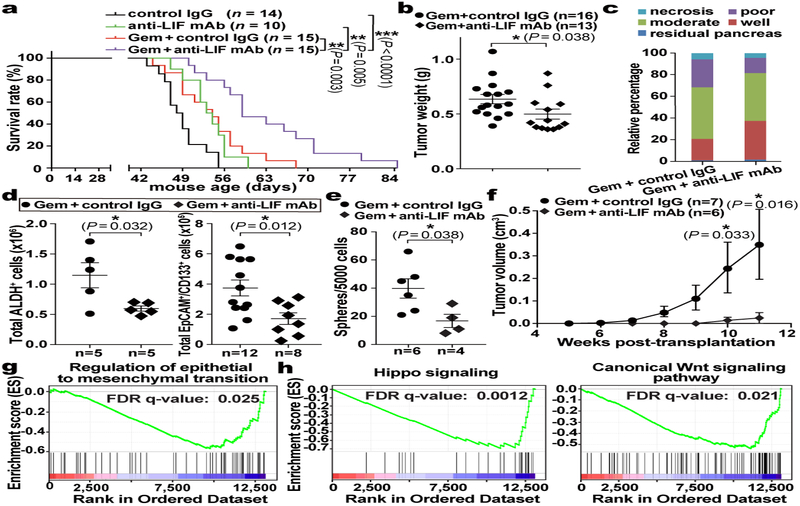
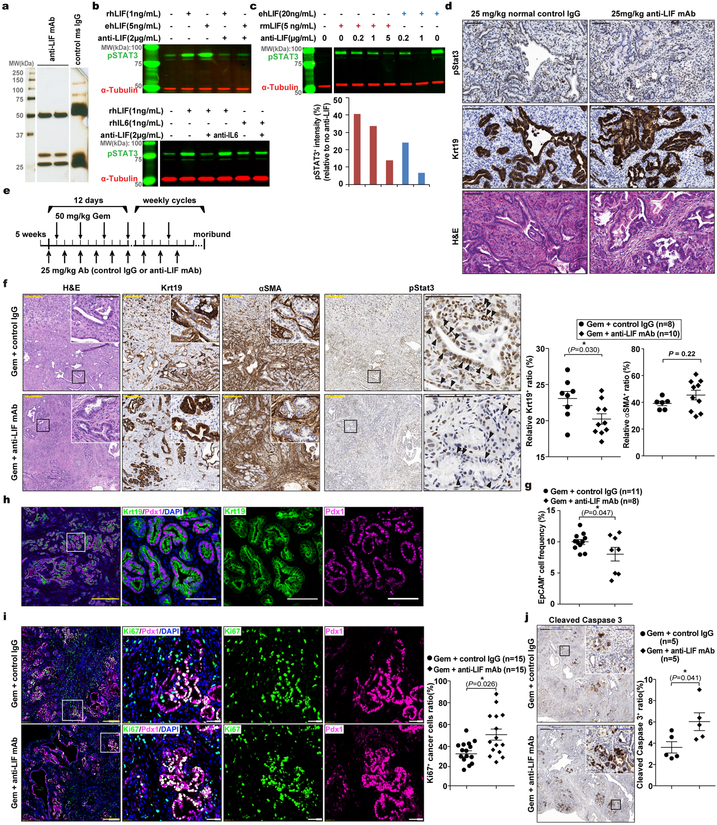
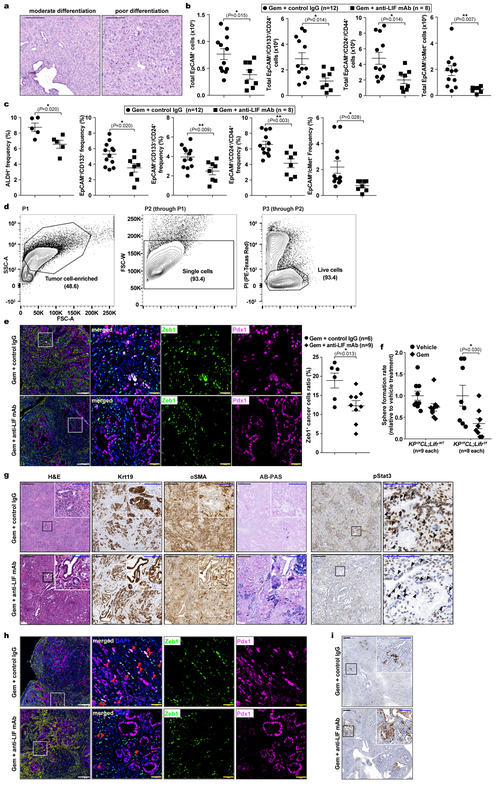
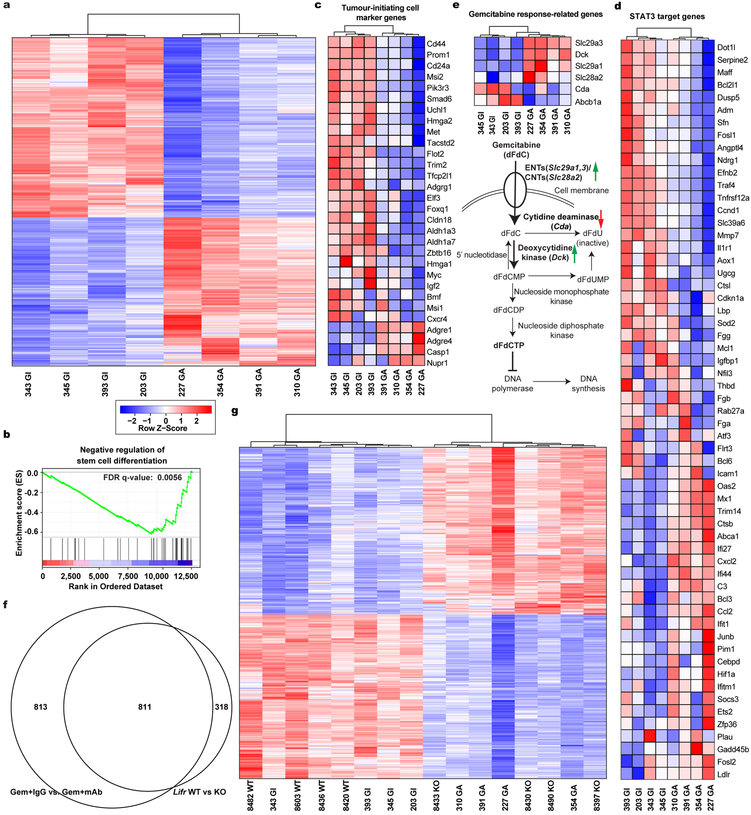
Having established LIF as a promising therapeutic target, we evaluated it preclinically using the KPf/fCL mouse model with an anti-LIF neutralizing monoclonal antibody (mAb)23 (Extended Data Fig. 5a–e). Reminiscent of genetic Lifr depletion, the overall survival of KPf/fCL mice was increased by anti-LIF mAb treatment, and further prolonged by Gem+anti-LIF mAb (Combo) treatment with reduced tumour burden, even compared to Gem+control IgG (Chemo), further corroborating the important roles of LIF in PDAC progression and chemoresistance (Fig. 3a,b). The Combo treatment significantly reduced PCC, but not PSC, abundance, and evaluation of PCCs showed increased proliferation accompanied by enhanced apoptosis (Extended Data Fig. 5f–j). An increase in PCC proliferation could enhance their susceptibility to Gem treatment, thus promoting apoptosis, and consequently alleviating chemoresistance. Blinded histopathological examinations by independent pathologists produced consistent interpretations that Combo-treated KPf/fCL tumours appeared more differentiated (Fig. 3c and Extended Data Fig. 6a), suggesting that LIF blockade promotes cancer cell differentiation and leads to a less aggressive and more drug-susceptible phenotype. To understand this effect, we assessed the relative abundance of PCCs by differentiation status and found that the populations of tumour-initiating cells expressing markers ALDH, CD133, CD24 and CD44, or cMet24–28, were all markedly reduced by the Combo treatment, as functionally validated by both in vitro sphere formation and in vivo flank transplantation assays (Fig. 3d–f and Extended Data Fig. 6b–d), and consistently observed in the Lifr-deficient genetic model (Extended Data Fig. 4a–c). Furthermore, in short-term in vivo Combo-treated PCCs, besides tumour-initiating cell marker genes and those involved in negative regulation of stem cell differentiation, the expression of genes critical for epithelial-mesenchymal transition (EMT) were also downregulated, as further confirmed by reduced abundance of Zeb1+ mesenchymal PCCs (Fig. 3g and Extended Data Fig. 7b,c, 6e). Molecularly, the expression of many cascade components and downstream target genes in the Hippo, Wnt and STAT3 signalling pathways was significantly suppressed, together with expression changes leading to a heightened Gem response (Fig. 3h and Extended Data Fig. 7d,e). EMT induction and tumour-initiating cell emergence are intertwined biological processes facilitating chemoresistance in cancers and are regulated by several developmental signalling cascades including STAT3, Hippo and Wnt29. Moreover, the differential gene expression signatures were also recapitulated in the Lifr-deficient genetic model (Extended Data Fig. 4d–i and 7f,g).
Figure 3 |. LIF blockade by anti-LIF mAb provided therapeutic benefit in PDAC by affecting cancer cell differentiation.
a, Kaplan–Meier survival curve. b, Total tumour weights at the endpoint of treatment. c, Pathological grade of tumour differentiation. n=6 mice per treatment. d, Flow cytometry analysis of total count of tumour-initiating cells, defined as ALDH+ or EpCAM+/CD133+, in individual tumours. e,f, Functional evaluation of tumour-initiating cell abundance by in vitro sphere formation and in vivo flank transplantation assays. g,h, Gene set enrichment analysis (GSEA) for differential gene expression in EpCAM+ cancer cells freshly isolated by FACS from individual tumours of the in vivo Chemo or Combo treated KPf/fCL mice. n=4 mice per treatment. Statistical significance was determined by one-way ANOVA (a), or two-tailed unpaired Student’s t-test.
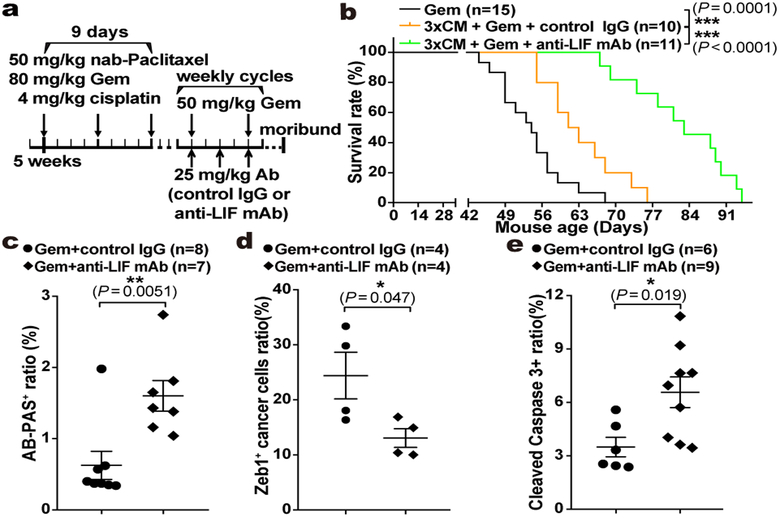
We observed dual roles of LIF affecting both tumour progression and Gem response. Since delayed progression could impact Gem response, we assessed LIF’s direct effect on Gem sensitivity. When freshly isolated primary PCCs were subjected to low-dosage Gem, the sphere-forming capacity was markedly suppressed in Lifr-deficient PCCs, indicating that the intrinsic chemoresistance of tumour-initiating cells relied on LIFR signalling (Extended Data Fig. 6f). To validate this in vivo, we developed a maintenance PDAC mouse model by pretreating KPf/fC mice with nab-paclitaxel, cisplatin, and Gem combination30, and the Combo treatment caused an even more dramatic therapeutic benefit with substantially prolonged survival, characterized by markedly reduced mesenchymal-transited PCCs and increased PCC differentiation and apoptosis (Fig. 4a–e and Extended Data Fig. 6g–i). This evidence further emphasizes the importance of LIF in chemoresistance and reinforces its translational potential as a therapeutic target, given that PDAC is usually diagnosed late with strong intrinsic chemoresistance and therapeutics alleviating chemoresistance after the first-line chemotherapy are urgently needed.
Figure 4 |. LIF blockade directly affected chemoresistance in PDAC.
a, Regimen for the preclinical maintenance therapeutic trial. b, Kaplan–Meier survival curve. c-e, Histological quantification of cancer cell differentiation by AB-PAS staining (c), mesenchymal transition by Zeb1/Pdx1 immunofluorescence co-staining (d), and apoptosis by Cleaved Caspase 3 IHC (e). Statistical significance was determined by one-way ANOVA (b), or two-tailed unpaired Student’s t-test.
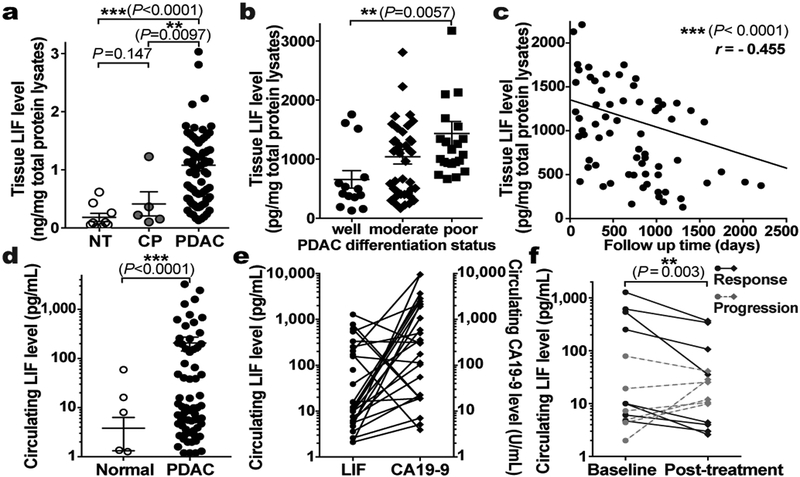
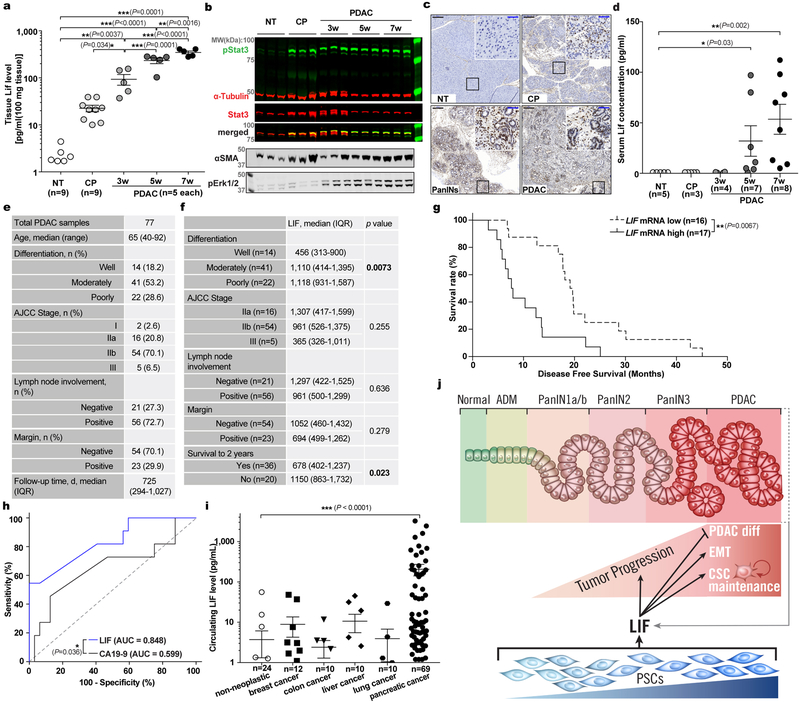
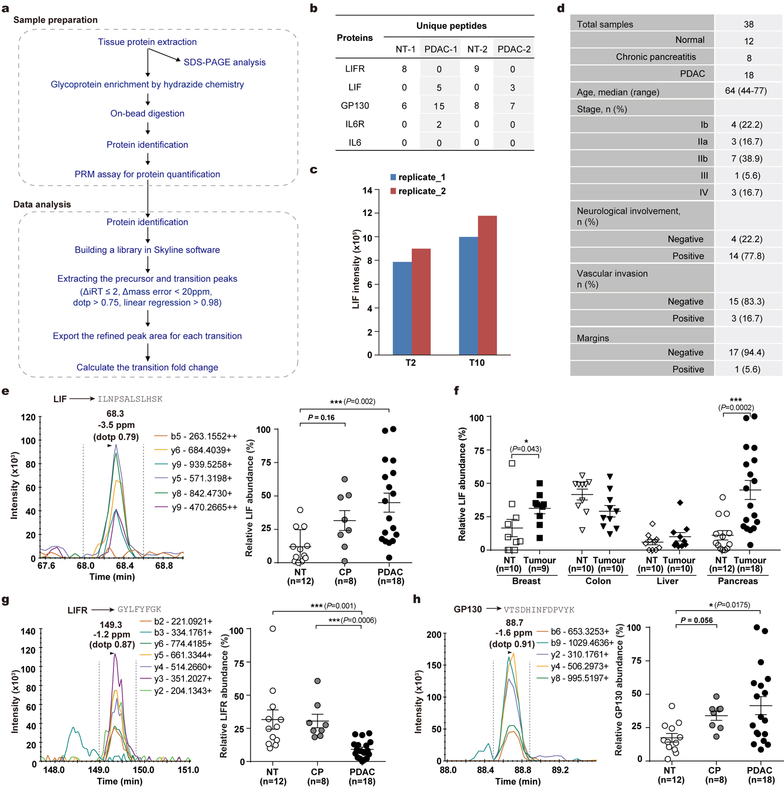
Since LIF mediates tumour progression, and LIF-producing PSCs are activated very early and gradually increase in abundance during PDAC tumourigenesis, we tested for correlation between LIF and PDAC pathogenesis. LIF levels were already markedly elevated in the pancreas of KPf/fCL mice at 3 weeks of age, when mainly pancreatitis and early PanIN lesions with a few small solid tumour nodules were evident, and then steadily increased during tumour progression (Extended Data Fig. 8a,3f). Notably, LIF elevation, along with STAT3 activation, was readily detectable in caerulein-induced pancreatitis, in which PSCs are transiently activated but tumour development is not yet initiated, substantiating LIF production by activated PSCs (Extended Data Fig. 2j, 8a–c). To examine its relevance to human PDAC, we quantified LIF levels in human pancreatic tissues, and observed a dramatic elevation in all 77 PDAC cases, compared to paired normal tissues, and an apparent trend of increase in chronic pancreatitis tissues (Fig. 5a and Extended Data Fig. 8e). Similar observations were recapitulated in an independent set of human pancreatic specimens by parallel reaction monitoring-based targeted mass spectrometry (PRM-MS) assays, which obviates potential limitations of ELISA assays (Extended Data Fig. 9a–e). More strikingly, among various pathological parameters, LIF levels significantly correlated with PDAC differentiation status as well as overall survival, paralleling LIF mRNA levels revealed by TCGA RNA-seq data (Fig. 5b,c and Extended Data Fig. 8f,g). These correlations, albeit indirect, demonstrated LIF’s physiological importance in human PDAC pathogenesis, and added further evidence corroborating LIF regulation of cancer cell differentiation.
Figure 5 |. LIF can be a biomarker for PDAC monitoring.
a-c. LIF levels in human pancreatic tissues quantified by ELISA (a), and their correlation with tumour differentiation status (b) and overall survival (c). n, NT=9; CP=5; PDAC=77. d, Human circulating LIF levels quantified by Simoa ELISA. n, NT=24; PDAC=69. e, Comparison of circulating LIF and CA19–9 levels in paired human PDAC plasma. Lines connect the paired samples from the same cases. n=28. f, Correlation of circulating LIF level changes and therapeutic responses in PDAC patients. Lines connect the paired samples per patients. n=14. Statistical significance was determined by Kruskal-Wallis test (a,b), nonparametric Spearman correlation test (c,e), Mann Whitney test (d), or Fisher’s Exact Test (f).
The correlation between LIF and tumour pathology in both mouse and human PDAC suggested LIF as a potential disease monitoring marker. Since clinical application requires easy and noninvasive sample acquisition, we evaluated LIF levels in blood samples by ultra-sensitive ELISA assays and readily observed elevation in PDAC conditions (Fig. 5d and Extended Data Fig. 8d,i). Excitingly, among a cohort of 14 PDAC patients treated with preoperative chemotherapy with serial blood samples collected longitudinally during treatment, changes in circulating LIF levels significantly correlated with therapeutic responses, and were an independent and better indicator than Carbohydrate Antigen 19–9 (CA19–9), the only FDA-approved PDAC biomarker in clinical use (Fig. 5e,f and Extended Data Fig. 8h). With regard to specificity, another critical requirement for a biomarker, LIF elevation, in both blood and primary tissues, was unique to PDAC compared to other common solid cancers (Extended Data Fig. 8i and 9f). Collectively, these findings highlighted LIF as a promising marker for monitoring PDAC status and/or therapeutic response.
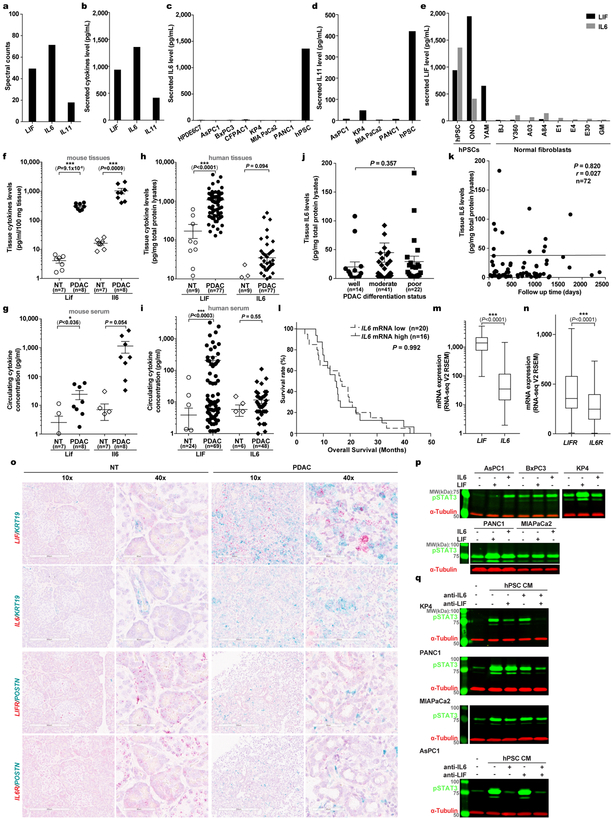
IL6 has been implicated in PDAC, and all its family members, like LIF, bind to receptor complexes containing GP130 to activate similar signal cascades, such as the STAT3 pathway. In our initial screens, IL6 and IL11 were also found to be produced by PSCs (Extended Data Fig. 10a–e). Since IL11 level was below its effective concentration (data not shown), we focused on side-by-side comparison of IL6 and LIF in PDAC. Surprisingly, while significantly elevated in mouse PDAC, IL6 was very low in both human PDAC primary tissues and blood (Extended Data Fig. 10f–i), below the detection threshold by PRM-MS (data not shown). Consistently, IL6 expression in human PDAC tissues was much lower and did not correlate with pathological parameters (Extended Data Fig. 10j–m,o). Moreover, consistent with our findings that fewer PCC lines responded to IL6, IL6R expression in human PDAC tissues was significantly lower, precluding IL6’s direct action on PCCs (Extended Data Fig. 10n–p). These findings underscore the importance of LIF over IL6 in human PDAC. Moreover, contributions of other PSC-secreted cytokines are likely minimal, since increased pSTAT3 was undetectable once both LIF and IL6 activity in hPSC CM were neutralized (Extended Data Fig. 10q).
In sum, using quantitative proteomics, we systemically investigated paracrine communication between PSCs and PCCs, and identified LIF as a critical stromal factor acting on PCCs. Functional studies revealed LIF’s physiological significance in driving both tumour progression and chemoresistance (Extended Data Fig. 8j), and highlighted its translational potential (details in Supplementary Discussion). This translational promise is reinforced and broadened by the significant correlation of tissue and circulating LIF with pathological parameters and its specific elevation and high abundance in PDAC. As such, LIF represents an attractive therapeutic target and biomarker in PDAC and warrants further comprehensive evaluation for its clinical application.
Methods:
Cell lines.
The human pancreatic cancer cell lines AsPC1 (CRL-1682), BxPC3 (CRL-1687), CFPAC1 (CRL-1918), MIAPaCa2 (CRL-1420), PANC1 (CRL-1469), and BJ fibroblasts (CRL-2522) were acquired from ATCC, KP4 (JCRB0182) from JCRB, and cultured per supplier’s instructions. HPDE6C7 was provided by Tsao group (U. Toronto) and cultured as previously described31. The spontaneously immortalized human pancreatic stellate cell line hPSC, ONO, and YAM1 were kindly provided by the Evans group (Salk) as previously described11. Normal human fibroblast cells were a kind gift from the Gage group (Salk). MEF cells for Lifr gene knockout characterization were isolated from individual embryos at E13.5, and cultured in DMEM containing 10% FBS for less than five passages. For the low dosage Gem treatment assay, 3 nM gemcitabine or vehicle (PBS) were used.
Mice.
KrasLSL-G12D/+;Trp53flox; Rosa26LSL-Luc compound mutant mice (denoted as KPf/fL mice) on FVB background were kindly provided by R. Shaw (Salk)32. Pdx1-Cre mice (stock # 014647) were purchased from The Jackson Laboratory, and backcrossed with KPf/fL mice for at least 6 generations before phenotypic analysis. Frozen sperms of C57BL/6N-Lifrtm1a(EUCOMM)Hmgu/H were purchased from the European Mouse Mutant Archive (EMMA) (order ID: 06941) and rederived by in vitro fertilization in the Salk Transgenic Core Facility to obtain the mutant mice (tm1a) harboring a knockout first allele (reporter-tagged insertion with conditional potential), and then crossed with FLPo mice, Gt(ROSA)26Sortm2(FLP*)Sor/J, to delete the FRT-LacZ-Neo-FRT selection cassette and convert into Lifrflox (tm1c) strain with conditional allele. No phenotypic differences were noticed between Lifr+/+ and Lifrf/+ mice, and therefore data from Lifr+/+ and Lifrf/+ mice were combined and designated as LifrWT mice. No sexual dimorphism was noted in any mouse model, and therefore males and females were equally used for experimental purposes and both sexes are represented in all data sets. Mice were bred and maintained in the animal care facilities at the Salk Institute. Genotype of individual mice was determined by PCR using genomic DNA from tail biopsies with Bioline MyTaqTM Extract-PCR Kit. Standard PCR per manufacture protocol was performed, annealing at 58 or 60 °C for 35 cycles. Primer sequences are available upon requested. All animal experiments were performed according to protocols approved by the Salk Institute Animal Care and Use Committee.
Human specimens.
All the human frozen tissues and serum or plasma specimens were in existence, and provided as de-identified samples. Serial plasma samples were collected with the informed consent from the patients and provided to us for ELISA analysis with the approval by Salk Institutional Review Board (IRB) with protocol #17–0005. Human serum samples were provided by UCSD Moores Cancer Center BTTSR (supported by CCSG Grant P30CA23100), UNMC Rapid Autopsy Pancreatic Program (supported by P50CA127297, U01CA210240, P30CA36727, and 5R50CA211462), C.R. Becerra (supported by The Jeanne Shelby Fund for Cancer Research of Communities Foundation of Texas), and E. Borazanci.
Lentiviral constructs and production.
shRNA constructs were purchased from The RNAi Consortium or Addgene as following: human shLIFR #1, TRCN0000430362 with target sequence ACTTCTGCAGATTCGATATTA, and #2, TRCN0000427511 with target sequence TGAAGTGTGTAACTAACAATT; scramble shRNA (shNC), Addgene # 1864 with hairpin sequence as CCTAAGGTTAAGTCGCCCTCGCTCGAGCGAGGGCGACTTAACCTTAGG. Lentivirus was produced in 293T cells transfected with shRNA constructs along with pRSV/REV, pMDLg/pRRE, and pCMV-VSVG packaging constructs. Viral supernatants were collected 48 hr after transfection, spun for 5 min at 3,000 rpm, and filtered. Target cells were infected by incubation in viral supernatants for 6 hr, and selected with 2 mg/L puromycin 36 hr post infection.
Reverse transcription PCR and qPCR.
RNA was isolated using NucleoSpin RNA II kits (Clontech) and converted to cDNA using M-MLV Reverse Transcriptase (Invitrogen). Quantitative PCR was performed using ABI qPCR 7900HT (Thermo Fisher Scientific) by mixing cDNAs, Power SYBR Green PCR Master Mix (Invitrogen), and gene specific primers. ACTB were used as internal control for normalization. Data were analyzed by and analyzed by SDS2.4 software. Primer sequences are: hLIFR-qF: CGAGCCTATACAGATGGTGGA, hLIFR-qR: CCATTCTCGTTTCCGATA GC; hACTB-qF: TCCCTGGAGAAGAGCTACGA, hACTB-qR: TACAGGTCTTTGCGGATGTC.
RNA-seq and bioinformatic analysis.
Whole tumours from each mice were individually resected, dissociated into single cell suspension by enzyme digestion, and ~105 EpCAM+ pancreatic cancer cells were isolated by FACS and directly lysed in RA1 lysis buffer for RNA extraction using NucleoSpin RNA II kits (Clontech) per the manufacture’s protocol. All sequencing libraries were then sequenced at single-end 50 base-pair (bp) on Illumina HiSeq 2500 by the Salk Institute Next Generation Sequencing (NGS) Core. Raw sequencing data was demultiplexed and converted into FASTQ files using CASAVA (v1.8.2). Sequenced reads were quality tested using FASTQC33 (v0.11.2) with the default parameters. Alignment to the mm10 genome was performed using the STAR aligner34 (v2.4.0k). Mapping was carried out using default parameters (up to 10 mismatches per read, and up to 9 multi-mapping locations per read). Raw gene expression was quantified across all gene exons using the top-expressed isoform as proxy for gene expression, and differential gene expression analyses were carried out using the edgeR35 package (v3.6.8) using replicates to compute within-group dispersion. Differentially expressed genes were defined as having a false discovery rate (FDR) <0.05 and a log2 fold change >0.8. Hierarchical clustering was performed using the R language (v3.3.2) with Ward’s hierarchical agglomerative clustering method and 1-cor as a distance metric. The heat map represents the differentially expressed genes that had a FPKM>2 in at least 4 samples, FDR <0.05 and a log2 fold change >0.8. Color represents expression from low (blue) to high (red). The gene set enrichment analyses (GSEA) were performed using GSEA (v.2.2.0, Broad Institute)36. The STAT3 target gene list was referred to a previous report37.
RNA in situ hybridization by RNAscope or BaseScope.
RNA in situ hybridization for examining LIF, LIFR, IL6, IL6R, Ccl11 mRNA cellular localization was performed using RNAscope 2.5 HD Duplex, Multiplex Fluorescent V2 Assay, or BaseScopeTM; Reagent Kit per the manufacturer’s instructions (Advanced Cell Diagnostics). Briefly, freshly resected tissues were immediately fixed in neutral buffered formalin for 26 hr at room temperature with continuous agitation, processed and embedded in paraffin. Five μm tissue sections were collected in RNase-free manner and dried at room temperature overnight. Staining was initiated by baking the slides for 60 min at 60 °C, and then deparaffinized. Pretreatment includes hydrogen peroxide for 10 min, antigen retrieval for 15 min, protease plus treatment for 15 min at 40 °C. Gene-specific target probe sets designed and supplied by the manufacturer were hybridized for 120 min at 40 °C, and sequential amplification steps were performed, and visualized in Red and/or Green, or in fluorescence.
Immunoblot.
Cell lysates were prepared with lysis buffer containing 20 mM Tris (pH 7.5), 150 mM NaCl, 1 mM EDTA, 1 mM EGTA, 1% Triton X-100, 2.5 mM sodium pyrophosphate, 1 mM β-glycerophosphate with freshly added 1 mM Na3VO4, 1 μg/ml leupeptin and 1 mM PMSF. Protein lysates were resolved on SDS-PAGE gel and immunoblot quantification was carried out on an Odyssey Imager (Licor). α-Tubulin was used as loading control and blotted on the same membranes. The primary antibodies against the following proteins were used with indicated dilution: pSTAT3 (Cell Signaling, 9145, clone D3A7, lot 31, 1:1000), pAKT1 (Cell Signaling, 4060, clone D9E, lot 23, 1:2000), and pERK1/2 (Cell Signaling, 4376, clone 20G11, lot 18, 1:1000), STAT3 (Santa Cruz, sc-8019, lot A1816, 1:500), LIFR (Santa Cruz, sc-659, lot 1714, 1:200), and ACTA2 (Santa Cruz, sc-32251, clone 1A4, lot A1218, 1:5000), Krt19 (Epitomics, AC-0073, clone EP72, lot EL050102, 1:2000), α-Tubulin (Sigma, clone B-5-1-2, lot 086M4773v, T5186, 1:10,000).
ELISA.
Frozen tissue specimens were homogenized in cold Tissue Extraction Reagent II (Invitrogen) containing protease and phosphatase inhibitors (Complete mini and PhosSTOP, Roche) at 100 mg tissue per 1 mL and sonicated. 25 μL per well tissue lysate or serum without dilution were used for ELISA quantification. Mouse cytokine/chemokine Panel I kit (Millipore, MCYTOMAG-70K), and Human Circulating Cancer Biomarker Panel kit (Millipore, HCCBP1MAG-58K) customized by addition of the anti-LIF antibodies pair using our own anti-LIF mAb as capture antibody, were used for mouse and human samples respectively. The manufacture’s standard protocol was followed, and fluorescence intensity acquisition for each well and subsequent concentration calculation were carried out by Bio-Plex 200 System (Bio-Rad). For the human serum or plasma specimens, Simoa-based ultra-sensitive ELISA assays38, also customized with our anti-LIF mAb as capture antibody, were performed per Quanterix’s optimal protocol.
Conditioned media (CM) preparation and proteomic secretome profiling.
Cells, seeded in high density a day before so as to reach around 95% confluence at use, were washed three times with PBS and then culture in serum free medium for 36 hr. CM were harvested and spun down for 5 min at 1000 g, filtered through a 0.22 μm filter. For CM stimulation assays on cultured cells, CM were used freshly or stored at 4°C for no more than 3 days. For proteomic secretome profiling, the CM were concentrated by centrifuge through a 3K MW cut-off centrifugal filter (Millipore) at 4000 g for 30 min at 25°C, added PBS and spun two more times to exchange the buffer. The concentrated proteins were dissolved in 8 M urea buffer containing 20 mM HEPES (pH 8), then reduced by dithiothreitol (Sigma), alkylated by iodoacetamide (Sigma), and digested by sequencing-grade trypsin (Promega). Digested peptides were de-salted using SepPak C18 cartridges (Waters) and fractionated into 28 fractions by using strong-cation exchange (SCX) chromatography (PolySULFOETHYL Aspartamide, 2.1 mm × 200 mm, 5 μm, PolyLC) with 70 min gradient at flow rate of 0.3 mL/min as reported previously39. Peptides in each fraction were then desalting by homemade C18 StageTip for MS analysis.
Phosphotyrosine proteomic analysis.
MIAPaCa2 or PANC1 cells at around 90% confluence were starved in serum free medium for 2 hr, and then stimulated with freshly prepared CM, or matched serum-free medium as control, for 5 min at 37 °C, washed with ice-cold PBS instantaneously and lysed with 8 M urea buffer containing 20 mM HEPES (pH 8) and 1 mM Na3VO4. The obtained proteins were reduced, alkylated and digested by TPCK-treated trypsin (Sigma). Digested peptides from two biological replicate samples with stimulation and one control sample were de-salted using SepPak C18 cartridges in parallel and labeled using an on-column three-channel dimethyl labeling protocol40. The labeled peptides were then combined at 1:1:1 ratio and phosphotyrosine (pTyr) peptides were immunoenriched by two rounds of immunoprecipitation with 4G10-conjugated agarose beads (Millipore) as described previously41.
STAT3 IP-MS analysis.
The IP-MS experiments were performed as described previously41. Briefly, PANC1 cells stably expressing 3xFlag-tagged STAT3 were serum starved for 2 hr, and stimulated with freshly prepared hPSCs CM for 10 min at 37 °C, then immediately washed with ice-cold PBS and lysed in Nonidet P-40 lysis buffer containing protease and phosphatase inhibitors (Complete mini and PhosSTOP, Roche). The STAT3-associated proteins were immunoprecipitated with anti-Flag M2 beads (Sigma) and subjected to SDS-PAGE separation on NuPAGE 4–12% Bis-Tris Protein Gels (Thermo). To increase the sensitivity to identify membrane receptors usually at higher molecular weight, gel bands above 70 kDa were cut into 4 slices and subjected to in-gel digestion with sequencing-grade trypsin (Promega).
Mass spectrometry analysis and data processing.
1) For secretome profiling, the samples were analyzed on a TripleTOF 5600 mass spectrometer system (AB SCIEX) as described previously42. A 2.5 hr total LC gradient with 2% to 35% acetonitrile (ACN) over 120 mins was used. The obtained raw files were searched against IPI human database (v3.82, 92104 entries) using Mascot (v2.3.02) and processed for spectral counting quantification using Scaffold (v3.4.9). The edgeR35 package (v3.6.8) was used for generating the MA plot. Gene Ontology annotation was performed using DAVID (v6.8). 2) For phosphoproteomic and IP-MS analyses, the samples were analyzed on an LTQ-Orbitrap Elite mass spectrometer system (Thermo) as described previously41. A 3 hr total LC gradient with 5% to 35% ACN over 120 mins was used. The obtained raw files for phosphoproteomic analysis were processed by MaxQuant (v1.1.1.36) for dimethyl labeling quantification and database searching against IPI human database (v3.79, 91464 entries) with phosphorylation set as variable modification. Minimum ratio counts of 2 is required. IP-MS data was processed by MaxQuant (v1.2.2.5) for label-free quantification with “match between run” function activated and database searching against the IPI human database (v3.79). Only proteins quantified in all three biological replicates with peptide > 3 and “Razor + unique peptides” >1 were considered. 3) For global profiling of pancreatic tumour samples (Extended data Fig. 9b), the samples were analyzed on an Orbitrap Fusion mass spectrometer system (Thermo) as described previously43. A 4 hr total LC gradient with 3 to 7% ACN for 2 min, 7 to 22% ACN for 190 min, and 22 to 35% ACN for 30 min was used. The raw data were searched against the Uniprot human database (70611 entries, downloaded on July 23, 2016) by using Sequest HT node integrated within the Proteome Discoverer software (v1.4, Thermo). All the above-mentioned database searching was done with the standard settings expected for the specific annotations.
Tissue sample processing with glycoprotein enrichment for PRM-MS assays.
Frozen tissue specimens were homogenized in cold lysis buffer containing 100 mM sodium acetate, 150 mM NaCl, 2% SDS, 1% Triton-X 100, pH 5.5, and protease inhibitors (Complete mini, Roche) and sonicated. Glycosylated proteins, presumably mainly secreted ligands and transmembrane receptors, were selectively enriched using an improved hydrazide chemistry approach44. Briefly, the glycans in glycoproteins were oxidized by 2 mM sodium periodate (Sigma) for 1 hr at 4 °C. Then 2 mM biotin-hydrazide (Sigma) was added to react with the aldehyde groups on oxidized glycans. Excess biotin-hydrazide and SDS were removed by protein precipitation. The protein pellet was redissolved in 8 M urea buffer containing 100 mM Tris-HCl, pH 7.8, reduced with DTT and alkylated with IAA as described above. After diluting the urea concentration to 2 M with a solution containing 100 mM Na2HPO4, 150 mM NaCl, pH 7.5, glycoproteins conjugated with biotin-hydrazide were enriched by streptavidin beads (GE Healthcare) and digested with sequencing-grade trypsin (Promega). Peptide samples were fractionated by in-tip high pH fractionation into five fractions for global profiling or direct desalted by homemade C18 StageTip for PRM-MS assay.
PRM-MS quantification and data analysis.
PRM-MS assay was performed on the same Orbitrap Fusion system with the same LC setting as global profiling of tumour samples. 31 peptides (5 for LIF, 15 for LIFR, 11 for GP130) identified from various biological samples, as summarized in Extended Data Table 2, were programmed for the PRM assay with these criteria applied: unique peptide, no dynamic modification, no more than one missed cleavages, appropriate sequence length and clear mass fragment spectrum. The PRM acquisition method was developed as referred to a previous study45 by combining a full MS scan followed by up to 32 PRM scans of precursor ions within the scheduled retention time window (± 25 min of the average retention time detected in the profiling assay). The full MS scans were collected from m/z 350 to 1200 at resolution of 60,000 (at m/z 200), AGC target of 2×10⁵ and maximum injection time of 100 ms. Target precursors were then isolated through a window of 2 Th, followed by fragmentation at normalized collision energy of 30%. The product ions were scanned with resolution of 30,000 (at m/z 200), AGC target of 2×10⁵, and maximum injection time of 120 ms. The PRM raw data were firstly searched against the Uniprot human database by using Sequest HT. The most frequently identified peptides across all the samples were chosen for quantitation. All raw data were analyzed by Skyline (v3.6.0.10493)46 to extract and calculate the transition peak areas and manually inspected by single experienced person. Data met the following four criteria, normalized retention time (iRT) within ± 2 min, linear regression > 0.98, mass difference within ± 20 ppm and dot-product (dotp) score ≥ 0.75, were accepted for further analysis. Relative abundance was calculated by normalizing against the highest intensity in the panel.
Animal studies.
Mouse tumour wet weight was measured immediately following resection, or tumour volume (Fig. 3f) was calculated using the standard modified ellipsoid formula 1/2 (length × width2). For all survival studies, the moribund state or maximal tumor size (20 mm in diameter) allowed by our IACUC was used as the clinical endpoint. For caerulein treatment, mice at 7 weeks of age were subjected to 250 mg/kg body weight caerulein (Bachem) treatment by IP injection with various frequencies: LifrWT- or Lifrf/f- KrasLSL-G12D/+;Pdx1-Cre mice were treated daily for 5 days and rested for 5 days to evaluate tumour initiation; LifrWT;Pdx1-Cre or Lifrf/f;Pdx1-Cre mice were treated daily for 7 days and pancreas tissues were collected 1 or 7 days after the last injection to examine ADM formation and resolution; wildtype CD1 mice (Jax Lab, 003814) were treated twice daily for 5 days per week for 2~4 weeks to induce chronic pancreatitis development. For the short term treatment for RNA-seq analysis (Fig. 3g,h), 6-week KPf/fCL mice were treated with 50 mg/kg Gem twice (on day 1 and 4) plus either 25 mg/kg control IgG or anti-LIF mAb thrice (on day 1, 3, 5) in five days, and tumours were resected on day 6. For the maintenance PDAC model (Fig. 4a), 5-week KPf/fC mice were administered with 50 mg/kg nab-paclitaxel by IV from tail vein followed with 80 mg/kg gemcitabine and 4 mg/kg cisplatin by IP every four days for three times, then after three days off, 50 mg/kg gemcitabine twice weekly together with 25 mg/kg control IgG or anti-LIF mAb thrice weekly were administered by IP till study endpoint. Sample size were not pre-determined by statistical evaluation.
Flow cytometry, tumour sphere formation and in vivo transplantation assays.
Mouse pancreatic tumour dissociation and subsequent flow cytometry analysis or cell sorting for pancreatic tumour sphere formation and in vivo transplantation assays were carried out on a FACSAria III machine and data analysis by FlowJo software (Tree Star) as previously described28.
Histology and immunostaining.
Mouse tumours were resected, fixed in 10% neutral buffered formalin overnight at 4 °C, and paraffin embedded according to standard protocol. 5 μm sections were processed for Haematoxylin and Eosin (H&E), Masson’s Trichrome, or Alcian Blue-Periodic Acid Schiff (AB-PAS) stainings per standard protocol. For immunohistochemistry (IHC) staining, tissue sections were first deparaffinized in xylene and rehydrated in graded ethanols. Antigen retrieval was performed for 15 min in 95–100 °C 10 mM sodium citrate buffer, pH 6.0, or 1mM EDTA, pH 8.0 (for pSTAT3 antibody). Then, endogenous peroxidase activity was quenched by 3% H2O2 for 10 min. Sections were blocked in TBS containing 0.1% Triton X100 (Sigma) and 5% goat or donkey serum (Vector Laboratories). Incubations with primary antibodies were performed overnight at 4 °C in a humidified chamber, followed with appropriate SignalStain Boost IHC Detection Reagent (Cell Signaling Technology) for 30 min, or with biotinylated secondary antibodies for 45 min and then ABC Elite for 30 min (Vector Laboratories), all at room temperature. ImmPACT DAB Kit (Vector Laboratories) was used to develop signals per manufacturer’s instructions. Sections were counterstained with Haematoxylin (Sigma). Multiplex immunofluorescence staining was carried out similarly to IHC staining, except that sections were blocked in PBS containing 0.1% Triton X100, 10% donkey serum, and 5% bovine serum albumin (Millipore), and incubation with Alexa Fluor-conjugated secondary antibodies (Molecular Probes) was performed for 1 hr at room temperature. 4′,6-Diamidino-2-phenylindole (DAPI) (Molecular Probes) was used to stain genomic DNA. The following primary antibodies were used with indicated dilution: mouse anti-ACTA2 (Santa Cruz sc-32251, 1:1500), rabbit anti-Cytokeratin 19 (Epitomics AC-0073, 1:200), rabbit anti-phospho-Stat3 (Tyr705) (CST 9145, 1:100), rabbit anti-cleaved Caspase 3 (CST 9661, lot 37, 1:200), rabbit anti-Ki67 (Abcam ab15580, lot GR264768–1, 1:3000), rabbit anti-Zeb1 (Abcam ab87280, lot GR3186880–1, 1:500), and goat anti-Pdx1 (Abcam ab47383, lot GR295217–1, 1:5000).
Images acquisition and quantification analysis.
Histology and IHC images were acquired with a Pannoramic MIDI slide scanner (3DHISTECH). Automated batch quantification of IHC images was performed with custom ImageJ47 macros enabling the Bio-formats plugin48. In brief, color images were converted into 8-bit grayscale images and then a two-threshold strategy was applied to quantify the percentage of positively stained area over total tissue area, denoted as relative ratio, for each tissue sample. Total tissue area was measured using a low threshold value (threshold = 9, above the background in the blank area), and αSMA+ or Krt19+ regions were similarly quantified using appropriately high threshold values (threshold = 145 and 150, respectively). Fixed threshold values were applied for analysis of all images.
Since both PCCs and PSCs in a certain fraction are proliferating (Ki67+) or mesenchymal (Zeb1+), to quantitatively assess the ratio of proliferating or mesenchymal over the total population of PCCs (Pdx1+)49 specifically, we employed the multiplex immunofluorescence co-staining strategy to mark proliferating or mesenchymal cells and tumour cells independently and simultaneously define the proliferating or mesenchymal tumour cells as those with double positive signals. Multiplex immunofluorescence tissue section images were acquired using the VS120-L100 Virtual Slide System (Olympus) at 20x objective magnification with a consistent scanning setting across the same set of experiments. Prior to quantification, background subtraction using a 512 μm Gaussian filter was applied. Positive-stained nuclear signals were defined by automated surface detection function using Imaris software (Bitplane). Any two surfaces with overlapping area larger than a fixed threshold (27.56 μm2 for red/blue and 78.74 μm2 for magenta/blue) were counted as double positive surfaces. The number of blue (DAPI+) surfaces corresponded to the total number of cells, and the number of magenta (Pdx1+) and blue (DAPI+) double positive surfaces indicated the total number of cancer cells, and the number of red (Ki67+ or Zeb1+)/magenta (Pdx1+)/blue (DAPI+) triple positive surfaces indicated the number of proliferating cancer cells. Statistics were calculated using a custom MATLAB extension code of Imaris software. One tissue section (the entire tissue region of the section) per animal was analyzed, quantified as a whole, and represented as a single data point for all the assays.
Statistical analysis.
Statistical analyses were performed using Prism (v8.0a, GraphPad Software). Sample sizes were determined on the basis of the variability of pancreatic tumour models used. Tumour-bearing animals were randomly assigned to the treatment groups. Two-tailed unpaired Student’s t-test or Mann-Whitney test for two-group comparison, one-way ANOVA with Tukey’s multiple comparisons test or Kruskal Wallis for multiple-group comparison, and Mantel-Cox Log-rank test for survival comparison, were used where appropriate to determine statistical significance. Tumour tissue LIF levels were correlated to survival time by nonparametric Spearman correlation test. Coupling the receiver operating characteristic curve (ROC) with its area under the curve (AUC), a widely used method to estimate the diagnostic potential of a classifier in clinical applications, was performed using the pROC package for R50. Circulating LIF and CA19–9 concentrations were normalized to initial time point for each patient to circumvent variations among patients. The disease response codes (0 = partial/good response; 1 = progression, scored by RECIST standard in clinics) were used as the standard to instruct the actual trend of change. For all the statistical analyses, *, P<0.05; **, p<0.01; ***, p<0.001, and data are shown as the mean ± SEM.
Data availability.
All source data for full IB scan images and statistical analysis presented in Figure panels were included in the Supplementary materials. RNA sequencing data have been deposited in the Gene Expression Omnibus under accession numbers GSE99187 and GSE119694. All MS raw data have been deposited to the MassIVE repository (ftp://massive.ucsd.edu/MSV000081136). The custom scripts for quantification of IHC images with Image J and multiplex immunofluorescence images with Imaris will be freely available upon reasonable request.
Extended Data
Extended Data Figure 1 |. Combinatorial MS analyses to characterize the paracrine communication between PSCs and PCCs.
a, Phosphotyrosine proteomic analysis of intracellular signaling changes in MIAPaCa2 cells in response to hPSC CM stimulation. n=2 biological replicates. b. Summary of phosphotyrosine proteomic analysis data in PANC1 and MIAPaCa2 in response to hPSC CM stimulation. c, Workflow of the analysis of secretome proteomic assays. Proteins identified with at least three spectral counts were counted, and only those identified in both biological replicates were considered. Proteins uniquely secreted by each cell type were defined as those with more than 10-fold differences in spectral count. n=2 biological replicates. d, DAVID gene ontology (GO) analysis of the protein sets uniquely secreted by MiaPaCa2 and hPSC respectively identified the top ten enriched GO terms of molecular function for each cell type. e, Pearson correlation analysis to validate the quantification reproducibility of STAT3 IP-MS assays by label-free quantification (LFQ) between biological replicates. n=3 biological replicates for both control and PSC CM stimulation.
Extended Data Figure 2 |. Dysregulated LIF is a key driver for STAT3 activation in PDAC.
a, IB analyses of the response of various human PCC and PSC cell lines to LIF stimulation, using STAT3 phosphorylation at Y705 (pSTAT3) as a readout. b, IB analyses of LIF-stimulated downstream intracellular signaling changes in three representative PCC lines, KP4, MIAPaCa2 and PANC1, over a two-hr time course. 10 ng/mL recombinant human EGF stimulation for 10 min was used as positive control for pAKT1 and pERK1/2 activation. c,d, IB analyses of pSTAT3 in MIAPaCa2 and PANC1 cells when LIF signaling was blocked by either shRNA knockdown of LIFR (c) or immune-inactivation of LIF using anti-LIF mAb (d). For LIF stimulation (a-d), 1 ng/mL recombinant human LIF was applied for 15 min, and at least three independent experiments were performed and representative images were presented. e, LIFR expression in PCCs by qPCR and its positive correlation with the response intensity to LIF as illustrated in the heatmap. n=2 biological replicates. f, LIF secretion by PCCs and PSCs quantified by ELISA, and its negative correlation with the corresponding response intensity to LIF. n=2 biological replicates. g, Cellular localization of Lif mRNA in pancreatic tumour tissues from KPf/fCL mice was examined by multiplex fluorescent RNAscope assays. Ptprc/Cd45 mRNA was co-stained to mark immune cells, and Krt19 was stained by IF to mark cancer cells. Scale bars: red, 200 μm; white, 50 μm. h-j, pSTAT3 analyzed by IB (h) and immunohistochemistry (IHC) (i) in mouse pancreatic tissues, and by IHC in human pancreatic tissues during the pathogenesis of PDAC (j). NT, mouse normal tissues or non-tumour parts resected from the human tumour trunks; CP, chronic pancreatitis; PDAC, pancreatic tumour tissues collected from KPf/fCL mice or PDAC patients. Scale bars: black, 500 μm; blue, 100 μm. For the histology assays on tissue sections (g,i,j), at least three tumour samples were stained and analyzed, and representative images were presented.
Extended Data Figure 3 |. Intrinsic LIFR signaling in PCCs affected pancreatic cancer progression but not initiation and ADM development.
a, Cellular localization of Lifr mRNA in mouse pancreatic tissues by RNAscope assays. Postn mRNA was co-stained to mark the stromal PSC cells. b, Schematic illustration of Lifr mutant allele structure and conversion into conditional deletion mutant allele by FLPo excision. c,d, Characterization of primary mouse embryonic fibroblasts isolated from Lifrf/f and LIFRf/+ mice respectively, by PCR analysis to determine the genotype of the Lifr allele and loxP-flanked exon deletion by Adenovirus-introduced Cre (c), and by IB analysis to validate the knockout of Lifr proteins and loss of response to LIF (d). +, wildtype allele; f, loxP-flanked mutant allele; ∆, mutant allele with the loxP-flanked exon deleted. e, Representative histological images characterizing the tumours from LifrWT- or Lifrf/f- KPf/fCL mice respectively at the endpoint of survival study presented in Fig. 2b. f,g, Histology characterization of tumour development in LifrWT- or Lifrf/f- KPf/fCL mice at 3, 5, and 7 weeks of age (f), and quantification of cancer cell abundance (g); n=6 mice per condition. h,i, Pathological grade of tumour stage (h) and histological quantification of cancer and stromal PSC cell abundance (i) for pancreatic tissues collected from LifrWT- or Lifrf/f- KC mice treated with 250 mg/kg caerulein by daily IP injection, starting at 7 weeks of age, for 5 days and rested for 5 days to allow tumour development. j, Histology characterization of caerulein-induced ADM development and resolution in LifrWT;Pdx1-Cre or Lifrf/f;Pdx1-Cre mice by Masson’s trichrome stain. Littermates at 7 weeks of age were subjected to daily 250 mg/kg body weight caerulein treatment by IP injection for 7 days, and pancreas tissues were collected 1 or 7 days after the last injection to examine the ADM formation and resolution. No differences were noticed between two genotypes. n=5 mice per condition. k, RNA in situ hybridization by BaseScope assays using probes specifically targeting the loxP-flanked exon 4 of Lifr to examine the escaper cancer cells still maintaining Lifr expression due to incomplete deletion. Scale bars: black, 1000μm; blue, 200μm; yellow, 50μm. Statistical significance was determined by two-way ANOVA (h) or two-tailed unpaired Student’s t-test.
Extended Data Figure 4 |. LIFR signaling in PCCs modulated cancer cell differentiation.
a,b, Flow cytometry analysis of the total cell counts (a) and relative frequency (b) of tumour-initiating cell populations in individual tumours. c, Functional evaluation of tumour-initiating cell abundance by in vitro sphere formation. d-i, Differential gene expression comparing the EpCAM+ cancer cells purified from individual tumours of LifrWT- or Lifrf/f- KPf/fCL mice, are shown in heat maps. Colors correspond to standardized expression of genes. n=4 mice per treatment. d, Hierarchical clustering of all the 1129 differentially expressed genes (FDR < 0.05, log2 fold change > 0.8 and FPKM>2 in at least 4 samples). Heat maps of genes related to tumour-initiating cell markers (e), STAT3 downstream targets (f), and Gem response (g). h,i, Gene set enrichment analysis (GSEA). j,l, Csf2 (encoding Gm-csf) and Ccl11 genes expression in EpCAM+ PCCs, Pdgfrα+ CAFs and Ptprc/Cd45+ tumour infiltrating lymphocytes (TILs), purified by FACS from tumours of KPf/fCL mice, by RNA-seq analysis. n=4, 3, 3 respectively. k,m,n, Multiplex ELISA analysis of Gm-csf and Ccl11 levels in normal, caerulein-induced chronic pancreatitis (CP), and PDAC tissues of KPf/fCL mice showed that the increase in Gm-csf was induced only when tumours developed (k), while the increase in Ccl1l level was induced in both CP and PDAC consistently both in mouse models (m) and human disease (n), supporting the notion that Ccl11 is a cytokine specifically produced by PSCs while Gm-csf specifically by PCCs. o, Cellular localization of Ccl11 mRNA in pancreatic cancer tissues from KPf/fCL mice was examined by multiplex fluorescent RNAscope assays. Ptprc/Cd45 mRNA was co-stained to mark immune cells, and Krt19 stained by IF to mark cancer cells. n=3 tumours. Scale bars: yellow, 500μm; white, 100μm.
Extended Data Figure 5 |. Preclinical study in KPf/fCL mouse model revealed therapeutic beneficial effects of LIF blockade by anti-LIF mAb.
a-d. Anti-LIF mAb production and characterization. a, Silver staining of control mouse IgG and purified anti-LIF mAb used for preclinical treatment. b,c, IB analysis to evaluate the activity and specificity of anti-LIF mAb against various forms of LIF (rhLIF, recombinant human LIF; ehLIF, eukaryotically secreted human LIF; rmLIF, recombinant mouse LIF) and IL6 (b) and revealed that the anti-LIF mAb has weaker neutralizing activity against mLIF compared to hLIF (c). d, Pilot test of anti-LIF mAb in KPf/fCL mice for dosage optimization. KPf/fCL mice at 42 days of age were administered with 25 mg/kg body weight of anti-LIF mAb by IP injection every other day for three times, and one day after the last injection tumours were collected for histology analysis. Adjacent sections were used for the indicated staining. Representative images from three independent experiments or mice were showed. e, Regimen for the preclinical therapeutic treatment. KPf/fCL mice at 5 weeks of age were randomly enrolled into four cohorts. For the first 12 days as phase one, 25 mg/kg anti-LIF mAb or control IgG were administered by IP injection, together with 50 mg/kg Gem or vehicle at standard Q3D4 dosage. This was followed by weekly cycles as phase two with antibodies thrice and Gem twice weekly. f, Histological characterization with representative images and cell abundance quantification. g, Relative abundance of EpCAM+ cancer cells quantified by flow cytometry analysis. h, Double immunofluorescence staining to confirm the cell type specific expression of cytosolic protein Krt19 and nuclear protein Pdx1 as the PCC marker. n=3 tumour tissues. i, Double immunofluorescence staining of nucleus-localized proteins Ki67 (used as a proliferation marker) and Pdx1 (as the PCC marker), and quantification of proliferating cancer cell frequency as the fraction of proliferating cancer cells (Ki67+/Pdx1+/DAPI+) over total cancer cells (Pdx1+/DAPI+). j, Cleaved Caspase 3 IHC analysis to assess apoptosis. Scale bar, yellow, 300 μm; black, 100μm; white, 50 μm. Statistical significance was determined by two-tailed unpaired Student’s t-tests.
Extended Data Figure 6 |. LIF blockade alleviated chemoresistance directly by affecting cancer cell differentiation.
a, Representative histological images showing different tumour differentiation status. b-d, Flow cytometry analysis of the total cell count (b) and relative frequency (c) of tumour-initiating cell populations in individual tumours, and the gating strategy exemplified with representative contour plots (d). e, Multiplex immunofluorescence staining of nuclear proteins Zeb1 (as a mesenchymal cell marker) and Pdx1 (as the PCC marker) and quantification of mesenchymal cancer cell frequency as the fraction of Zeb1+/Pdx1+/DAPI+ cancer cells over Pdx1+/DAPI+ total cancer cells. f, Sphere formation assays on primary PCCs with or without Lifr deficiency in response to low concentration (3 nM) Gem treatment. n=9 per condition. g-i, Histological characterization of tumour tissues from the maintenance study (ref to Fig. 4c–e), and representative images of AB-PAS staining for well-differentiated cancer cells with acidic and neutral mucin stained in blue and magenta (g), of multiplex immunofluorescence staining of Zeb1 and Pdx1 proteins for the mesenchymal cancer cell frequency quantification and EMT (h), and of Cleaved Caspase 3 IHC analysis for apoptosis (i). Scale bars: black, white, 300μm; blue, 100μm; yellow, 50μm. Statistical significance was determined by two-tailed unpaired Student’s t-test.
Extended Data Figure 7 |. LIF blockade profoundly affected genes expression in cancer cells analyzed by RNA-seq.
a-e, Differential gene expression comparing the EpCAM+ cancer cells purified from individual tumours of KPf/fCL mice treated with either Gem+control IgG (GI) or Gem+anti-LIF mAb (GA) are shown in heat maps. Colors correspond to standardized expression of genes. a, Hierarchical clustering of all the 1624 differentially expressed genes (FDR < 0.05, log2 fold change > 0.8 and FPKM>2 in at least 4 samples). b, Gene set enrichment analysis. Heat maps presenting the expression levels of genes related to tumour-initiating cell markers (c), STAT3 downstream targets (d), and Gem response (e). f, Venn diagram comparing the differentially expressed genes by pharmacologic LIF blockade and genetic Lifr deficiency revealed 811 consensus genes. g, Hierarchical clustering of 811 consensus genes with differential expression by either pharmacologic LIF blockade and genetic Lifr deficiency.
Extended Data Figure 8 |. Correlation analysis between tissue LIF levels and clinical parameters of PDAC.
a-c, ELISA analysis of Lif levels (a), and IB and IHC analyses of STAT3 activation in mouse pancreatic tissues at various stages of PDAC pathogenesis. Scale bars: black, 200μm; blue, 50μm. d, Mouse serum Lif levels at various stages of pancreas pathogenesis analyzed by ELISA. e, Summary table of clinical parameters of the human cases from whom pancreatic tissue samples were collected for ELISA assays and correlation analysis. f, Correlation analysis of human tissue LIF levels and indicated clinical parameters by Chi square analysis. g, Correlation analysis between tissue LIF mRNA levels and disease free survival of patients with stage I or IIa PDAC at diagnosis by Mantel-Cox Log-rank test and presented as Kaplan-Meier survival curve. Data derived from TCGA database. h, Correlation analysis between the changes in circulating LIF or CA19–9 levels and tumour status scored by RECIST grade during multi-cycle therapeutic treatment by the receiver operating characteristic (ROC) analysis. n=51 data points. i, Serum LIF levels in various solid cancer patients by Simoa ELISA. j, Graphic summary of LIF action in pancreatic carcinogenesis.
Extended Data Figure 9 |. PRM-MS assay development and analysis.
a, Schematic workflow of the glycoprotein enrichment strategy followed with PRM-MS assays. b, Identified unique peptides of the targeted proteins in human pancreatic tissues. c, Reproducibility evaluation of the tissue sample preparation and PRM-MS analysis. d, Summary table of clinical parameters of the human cases from whom pancreatic tissue samples were collected for PRM-MS analysis. e,f, LIF protein levels in human primary tumour and paired normal tissue samples from pancreatic cancer patients (e) and various solid cancer patients (f) quantified by PRM-MS assays. g,h, LIFR and GP130 protein levels in human pancreatic tissues quantified by PRM-MS assays. Statistical significance was determined by two-tailed unpaired Student’s t-test (f) or one-way ANOVA (e,g,h); *, p<0.05; ***, p<0.001.
Extended Data Figure 10 |. Comparison of LIF and IL6 in PDAC.
a,b, MS and ELISA quantification of IL6 family cytokines in hPSC CM. n=2 biological replicates. c-e, ELISA quantification of IL6 (c) and IL11 (d) in CMs of various human PCC lines, and LIF and IL6 in CMs from various human PSC or normal fibroblast cells (e). n=2 biological replicates. f-i, ELISA quantification of LIF and IL6 levels in mouse and human pancreatic tissues (f,g) and sera respectively (h,i). j,k, Correlation analysis between human tissue IL6 levels and tumour differentiation status by Kruskal-Wallis test (j) or overall survival by Pearson correlation test (k). l-n, Correlation analysis between tissue IL6 mRNA levels and overall survival by Mantel-Cox Log-rank test presented as Kaplan-Meier survival curve (l), and mRNA expression compared by Wilcoxon matched-pairs rank test and presented as Tukey box-and-whisker plots (m,n); RNA-seq data of 170 PDAC tissues were derived from TCGA database. o, Cellular localization of mRNA expression in human pancreatic tissues examined by RNAscope assays. KRT19 or POSTN were co-stained to mark PCC and PSC cells respectively. p,q, IB analysis of pSTAT3 activation in indicated human pancreatic cancer cell lines in response to 1 ng/mL recombinant human IL6 or LIF stimulation (p) or the stimulation by hPSC CM with or without immune-inactivation of LIF and/or IL6 using neutralizing antibodies (q). 15 min stimulation were carried out for all. Representative images from three independent experiments were showed.
Supplementary Material
Acknowledgements
We thank F. McCormick and M. Wang (UCSF) for sharing reagents and results, R. Shaw (Salk) for KPf/fL mice, M. Karin (UCSD) for mouse cancer samples and manuscript comments, H. Han and E. Menashi (Tgen) for experimental suggestions and reagents, Justin Zimmerman and Suzy Simon for lab support, Nicole Cernac and Jessica Chang for lab assistance, Joseph Chambers and Karen Suter-Brady for animal work, Tong Zhang and Kimberly Mcintyre for histology services. This work was supported by the following grants: Ministry of Science and Technology of China (2016YFA0501403) and National Natural Science Foundation of China (21575057) to R.T.; NIH CA014195, CA082683, CA080100, Lustgarten Foundation (awards 388246 and 552873), Helmsley Charitable Trust (2012-PG-MED002), and William Isacoff Research Foundation to T.H.; SU2C Pancreatic Cancer Dream Team (SU2C-AACR-DT-05–09, SU2C-AACR-DT-20–16) to D.V.H., R.M.E., G.W., T.H., A.M.L., T.R. and M.D.; NRSA F31CA206416 and T32GM007752 to N.K.L.; F32CA217033 to G.L.; Flinn Foundation to E.B.; NIH CA178015, CA227807, CA222862 to E.A.C; NIH CA197699, CA186043 to T.R., NIH CA155620 to A.M.L.; NIH P50CA127297, U01CA210240, P30CA36727, 5R50CA211462 to P.M.G. and M.A.H.. R.M.E. is a Howard Hughes Medical Institute Investigator, and supported by Lustgarten, Ipsen/Biomeasure, Freeberg, and William Isacoff Research Foundation. We thank Salk core facilities and staff, financially supported by NCI CCSG CA014195, including Advanced Biophotonics,, Flow Cytometry, Functional Genomics, Integrative Genomics and Bioinformatics, Next Generation Sequencing, and Transgenic Cores. Y.S. received a fellowship from the Helmsley Charitable Trust. T.H. is a Frank and Else Schilling American Cancer Society Professor and the Renato Dulbecco Chair in Cancer Research.
Footnotes
Supplementary information is available in the online version of the paper
Additional information Reprints and permissions information is available at www.nature.com/reprints. The authors declare competing financial interests: details are available in the online version of the paper. Readers are welcome to comment on the online version of the paper.
References:
- 1.Chu GC, Kimmelman AC, Hezel AF & DePinho RA Stromal biology of pancreatic cancer. J. Cell. Biochem 101, 887–907 (2007). [DOI] [PubMed] [Google Scholar]
- 2.Feig C et al. The pancreas cancer microenvironment. Clin. Cancer Res 18, 4266–4276 (2012). [DOI] [PMC free article] [PubMed] [Google Scholar]
- 3.Omary MB, Lugea A, Lowe AW & Pandol SJ The pancreatic stellate cell: a star on the rise in pancreatic diseases. J. Clin. Invest 117, 50–59 (2007). [DOI] [PMC free article] [PubMed] [Google Scholar]
- 4.Mahadevan D & Von Hoff DD Tumor-stroma interactions in pancreatic ductal adenocarcinoma. Mol. Cancer Ther 6, 1186–1197 (2007). [DOI] [PubMed] [Google Scholar]
- 5.Erkan M et al. StellaTUM: current consensus and discussion on pancreatic stellate cell research. Gut 61, 172–178 (2012). [DOI] [PMC free article] [PubMed] [Google Scholar]
- 6.Apte MV, Wilson JS, Lugea A & Pandol SJ A starring role for stellate cells in the pancreatic cancer microenvironment. Gastroenterology 144, 1210–1219 (2013). [DOI] [PMC free article] [PubMed] [Google Scholar]
- 7.Tape CJ et al. Oncogenic KRAS regulates tumor cell signaling via stromal reciprocation. Cell 165, 910–920 (2016). [DOI] [PMC free article] [PubMed] [Google Scholar]
- 8.Corcoran RB et al. STAT3 plays a critical role in KRAS-induced pancreatic tumorigenesis. Cancer Res. 71, 5020–5029 (2011). [DOI] [PMC free article] [PubMed] [Google Scholar]
- 9.Fukuda A et al. Stat3 and MMP7 contribute to pancreatic ductal adenocarcinoma initiation and progression. Cancer Cell 19, 441–455 (2011). [DOI] [PMC free article] [PubMed] [Google Scholar]
- 10.Lesina M et al. Stat3/Socs3 activation by IL-6 transsignaling promotes progression of pancreatic intraepithelial neoplasia and development of pancreatic cancer. Cancer Cell 19, 456–469 (2011). [DOI] [PubMed] [Google Scholar]
- 11.Sherman MH et al. Vitamin D receptor-mediated stromal reprogramming suppresses pancreatitis and enhances pancreatic cancer therapy. Cell 159, 80–93 (2014). [DOI] [PMC free article] [PubMed] [Google Scholar]
- 12.Nicola NA & Babon JJ Leukemia inhibitory factor (LIF). Cytokine Growth Factor Rev. 26, 533–544 (2015). [DOI] [PMC free article] [PubMed] [Google Scholar]
- 13.Penuelas S et al. TGF-beta increases glioma-initiating cell self-renewal through the induction of LIF in human glioblastoma. Cancer Cell 15, 315–327 (2009). [DOI] [PubMed] [Google Scholar]
- 14.Liu SC et al. Leukemia inhibitory factor promotes nasopharyngeal carcinoma progression and radioresistance. J. Clin. Invest 123, 5269–5283 (2013). [DOI] [PMC free article] [PubMed] [Google Scholar]
- 15.Albrengues J et al. LIF mediates proinvasive activation of stromal fibroblasts in cancer. Cell Rep. 7, 1664–1678 (2014). [DOI] [PubMed] [Google Scholar]
- 16.Inda MM et al. Tumor heterogeneity is an active process maintained by a mutant EGFR-induced cytokine circuit in glioblastoma. Genes Dev. 24, 1731–1745 (2010). [DOI] [PMC free article] [PubMed] [Google Scholar]
- 17.Ohlund D et al. Distinct populations of inflammatory fibroblasts and myofibroblasts in pancreatic cancer. J. Exp. Med 214, 579–596 (2017). [DOI] [PMC free article] [PubMed] [Google Scholar]
- 18.Bressy C et al. LIF Drives neural remodeling in pancreatic cancer and offers a new candidate biomarker. Cancer Res. 78, 909–921 (2018). [DOI] [PubMed] [Google Scholar]
- 19.Biffi G et al. IL-1-induced JAK/STAT signaling is antagonized by TGF-beta to shape CAF heterogeneity in pancreatic ductal adenocarcinoma. Cancer Discov (2018). [DOI] [PMC free article] [PubMed] [Google Scholar]
- 20.Laklai H et al. Genotype tunes pancreatic ductal adenocarcinoma tissue tension to induce matricellular fibrosis and tumor progression. Nat. Med 22, 497–505 (2016). [DOI] [PMC free article] [PubMed] [Google Scholar]
- 21.Bayne LJ et al. Tumor-derived granulocyte-macrophage colony-stimulating factor regulates myeloid inflammation and T cell immunity in pancreatic cancer. Cancer Cell 21, 822–835 (2012). [DOI] [PMC free article] [PubMed] [Google Scholar]
- 22.Pylayeva-Gupta Y, Lee KE, Hajdu CH, Miller G & Bar-Sagi D Oncogenic Kras-induced GM-CSF production promotes the development of pancreatic neoplasia. Cancer Cell 21, 836–847 (2012). [DOI] [PMC free article] [PubMed] [Google Scholar]
- 23.Kim KJ, Alphonso M, Schmelzer CH & Lowe D Detection of human leukemia inhibitory factor by monoclonal antibody based ELISA. J. Immunol. Methods 156, 9–17 (1992). [DOI] [PubMed] [Google Scholar]
- 24.Li C et al. Identification of pancreatic cancer stem cells. Cancer Res. 67, 1030–1037 (2007). [DOI] [PubMed] [Google Scholar]
- 25.Hermann PC et al. Distinct populations of cancer stem cells determine tumor growth and metastatic activity in human pancreatic cancer. Cell stem cell 1, 313–323 (2007). [DOI] [PubMed] [Google Scholar]
- 26.Kim MP et al. ALDH activity selectively defines an enhanced tumor-initiating cell population relative to CD133 expression in human pancreatic adenocarcinoma. PLOS ONE 6, e20636 (2011). [DOI] [PMC free article] [PubMed] [Google Scholar]
- 27.Li C et al. c-Met is a marker of pancreatic cancer stem cells and therapeutic target. Gastroenterology 141, 2218–2227 e2215 (2011). [DOI] [PubMed] [Google Scholar]
- 28.Fox RG et al. Image-based detection and targeting of therapy resistance in pancreatic adenocarcinoma. Nature 534, 407–411 (2016). [DOI] [PMC free article] [PubMed] [Google Scholar]
- 29.Singh A & Settleman J EMT, cancer stem cells and drug resistance: an emerging axis of evil in the war on cancer. Oncogene 29, 4741–4751 (2010). [DOI] [PMC free article] [PubMed] [Google Scholar]
- 30.Jameson GS et al. A phase Ib/II pilot trial with nab-paclitaxel plus gemcitabine plus cisplatin in patients (pts) with stage IV pancreatic cancer. J. Clin. Oncol 35, 341–341 (2017). [Google Scholar]
- 31.Ouyang H et al. Immortal human pancreatic duct epithelial cell lines with near normal genotype and phenotype. Am. J. Pathol 157, 1623–1631 (2000). [DOI] [PMC free article] [PubMed] [Google Scholar]
- 32.Shackelford DB et al. LKB1 inactivation dictates therapeutic response of non-small cell lung cancer to the metabolism drug phenformin. Cancer Cell 23, 143–158 (2013). [DOI] [PMC free article] [PubMed] [Google Scholar]
- 33.FastQC: a quality control tool for high throughput sequence data. (2010).
- 34.Dobin A et al. STAR: ultrafast universal RNA-seq aligner. Bioinformatics 29, 15–21 (2013). [DOI] [PMC free article] [PubMed] [Google Scholar]
- 35.Robinson MD, McCarthy DJ & Smyth GK edgeR: a Bioconductor package for differential expression analysis of digital gene expression data. Bioinformatics 26, 139–140 (2010). [DOI] [PMC free article] [PubMed] [Google Scholar]
- 36.Subramanian A et al. Gene set enrichment analysis: a knowledge-based approach for interpreting genome-wide expression profiles. Proc. Natl. Acad. Sci. U. S. A 102, 15545–15550 (2005). [DOI] [PMC free article] [PubMed] [Google Scholar]
- 37.Dauer DJ et al. Stat3 regulates genes common to both wound healing and cancer. Oncogene 24, 3397–3408 (2005). [DOI] [PubMed] [Google Scholar]
- 38.Rissin DM et al. Single-molecule enzyme-linked immunosorbent assay detects serum proteins at subfemtomolar concentrations. Nat. Biotechnol 28, 595–599 (2010). [DOI] [PMC free article] [PubMed] [Google Scholar]
- 39.Villen J & Gygi SP The SCX/IMAC enrichment approach for global phosphorylation analysis by mass spectrometry. Nat. Protoc 3, 1630–1638 (2008). [DOI] [PMC free article] [PubMed] [Google Scholar]
- 40.Boersema PJ, Raijmakers R, Lemeer S, Mohammed S & Heck AJ Multiplex peptide stable isotope dimethyl labeling for quantitative proteomics. Nat. Protoc 4, 484–494 (2009). [DOI] [PubMed] [Google Scholar]
- 41.Tian R et al. Combinatorial proteomic analysis of intercellular signaling applied to the CD28 T-cell costimulatory receptor. Proc. Natl. Acad. Sci. U. S. A 112, E1594–E1603 (2015). [DOI] [PMC free article] [PubMed] [Google Scholar]
- 42.Zheng Y et al. Temporal regulation of EGF signalling networks by the scaffold protein Shc1. Nature 499, 166–171 (2013). [DOI] [PMC free article] [PubMed] [Google Scholar]
- 43.Chen W et al. 3D-SISPROT: A simple and integrated spintip-based protein digestion and three-dimensional peptide fractionation technology for deep proteome profiling. J. Chromatogr. A 1498, 207–214 (2017). [DOI] [PubMed] [Google Scholar]
- 44.Zhang H, Li XJ, Martin DB & Aebersold R Identification and quantification of N-linked glycoproteins using hydrazide chemistry, stable isotope labeling and mass spectrometry. Nat. Biotechnol 21, 660–666 (2003). [DOI] [PubMed] [Google Scholar]
- 45.Peterson AC, Russell JD, Bailey DJ, Westphall MS & Coon JJ Parallel reaction monitoring for high resolution and high mass accuracy quantitative, targeted proteomics. Mol. Cell. Proteomics 11, 1475–1488 (2012). [DOI] [PMC free article] [PubMed] [Google Scholar]
- 46.MacLean B et al. Skyline: an open source document editor for creating and analyzing targeted proteomics experiments. Bioinformatics 26, 966–968 (2010). [DOI] [PMC free article] [PubMed] [Google Scholar]
- 47.Schindelin J et al. Fiji: an open-source platform for biological-image analysis. Nat. Methods 9, 676–682 (2012). [DOI] [PMC free article] [PubMed] [Google Scholar]
- 48.Linkert M et al. Metadata matters: access to image data in the real world. J. Cell Biol 189, 777–782 (2010). [DOI] [PMC free article] [PubMed] [Google Scholar]
- 49.Roy N et al. PDX1 dynamically regulates pancreatic ductal adenocarcinoma initiation and maintenance. Genes Dev. 30, 2669–2683 (2016). [DOI] [PMC free article] [PubMed] [Google Scholar]
- 50.Robin X et al. pROC: an open-source package for R and S+ to analyze and compare ROC curves. BMC Bioinformatics 12, 77 (2011). [DOI] [PMC free article] [PubMed] [Google Scholar]
Associated Data
This section collects any data citations, data availability statements, or supplementary materials included in this article.
Supplementary Materials
Data Availability Statement
All source data for full IB scan images and statistical analysis presented in Figure panels were included in the Supplementary materials. RNA sequencing data have been deposited in the Gene Expression Omnibus under accession numbers GSE99187 and GSE119694. All MS raw data have been deposited to the MassIVE repository (ftp://massive.ucsd.edu/MSV000081136). The custom scripts for quantification of IHC images with Image J and multiplex immunofluorescence images with Imaris will be freely available upon reasonable request.


