Abstract
Introduction:
Ovarian cancer is now recognized as a constellation of distinct subtypes of neoplasia involving the ovary and related structures. As a consequence of this heterogeneity, the analysis of covariates influencing the overall survival is crucial in this disease segment. In this work, an overall survival model incorporating tumor kinetics metrics in patients with platinum-resistant ovarian cancer was developed from the randomized, open label, phase 3 AURELIA trial.
Methods:
Tumor size data from 361 patients randomly allocated to the bevacizumab + chemotherapy or chemotherapy study arm were collected at baseline and every 8 to 9 weeks until disease progression. Patients continued to be followed for survival after treatment discontinuation. A landmarked Cox proportional hazard survival model was developed to characterize the overall survival distribution.
Results:
Two sets of factors were found to be influential on survival time: those describing the type and severity of disease (Eastern Cooperative Oncology Group [ECOG], Féderation Internationale de Gynécologie et d’Obstétrique [FIGO] stages, presence of ascites) and those summarizing the key features of the tumor kinetic model (tumor shrinkage at week 8 and tumor size at treatment onset). The treatment group was not required in the final model as the drug effect was accounted for in the tumor kinetics model.
Conclusions:
This work has identified both ascites and tumor kinetics metrics as being the 2 most influential factors to explain variability in overall survival in patients with platinum-resistant ovarian cancer.
Keywords: ovarian cancer, angiogenesis, overall survival, tumor kinetics, anti-angiogenesis, therapy
Introduction
Epithelial ovarian cancer is the fifth most common cause of cancer-related death in women. The combination of surgery and platinum-based chemotherapy has been widely used to control advanced ovarian cancers resulting in approximately 70% response rate.1 Patients with disease relapses within 6 months after platinum-based chemotherapy are considered to have platinum-resistant ovarian cancer (PROC). The randomized, open-label, phase 3 AURELIA trial was designed to compare progression-free survival (PFS) in patients with PROC treated with chemotherapy (CT) alone or in combination of bevacizumab (B).2
Commonly, objective response rates (ORR) and/or PFS are used to evaluate clinical benefits of oncology drugs and may allow regulatory submission before overall survival (OS) data become mature. However, these statistics have shown limitations.3–9 Other measures describing the change in tumor size over time (tumor kinetics [TK]) have been considered and have shown to be correlated with OS, at the individual level, in various indications including colorectal cancer,10 gastrointestinal stromal tumor cancer,11 renal carcinoma cancer,12,13 and non-small cell lung cancer14 and may offer an opportunity for early evaluation of clinical benefits. This approach requires the development of paradigms linking changes in tumor size over time to models predicting clinical outcomes such as OS.15
As the relationship between TK and OS is specific to the target treatment population, survival models incorporating tumor kinetic metrics have to be developed for each tumor type and line of treatment.15 Although a survival model was previously developed for patients with PROC,16 there is no model relating change in TK to OS established in PROC. We aimed at developing a framework to quantify the benefits of bevacizumab in patients with PROC on TK and to assess the level of correlation between TK metrics and OS in this disease segment.
Patients and Methods
Trials and data
Individual data were available from the randomized phase 3 trial AURELIA. Details of patient characteristics and study design can be found in Pujade-Lauraine et al.2 A total of 361 patients were randomly allocated to the B + CT (n=179) or CT (n=182) arm. Investigators’ selection of CT was evenly distributed in both study arms among the 3 options: in all, 126 patients (35%) received pegylated liposomal doxorubicin (PLD), 115 patients (32%) received paclitaxel, and 120 patients (33%) received topotecan. B was given at a dose of 10 mg/kg every 2 weeks or 15 mg/kg every 3 weeks depending on the CT schedule. Patients’ characteristics at baseline are presented in Table 1.
Table 1.
Demographic and baseline patient characteristics.
| CT (n=182) | B + CT (n=179) | |
|---|---|---|
| Age (median, range in years) | 61.0 [25, 84] | 62 [25, 80] |
| Origin of cancer: Ovary | 86% | 93% |
| Histology type: Serous | 84% | 87% |
| ECOG status: 0 | 54% | 60% |
| Pre-treatment SLD (median, range in mm) | 56.5 [10, 370] | 54 [10, 314] |
Abbreviations: B, bevacizumab; CT, chemotherapy; ECOG, Eastern Cooperative Oncology Group; SLD, sum of longest diameters.
Tumor size reported as the sum of longest diameters of target lesions (SLD) was defined according to RECIST 1.0 and was collected at baseline (up to 8 weeks before treatment initiation) and every 8 to 9 weeks thereafter until disease progression. Patients could discontinue earlier if there was evidence of progressive disease, if unacceptable toxicity occurred, or if the attending physician or the patient requested discontinuation. Yet, even in this case, patients continued to be followed for OS.
The AURELIA study demonstrated a prolonged PFS in patients treated with B + CT compared with CT. The study was not designed to conclude on OS, and the hazard ratio (HR) of 0.85 in favor of B + CT was associated with a 95% confidence interval (CI) ranging from 0.66 to 1.08.2
Model development
Tumor kinetics model
A TK model was used to fit the SLD values. The TK model accounted for the dynamics of tumor growth, antitumor drug effect, and resistance to the drug effect (equation (1)). This model was initially proposed by Claret et al17
| (1) |
where is the SLD value at time j in patient i, is the estimated tumor size at baseline (time of treatment onset, =0) in patient i, is the estimated SLD growth rate in patient i, is the estimated SLD decrease rate in patient i, and is the resistance parameter reflecting the loss of treatment effect over time in patient . The additive residual error term captures the unexplained variability in the data, including measurement errors.
The influence of treatment was tested in the model by introducing an interaction term
with , CT being topotecan, PLD or paclitaxel, and B + CT being any combinations of CT with B. The parameters and were expected to be influenced by the treatment.
Only patients who had a pre-treatment and at least one on-treatment TS assessment were retained in the time series analysis. Overall, 9.5% of the observed SLD values were reported below the limit of detection (5 mm) and were set to 2.5 mm.
To account for deviations from a typical population parameter, inter-individual variability was incorporated as exponential random effects, such that
with .
The model parameters were estimated using a nonlinear mixed effect approach in which all the data from all evaluable patients were simultaneously analyzed. The first-order conditional estimation method with interaction in NONMEM version 7.2 (Globomax, LLC, Hanover, USA) was used to estimate the model parameters.
The model associated with the lowest Akaike information criteria (AIC) was retained as the best model among those tested. Models with an unsuccessful estimation of parameter standard errors were not retained. To evaluate the predictive performances of the TK model, model-predicted distributions of SLD were overlaid to the observed ones.
Following previous works, 3 individual TK metrics were derived for each patient.10 Early tumor shrinkage () was derived as the ratio between the predicted tumor size at week 8 and the predicted tumor size at baseline; maximum tumor shrinkage () was calculated as the ratio between the predicted minimum tumor size (during CT ± B treatment) and the predicted tumor size at baseline; and time to (re-)growth () was the model predicted time to reach the predicted minimum tumor size (during CT ± B treatment).
Overall survival model
A landmarked Cox proportional-hazard model was used to analyze OS. It included clinically relevant baseline covariates such as the Eastern Cooperative Oncology Group (ECOG) performance status, Féderation Internationale de Gynécologie et d’Obstétrique (FIGO) stage at baseline, histological grade and subtype, time from first diagnosis to randomization, presence of ascites, model-predicted SLD at time of treatment onset (), and CA-125 at baseline which were tested as OS prognostic factors.
The landmark was set to week 8, corresponding to the time of first CT scan collection. As a consequence, any event (death or censoring) occurring between baseline and week 8 was removed from the OS analysis. In this framework, only the TK metrics was tested as a predictive biomarker in the Cox model.
A resampling procedure (using the boot.stepAIC function which builds on the stepAIC function of the R MASS package)18 was used to reduce the risk of false selection.19
The predictive value of each covariate was evaluated using the concordance index (c-index) introduced by Harrell20 and the Brier score. Harrell’s overall c-index indicates the proportion of all pairs of subjects who can be ordered such that the subject with higher predicted survival is the one who actually survived longer. The Brier score corresponds to the squared differences between actual and predicted outcomes. Both c-index and Brier score are obtained using the pec package in R.21
Results
Tumor kinetics model
Of the 361 patients randomized in the AURELIA trial, 275 patients (140 in the CT arm and 135 in the B + CT arm) were included in this analysis. The median number of tumor assessments per patient was 4 (with a maximum of 16).
The final TK model adequately described the observed values. The model parameter estimates are reported in Table A1 in Appendix 1.
Although the typical values for , , and were common to all patients (CT and B + CT), the final model contained a parameter estimate specific to each type of chemotherapy (paclitaxel, PLD, or topotecan) in both CT and B + CT groups, respectively, indicating a differential rate to tumor regrowth and, thus, treatment effect duration, as suggested in Husain et al.22
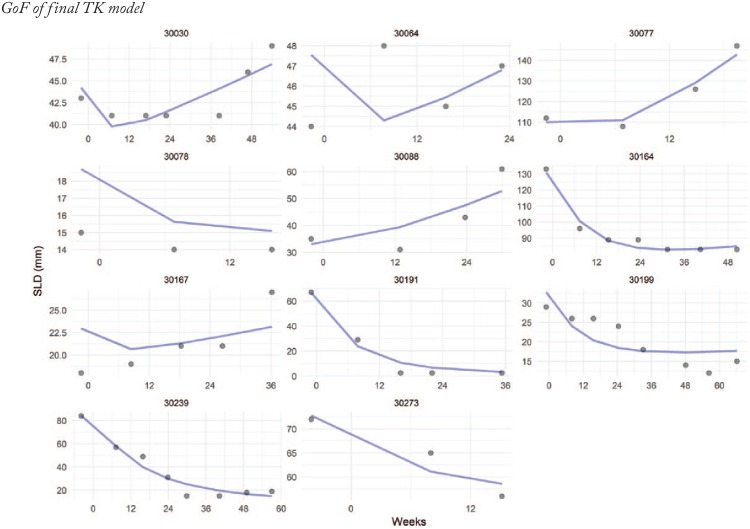
The major steps of the model-building process are listed in Appendix 1. An illustration of the fit to individual data is presented in Appendix 1 (Figures A1 and A2) for a random sample of patients as well as the diagnostic plots supporting the final model assessment (Figures A3 and A4). The predictive performance of the TK model showed that the distribution of simulated and observed data at baseline and week 8 were closely matching (Figure A5, Appendix 1).
Individual tumor size metrics estimates are summarized in Table 2. Most of the patients experienced reduction in tumor size with a trend to a more profound shrinkage (mean equal to −22% vs −5.8%) over a longer period of time (mean equal to 17.5 vs 4.3 weeks) in CT + B compared with CT treated patients. The histogram of is provided in Figure A6, Appendix 1.
Table 2.
Tumor kinetics metrics per treatment group.
| CT (n=140) | B + CT (n=134) | |
|---|---|---|
| a (%), median [Q1, Q3] | −5.0 [–1.3, –21.0] | −17.9 [–9.5, –30.2] |
| b (%), median [Q1, Q3] | −5.8 [–3.1, –26.7] | −22.0 [–9.9, –50.6] |
| c (weeks), median [Q1, Q3] | 4.3 [2.5, 19.2] | 17.5 [8.4, 40.9] |
Abbreviations: B, bevacizumab; CT, chemotherapy; TTG, time to (re-)growth; SLD, sum of longest diameters.
: model-predicted percentage change between predicted baseline SLD value and predicted SLD value at week 8.
: model-predicted percentage change between predicted baseline SLD value and predicted minimum SLD value on treatment.
: time to reach the predicted minimum SLD value on treatment.
Survival model
Out of the 275 patients retained to develop the TK model, 3 had missing SLD measures during the treatment period leading to retain only 272 patients in the OS analysis with 139 (51.1%) on the CT arm and 133 (48.9%) in the B + CT arm.
In the bootstrap-based covariate analysis of the Cox model (see Table A2 in Appendix 2, for more details), 2 sets of factors were found to be influential (Table 3) on time to death (or censoring): those describing the type and severity of disease (histology, presence of ascites, FIGO stage, ECOG stage) and those summarizing the tumor size dynamics (). Negative values were associated with a prolongation of survival time compared with the reference (and vice versa).
Table 3.
Parameter estimates () of the final overall survival model.
| ECOG = 1, 2, 3 (ref. = 0) | 1.01 | [0.99, 1.02] |
| Serous = Yes (ref. = no) | 0.77 | [0.55, 1.06] |
| Presence of ascites (ref. = absence) | 2.36 | [1.71, 3.27] |
| FIGO stage | ||
| I | 1.28 | [0.28, 5.76] |
| II | 0.77 | [0.14, 4.28] |
| III | 1.72 | [0.42, 7.11] |
| IV | 2.98 | [0.71, 12.6] |
| a (mm) | 1.38 | [1.13, 1.68] |
| b (ref. = 0) | 1.03 | [1.02, 1.04] |
Abbreviations: CI, confidence interval; ECOG, Eastern Cooperative Oncology Group; FIGO, Féderation Internationale de Gynécologie et d’Obstétrique; SLD, sum of longest diameters.
: model-predicted SLD value at time of treatment onset.
: model-predicted early tumor shrinkage (%) at week 8.
Histology grade, line of therapy, baseline CA-125, time from diagnosis, age, and treatment group were not retained in the model after adjusting for the other effects.
The -index plot (Figure 1) shows that ECOG score and serous vs non-serous subtypes have low contribution to the risk discrimination power on OS. Similar results were obtained with the integrated-Brier score showing sequential reduction from 0.162 for model 1 to 0.155, 0.145, and 0.139 for models 2, 3, and 4, 5, 6, while model 7 (titled “Treatment group” in Figure 1) was associated with a larger value (hence poorer performance) of 0.172.
Figure 1.
Concordance index (overall c-index) obtained with different OS models.
Using a reduced model involving only ascites, FIGO stage, , and , and fixing, for illustration, at 70 mm and FIGO stage at stage III, we show how various levels of reduction on tumor size at week 8 affect the survival time in patients with PROC in absence of ascites (Figure 2).
Figure 2.
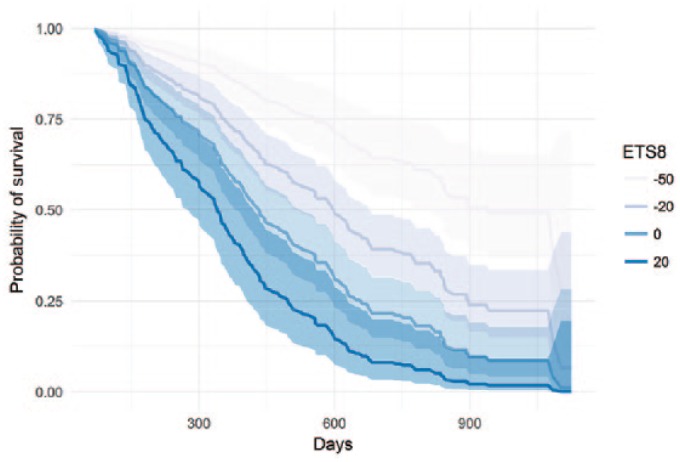
Predicted probability of survival for various levels of (%) in absence of ascites.
Shaded areas correspond to the parametric 95% confidence interval around the mean probability.
Discussion
Tumor angiogenesis plays a pivotal role in the growth and metastasis of ovarian cancer because of the unique pattern of early dissemination of free-floating cells that form tumor implants in the peritoneal cavity. In this analysis, the time course of tumor size was studied for patients with PROC treated with chemotherapy with or without bevacizumab, a potent anti-angiogenesis agent.
The TK modeling demonstrated that bevacizumab brought a deeper anti-tumor response, with a median value for the (absolute) maximum shrinkage of 22% in the combination arm compared with 6% in the CT arm, and also prolonged the shrinkage as illustrated by a time to growth extending from 4 weeks in the CT arm to more than 17 weeks in the combination arm.
However, the observed benefits of B on TK did not translate into significant OS benefit (HR = 0.85 [0.66, 1.08] in favor of B + CT2).
Several reasons can explain the disconnection between TK and OS. OS represents death events from any causes and not only due to disease progression; the variability observed in OS could not be explained solely by TK. In addition, the primary endpoint of the AURELIA study was PFS and the study was not powered to detect differences in OS. A recent meta-analysis of 5 large phase III trials in recurrent OC actually concluded at a benefit of B + CT compared with CT alone.23
An important covariate influencing OS was the presence or absence of ascites at baseline, a well-known prognostic factor. This finding echoes the results of the analysis run by the NRG Oncology/GOG study24 and emphasizes the complex cause of ovarian cancers. Although other baseline covariates were considered to be tested in the Cox regression, CA-125 was not. Indeed, CA-125 has been considered as a potential surrogate endpoint across all subpopulation of OC. However, in a recent study, neither disease progression by CA-125 nor baseline CA-125 was found to be predictive of disease progression in patients with PROC showing the limitations of CA-125.25
To relate TK to survival, we assumed that any drug effect on tumor burden would translate, or at least correlate with, a change in the risk of death. Because these 2 endpoints are correlated, including post treatment TK in a time-to-event model would have led to biased results. To circumvent this issue, we used a landmark approach,26 and evaluated the correlation between early tumor shrinkage at week 8 and OS among patients who had survived at least 8 weeks after treatment initiation. Choosing a landmark is also associated with a loss of power due to the reduced sample size as compared with analyzing the full analysis set.27 However, the risk for erroneous conclusions was considered low in our case due to the relatively large number of subjects with data available for our analysis. An alternative approach would have been to develop a joint model of tumor size dynamics and OS. Although joint models involving a longitudinal linear sub-model to describe the biomarker time dynamics have been applied multiple times in oncology, the methodology to deal with longitudinal non-linear sub-models (like the one describing TK) is in its infancy.28
Overall survival remains the most clinically meaningful endpoint in oncology and the US Food and Drug Administration (FDA) gold standard for drug approval. The identification of early markers or assessments that can inform the likelihood of an OS advantage being achieved is crucial. As the opposite of baseline covariates (FIGO stage, presence of ascites, ECOG), offers the advantage to be an early predictive marker that not only correlates to OS but also informs on the potential benefits of the studied drug.
A similar but more comprehensive model-based approach was recently proposed by Zecchin et al16 to assess the effect of carboplatin monotherapy or in combination with gemcitabine in patients with PROC. In their final OS model, both target lesion size and appearance of new lesions were significant covariates in addition to the observed baseline SLD and ECOG status at enrolment. The AURELIA trial was evaluated using RECIST1.0 that did not account for the appearance of new lesions. Therefore, new lesion could not be considered for inclusion in our survival analysis.
In conclusion, this is the first analysis establishing that early tumor shrinkage is predictive of OS in patients with PROC. This modeling framework could effectively help to simulate and optimize future trials in PROC population.
Acknowledgments
The authors thank participants and investigators of the AURELIA study.
Appendix 1
Additional details on tumor kinetic models development.
Model building steps
| Model number | Description | AIC | Successful estimation of standard errors |
|---|---|---|---|
| Model 1 | Stein Model29 | 8551 | Y |
| Model 2 | Wang Model14 | 8935 | Y |
| Model 3 | Claret Model30 | 8545 | Y |
| Model 4 | Model 3 + Arm as binary covariate (B + CT vs CT) on | 8529 | Y |
| Model 5 | Model 3 + Arm as binary covariate (B + CT vs CT) on . | 8534 | Y |
| Model 6 | Model 3 + Arm as binary covariate (B + CT vs CT) on and | 8536 | Y |
| Model 7 | Model 3 + Each treatment as binary covariate (B + paclitaxel, B + PLD, B + topotecan, paclitaxel, PLD, topotecan) on . | 8517 | Y |
| Model 8 | Model 3 + Each treatment as binary covariate (B + paclitaxel, B + PLD, B + topotecan, paclitaxel, PLD, topotecan) on | 8513 | Y |
| Model 9 | Model 3 + Each treatment as binary covariate (B + paclitaxel, B + PLD, B + topotecan, paclitaxel, PLD, topotecan) on and | 8487 | N |
Model 9 was not retained because of the unsuccessful estimation of standard errors reflecting model over-parametrization.
Abbreviations: AIC, Akaike information criteria; B, bevacizumab; CT, chemotherapy; PLD, pegylated liposomal doxorubicin.
Table A1.
TK model parameter estimates.
| Parameter | Group | Estimate (RSEa %) |
%IIVb
(RSEa%) |
Shrink.c
(%) |
Median bootstrap valuesd
[90% confidence interval] |
|---|---|---|---|---|---|
| SLD increase rate, day−1 () | 4.98 × 10⁻⁴ (25) | 138.5 (10) | 38.4 | 4.8 × 10⁻⁴ [2.6 × 10⁻⁴, 8 × 10⁻⁴] | |
| SLD decrease rate, day−1 () | 6.98 × 10⁻³ (18) | 85.6 (11) | 41.8 | 7.12 × 10⁻³ [5.1 × 10⁻³, 1.0 × 10⁻²] | |
| Baseline, mm () | 55.5 (5) | 82.8 (4) | 6.0 | 55.4 [50.68, 60.23] | |
| Resistance rate, day−1 () | Paclitaxel + B | 3.87 × 10⁻² (45) | 149.6 (13) | 42.9 | 4.6 × 10⁻² [2.2 × 10⁻², 2.23 × 10⁻¹] |
| PLD + B | 7.25 × 10⁻³ (32) | 7.62 × 10⁻³ [3.81 × 10⁻³, 1.31 × 10⁻²] | |||
| Topotecan + B | 3.28 × 10⁻² (38) | 3.74 × 10⁻² [1.7 × 10⁻², 9.5 × 10⁻²] | |||
| Paclitaxel | 7.99 × 10⁻² (40) | 9.06 × 10⁻² [3.5 × 10⁻², 2.5 × 10⁻¹] | |||
| PLD | 2.48 × 10⁻² (32) | 2.56 × 10⁻² [1.4 × 10⁻², 4.4 × 10⁻²] | |||
| Topotecan | 1.30 × 10⁻¹ (59) | 1.62 × 10⁻¹ [6.0 × 10⁻², 8.0 × 10⁻¹] | |||
| Residual error, mm | 8.41 (8) | NA | 26.3 | 8.42 [7.11, 9.78] |
Model parameter estimates and their respective 90% confidence intervals generated by bootstrapping are presented in Table A1. Median bootstrap values were close to the values estimated from the original dataset indicating a small bias. Parameters were estimated with adequate precision and low shrinkage.
RSE: relative standard error.
%IIV: inter-individual variability expressed as % coefficient of variation.
Shrink.: parameter estimate shrinkage.
10% trimmed median derived from 100 bootstrap replicates.
GoF of final TK model
Figure A1.
Goodness-of-fit of the final model to the SLD values for a random sample of 9 patients from the AURELIA study. The curve depicts the model predicted SLD over time. The dots are the observations. SLD indicates sum of longest diameters.
Figure A2.
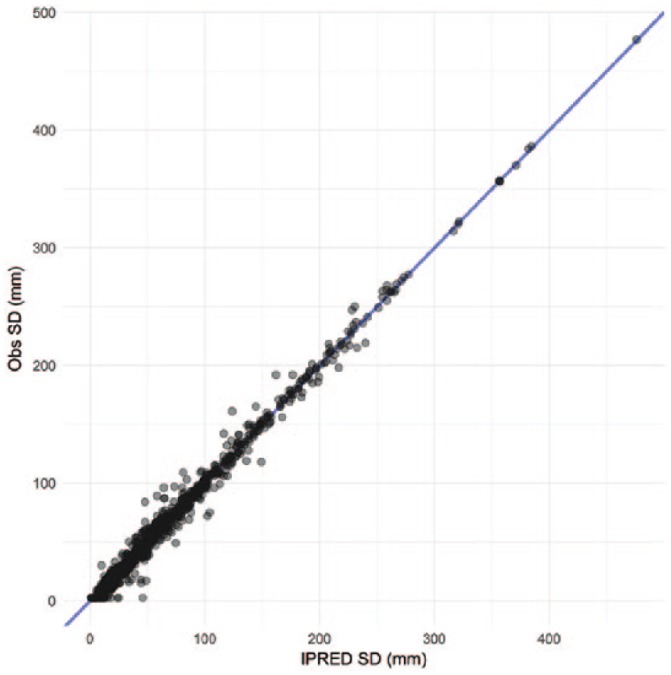
Goodness-of-fit of the final model to the SD values: observations vs individual model predicted SLD. SLD indicates sum of longest diameters.
The assumption of normality of the observations made using the maximum likelihood approach implemented in the FOCE method was tested by inspecting the quantile-quantile plots of the conditional weighted residuals (CWRES) against theoretical standard normal quantiles (Figures A3 and A4).
Figure A3 confirms that the assumption of normality of the observations made during estimation is verified. Figure A4 shows no model misspecification.
Figure A3.
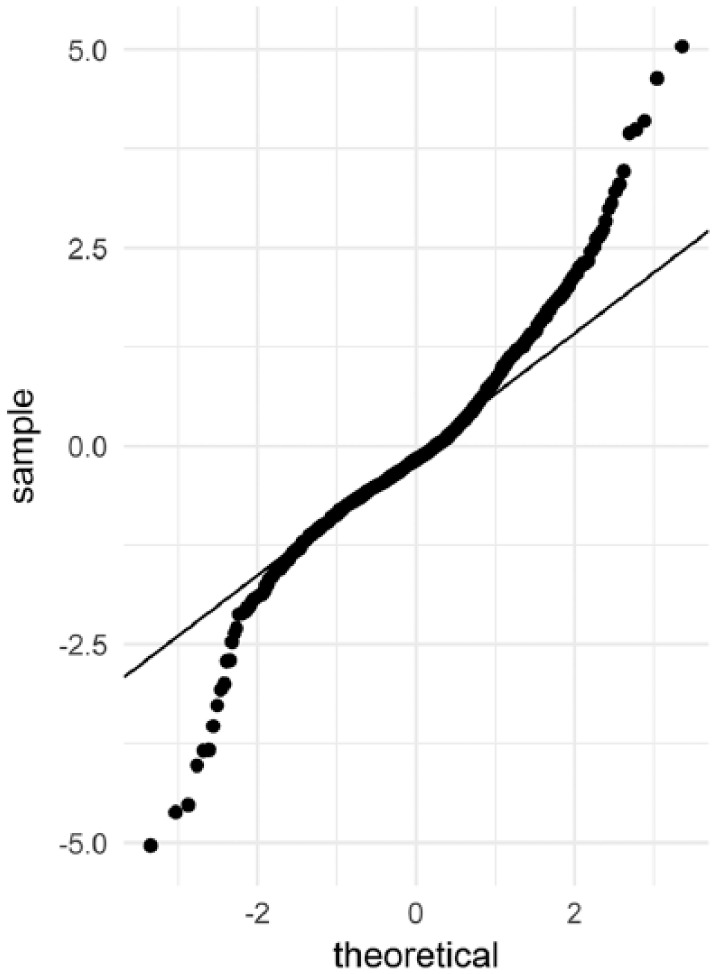
Goodness-of-fit of the final model to the SD values: Q-Q plot of CWRES.
Figure A4.
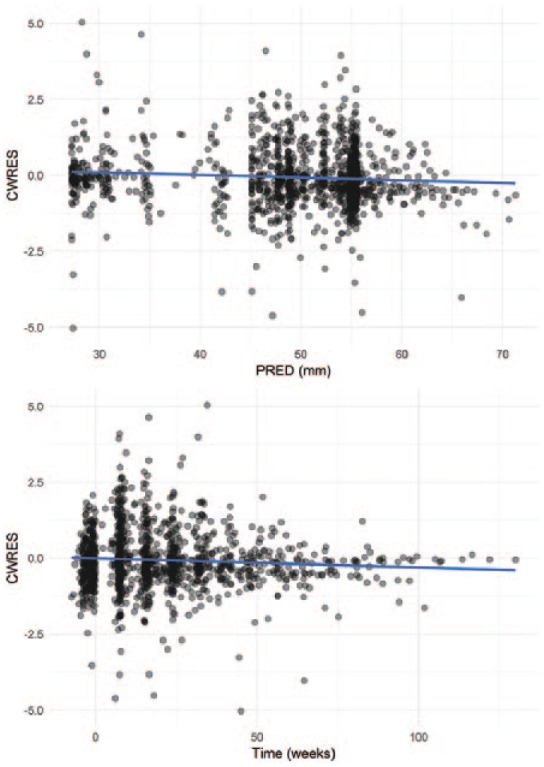
Goodness-of-fit of the final model to the SD values: CWRES.
Figure A5.
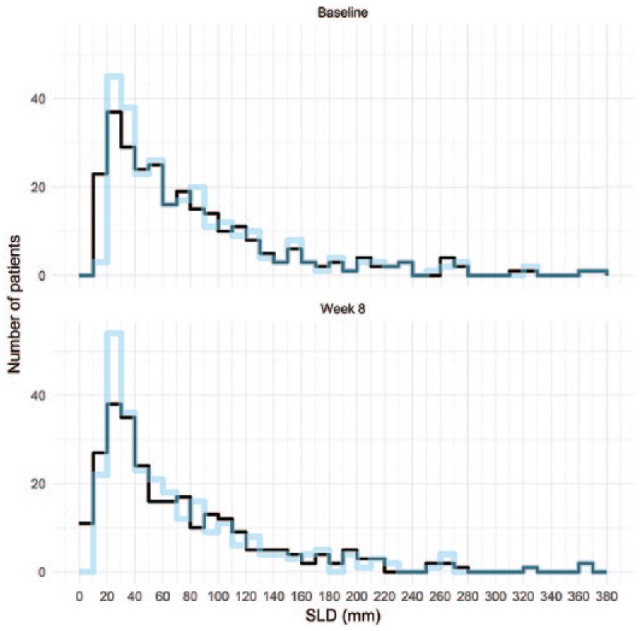
Distributions of observed vs predicted SLD values obtained from the “baseline” scan and from the first scan on treatment (at week 8).
The predictive performance of the TK model (evaluated using the visual predictive check) was considered adequate as the distribution of simulated and observed data at baseline and week 8 were closely matching (Figure A5).
Figure A6.
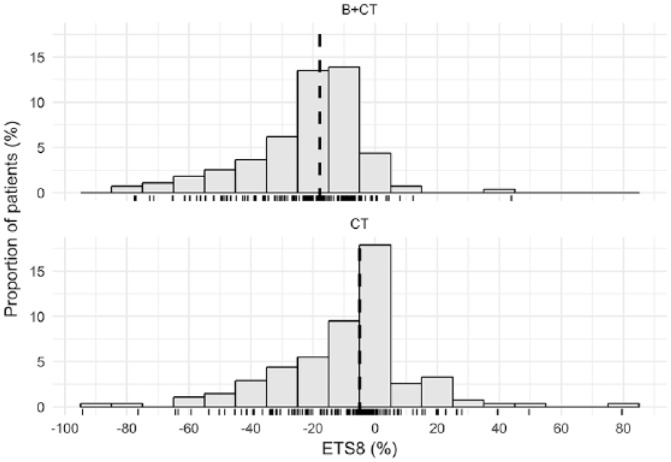
Histogram of ETS8.
Appendix 2
Table A2.1.
Boostrap-based covariate analysis.
| > cox<-coxph(Surv(OS, OSC==0)~as.factor(TRTC)+as.factor(BECOG)+as.factor(HGRAD)+ as.factor(SEROUS)+as.factor(LTHER)+as.factor(ASCITES)+ as.factor(FIGO1)+as.factor(FIGO2)+as.factor(FIGO3)+as.factor(FIGO4)+ cAGE+as.factor(cDIAG)+BLCA125+ logPREDBASE+ETS8, landf2) > set.seed(1447) > library(bootStepAIC, lib.loc="C:\\MyR\\MyLibs") > bootStepAIC::boot.stepAIC(cox, df, direction="both", alpha=0.001) > detach("package:bootStepAIC", unload=TRUE) > bootStepAIC::boot.stepAIC(cox, df, direction="both", alpha=0.001) the model fit failed in 15 bootstrap samples Summary of Bootstrapping the ‘stepAIC()’ procedure for Call: coxph(formula = Surv(OS, OSC == 0) ~ as.factor(TRTC) + as.factor(BECOG) + as.factor(HGRAD) + as.factor(SEROUS) + as.factor(LTHER) + as.factor(ASCITES) + as.factor(FIGO1) + as.factor(FIGO2) + as.factor(FIGO3) + as.factor(FIGO4) + cAGE + as.factor(cDIAG) + BLCA125 + logPREDBASE + ETS8, data = landf2) Bootstrap samples: 85 Direction: both Penalty: 2 * df | ||||||
| Covariates selected | ||||||
| (%) | ||||||
| as.factor(ASCITES) ETS8logPREDBASEas.factor(BECOG)as.factor(FIGO4)as.factor(FIGO2)as.factor(FIGO3)as.factor(SEROUS)as.factor(FIGO1)as.factor(TRTC)as.factor(HGRAD)as.factor(LTHER)as.factor(cDIAG)cAGEBLCA125 | 100.00100.00100.0092.9472.9455.2954.1250.5949.4130.5929.4128.2424.7118.828.24 | |||||
| Coefficients Sign | ||||||
| + (%) | - (%) | |||||
| as.factor(ASCITES)1as.factor(BECOG)1as.factor(BECOG)99as.factor(FIGO4)1ETS8logPREDBASEas.factor(LTHER)2as.factor(HGRAD)1cAGEas.factor(FIGO3)1as.factor(FIGO1)1BLCA125as.factor(TRTC)CT+BVas.factor(cDIAG)1as.factor(FIGO2)1as.factor(SEROUS)1 | 100.00100.00100.00100.00100.0098.8295.8384.0081.2550.0045.2428.5715.389.528.510.00 | 0.000.000.000.000.001.184.1716.0018.7550.0054.7671.4384.6290.4891.49100.00 | ||||
| Stat Significance | ||||||
| (%) | ||||||
| as.factor(ASCITES)1ETS8as.factor(BECOG)1as.factor(FIGO4)1as.factor(FIGO3)1logPREDBASEas.factor(SEROUS)1as.factor(FIGO2)1as.factor(HGRAD)1as.factor(cDIAG)1as.factor(FIGO1)1as.factor(LTHER)2as.factor(TRTC)CT+BVas.factor(BECOG)99BLCA125cAGE | 96.4783.5360.7651.6132.6131.7613.9512.778.004.764.764.173.851.540.000.00 | |||||
| The stepAIC() for the original data-set gave Call: coxph(formula = Surv(OS, OSC == 0) ~ as.factor(BECOG) + as.factor(SEROUS) + as.factor(ASCITES) + as.factor(FIGO2) + as.factor(FIGO4) + logPREDBASE + ETS8, data = landf2) | ||||||
| coef | exp(coef) | se(coef) | z | p | ||
| as.factor(BECOG)1as.factor(SEROUS)1as.factor(ASCITES)1as.factor(FIGO2)1as.factor(FIGO4)1logPREDBASEETS8 | 0.51782-0.236560.79617-0.805680.557780.268280.02279 | 1.678360.789342.217030.446791.746801.307721.02305 | 0.152230.160490.164690.510750.165190.097060.00447 | 3.40-1.474.83-1.583.382.765.10 | 0.000670.140501.3e-060.114690.000730.005713.3e-07 | |
| Likelihood ratio test=105 on 7 df, p=0 n= 270, number of events= 195 (77 observations deleted due to missingness) Stepwise Model Path Analysis of Deviance Table Initial Model: Surv(OS, OSC == 0) ~ as.factor(TRTC) + as.factor(BECOG) + as.factor(HGRAD) + as.factor(SEROUS) + as.factor(LTHER) + as.factor(ASCITES) + as.factor(FIGO1) + as.factor(FIGO2) + as.factor(FIGO3) + as.factor(FIGO4) + cAGE + as.factor(cDIAG) + BLCA125 + logPREDBASE + ETS8 Final Model: Surv(OS, OSC == 0) ~ as.factor(BECOG) + as.factor(SEROUS) + as.factor(ASCITES) + as.factor(FIGO2) + as.factor(FIGO4) + logPREDBASE + ETS8 | ||||||
| Step | Df | Deviance Resid. | Df | Resid. Dev | AIC | |
| 12 - BLCA1253 - as.factor(FIGO1)4 - as.factor(TRTC)5 - cAGE6 - as.factor(HGRAD)7 - as.factor(FIGO3)8 - as.factor(cDIAG)9 - as.factor(LTHER) | 11111111 | 0.025598670.028463040.118636960.195748180.259081380.509174550.818393840.35617270 | 255256257258259260261262263 | 1813.6331813.6581813.6871813.8051814.0011814.2601814.7691815.5881815.944 | 1843.6331841.6581839.6871837.8051836.0011834.2601832.7691831.5881829.944 | |
| There were 50 or more warnings (use warnings[] to see the first 50) | ||||||
Footnotes
Funding:The author(s) disclosed receipt of the following financial support for the research, authorship, and/or publication of this article: The AURELIA trial was sponsored by F. Hoffmann-La Roche.
Declaration Of Conflicting Interests:The author(s) declared following potential conflicts of interest with respect to the research, authorship, and/or publication of this article: Alexandre Sostelly and François Mercier were employed by F. Hofmann-La Roche Ltd.
Author Contributions: Both authors contributed to the conception of the work, participated in the analysis and interpretation of data, performed a critical review of its content, and approved the final manuscript.
ORCID iDs: Alexandre Sostelly  https://orcid.org/0000-0002-7300-979X
François Mercier  https://orcid.org/0000-0002-5685-1408
References
- 1. Jemal A, Bray F, Center MM, Ferlay J, Ward E, Forman D. Global cancer statistics. CA Cancer J Clin. 2011;61:69–90. [DOI] [PubMed] [Google Scholar]
- 2. Pujade-Lauraine E, Hilpert F, Weber B, et al. Bevacizumab combined with chemotherapy for platinum-resistant recurrent ovarian cancer: the AURELIA open-label randomized phase III trial. J Clin Oncol. 2014;32:1302–1308. [DOI] [PubMed] [Google Scholar]
- 3. Fleming TR, Rothmann MD, Lu HL. Issues in using progression-free survival when evaluating oncology products. J Clin Oncol. 2009;27:2874–2880. [DOI] [PMC free article] [PubMed] [Google Scholar]
- 4. Villaruz LC, Socinski MA. The clinical viewpoint: definitions, limitations of RECIST, practical considerations of measurement. Clin Cancer Res. 2013;19:2629–2636. [DOI] [PMC free article] [PubMed] [Google Scholar]
- 5. Sridhara R, Mandrekar SJ, Dodd LE. Missing data and measurement variability in assessing progression-free survival endpoint in randomized clinical trials. Clin Cancer Res. 2013;19:2613–2620. [DOI] [PubMed] [Google Scholar]
- 6. Campigotto F, Weller E. Impact of informative censoring on the Kaplan-Meier estimate of progression-free survival in phase II clinical trials. J Clin Oncol. 2014;32:3068–3074. [DOI] [PMC free article] [PubMed] [Google Scholar]
- 7. Zeng L, Cook RJ, Wen L, Boruvka A. Bias in progression-free survival analysis due to intermittent assessment of progression. Stat Med. 2015;34:3181–3193. [DOI] [PMC free article] [PubMed] [Google Scholar]
- 8. Tate Thigpen J. Contemporary phase III clinical trial endpoints in advanced ovarian cancer: assessing the pros and cons of objective response rate, progression-free survival, and overall survival. Gynecol Oncol. 2015;136:121–129. [DOI] [PubMed] [Google Scholar]
- 9. Blumenthal GM, Pazdur R. Response rate as an approval end point in oncology: back to the future. JAMA Oncol. 2016;2:780–781. [DOI] [PubMed] [Google Scholar]
- 10. Claret L, Girard P, Hoff PM, et al. Model-based prediction of phase III overall survival in colorectal cancer on the basis of phase II tumor dynamics. J Clin Oncol. 2009;27:4103–4108. [DOI] [PubMed] [Google Scholar]
- 11. Hansson EK, Ma G, Amantea MA, et al. PKPD modeling of predictors for adverse effects and overall survival in sunitinib-treated patients with GIST. CPT Pharmacometrics Syst Pharmacol. 2013;2:e85. [DOI] [PMC free article] [PubMed] [Google Scholar]
- 12. Maitland ML, Wu K, Sharma MR, et al. Estimation of renal cell carcinoma treatment effects from disease progression modeling. Clin Pharmacol Ther. 2013;93:345–351. [DOI] [PMC free article] [PubMed] [Google Scholar]
- 13. Claret L, Mercier F, Houk BE, Milligan PA, Bruno R. Modeling and simulations relating overall survival to tumor growth inhibition in renal cell carcinoma patients. Cancer Chemother Pharmacol. 2015;76:567–573. [DOI] [PubMed] [Google Scholar]
- 14. Wang Y, Sung C, Dartois C, et al. Elucidation of relationship between tumor size and survival in non-small-cell lung cancer patients can aid early decision making in clinical drug development. Clin Pharmacol Ther. 2009;86:167–174. [DOI] [PubMed] [Google Scholar]
- 15. Bruno R, Mercier F, Claret L. Evaluation of tumor size response metrics to predict survival in oncology clinical trials. Clin Pharmacol Ther. 2014;95:386–393. [DOI] [PubMed] [Google Scholar]
- 16. Zecchin C, Gueorguieva I, Enas NH, Friberg LE. Models for change in tumour size, appearance of new lesions and survival probability in patients with advanced epithelial ovarian cancer. Br J Clin Pharmacol. 2016;82:717–727. [DOI] [PMC free article] [PubMed] [Google Scholar]
- 17. Claret L, Gupta M, Han K, et al. Evaluation of tumor-size response metrics to predict overall survival in Western and Chinese patients with first-line metastatic colorectal cancer. J Clin Oncol. 2013;31:2110–2114. [DOI] [PubMed] [Google Scholar]
- 18. Venables WN, Ripley BD. Modern Applied Statistics With S. 4th ed. New York, NY: Springer; 2002. [Google Scholar]
- 19. Austin PC, Tu JC. Bootstrap methods for developing predictive models. Am Stat. 2004;58:131–137. [Google Scholar]
- 20. Harrell FE, Jr, Lee KL, Mark DB. Multivariable prognostic models: issues in developing models, evaluating assumptions and adequacy, and measuring and reducing errors. Stat Med. 1996;15:361–387. [DOI] [PubMed] [Google Scholar]
- 21. Mogensen UB, Ishwaran H, Gerds TA. Evaluating random forests for survival analysis using prediction error curves. J Stat Softw. 2012;50:1–23. [DOI] [PMC free article] [PubMed] [Google Scholar]
- 22. Husain A, Wang Y, Hanker LC, et al. Independent radiologic review of AURELIA, a phase 3 trial of bevacizumab plus chemotherapy for platinum-resistant recurrent ovarian cancer. Gynecol Oncol. 2016;142:465–470. [DOI] [PubMed] [Google Scholar]
- 23. Wu YS, Shui L, Shen D, Chen X. Bevacizumab combined with chemotherapy for ovarian cancer: an updated systematic review and meta-analysis of randomized controlled trials. Oncotarget. 2017;8:10703–10713. [DOI] [PMC free article] [PubMed] [Google Scholar]
- 24. Ferriss JS, Java JJ, Bookman MA, et al. Ascites predicts treatment benefit of bevacizumab in front-line therapy of advanced epithelial ovarian, fallopian tube and peritoneal cancers: an NRG Oncology/GOG study. Gynecol Oncol. 2015;139:17–22. [DOI] [PMC free article] [PubMed] [Google Scholar]
- 25. Lindemann K, Kristensen G, Mirza MR, et al. Poor concordance between CA-125 and RECIST at the time of disease progression in patients with platinum-resistant ovarian cancer: analysis of the AURELIA trial. Ann Oncol. 2016;27:1505–1510. [DOI] [PubMed] [Google Scholar]
- 26. Anderson JR, Cain KC, Gelber RD. Analysis of survival by tumor response. J Clin Oncol. 1983;1:710–719. [DOI] [PubMed] [Google Scholar]
- 27. Dafni U. Landmark analysis at the 25-year landmark point. Circ Cardiovasc Qual Outcomes. 2011;4:363–371. [DOI] [PubMed] [Google Scholar]
- 28. Desmee S, Mentre F, Veyrat-Follet C, Guedj J. Nonlinear mixed-effect models for prostate-specific antigen kinetics and link with survival in the context of metastatic prostate cancer: a comparison by simulation of two-stage and joint approaches. AAPS J. 2015;17:691–699. [DOI] [PMC free article] [PubMed] [Google Scholar]
- 29. Stein WD, Gulley JL, Schlom J, et al. Tumor regression and growth rates determined in five intramural NCI prostate cancer trials: the growth rate constant as an indicator of therapeutic efficacy. Clin Cancer Res. 2011;17:907–917. [DOI] [PMC free article] [PubMed] [Google Scholar]
- 30. Claret L, Gupta M, Han K, et al. Evaluation of tumor-size response metrics to predict overall survival in western and Chinese patients with first-line metastatic colorectal cancer. J Clin Oncol. 2013;31:2110–2114. [DOI] [PubMed] [Google Scholar]


