Abstract
A stable latent reservoir for HIV-1 in resting CD4+ T-cells precludes cure1–3. Curative strategies targeting the reservoir are being tested4,5 and require accurate, scalable reservoir assays. The reservoir was defined with quantitative viral outgrowth assays (QVOAs) for cells releasing infectious virus following one round of T-cell activation1. However, QVOAs and newer assays for cells producing viral RNA after activation6 may underestimate reservoir size because one round of activation does not induce all proviruses7. Many studies rely on simple PCR-based assays to detect proviral DNA regardless of transcriptional status, but the clinical relevance of these assays is unclear, as the vast majority proviruses are defective7–9. We describe a novel approach that separately quantifies intact and defective proviruses and show that the dynamics of cells carrying intact and defective proviruses are different in vitro and in vivo, a finding with implications for targeting the intact proviruses that are a barrier to cure.
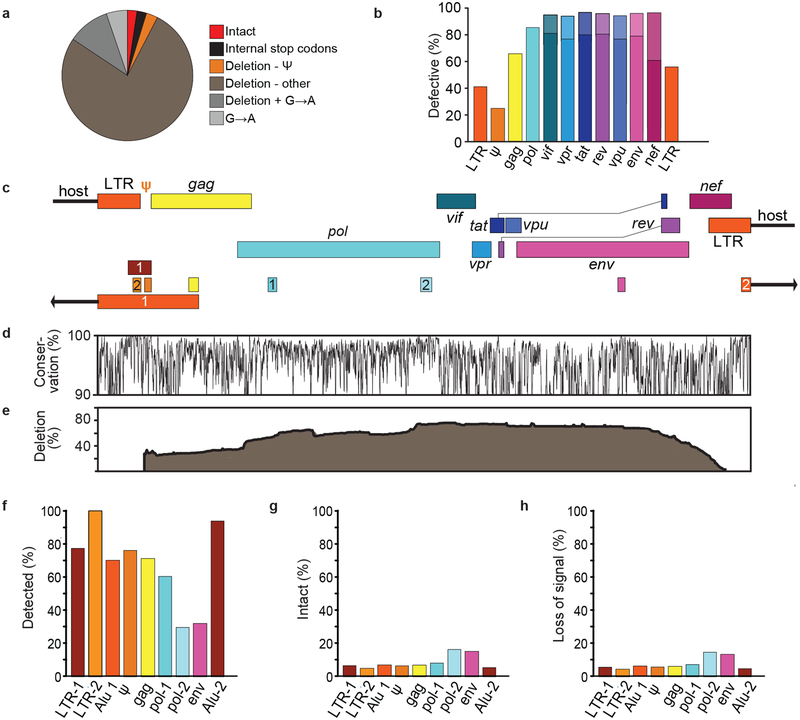
Evaluation of cure strategies requires assays that detect infected cells and distinguish intact proviruses from the vast excess of defective proviruses. We define intact proviruses as those lacking overt fatal defects such as large deletions and hypermutation7,8, recognizing that some proviruses so defined may have minor defects affecting fitness. We analyzed 431 near full genome HIV-1 sequences obtained by single genome analysis8,9 from 28 HIV-1-infected adults. The near full genome sequencing (nFGS) methods used identify defects throughout the genome except the 5′ LTR. Consistent with previous reports8,9, only 2.4% of proviruses were intact (Fig. 1a). The remaining 97.6% had fatal defects including deletions, encompassing on average 49.6% of the genome, and/or G→A hypermutation, which altered start codons and/or introduced stop codons in most ORFs8. Most defective proviruses had defects affecting most HIV-1 genes (Fig. 1b, Table S1). 97% of defective proviruses had defects affecting the transcriptional activator Tat (Fig. 1b, Table S1) and might not be efficiently transcribed after latency reversal. Thus, cure interventions dependent on viral gene expression4,5 may affect cells with intact and defective proviruses differently. Hence separate quantitation is essential.
Fig. 1.
DNA PCR assays predominantly measure defective proviruses. (a) Proviruses persisting in CD4+ T-cells of individuals on suppressive ART as detected by nFGS8,9. Defects include internal stop codons, deletions not attributable to normal length polymorphisms, and APOBEC3G/F-mediated hypermutation (G→A). Most deletions were large except for those in the packaging signal (ψ)/major splice donor site. Based on 211 sequences from individuals initiating ART during chronic infection. (b) Fraction of defective proviruses with defects in the indicated genes or elements. Protein-coding genes were considered defective if any of the following are present: mutated start codon, internal stop codons, frameshifts, or insertions or deletions not representing common length polymorphisms. Splice site mutations further increased the fraction of defective sequences (lighter shaded portions of the bars for spliced genes). LTR sequences were considered defective if mutations in the NFκB sites and/or deletions were present. See Table S1 for details. (c) Positions of amplicons used in standard DNA and Alu-PCR assays. See Table S2 for coordinates and references. Numbers distinguish distinct assays targeting the same region. Alu PCR assays also amplify host genomic sequence (arrows). (d) Conservation of sequence across the genome based on a US clade B sequences in the Los Alamos HIV Sequence Database (https://www.hiv.lanl.gov/). Plotted as % of sequences matching the consensus at each nucleotide. (e) Position of internal deletions across the HIV-1 genome. Plotted as % of total sequences from treated patients deleted at the indicated nucleotide. (f) Percent of all proviruses that are amplified by the indicated assay. Based on absence of overlap between deleted regions and the relevant amplicons. (g) Percent of the proviruses detected by the indicated assay that are intact. (h) Percent loss of assay signal following a selective 10-fold reduction in intact proviruses. For panels f-h, analysis is based 211 sequences from 19 patients starting ART during chronic infection.
Standard PCR assays use short subgenomic amplicons in conserved regions (Fig. 1c,d) and do not distinguish intact and defective proviruses. Deletions occur throughout the genome (Fig. 1e), affecting not only the fraction of proviruses detected (Fig. 1f) but also the fraction of detected proviruses that are intact (Fig. 1g). For most standard PCR assays, <10% of detected sequences are intact (Fig. 1g). Thus efficacy of a cure intervention causing a selective one log reduction in intact proviruses may be inapparent (Fig. 1h).
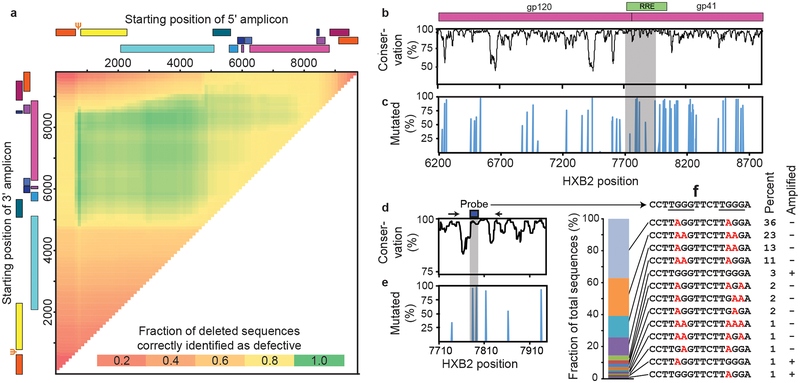
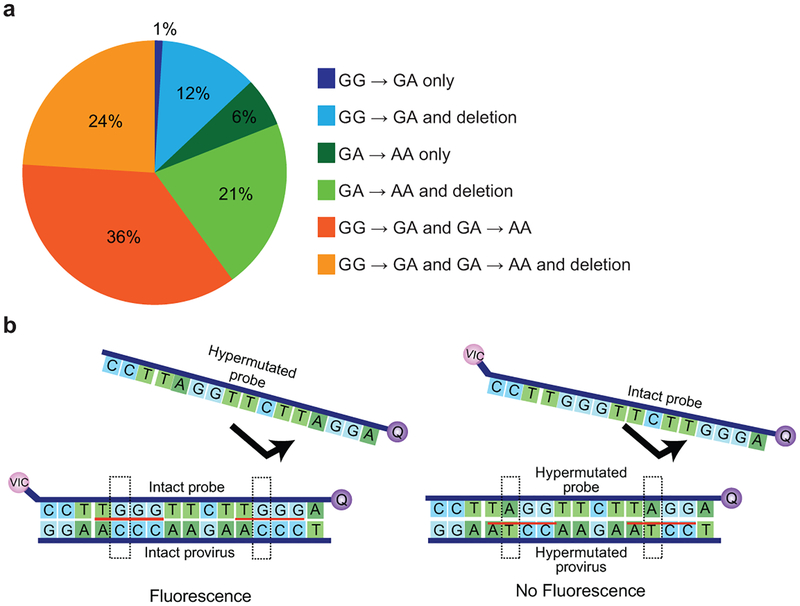
Interrogating individual proviruses simultaneously at multiple positions could differentiate intact from defective proviruses. Analysis of nFGS data revealed that strategically placed amplicons in the packaging signal (Ψ) and env regions could jointly identify >90% of deleted proviruses as defective (Fig. 2a). Hypermutated proviruses must also be identified (Fig. 1a). 73% of these have mutations in the GG→AG context (Extended Data Fig. 1a). Most also have GA→AA mutations. Only 27% of hypermutated proviruses had only GA→AA mutations, and most of these also had deletions (Extended Data Fig. 1a). Therefore, we focused on GG→AG hypermutation. We identified a conserved region in the Rev-response element (RRE) with adjacent consensus sites (TGGG) for responsible enzyme, APOBEC3G10 (Fig. 2b-e). Of sequences with GG→AG hypermutation, 97% had one or more mutations in this region (Fig. 2c,e), with 13 distinct patterns (Fig. 2f). Using mutant plasmids carrying each pattern, we developed allelic discrimination probes (Extended Data Fig.1b) that correctly identify 95% of hypermutated sequences as defective (Fig. 2f).
Fig. 2.
Distinguishing intact and defective HIV-1 proviruses. (a) Sliding window analysis of optimal amplicon positioning to detect deletions. Optimal discrimination between intact and deleted sequences is obtained with a 5′ amplicon in the Ψ region and a 3′ amplicon in env. Ψ is the site of frequent small deletions and is included in larger 5′ deletions. Based on 431 independent near full genome sequences in the database including 258 that contain mapped deletions. Inclusion of an additional 474 sequences from treated patients did not change optimal positions. (b) Nucleotide conservation across the env gene based on US clade B sequences in the Los Alamos HIV Sequence Database, is plotted as percent of sequences matching the consensus sequence at each nucleotide. Shaded area is expanded in Fig. 2d. (c) GG→AG hypermutation across the env gene. The percent of hypermutated proviruses that contain one or more G→A mutations within a given APOBEC3G consensus site is plotted as a function of site position. Shaded area is expanded in Fig. 2e. (d) Sequence conservation of a region in the RRE containing two APOBEC3G consensus sites. Primer (arrows) and probe (box) positions for the env amplicon are shown. (e) Fraction of hypermutated proviruses with G→A mutations in the probe binding region (shaded). (f) Hypermutation patterns at the env probe binding site. The prevalence of 13 observed patterns is indicated in the bar graph on the left and in the “Percent” column. Mutations in the APOBEC3G consensus sites (underlined) are indicated in red. Based 93 independent hypermutated env sequences from 18 treated patients. Site directed mutagenesis was used to modify NL4–3 or a patient-derived proviral construct to generate plasmids containing each pattern. The “Amplified” column indicates that only 5% of hypermutated sequences were amplified by the probe combinations developed to identify intact sequences.
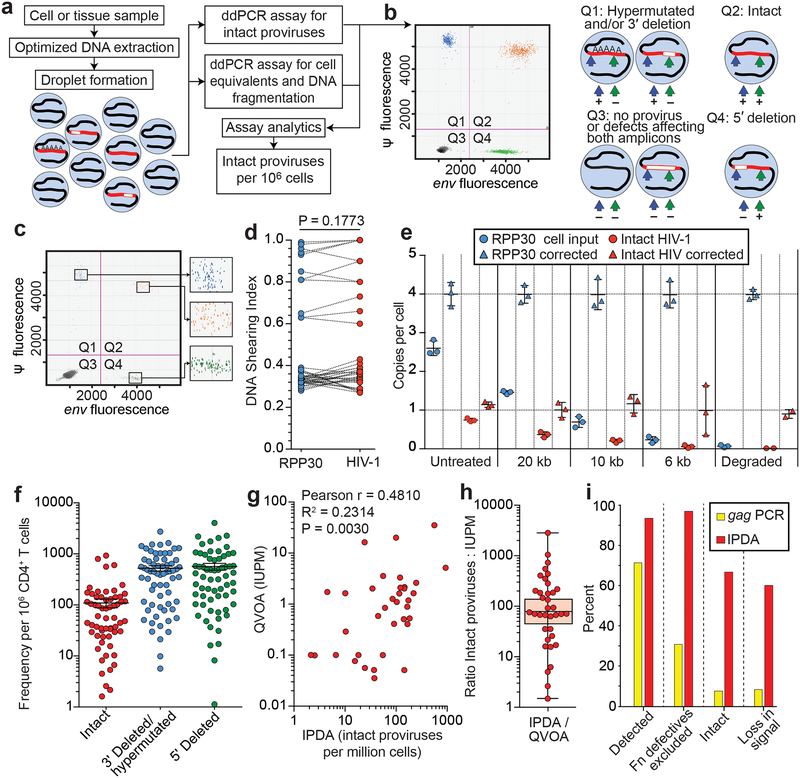
These analyses allowed design of a droplet digital PCR (ddPCR) that distinguishes most deleted and/or hypermutated proviruses from intact proviruses using two amplicons and hypermutation discrimination probes (Fig. 3a,b). Genomic DNA (gDNA) is isolated using an optimized method to minimize DNA shearing between targeted regions (see below) and partitioned into nanodroplets such that individual droplets rarely contain >1 provirus (P = 0.00416). Proviruses within droplets are analyzed simultaneously at the Ψ and env regions via multiplex PCR, with the env PCR also discriminating hypermutated proviruses. Intact proviruses give amplification at both regions (Fig. 3a,b). Intact proviruses/106 cells are calculated using separate amplification of a cellular gene (RPP30) after correction for DNA shearing.
Fig. 3.
Intact proviral DNA assay (IPDA). (a) Assay schematic. Multiplex PCRs in droplets amplify Ψ and env regions. A separate multiplex PCR targets two regions of the human RPP30 gene spaced at the same distance as the Ψ and env amplicons to provide cell number quantitation and DNA shearing correction. See Methods for details. (b) Representative control ddPCR experiment using proviral constructs25 with a 5’ deletion (E44E11), a 3’ deletion (4F11), or no defects (NL4–3). 1,000 copies each were mixed with 500 ng of HIV-1 negative DNA to simulate a patient sample. Types of proviruses appearing in different quadrants are shown on the right. (c) Representative IPDA results from a patient CD4+ T-cell sample. Boxed areas are expanded to show individual positive droplets. (d) DNA shearing index (DSI, fraction of templates sheared between targeted regions) measured for RPP30 and HIV-1 on JLat DNA samples subjected to different levels of shearing (n=22). Compared using two tailed t-test for paired non parametric values. (e) Use of DSI to correct raw ddPCR output for RPP30 and HIV. Mean and SD of copies/cell of RPP30 (blue) and HIV (orange) are shown before (circles) and after (triangles) correction for shearing. (f) IDPA results on CD4+ T-cells from infected individuals (n=62) with plasma HIV-1 RNA below the limit of detection. Bars indicate geometric mean ± SEM. See Table S3 for patient characteristics. Polymorphisms precluding amplification with either primer/probe set were not observed in this cohort and would require triage primer/probe sets incorporating rare polymorphisms. (g) Correlation between infected cell frequencies measured by QVOA and IPDA on the same samples of CD4+ T-cells from treated patients (n=36). IUPM, infectious units per million cells. (h) IPDA/QVOA ratios for samples from Fig. 3g. Horizintal bars indicate geometric mean and 95% CI. (i) Bioinformatic comparison of standard gag PCR and IPDA with respect to % of proviruses amplified, % of defective proviruses excluded, % of amplified proviruses that are intact, and % loss in assay signal following a selective 10-fold reduction in intact proviruses. See legend to Fig. 1f-h for details.
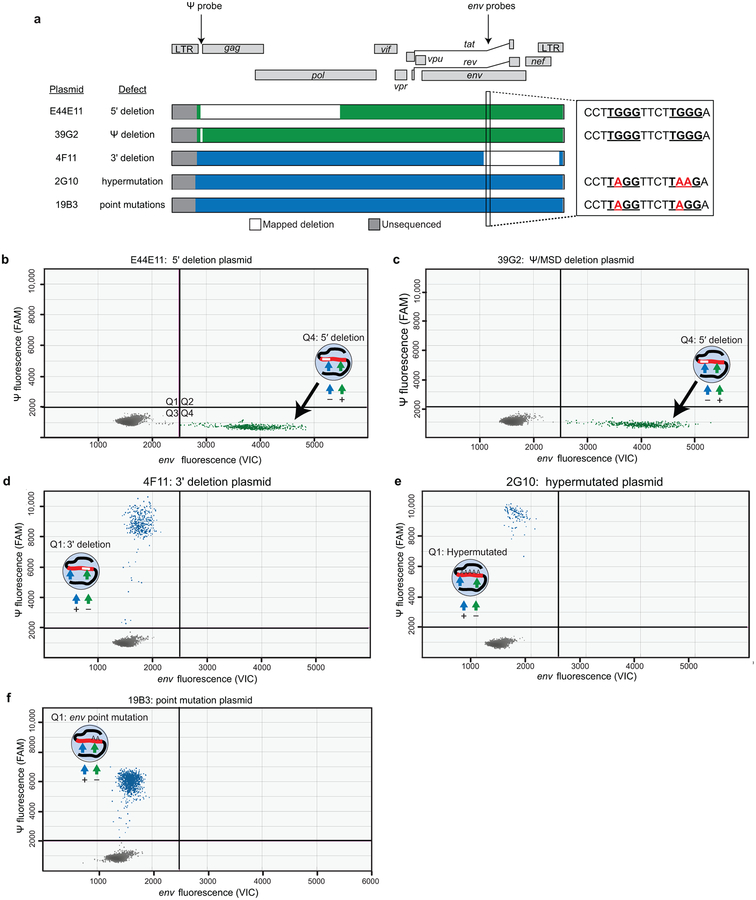
The ability of this intact proviral DNA assay (IPDA) to distinguish intact and defective proviruses was verified using plasmid controls representing proviruses with different defects. These templates gave positive droplets in the expected quadrants: Q1 for 3′ deletion and/or hypermutation and Q4 for 5′ deletion (Extended Data Fig. 2). Cultured clonal populations of infected patient cells also give single quadrant patterns (see below). In contrast, uncultured polyclonal patient CD4+ T-cell populations gave droplets in all four quadrants, allowing separate quantitation of intact and defective proviruses (Fig. 3c).
Validation of the IPDA is described in Extended Data Figs. 3 and 4. DNA shearing is essential for droplet formation but artificially reduces double positive (Q2) droplets while increasing Q1 and Q4 droplets. To control for shearing, two regions of a cellular gene (RPP30) with the same spacing as the Ψ and env amplicons are amplified in a separate multiplex ddPCR on each sample. This gives a DNA shearing index (DSI) to correct raw HIV-1 ddPCR results (see Methods). To validate this approach, DNA from JLat cells11, which contain a single provirus, was subjected to different amounts of shearing and analyzed by ddPCR for HIV-1 and RPP30. At all levels of shearing, DSI was similar for HIV-1 and RPP30. Thus RPP30 shearing can be used to correct for HIV-1 shearing (Fig. 3d). At all levels of shearing, corrected results were close to the expected values of 1 copy/cell for HIV-1 (Fig. 3e) and 4 copies/cell for RPP30 (JLat cells are tetraploid for RPP30). With correction for shearing, the IPDA gives highly accurate discrimination between molecularly defined standards representing intact and defective proviruses (Extended Data Fig. 5). In acute in vitro infections, high molecular weight DNA from productively infected CD4+ T-cells showed a substantial fraction of intact proviruses as assessed by IPDA and confirmed by nFGS (Extended Data Fig. 6). Thus, the assay can reliably quantitate intact proviruses in most DNA samples after correction for shearing.
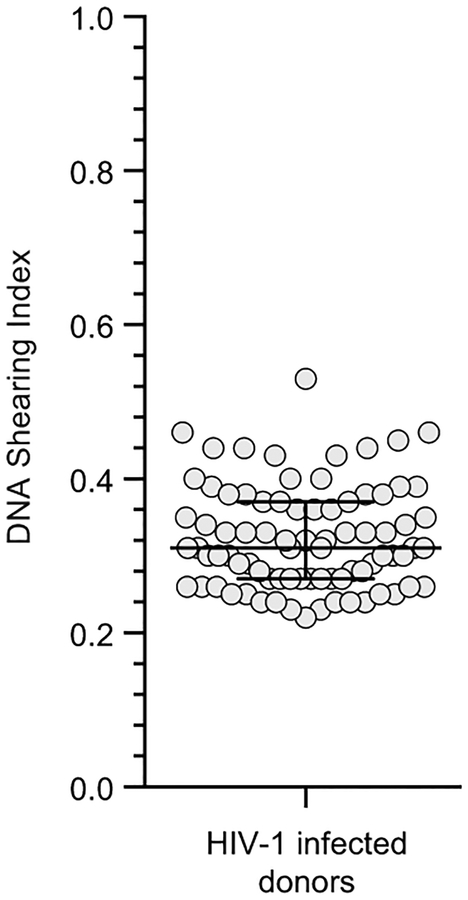
Using samples of only 5×10⁶ cells, we measured intact and defective proviruses in 62 infected individuals who had suppression of viremia on antiretroviral therapy (ART) (n=57) or “elite” control of HIV-1 without ART (n=5) (Table S3). The mean DSI was 0.32±0.07 (Extended Data Fig. 7), well within the range for which accurate correction is possible. Intact proviruses were rare (~100/106 resting CD4+ T cells) and greatly outnumbered by defective proviruses (Fig. 3f). These results provide the first demonstration with a method not requiring long distance PCR that the proviral landscape is dominated by defective proviruses. We found strong correlations between IPDA and QVOA measurements on the same samples (r=0.48, p=0.003, n=35, Fig. 3g) even though the fraction of intact proviruses induced by a single round of T-cell activation in the QVOA is small and variable between individuals (Fig. 3h).
Using nFGS data, we compared the IPDA with the widely used gag PCR with respect to desired assay characteristics. IPDA detects a larger fraction of proviruses (Fig. 3i) and separately enumerates intact and two class of defective proviruses. More importantly, the IPDA excludes 97% of proviruses with defects detectable by nFGS (Fig. 3i). The fraction of defective proviruses excluded by standard PCR assays is much lower and almost zero for Alu-PCR assays. It is only 30% for gag PCR. Most proviruses (~70%) classified as intact by IPDA lack defects detectable by nFGS. In contrast, this value is <10% for gag PCR (Fig. 3i). Thus the IPDA provides a scalable alternative that is much more selective for intact proviruses. Most defects missed by IPDA are small deletions not overlapping IPDA amplicons. In addition, although nFGS data used to design the assay covers 97.6% of the non-redundant HIV-1 sequence, small deletions in the remaining portion of the genome may be present in some proviruses. The assay was designed for use in treated patients and does not distinguish integrated proviruses from unintegrated linear or circular forms. These are rare in patients on long term ART8. Additional sequence data and improved ddPCR technology may allow even greater selectivity for intact proviruses. Importantly, selective intervention-induced reductions in intact proviruses would be apparent with the current IPDA but not with standard assays (Fig. 3i).
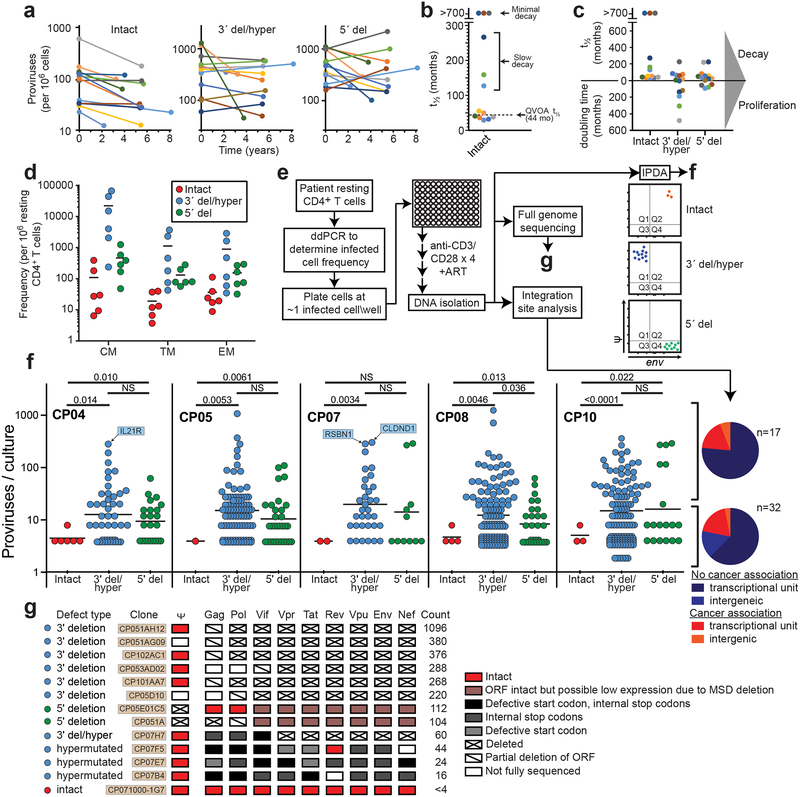
The latent reservoir measured by QVOA undergoes slow decay (t1/2=44 months)12,13. Intact proviruses measured by IPDA show similar decay (Fig. 4a,b). For most patients, intact proviruses declined with a t1/2 of ~44 months. Some patients showed even slower decay (t1/2=100–300 months), and for 3/14 patients, there was no decay (Fig. 4b,c). Thus the IPDA can measure changes consistent with known reservoir dynamics and possibly define subpopulations with slower decay.
Fig. 4.
IPDA reveals differential dynamics of intact and defective proviruses. (a) Decay of intact proviruses, proviruses with 3′ deletion and/or hypermutation (3′ del/hyper), and proviruses with 5′ deletions (5′ del) measured in resting CD4+ T cells from patients on long term ART. (b) Half-lives of cells carrying intact proviruses assuming exponential decay, from the data in (a). (c) Half-lives of populations of cells carrying intact and defective proviruses. Increasing frequencies are plotted as doubling times. (d) Distribution of intact and defective proviruses in memory CD4+ T-cell subsets. (e) System for examining the proliferation of infected cell clones. Total proviruses in resting CD4+ T-cells from patients on ART were measured using a standard gag PCR corrected for gag-deleted proviruses. Cells were diluted to ~1 infected cell/well (2000–4000 total resting CD4+ T cells/well) and stimulated 2–4 times with anti-CD3+anti-CD28 microbeads in the presence of IL-2 and antiretroviral drugs (see Methods) resulting in expansion to an average of 2×10⁶ cells/well. DNA was isolated for IPDA and for integration site analysis and nFGS, performed as previously described8,26. (f) IPDA and integration site analysis of 1731 microcultures from 5 patients. Y-axis indicated number of proviruses in each positive culture. Colors indicate type of provirus detected. Bars indicate geometric mean of proviruses/culture for each provirus type. Statistical significance of differences was determined by Welch’s t-test. Integration sites for some clones with the highest proliferation are indicated in blue boxes. Pie charts indicate the fractions of integration sites in transcriptional units, intergenic regions, or with cancer associations for cultures with high (> 20 proviruses, top) or low (< 20 proviruses, bottom) proliferation. (g) nFGS results for cultures showing proliferation. Sequences were analyzed for defects affecting expression of each HIV-1 gene as described in Fig. 1b. Count indicates proviruses/culture as detected by IPDA.
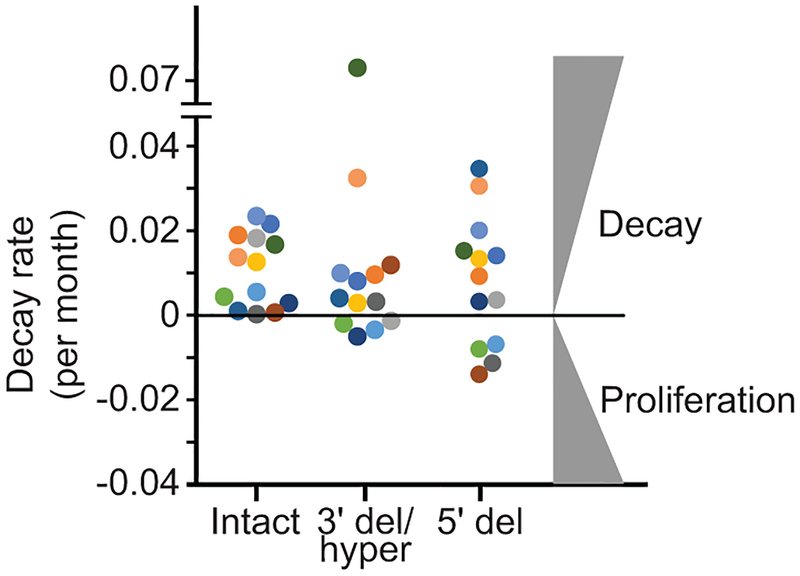
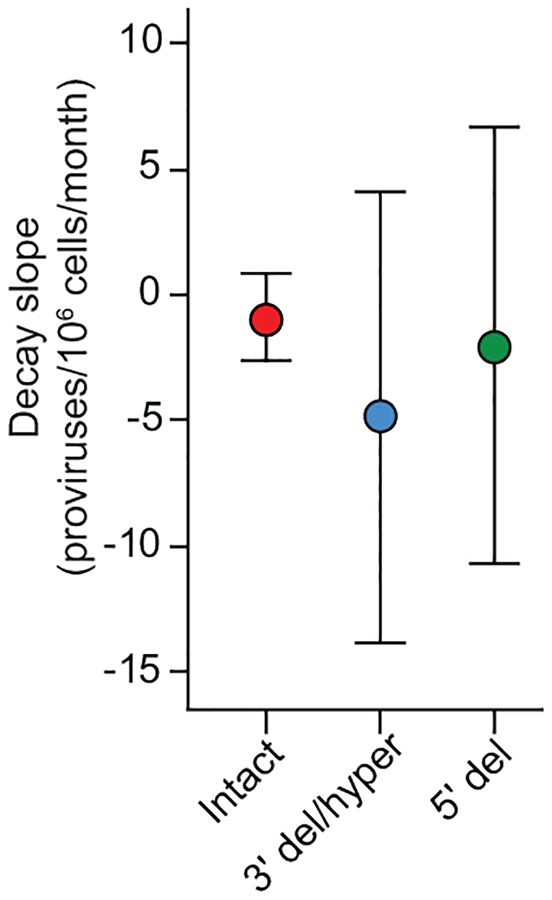
The dynamics of defective proviruses in the same patients showed greater variability, with increases over time in some patients (Fig. 4a,c, Extended Data Fig. 8). While the mean decay slopes did not differ, the standard deviations of decay slopes were much greater for defective proviruses (Extended Data Fig. 9), complicating interpretation of assays dominated by defective forms. Increases in infected cell frequency can reflect the proliferation of infected cells14–19. Although the IPDA cannot demonstrate the presence of expanded clones, it can detect increases in infected cell frequency due to clonal expansion. We asked whether the differential dynamics of cells with intact and defective proviruses could be due to uneven distribution in subsets of memory CD4+ T-cells20 with different proliferative potential. Intact and defective proviruses were found in expected ratios in central, transitional, and effector memory subsets (Fig. 4d). We then asked whether intact and defective proviruses imposed different constraints on proliferation. We used the IPDA to track individual infected cells from treated patients following in vitro stimulation with anti-CD3/28 (Fig. 4e). Microcultures seeded with ~1 infected cell/well were subjected to 4 rounds of stimulation in the presence of antiretroviral drugs. Analysis of >1700 microcultures showed that positive droplets were detected in only one of three possible quadrants for most positive wells, as expected for cultures initiated with a single infected cell and cultured with antiretroviral drugs (Fig. 4e). Most (97.6%) proviruses were defective (Fig. 4f). Importantly, the IPDA also counts proviruses in each well allowing direct quantitation of infected cell proliferation. Some cells carrying defective proviruses showed enormous clonal expansion (1000 fold) while cells with intact proviruses were rarely detected and showed little proliferation (Fig. 4f). Despite fewer wells with intact provirues, differences in the mean number of intact and defective proviruses per well remained highly significant (P=0.0029 to P<0.0001 by unpaired t test with Welch’s correction for intact proviruses vs proviruses with hypermutation and/or 3’ deletions). These differences are minimal estimates because the fraction of positive microcultures with intact proviruses was lower than expected based on IPDA analysis of the starting population (3.3% vs 7.5%), indicating that some cells with intact proviruses die. These results demonstrate a proliferative defect in response to repetitive in vitro TCR stimulation for cells carrying intact proviruses and show that the IPDA can be a useful initial high-throughput screening tool for mechanistic studies with the caveat that not all Q2 droplets represent intact proviruses (Fig. 3i).
Analysis of proviral integration sites14,15,21 of expanded clones demonstrated that the cultures were clonal and that integration into genes with cancer association was not required for proliferation (Fig. 4f, Table S4). Rather proliferative potential is related to proviral defects. nFGS confirmed the clonal nature of the proviruses in each well and demonstrated directly that the IPDA correctly identifies the presence and nature of defects in proviruses (Fig. 4g). Of 12 clonally expanded defective proviruses sequenced, 9 were defective in all HIV-1 ORFs, and none were fully competent for expression of Tat or of Vif, Vpr, Vpu, Env, or Nef. Low or absent expression of these genes would allow stimulated cells to escape viral cytopathic effects that could limit proliferation22,23.
The failure of cells carrying intact proviruses to expand following repetitive in vitro TCR stimulation provides insights into the mechanisms driving in vivo clonal expansion16–18,24 and into cure strategies involving T-cell activation. The reservoir of intact proviruses undergoes slow decay in vivo, as shown here and previously12,13. Thus observed clonal expansions14–19 must be more than offset by the death of infected cells. Strong TCR stimulation may induce viral gene expression and cell death or impaired proliferation as shown in our in vitro experiments. Clonal expansion in vivo may be driven by stimuli including homeostatic cytokines that allow proliferation without virus production19,20.
Our results show that the small subset of proviruses with the potential to cause viral rebound show different dynamics than the vast excess of defective proviruses captured in standard PCR assays, emphasizing the importance of direct measurement of intact proviruses. The availability of a scalable assay for intact proviruses should accelerate cure research.
Methods
Study participants.
Characteristics of study participants are given in Table S3. The Johns Hopkins Institutional Review Board and the UCSF Committee on Human Research approved this study. All participants provided written consent prior to enrollment. Except where indicated, participants were HIV-1 infected adults on suppressive ART with undetectable plasma HIV-1 RNA levels (< 50 copies per mL) for >6 months. Chronic phase (CP)-treated subjects are defined as subjects starting ART >180 days from the estimated date of infection. Acute phase (AP)-treated subjects started ART < 100 days after the estimated date of infection. For longitudinal analysis, additional peripheral blood mononuclear cell (PBMC) samples were obtained from 10 HIV-1-infected men followed in the Baltimore-Washington DC center of the Multicenter AIDS Cohort Study (MACS)27 who had undetectable plasma HIV RNA (<20 copies/ml by Roche Taqman assay) at all semiannual study visits for 5 years or more, with no blips or missed visits. PBMC cryopreserved at visits at least 5 years apart, and viably stored as per MACS protocols, were studied. Characteristics of these 10 men are given in Table S3 (CP31-CP49).
CD4+ T-cell isolation.
Peripheral blood mononuclear cells (PBMCs) were isolated by density centrifugation using Ficoll-Paque PLUS (GE Healthcare Life Sciences; Marlborough, MA) per manufacturer’s instructions. Untouched total CD4+ T-cells were then enriched from PBMC using negative immunomagnetic selection via the EasySep Human CD4+ T-Cell Enrichment Kit (StemCell Technologies; Vancouver, BC). In some experiments, resting CD4+ T-cells (CD4+, CD69−, CD25− and HLA-DR−) were isolated using a second negative selection step (CD25-Biotin; Anti-Biotin MicroBeads; CD69 MicroBead Kit II; Anti–HLA-DR MicroBeads, all from Miltenyi Biotec). Resting CD4+ T-cell purity was consistently >95% as assessed using flow cytometry.
Bioinformatic analysis.
We constructed an alignment of 431 published8,9 full length proviral sequences obtained from 28 HIV-1-infected adults by single genome analysis. Of these individuals, 19 started suppressive ART during chronic infection while 9 started suppressive ART during acute infection. 24 had prolonged suppression of viremia (>6 months) when studied, and 5 were viremic when studied (one individual was studied at two time points, before and after ART). Clinical characteristics of these individuals are given in the relevant publications8,9. The proportion of different types of defects in HIV-1 proviruses varies with the stage of disease at which ART is started and the level of viremia8. For most analyses, we used sequences from patients who initiated ART during chronic infection and who had sustained suppression of viremia to below 50 copies HIV-1 RNA/ml of plasma for >6 months. These sequences (n=211) are thus representative of the most common group of infected individuals who would be eligible for cure interventions. The proviral landscape in patients starting ART during acute infection is also dominated by defective sequences, with a higher fraction showing hypemutation8. In the analysis of deletions, common length polymorphisms were not included. Terminal deletions preclude integration and are not seen. Internal deletions in the 5’ LTR are not evaluable because the nFGS methods do not capture this region. Hypermutation occurred with or without deletions. For analyses of specific type of defects, we used all sequences in the database with that defect. For examples, for analysis of hypermutation, we used all database sequences with hypermutation (n=100) and additional hypermutated sequences obtained by single genome env sequencing. Hypermutation in the GG or GA context was confirmed using the Hypermut algorithm28. Positions of primers for ddPCR analysis were evaluated using a sliding window analysis of two hypothetical 100 bp amplicons, scoring for lack of significant overlap (>5%) with mapped deletions in the database sequences with deletions. Optimal discrimination between intact and deleted sequences is obtained with a 5′ amplicon in the Ψ region and a 3′ amplicon in env. Ψ is the site of frequent small deletions and is included in larger 5′ deletions. Sequence conservation was evaluated using separate alignments of US clade B sequences from the Los Alamos HIV sequence database (https://www.hiv.lanl.gov/content/sequence/HIV/mainpage.html).
Intact proviral DNA assay (IPDA).
A variety of experimental conditions were used in the development of the IPDA. The following is an optimized recommended procedure. In general, the IPDA is performed on DNA from 5×10⁶ CD4+ T-cells. Genomic DNA is extracted using the QIAamp DNA Mini Kit (Qiagen; Hilden, Germany) with precautions to avoid excess DNA fragmentation. DNA concentrations are determined using the Qubit3.0 and Qubit dsDNA BR Assay Kit (ThermoFisher Scientific; Waltham, MA). Quantification of intact, 5’ deleted, and 3’ deleted and/or hypermutated proviruses is carried out using primer/probe combinations optimized for subtype B HIV-1 (Table S5). A qualified research use only (RUO) version of the primer/probe mix is available from Accelevir Diagnostics, Baltimore, MD (HIV-1 Proviral Discrimination 20x primer/probe mix). The primer/probe mix is comprised of oligonucleotides for two independent hydrolysis probe reactions which interrogate conserved regions of the HIV-1 genome to discriminate intact from defective proviruses. HIV-1 Reaction A targets the packaging signal (Ψ) which is a frequent site of small deletion and is included in many large deletions in the proviral genome. The Ψ amplicon is positioned at HXB2 coordinates 692–797. This reaction utilizes forward and reverse primers, as well as a 5’ 6-FAM labelled hydrolysis probe. Successful amplification of HIV-1 Reaction A produces a FAM fluorescence in droplets containing Ψ, detectable in channel 1 of the droplet reader. HIV-1 Reaction B targets the Rev-Response Element (RRE) of the proviral genome, with the amplicon positioned at HXB2 coordinates 7736–7851. This reaction utilizes forward and reverse primers, as well as two hydrolysis probes: a 5’ VIC labelled probe specific for wild-type proviral sequences and a 5’ unlabeled probe specific for APOBEC-3G hypermutated proviral sequences (Fig. S2). Successful amplification of HIV-1 Reaction B produces a VIC fluorescence in droplets containing a wild-type form of RRE, detectable in channel 2 of the droplet reader, while droplets containing a hypermutated form of RRE are not fluorescent.
Droplets containing HIV-1 proviruses are scored as follows. Droplets positive for FAM fluorescence only, which arises from Ψ amplification, score as containing 3′ defective proviruses, with the defect attributable to either APOBEC-3G-mediated hypermutation or 3′ deletion. Droplets positive for VIC fluorescence only, which arises from wild-type RRE amplification, score as containing 5′ defective proviruses, with the defect attributable to 5′ deletion. Droplets positive for both FAM and VIC fluorescence score as containing intact proviruses (Fig. 3a.b). Double negative droplets contain no proviruses or rare proviruses (~3.8%) with defects affecting both amplicons.
An important aspect of the quantitation of intact proviruses is correction for DNA shearing between amplicons which artificially reduces Q2 droplets while increasing Q1 and Q4 droplets (Fig. 3b). This can be done accurately through ddPCR analysis of a host gene, which also provides a measure of input cell number. In principle, any host gene can be used, with two ddPCR amplicons spaced at the same distance as the HIV-1 amplicons described above. As demonstrated in Fig. 3d and 3e, this approach allows for accurate correction for DNA shearing. Simultaneous quantification of DNA shearing and input human genome equivalents is performed using another aliquot of the same DNA sample. For the studies described here, oligonucleotides for two independent hydrolysis probe reactions which interrogate the human RPP30 gene (Chr.10: 90,880,081 on GRCh38) were used. A qualified RUO RPP30 primer/probe mix is available from Accelevir Diagnostics, Baltimore, MD (DNA Shearing + Copy Reference 20x primer/probe mix). In this primer/mix, the total distance between duplex reactions and individual amplicon sizes are equivalent to those of the HIV-1 proviral discrimination reactions described above. Optimal reaction melting temperatures are equivalent for all reactions. Comprehensive oligonucleotide analysis predicted no potential off-target nucleotide binding or amplification (BLASTn) and no self-dimerization, hetero-dimerization, or primer hairpin formation. RPP30 Reaction A employs a 5’ 6-FAM labelled hydrolysis probe, and RPP30 Reaction B employs a 5’ HEX labelled hydrolysis probe. Droplets positive for both 6-FAM and HEX fluorescence score as containing an unsheared RPP30 gene fragment, while droplets positive for only a single fluorescence score as containing part of a sheared RPP30 gene fragment. The ratio of dual fluorescent to single fluorescent droplets is used to calculate a DNA Shearing Index (DSI), and this index is applied to both genome copy number input reactions and HIV-1 proviral discrimination reactions to correct for experimentally observed DNA shearing.
Droplet digital PCR was performed on the Bio-Rad QX200 AutoDG Digital Droplet PCR system using the appropriate manufacturer supplied consumables and the ddPCR Supermix for probes (no dUTPS) (Bio-Rad Laboratories; Hercules, CA). For HIV-1 proviral discrimination reactions, 700 ng of genomic DNA was analyzed in each reaction well. For DNA shearing and copy number reference reactions, 7 ng of genomic DNA was analyzed in each reaction well. Multiple replicate wells were performed for each reaction type to ensure consistent quantitation, and replicate wells were merged during analysis to increase IPDA dynamic range. The thermal cycling program used for all reactions, with a 2°C ramp rate, is given in Table S6. In general, parallel processing and analysis of uninfected donor CD4+ T-cells was performed for each IPDA run as a negative control while qualified JLat6.3 genomic DNA was analyzed in each IPDA run as a positive control. After correction for DNA shearing, results are expressed as proviral copies per 106 CD4+ T-cells.
Cell Lines.
The J-Lat Full Length Clone (clone #6.3) from Dr. Eric Verdin was obtained through the NIH AIDS Reagent Program, Division of AIDS, NIAID, NIH.
Quantitative viral outgrowth assay (QVOA).
The QVOAs were performed as previously described1,29. MOLT-4/CCR5 cells30 were added on Day 2 of the culture and the culture supernatants were examined for the p24 viral capsid protein by ELISA (PerkinElmer) after 14 and 21 days. Results were expressed as infectious units per million cells (IUPM) CD4+ T-cells calculated using maximal likelihood as described by Rosenbloom et al (IUPMStats31).
T-cell subset analysis.
Resting CD4+ T cells from HIV-1-infected donors on suppressive ART were isolated as described above. To sort resting memory subsets, we incubated cells with FcgR block (BD Pharmingen) for 10 minutes before staining with a FITC-labeled antibody to CD3 (Biolegend; Clone HIT3a), phycoerythrin (PE)-Cy7-labeled antibody to CD4 (Biolegend; Clone RPA-T4), allophycocyanin (APC)-labeled antibody to CD45RO (Biolegend; Clone UCHL1), BV421-labeled antibody to CD27 (Biolegend; Clone O323) and PE-labeled antibody to CCR7 (Biolegend; Clone G043H7). Dead cells were excluded using propidium iodide. PE Mouse IgG2aκ, BV421 Mouse IgG1κ, and APC IgG2aκ isotype antibodies were used in fluorescence-minus-one controls to set sorting gates. Memory cells were distinguished from naive cells by the presence or absence of CD45RO staining, respectively. Central memory cells were distinguished from effector and transitional memory subsets by the presence of CCR7 as described by Sallusto et al32. CCR7- cells were subdivided into effector memory (Tem) (CD45RO+CCR7-) or transitional memory (Ttm) (CD45RO+CCR7-CD27+) as described by Chomont et al20. Central, effector, and transitional resting memory subsets were sorted using a Beckman Coulter MoFlo XDT Cell sorter.
Clonal microcultures.
Purified resting CD4+ T-cells from HIV-1-infected donors on suppressive ART were analyzed for proviral DNA copies using gag qPCR as previously described33. The resulting values were corrected for gag− proviruses, and cells were plated at approximately one infected cell per well (2000–4000 total resting CD4+ T-cells) in 96-well plates. The cells were then stimulated with anti-CD3/CD28 Dynabeads (25 μl per million cells; Thermo Fisher Scientific) in RPMI containing 10% fetal bovine serum and 100 U/mL IL-2 (Novartis) for 7 days in the presence of tenofovir disoproxil fumarate (10 μM) and emtricitabine (10 μM). Half of the media in each well was removed and replaced with fresh media, anti-CD3/CD28 Dynabeads and antiretroviral drugs weekly for 2–3 weeks. DNA isolation was performed on cells from each well using a Quick-DNA 96 Kit (Zymo Research Corporation). 1/4th of the extracted DNA was analyzed by the IPDA to determine the type of provirus and proviral copy number in each well. The remaining DNA was used for integration site analysis and full genome sequencing.
Integration site analysis.
Integration site analysis was performed using previously described linker ligation method26,34,35. Sites for which both the 5ʹ and 3ʹ junctions were captured are shown. Cancer associations were determined as previously described35.
Full genome sequencing.
Full genome sequencing was performed at the single molecule level as previously described8.
Extended Data
Extended Data Fig. 1. Analysis of hypermutation.
(a) The majority of hypermutated proviruses show both GG→AG and GA→AA patterns of hypermutation. Based on hypermutated full-genome sequences in the database (n=100). Sequences were analyzed for GG→AG and GA→AA patterns using the using the all available sequence for each clone and the Los Alamos hypermut algorithm17. (b) Hypermutation discrimination using two probes in the RRE of the env gene. The intact probe hybridizes with a region containing two adjacent APOBEC3G consensus sites (red underline) in intact proviruses. It is labeled with a fluorophore (VIC) and a quencher (Q). Also present in the reaction is a hypermutated probe which lacks the fluorophore and which does not bind (arrow) to intact proviral sequences due to G→A mutations at both APOBEC3G consensus sites. Dashed boxes indicate the nucleotide positions of sequence differences between the intact and hypermutated probes. The hypermutated probe preferentially binds to the same region in hypermutated proviruses. It lacks a fluorophore and prevents binding of the fluorophore-labeled intact probe (arrow). Therefore, no fluorescent signal is generated for 95% of hypermutated proviruses (Fig. 2f).
Extended Data Fig. 2. Plasmid controls show the specificity of the IPDA.
(a) Maps of proviral plasmid control templates. Plasmids E44E11, 39G2, and 4F11 have deletions in the indicated regions (white). Plasmid 2G10 is a heavily hypermutated patient-derived sequence with G→A mutations in probe binding region of the env amplicon (enlarged region). Plasmid 19B3 has GA point mutations in this region. These G→A mutations (red) occur at two APOBEC3G consensus sites (TGGG, underlined) in this region. These plasmids have been previously described12,34. (b-e) IPDA on plasmids representing the indicated defective proviruses showing positive droplets only in the expected quadrants.
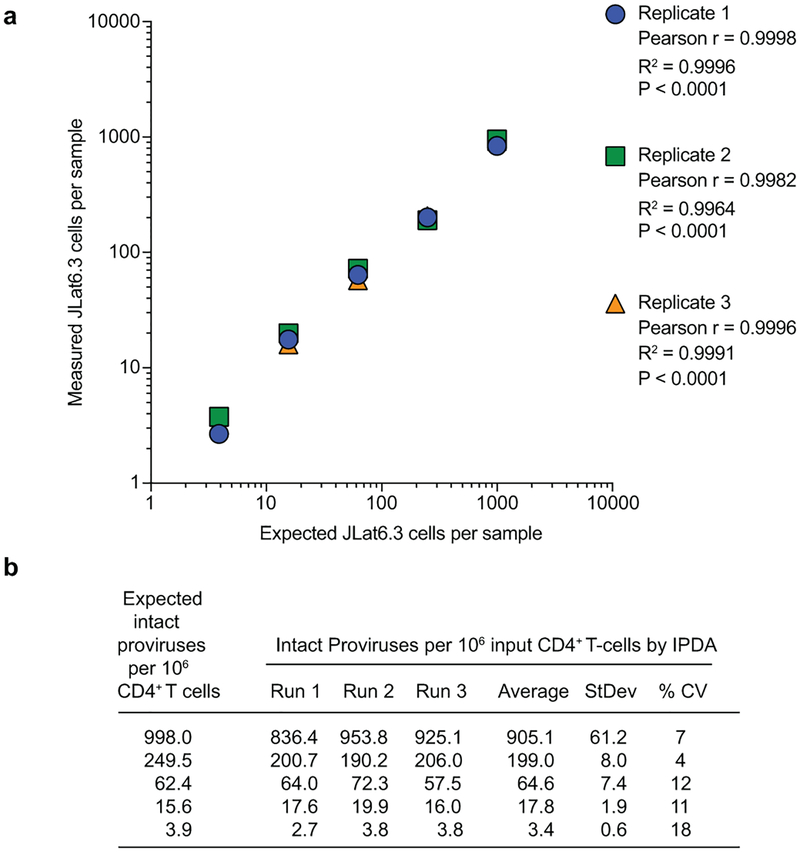
Extended Data Fig. 3. IPDA accuracy, reproducibility, and limit of quantification.
(a) Correlation between expected and IPDA-measured frequencies of intact proviruses per 106 cells. Genomic DNA from uninfected donor CD4+ T-cells was spiked with JLat6.3 DNA cell equivalents and subjected to a serial four-fold dilution. This material was then analyzed by the IPDA, and the IPDA-measured frequencies of intact proviruses per million cells were compared to the expected frequencies (998, 249.5, 62.4, 15.6, and 3.9 intact proviruses per 106 CD4+ T-cells). This experiment was performed independently three times. The agreement between the expected and IPDA-measured frequencies of intact proviruses was determined using Pearson correlation. (b) Reproducibility of the IPDA across independent assay runs. Reproducibility was assessed by determining the coefficient of variation (CV) across three independent assay measurements of genomic DNA from uninfected donor CD4+ T-cells spiked with JLat6.3 cell equivalents and subject to serial four-fold dilution, as described in (a).
Extended Data Fig. 4. IPDA reproducibility.
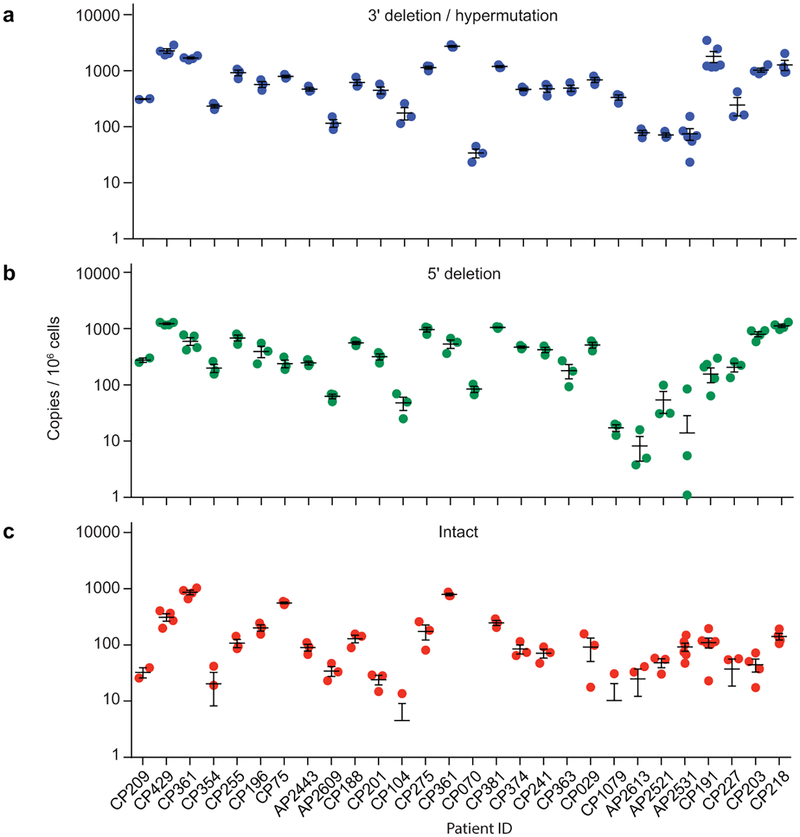
Frequencies of cells containing proviruses with 3′ deletions and/or hypermutation (a), 5′ deletions (b), or no defects (intact, c) in CD4+ T-cells from 28 treated patients. Each data point represents a replicate IPDA determination from a single sample from the indicated patient. The mean and SEM of the replicates are plotted. The variability between patients is much greater than the variation between replicates from a single patient. Technical replicates are shown to indicate low intrinsic variability of the IPDA.
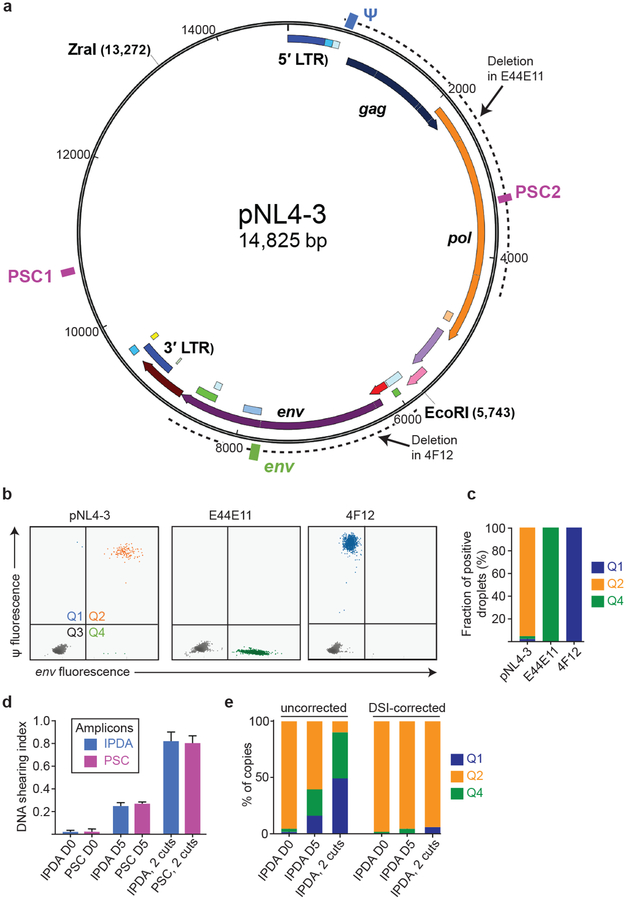
Extended Data Fig. 5. Plasmid controls confirm specificity of the IPDA.
(a) Map of the plasmid pNL4–3 carrying an intact HIV-1 provirus. Positions of the Ψ (blue) and env (green) IPDA amplicons and of a distinct set of plasmid shearing control (PSC, magenta boxes) amplicons are indicated. Spacing between PSC amplicons is equal to spacing between Ψ and env amplicons. Dotted lines indicate positions of deletions in plasmids carrying previously described12 defective proviruses E44E11 and 4F12 with 5′ and 3′ deletions, respectively. (b) IPDA analysis of the indicated Zra1-cut plasmids representing intact, 5′-deleted and 3′-deleted proviruses. (c) Summary of droplet counts for the experiment shown in (b). E44E11 and 4F12 give positive droplets only in quadrant 4 (Q4) and Q1, respectively. For pNL4–3, >95% of droplets are in Q2, with the remainder attributable to shearing between the Ψ and env amplicons. (d) Analysis of shearing. For IPDA analysis of patient samples, shearing was measured using amplicons in the RPP30 gene (Fig. 3a,d,e). For plasmid control experiments, shearing of ZraI-cut plasmids was analyzed using two sets of amplcons, the Ψ and env IPDA amplicons and the equally spaced PSC amplicons shown in (a). ddPCR analysis was done on fresh (D0) maxipreps of pNL4–3 linearized with ZraI at a concentration mimicking patient samples. To assess the effects of higher levels of DNA fragmentation, IPDA analysis was also done on pNL4–3 DNA that had been incubated at 4oC for 5 days (D5), and on pNL4–3 DNA cut with both ZraI and EcoRI (2 cuts). The mean and range of duplicate determinations of the DNA shearing index (DSI) is shown for each set of amplicons. The DSI was the same for the IPDA and PSC amplicons at 3 different levels of shearing. The DSI was used to correct the IPDA droplet counts in (e). Negative values were set to 0. (e) Uncorrected and DSI-corrected IPDA analysis of the intact proviral construct pNL4–3 at different levels of fragmentation. After correction, positive droplets were almost exclusively in Q2 even at higher levels of fragmentation.
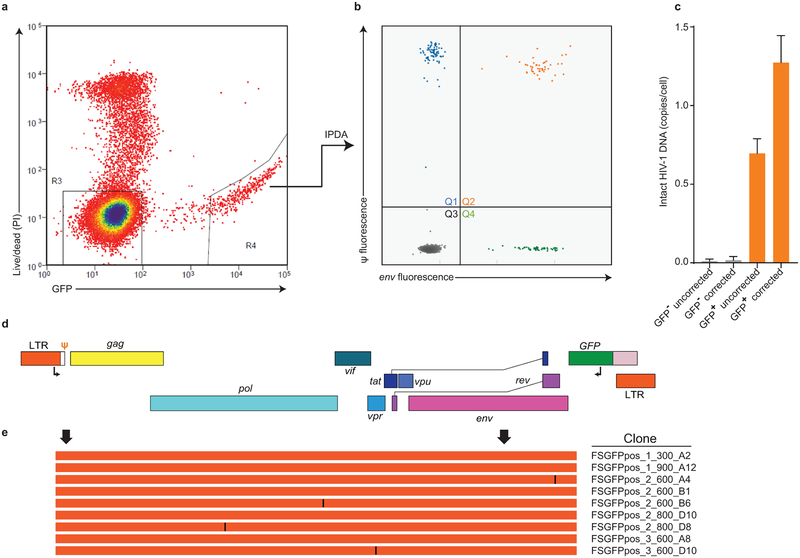
Extended Data Fig. 6. Sequence analysis of Q2 proviruses.
(a) Sorting of productively infected CD4+ T-cells. Cell preparations with a high fraction of intact proviruses were obtained by infecting CD4+ T-lymphoblasts with a replication-competent HIV-1 carrying GFP in the nef ORF (R7-GFP37). After 48 hours, GFP+ cells were collected by sorting. Genomic DNA was isolated, subjected to pulse field electrophoresis to remove unintegrated intermediates, and analyzed by IPDA. (b) IPDA analysis of high molecular weight DNA from sorted cells. Droplets in Q1 and Q4 largely reflect the shearing of intact proviruses (DSI = 0.46) during in DNA isolation and purification. (c) Frequency of intact proviruses in GFP− and GFP+ cells before and after correction for shearing. After correction for shearing, the frequency of intact proviruses in sorted GFP+ cells is close to the expected value of 1. (d) Map of the HIV-1 genome in GFP-expressing HIV-1 vector R7-GFP used in (a). GFP is inserted in the nef ORF. Positions of outer primers in the LTR and GFP used in single genome amplifications are indicated. (e) Sequence analysis of 9 independent single genomes. Arrows indicated positions of the Ψ and env IPDA amplicons. Orange lines indicate intact sequence without deletions or hypermutation and identical to R7-GFP except for single base mutations (black lines).
Extended Data Fig. 7.
DNA shearing index (DSI) for patient samples (n=62). The DSI was determined by ddPCR using two amplions in a cellular gene (RPP30) spaced at exactly the same distance as the Ψ and env amplicons. It is the fraction of templates in which DNA shearing has occurred between the amplicons. Horizontal bars indicate media and interquartile range.
Extended Data Fig. 8.
In vivo decay rates of cells with intact and defective proviruses. The frequency of cells carrying intact proviruses, proviruses with 3′ deletion and/or hypermutation (3′ del/hyper), and proviruses with 5′ deletions (5′ del) was measured in resting CD4+ T-cells from patients on long term suppressive ART. Data are plotted in terms of decay rate assuming exponential decay. Half-life values for the same decay curves are sown in Fig. 4c. Negative decay rate indicates proliferation.
Extended Data Fig. 9.
Variability in decay slopes. Mean and standard deviation of the decay slopes for intact and defective proviruses in infected individuals on ART sampled longitudinally (n=14). Based on decay data in Fig. 4a.
Supplementary Material
Acknowledgments
We thank Dr. Diana Finzi of NIAID for helpful discussions leading to this work. This work was supported by the NIH Martin Delaney I4C (UM1 AI126603), Beat-HIV (UM1 AI126620) and DARE (UM1 AI12661) Collaboratories, by NIH grant 43222, by the Howard Hughes Medical Institute and the Bill and Melinda Gates Foundation (OPP1115715), and by NIH SBIR grants R43AI124996 and R44AI124996 and NSF grants 1621633 and 1738428 to Accelevir Diagnostics. Samples for some study participants were obtained from the Baltimore-Washington DC Center of the Multicenter AIDS Cohort Study (MACS) supported by NIH grants U01-AI-35042 and UL1-RR025005 (ICTR).
Footnotes
Competing interests Aspects of IPDA are subject of patent application PCT/US16/28822 filed by Johns Hopkins University. KMB and RFS are inventors on this application. Accelevir Diagnostics holds an exclusive license for this patent application. GML is an employee of and shareholder in Accelevir Diagnostics. RFS holds no equity interest in Accelevir Diagnostics. RFS is a consultant on cure-related HIV research for Merck and Abbvie.
References
- 1.Finzi D et al. Identification of a reservoir for HIV-1 in patients on highly active antiretroviral therapy. Science 278, 1295–1300 (1997). [DOI] [PubMed] [Google Scholar]
- 2.Chun TW et al. Presence of an inducible HIV-1 latent reservoir during highly active antiretroviral therapy. Proc. Natl. Acad. Sci. U. S. A 94, 13193–13197 (1997). [DOI] [PMC free article] [PubMed] [Google Scholar]
- 3.Wong JK et al. Recovery of replication-competent HIV despite prolonged suppression of plasma viremia. Science 278, 1291–1295 (1997). [DOI] [PubMed] [Google Scholar]
- 4.Archin NM et al. Administration of vorinostat disrupts HIV-1 latency in patients on antiretroviral therapy. Nature 487, 482–485 (2012). [DOI] [PMC free article] [PubMed] [Google Scholar]
- 5.Borducchi EN et al. Ad26/MVA therapeutic vaccination with TLR7 stimulation in SIV-infected rhesus monkeys. Nature 540, 284–287 (2016). [DOI] [PMC free article] [PubMed] [Google Scholar]
- 6.Procopio FA et al. A Novel Assay to Measure the Magnitude of the Inducible Viral Reservoir in HIV-infected Individuals. EBioMedicine 2, 872–881 (2015). [DOI] [PMC free article] [PubMed] [Google Scholar]
- 7.Ho YC et al. Replication-competent noninduced proviruses in the latent reservoir increase barrier to HIV-1 cure. Cell 155, 540–551 (2013). [DOI] [PMC free article] [PubMed] [Google Scholar]
- 8.Bruner KM et al. Defective proviruses rapidly accumulate during acute HIV-1 infection. Nat. Med 22, 1043–1049 (2016). [DOI] [PMC free article] [PubMed] [Google Scholar]
- 9.Imamichi H et al. Defective HIV-1 proviruses produce novel protein-coding RNA species in HIV-infected patients on combination antiretroviral therapy. Proc. Natl. Acad. Sci. U. S. A (2016). [DOI] [PMC free article] [PubMed] [Google Scholar]
- 10.Sheehy AM, Gaddis NC, Choi JD & Malim MH Isolation of a human gene that inhibits HIV-1 infection and is suppressed by the viral Vif protein. Nature 418, 646–650 (2002). [DOI] [PubMed] [Google Scholar]
- 11.Jordan A, Bisgrove D & Verdin E HIV reproducibly establishes a latent infection after acute infection of T cells in vitro. EMBO J. 22, 1868–1877 (2003). [DOI] [PMC free article] [PubMed] [Google Scholar]
- 12.Finzi D et al. Latent infection of CD4+ T cells provides a mechanism for lifelong persistence of HIV-1, even in patients on effective combination therapy. Nat. Med 5, 512–517 (1999). [DOI] [PubMed] [Google Scholar]
- 13.Crooks AM et al. Precise Quantitation of the Latent HIV-1 Reservoir: Implications for Eradication Strategies. J. Infect. Dis (2015). [DOI] [PMC free article] [PubMed] [Google Scholar]
- 14.Maldarelli F et al. HIV latency. Specific HIV integration sites are linked to clonal expansion and persistence of infected cells. Science 345, 179–183 (2014). [DOI] [PMC free article] [PubMed] [Google Scholar]
- 15.Wagner TA et al. HIV latency. Proliferation of cells with HIV integrated into cancer genes contributes to persistent infection. Science 345, 570–573 (2014). [DOI] [PMC free article] [PubMed] [Google Scholar]
- 16.Bui JK et al. Proviruses with identical sequences comprise a large fraction of the replication-competent HIV reservoir. PLoS Pathog. 13, e1006283 (2017). [DOI] [PMC free article] [PubMed] [Google Scholar]
- 17.Lorenzi JC et al. Paired quantitative and qualitative assessment of the replication-competent HIV-1 reservoir and comparison with integrated proviral DNA. Proc. Natl. Acad. Sci. U. S. A 113, E7908–E7916 (2016). [DOI] [PMC free article] [PubMed] [Google Scholar]
- 18.Hosmane NN et al. Proliferation of latently infected CD4+ T cells carrying replication-competent HIV-1: Potential role in latent reservoir dynamics. J. Exp. Med 214, 959–972 (2017). [DOI] [PMC free article] [PubMed] [Google Scholar]
- 19.Wang Z et al. Expanded cellular clones carrying replication-competent HIV-1 persist, wax, and wane. Proc. Natl. Acad. Sci. U. S. A 115, E2575–E2584 (2018). [DOI] [PMC free article] [PubMed] [Google Scholar]
- 20.Chomont N et al. HIV reservoir size and persistence are driven by T cell survival and homeostatic proliferation. Nat. Med 15, 893–900 (2009). [DOI] [PMC free article] [PubMed] [Google Scholar]
- 21.Cohn LB et al. HIV-1 integration landscape during latent and active infection. Cell 160, 420–432 (2015). [DOI] [PMC free article] [PubMed] [Google Scholar]
- 22.Ho DD et al. Rapid turnover of plasma virions and CD4 lymphocytes in HIV-1 infection. Nature 373, 123–126 (1995). [DOI] [PubMed] [Google Scholar]
- 23.Wei X et al. Viral dynamics in human immunodeficiency virus type 1 infection. Nature 373, 117–122 (1995). [DOI] [PubMed] [Google Scholar]
- 24.Simonetti FR et al. Clonally expanded CD4+ T cells can produce infectious HIV-1 in vivo. Proc. Natl. Acad. Sci. U. S. A 113, 1883–1888 (2016). [DOI] [PMC free article] [PubMed] [Google Scholar]
- 25.Pollack RA et al. Defective HIV-1 Proviruses Are Expressed and Can Be Recognized by Cytotoxic T Lymphocytes, which Shape the Proviral Landscape. Cell. Host Microbe 21, 494–506.e4 (2017). [DOI] [PMC free article] [PubMed] [Google Scholar]
Additonal References for Methods Section
- 26.Berry CC et al. Estimating abundances of retroviral insertion sites from DNA fragment length data. Bioinformatics 28, 755–762 (2012). [DOI] [PMC free article] [PubMed] [Google Scholar]
- 27.Detels R et al. The multicenter AIDS Cohort Study, 1983 to … Public Health 126, 196–198 (2012). [DOI] [PMC free article] [PubMed] [Google Scholar]
- 28.Rose PP & Korber BT Detecting hypermutations in viral sequences with an emphasis on G --> A hypermutation. Bioinformatics 16, 400–401 (2000). [DOI] [PubMed] [Google Scholar]
- 29.Laird GM, Rosenbloom DI, Lai J, Siliciano RF & Siliciano JD Measuring the Frequency of Latent HIV-1 in Resting CD4(+) T Cells Using a Limiting Dilution Coculture Assay. Methods Mol. Biol 1354, 239–253 (2016). [DOI] [PubMed] [Google Scholar]
- 30.Laird GM et al. Rapid quantification of the latent reservoir for HIV-1 using a viral outgrowth assay. PLoS Pathog. 9, e1003398 (2013). [DOI] [PMC free article] [PubMed] [Google Scholar]
- 31.Rosenbloom DI et al. Designing and Interpreting Limiting Dilution Assays: General Principles and Applications to the Latent Reservoir for Human Immunodeficiency Virus-1. Open Forum. Infect. Dis 2, ofv123 (2015). [DOI] [PMC free article] [PubMed] [Google Scholar]
- 32.Sallusto F, Lenig D, Forster R, Lipp M & Lanzavecchia A Two subsets of memory T lymphocytes with distinct homing potentials and effector functions. Nature 401, 708–712 (1999). [DOI] [PubMed] [Google Scholar]
- 33.Durand CM et al. HIV-1 DNA Is Detected in Bone Marrow Populations Containing CD4+ T Cells but Is not Found in Purified CD34+ Hematopoietic Progenitor Cells in Most Patients on Antiretroviral Therapy. J. Infect. Dis 205, 1014–1018 (2012). [DOI] [PMC free article] [PubMed] [Google Scholar]
- 34.Lewinski MK et al. Genome-wide analysis of chromosomal features repressing human immunodeficiency virus transcription. J. Virol 79, 6610–6619 (2005). [DOI] [PMC free article] [PubMed] [Google Scholar]
- 35.Sherman E et al. INSPIIRED: A Pipeline for Quantitative Analysis of Sites of New DNA Integration in Cellular Genomes. Mol. Ther. Methods Clin. Dev 4, 39–49 (2016). [DOI] [PMC free article] [PubMed] [Google Scholar]
Associated Data
This section collects any data citations, data availability statements, or supplementary materials included in this article.


