

Abstract
The pathologic accumulation and aggregation of α-synuclein (α-syn) underlies Parkinson’s disease (PD). The molecular mechanisms by which pathologic α-syn causes neurodegeneration in PD is not known. Here we found that pathologic α-syn activates poly (ADP-ribose) (PAR) polymerase-1 (PARP-1) and PAR generation accelerates the formation of pathologic α-syn resulting in cell death via parthanatos. PARP inhibitors or genetic deletion of PARP-1 prevented pathologic α-syn toxicity. In a feed-forward loop, PAR converted pathologic α-syn to a more toxic strain. PAR levels were increased in the cerebral spinal fluid and brains of PD patients suggesting that PARP activation plays a role in PD pathogenesis. Thus, strategies aimed at inhibiting PARP-1 activation could hold promise as a disease modifying therapy to prevent the loss of dopamine (DA) neurons in PD.
One Sentence Summary:
Poly (ADP-ribose) (PAR) mediates and accelerates neurodegeneration in Parkinson’s disease.
Parkinson’s disease (PD) is an age-related neurodegenerative disease in which α-syn deposits as fibrils in intracytoplasmic inclusions in structures termed Lewy bodies and neurites (1). Recombinant α-syn can be aggregated in vitro to form fibrils similar in structure to those found in vivo (2), and these α-syn pre-formed fibrils (α-syn PFF) can spread in a prion-like manner: both in in vitro neuronal cultures and in vivo when injected into the mouse brain with accompanying phosphorylation of α-syn on serine 129, a marker of pathologic α-syn (3) and neurotoxicity (2, 4, 5). While it is clear that aggregated α-syn underlies the pathology of PD, what drives abnormal aggregation of α-syn as well as the cell injury and death mechanisms that are activated by this aggregation are not yet known. Because poly (ADP-ribose) (PAR) polymerase-1 (PARP-1) and PAR play a major contributing role in cell death relevant to neurologic disorders (6, 7), here we evaluated a role for PARP-1 and PAR in pathologic α-syn induced neurodegeneration.
α-Syn PFF-induced neurotoxicity is PARP-1 dependent
To determine whether α-syn PFF induce the activation of PARP, levels of PAR were measured using a highly sensitive and specific PAR monoclonal antibody after administration of α-syn PFF to primary mouse cortical neurons (Fig. 1). α-syn PFF (1 μg/ml) induced PARP activation peaks between 3 to 7 days and remained elevated for up to 14 days (Fig. 1A). The elevation of PAR was accompanied by neuron death as assessed by propidium iodide (PI) staining (Fig. 1, B and C). Treatment of cortical neurons with 1 μM of the PARP inhibitors, ABT-888 (veliparib), or AG-014699 (Rucaparib) or BMN 673 (Talazoparib) prevented the α-syn PFF-mediated PARP activation and cell death (Fig. 1, B-D). Consistent with known IC50 values for inhibition of PARP-1 (5.2 nM by ABT-888, 1.4 nM by AG-014699, and 1.2 nM by BMN 673) (8), 10 nM of ABT-888, 1 nM of AG-014699 or 1 nM of BMN 673 partially prevented PARP-1 autoribosylation activity in vitro (fig. S1, A and B). Complete inhibition was observed at higher concentration of these inhibitors (fig. S1, A and B). These PARP inhibitors prevented α-syn PFF-induced cell death and PARP activation at concentrations as low as 10 nM (fig. S1, C-E). They also reduced α-syn PFF-mediated phosphorylation of α-syn at serine 129 (p-α-syn) (fig. S1, F and G), and α-syn aggregation (fig. S1, H and I), both of which are associated with pathology in α-synucleinopathies (4). Because PARP-1 plays a major role in parthanatos (9, 10), we deleted PARP-1 from cortical neurons using CRISPR/Cas9 via adeno associated virus (AAV) transduction carrying a guide RNA against PARP-1 (11) (Fig. 1, E and F, and fig. S2A) or used cortical cultures from PARP-1 knockouts (Fig. 1, G and H, and fig. S2, B-F). Deletion or knockout of PARP-1 prevented α-syn PFF-mediated PARP activation and cell death (Fig. 1, E-H, and fig. S2, A and B). Knockout of PARP-1 also reduced p-α-syn immunostaining and α-syn aggregation (fig. S2, C-F). Treatment of cortical neurons with the broad spectrum caspase inhibitor Z-VAD-FMK (Z-VAD) partially reduced α-syn PFF toxicity. The necroptosis inhibitor Necrostatin-1 (Nec-1) and the autophagy inhibitor 3-Methyladenine (3-MA) had no effect, while the PARP inhibitor ABT-888 prevented α-syn PFF toxicity (fig. S2, G-M). Because PARP inhibition and knockout of PARP-1 reduced the accumulation of pathologic α-syn as indicated by a reduction of p-α-syn immunostaining, we assessed cell-to-cell transmission of α-syn (5). Knockout of PARP-1 or PARP inhibition did not show significant difference in the levels of α-syn-biotin PFF in the endosomal-enriched fractions (5) (fig. S3, A-D), indicating that PARP-1 did not affect the uptake of α-syn PFF. However, knockout of PARP-1 reduced the cell-to-cell transmission of pathologic α-syn by inhibiting propagation of α-syn PFF into recipient cells (fig. S3, E-G).
Fig. 1. α-syn PFF induces parthanatos in neurons.
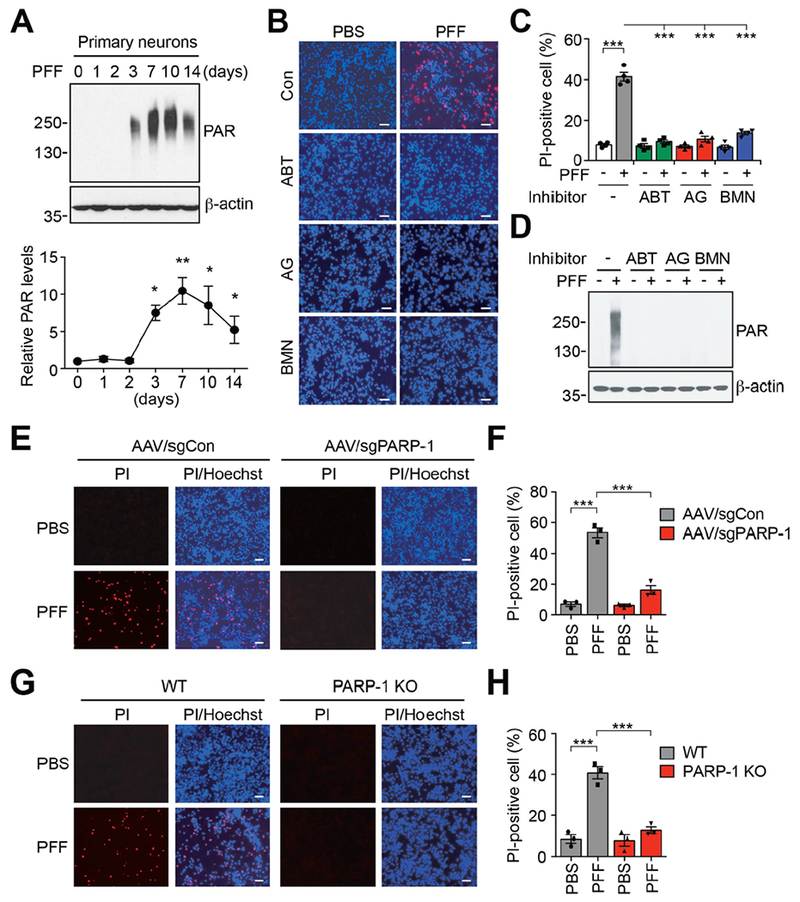
(A) Activation of PARP-1 in α-syn PFF-treated primary cortical neurons. The representative western blot analysis (top) and quantification (bottom) of the levels of PAR accumulation. Bars represent mean ± s.e.m. One-way ANOVA followed by Tukey’s post hoc test (n=3-4). (B) Representative images of Hoechst and propidium iodide (PI) staining from primary cortical neurons pre-incubated with either ABT-888 (1 μM), AG-014699 (1 μM) or BMN 673 (1 μM) for 1 h, and further incubated with α-syn PFF (5 μg/ml) for 14 days. Scale bar, 20 μm. (C) Quantification of cell death. Bars represent mean ± s.e.m. Two-way ANOVA followed by Tukey’s post hoc test (n=4). (D) Inhibition of α-syn PFF-induced PAR accumulation was determined by western blot analysis. (E) Representative images of Hoechst and propidium iodide (PI) staining from primary cortical neurons transduced with AAV-sgCon or AAV-sgPARP-1, and further incubated with α-syn PFF for 14 days. Scale bar, 20 μm. (F) Quantification of cell death. Bars represent mean ± s.e.m. Two-way ANOVA followed by Tukey’s post hoc test (n=3). (G) Representative images of Hoechst and propidium iodide (PI) staining from WT or PARP-1 KO primary cortical neurons, and further incubated with α-syn PFF for 14 days. Scale bar, 20 μm. (H) Quantification of cell death. Bars represent mean ± s.e.m. Two-way ANOVA followed by Tukey’s post hoc test (n=3). *P < 0.05, **P < 0.005, ***P < 0.0005.
α-Syn PFF activates PARP-1 via nitric oxide-induced DNA damage
To determine how α-syn PFF activates PARP-1, we measured levels of damaged DNA and activation of nitric oxide synthase (NOS) (12–14) (Fig. 2 and fig. S4). α-syn PFF treatment increased NO levels in primary cultured neurons, while pre-treatment with the NOS inhibitor, Nω-Nitro-L-arginine methyl ester hydrochloride (L-NAME), prevented α-syn PFF-induced NO generation (Fig. 2A). NO levels also increased in α-syn PFF-injected brain (Fig. 2B). Both in α-syn PFF-treated primary cultured neurons and in α-syn PFF-injected brain, expression of γH2A.X, a marker of DNA strand breaks (15), was increased (Fig. 2, C-G, and fig. S4A). α-syn PFF resulted in substantial numbers of neurons with DNA damage, whereas no such damage was detected by treatment with L-NAME (Fig. 2, C-E, and fig. S4, B-D). Consistent with suppression of PARP-1 activation (Fig. 2C), α-syn PFF induced cell death was prevented by L-NAME (fig. S4, E-G). Thus, α-syn PFF activates NOS leading to DNA damage and PARP-1 activation. Moreover, α-syn PFF primarily kill neurons through parthanatos and PARP-1 contributes to generation of pathologic α-syn.
Fig. 2. Increased NO levels and damaged DNA by α-syn PFF.
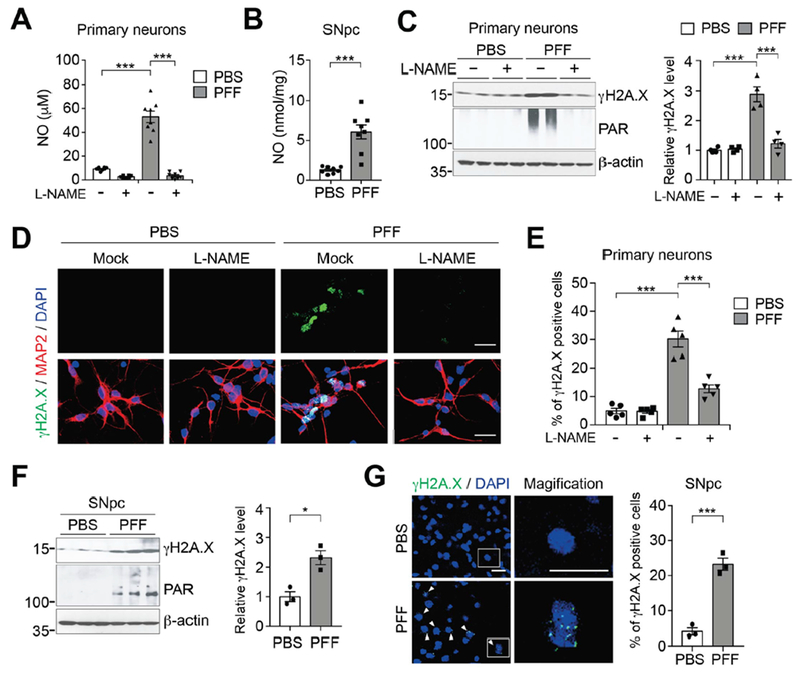
(A) NO (nitrite+nitrate) levels in primary cortical neurons pre-incubated with L-NAME for 1 h, and further incubated with α-syn PFF for 3 days. Bars represent mean ± s.e.m. Two-way ANOVA followed by Tukey’s post hoc test (n=8). (B) NO (nitrite+nitrate) levels in SNpc of α-syn PFF injected mice. Bars represent mean ± s.e.m. Unpaired student’s t test (n=8). (C) Representative immunoblots (left) and quantification (right) of γH2A.X and PAR levels in primary cortical neurons pre-incubated with L-NAME for 1 h, and further incubated with α-syn PFF. Bars represent mean ± s.e.m. Two-way ANOVA followed by Tukey’s post hoc test (n=4). (D) Representative images of γH2A.X (green) and MAP2 (red) in primary cortical neurons pre-incubated with L-NAME for 1 h, and further incubated with α-syn PFF. Scale bar, 20 μm. (E) Quantification of γH2A.X positive neurons. Bars represent mean ± s.e.m. Two-way ANOVA followed by Tukey’s post hoc test (n=5). (F) Representative immunoblots (left) and quantification (right) of γH2A.X levels in the SNpc of α-syn PFF injected mice. Bars are means ± s.e.m. Unpaired student’s t test (n=3). (E) Representative images (left) and quantification (right) of γH2A.X positive cells (green) in the SNpc of α-syn PFF injected mice. Scale bar, 20 μm. Bars are means ± s.e.m. Unpaired student’s t test (n=3). *P < 0.05, ***P < 0.0005.
PARP-1 activation mediates α-syn PFF-induced loss of DA neurons
Because synthetic α-syn PFF killed primary cortical neurons via parthanatos, we sought to determine whether parthanatos plays a role in the loss of DA neurons following the intrastriatal injection of α-syn PFF (4, 5) (Fig. 3). A single intrastriatal injection of α-syn PFF (5 μg) induced PARP activation and increased PAR levels (Fig. 3A). Intrastriatal injection of α-syn PFF into PARP-1 knockout mice failed to increase PAR levels (Fig. 3A). As previously described (4), a single intrastriatal injection of α-syn PFF leads to an approximate 50% loss of DA neurons 6 months following the injection in WT mice (Fig. 3, B and C). In contrast, a single intrastriatal injection of α-syn PFF into PARP-1 knockout mice failed to induce DA cell loss (Fig. 3, B and C). WT mice were also fed a diet containing the PARP inhibitor ABT-888 (125 mg/kg) and compared with mice given a control diet (Fig. 3, B and C). Mice treated with ABT-888 exhibited significantly less loss of DA neurons after an intrastriatal injection of α-syn PFF compared to mice on the control diet (Fig. 3, B and C). ABT-888 also reduced the formation of α-syn PFF-induced increase in PAR levels (fig. S5A). Tyrosine hydroxylase (TH) and dopamine transporter (DAT) levels were also reduced in WT mice in response to α-syn PFF, while the reduction in TH and DAT levels was prevented in PARP-1 knockout or ABT-888 treated WT mice (fig. S5, A-C). The loss of DA neurons was accompanied by a reduction in striatal DA and its metabolites in WT mice, but not PARP-1 knockout or ABT-888 treated mice (Fig. 3D and fig. S5, F-H). As previously described (4, 5), injection of intrastriatal α-syn PFF leads to α-syn pathology in DA neurons of WT mice (fig. S5, A, D and E, and fig. S6, A-D). α-syn pathology was markedly reduced in PARP-1 knockout mice and ABT-888 treated WT mice consistent with the absence and reduction of neurodegeneration, respectively. Intrastriatal injection of α-syn PFF caused deficits on the pole test (16), a sensitive behavioral measurement of dopaminergic function in WT mice, whereas there were no deficits in PARP-1 knockout and ABT-888 WT treated mice (Fig. 3E and fig. S6E). Both forelimb plus hindlimb and forelimb grip strength were also reduced in WT mice after α-syn PFF injection, but not in PARP-1 knockout or ABT-888 treated WT mice (Fig. 3F and fig. S6F). Thus, the striatal α-syn PFF-induced loss of DA neurons is dependent on PARP-1.
Fig. 3. α-syn PFF-induced pathology is reduced by deletion of PAPR-1 or a PARP inhibitor ABT-888 in vivo.
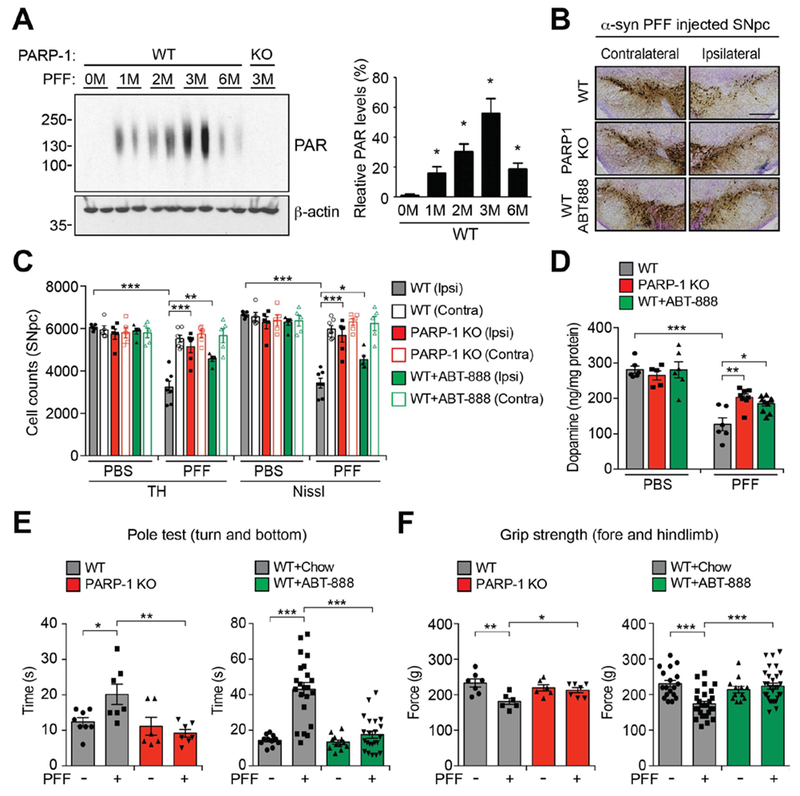
(A) Representative immunoblots (left) and quantification (right) of the levels of PAR accumulation in the striatum of α-syn PFF injected mice. Bars represent mean ± s.e.m. One-way ANOVA followed by Tukey’s post hoc test (n=4). (B) Representative TH and Nissl staining of SNpc DA neurons of α-syn PFF injected WT, PARP-1 KO, and WT mice fed with ABT-888 at 6 months after intrastriatal α-syn PFF or PBS injection. Scale bar, 400 μm. (C) Stereological counts. Data are mean ± s.e.m. Two-way ANOVA followed by Tukey’s post hoc test (n=5 to 7 mice per group). (D) DA concentrations in the striatum of WT, PARP-1 KO, and WT mice fed with ABT-888 at 6 months after intrastriatal α-syn PFF or PBS injection measured by HPLC. Bars represent mean ± s.e.m. Two-way ANOVA followed by Tukey’s post hoc test. (n=5 to 10 mice per group). (E and F) 180 days after α-syn PFF injection, the pole test (E) and grip strength (F) test were performed in WT, PARP-1 KO, or WT mice fed with ABT-888. Data are the means ± s.e.m. Two-way ANOVA followed by Tukey’s post hoc test (n=6 to 8 mice for PARP-1 KO, n=11 to 30 mice for ABT-888). *P < 0.05, **P < 0.005, ***P < 0.0005.
PAR accelerates α-syn fibrillization
Because PAR causes liquid demixing of intrinsically disordered proteins leading to their aggregation (17), experiments were performed to determine whether PAR could seed and accelerate α-syn aggregation. Recombinant α-syn was incubated at 37˚ C and agitated in the presence and absence of 5 nM PAR, concentrations that are observed in brain tissue (9). High molecular weight forms of α-syn in the absence of PAR were observed as early as 4 hours of incubation and α-syn continued to fibrillize with time (Fig. 4A). Different molecular weight forms of α-syn were observed at 72 hours. In the presence of PAR, the fibrillization of α-syn was markedly accelerated with different molecular weight forms of α-syn being observed as early as 24 hours of incubation (Fig. 4A). PAR accelerated the fibrilization of α-syn as indicated by thioflavin T fluorescence, while PAR alone had no effect (Fig. 4B). PAR caused the fibrilization of α-syn at lower temperatures then required for α-syn fibrillization in the absence of PAR (fig. S7A). At 12 hours α-syn fibrils were observed in the absence of PAR and were fully formed and extensive after 72 hours of agitation and incubation at 37˚ C (Fig. 4C). In contrast, in the presence of PAR, α-syn was extensively fibrillated at 12 hours and was more extensively fibrillated at 36 and 72 hours (Fig. 4C). We monitored the concentration dependence of fibrillization at 36 hours. 1 nM PAR enhanced α-syn fibrillization with peak aggregation occurring at 5 nM PAR while 20 nM PAR did not appreciably increase α-syn fibrillization (fig. S7, B and C). α-Syn was not PARylated by PARP-1 activity, but it bound to PAR through its N-terminal domain (fig. S8, A-C). In the α-syn PFF injected mouse brain, about 20 % of α-syn was PAR-bound (fig. S8, D and E). Because PAR is a highly negatively charged molecule, we tested the effects of another highly charged polymer, PolyA. α-Syn failed to interact with PolyA and it had no effect on α-syn fibrillization (fig. S7, D-F). ADP ribose monomer also failed to interact with α-syn and had no effect on α-syn fibrillization (fig. S7, D-F). To determine whether endogenous PAR formation accelerate α-syn fibrillization, primary mouse cortical neurons overexpressing WT human α-syn following AAV-α-syn transduction were treated with a toxic dose of N-methyl-D-aspartate (NMDA). In WT cultures NMDA treatment activated PARP and lead to a concomitant aggregation of α-syn, while α-syn did not aggregate in PARP-1 KO cultures treated with NMDA (Fig. 4D). Exogenous administration of PAR via Bioporter (9) increased the aggregation of α-syn in both WT and PARP-1 KO cultures transduced with AAV-α-syn (fig. S9A). Thus, PAR, not PARP-1, can directly increase α-syn aggregation. Two different PARP inhibitors, ABT-888 and AG-014699, prevented α-syn aggregation and PARP activation in response to NMDA administration (Fig. 4E). In SH-SY5Y neuroblastoma cells the potent PARP activator N-methyl-N’-nitro-N-nitrosoguanidine (MNNG) enhanced the aggregation of overexpressed WT or A53T α-syn, while MNNG had no effect in PARP-1 KO SH-SY5Y cells (fig. S9, B and C). Exogenous administration of PAR increased the aggregation of α-syn in both SH-SY5Y WT and SH-SY5Y PARP-1 KO cultures (fig. S9D). Two different PARP inhibitors, ABT-888 and AG-014699, prevented α-syn aggregation and PARP activation in response to MNNG administration in SH-SY5Y cells (fig. S9E). Thus, PAR seeds and accelerates α-syn aggregation.
Fig. 4. PAR accelerates α-syn fibrillization in vitro.
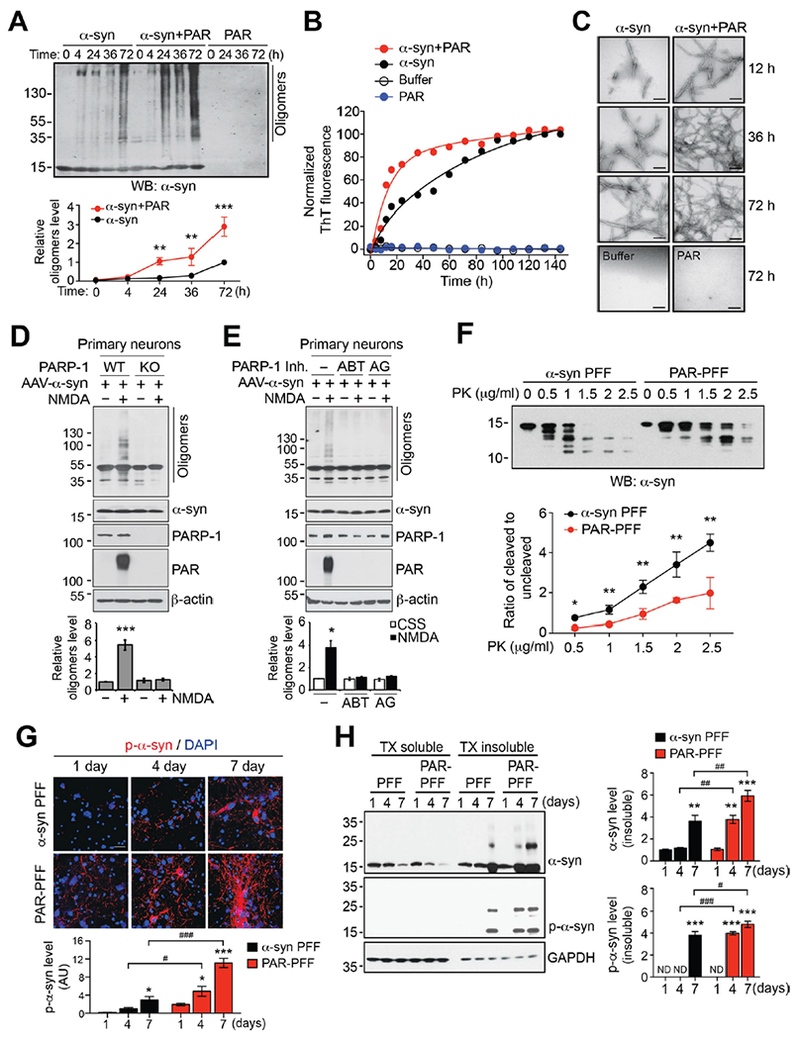
(A) Acceleration of α-syn fibrillization by PAR. Monomeric α-syn either with or without 5 nM purified PAR was incubated at 37° C for indicated times. Fibrillization of α-syn was detected by immunoblotting using α-syn antibody. Data are mean ± s.e.m. Two-way ANOVA followed by Tukey’s post hoc test (n=3). (B) The rate of formation of α-syn fibrils either with or without PAR was monitored by thioflavin T fluorescence (n=3). (C) Representative transmission electron microscopy (TEM) images for α-syn fibrils. Scale bar, 200 nm. (D and E) Suppression of NMDA-induced α-syn fibrillization in (D) PARP-1 KO neurons and by (E) PARP inhibitors. Primary cortical neurons from WT or PARP-1 KO embryos were transduced with AAV-α-syn and then further incubated with 500 μM NMDA for 5 min. 10 μM ABT-888 or 1 μM AG-014699 for 1 h was pre-treated for 1 h. The α-syn fibrillization was detected by western blot analysis 6 h after NMDA treatment. (F) α-syn PFF or PAR-α-syn PFF was incubated with increasing concentration of PK (0-2.5 μg/ml) and immunoblotted with α-syn antibody (top). Quantification represents the ratio of cleaved to uncleaved α-syn (bottom). Data are mean ± s.e.m. (bottom). Unpaired two-tailed student t test in each concentration of PK (n=3). (G) Representative immunostaining and quantification of p-α-syn (red) in primary cortical neurons treated with α-syn PFF or PAR-α-syn PFF for 1, 4 and 7 days. Bars represent mean ± s.e.m. Two-way ANOVA followed by Tukey’s post hoc test (n=3). Scale bar, 20 μm. (H) Primary cortical neurons treated with α-syn PFF or PAR-α-syn PFF were sequentially extracted with 1% TX-100 (TX soluble) and 2% SDS (TX insoluble). Lysates were subjected to immunoblotting using α-syn, p-α-syn, and GAPDH antibodies. Bars represent mean ± s.e.m. Two-way ANOVA followed by Tukey’s post hoc test (n=3). ND, not detected. *P < 0.05, **P < 0.005, ***P < 0.0005 as compared to α-syn PFF for 1 day. #P < 0.05, ##P < 0.005, ###P < 0.0005.
PAR promotes formation of more toxic α-syn PFF strains
To determine whether PAR changes the biophysical properties of α-syn PFF, a series of biochemical analysis were conducted using α-syn PFF and α-syn PFF in the presence of PAR (PAR-α-syn PFF). First, proteinase K (PK) digestion of α-syn PFF was performed and monitored by α-syn immunoblots. α-syn PFF and PAR-α-syn PFF showed very distinct banding patterns after PK digestion, with PAR-α-syn PFF’s being more resistant to increasing concentrations of PK (Fig. 4F). PAR-α-syn PFF showed predominantly an undigested band of α-syn (1st band) with comparable digested bands only at higher concentration of PK, while α-syn PFF degraded into smaller fragments (2nd to 5th band) at lower concentration of PK (0.5 and 1 μg/ml) and these bands became predominant at higher concentrations of PK (1.5-2.5 μg/ml) (Fig. 4F). Epitope specific antibodies to α-syn revealed that PAR rendered the majority of the α-syn regions resistant to PK digestion (fig. S10A). The resistance to PK digestion of PAR-α-syn PFF suggests that PAR induces the formation of a distinct α-syn PFF strain with a more misfolded and compact structure than α-syn PFF. We then compared the α-syn PFF and PAR-α-syn PFF-induced neuronal cell death in cultured neurons. After 14 days of treatment, cell death was enhanced in cultures treated with PAR-α-syn PFF as compared to that with α-syn PFF (fig. S10B). PAR itself did not cause significant cell death even at a higher concentration (20 nM) (fig. S10B). To further confirm the potencies of neuropathology, p-α-syn immunoreactivity was monitored after treatment with varying concentrations of α-syn PFF or PAR-α-syn PFF. P-α-syn immunoreactivity was observed at 20 ng of PAR-α-syn PFF at an equivalent level to 500 ng of α-syn PFF, suggesting the PAR modification of α-syn PFF increased toxicity by 25 fold (fig. S10, C and D). PAR-α-syn PFF significantly increased p-α-syn immunoreactivity at higher concentrations (fig. S10, C and D). Phospho-α-syn immunoreactivity at different time points was also monitored in cultured neurons exposed to α-syn PFF or PAR-α-syn PFF. In the absence of PAR, α-syn PFF treatment leads to barely detectable p-α-syn immunoreactivity 1 day post treatment, while PAR-α-syn PFF treatment leads to detectable levels of p-α-syn immunoreactivity as early as 1 day post treatment and markedly enhances immunoreactivity at 7 days (Fig. 4G). Aggregated and phosphorylated α-syn were detectable at 4 days, while in the absence of PAR these species of α-syn were only detectable after 7 days of treatment (Fig. 4H). In the presence of PAR there was an increase in the aggregated form of α-syn (Fig. 4H). We then compared the cell-to-cell transmission of α-syn PFF and PAR-α-syn PFF in neuronal cultures transduced with AAV-α-syn (fig. S11). The exosomal secretion (18) of PAR-induced α-syn oligomers by NMDA treatment was significantly increased in WT neurons, but not in PARP-1 KO neurons or in WT neurons with treatment of a PARP inhibitor (fig. S11, A and B). PAR-α-syn PFF was enriched in the endosome-enriched fraction and propagation of pathologic p-α-syn was enhanced in recipient cells as compared to those of α-syn PFF (fig. S11, C-F). Thus, PAR converts pathologic α-synuclein to a more misfolded compact toxic strain.
PAR-α-syn PFF strain is more neurotoxic in vivo
To determine whether the PAR-α-syn PFF strain exhibits enhanced neurotoxicity in vivo, a single intrastriatal injection of PAR-α-syn PFF (5 μg) was compared to that of α-syn PFF (5 μg). We observed a trend toward the loss of DA neurons ipsilateral to the injection side of SNpc after one month and a significant loss of DA neurons after 3 months following PAR-α-syn PFF injection, while α-syn PFF injection had no effect at these time points (Fig. 5, A and B, and fig. S12A). Six months after PAR-α-syn PFF or α-syn PFF injection there was no significant difference in the loss of DA neurons (Fig. 5, A and B, and fig. S12A). There was no significant loss of DA neuron contralateral to the injection side at any time point (fig. S12, B and C). PAR injection by itself had no effect on DA neuron number (Fig. 5, A and B, and fig. S12A). PAR-α-syn PFF also accelerated the loss of striatal DA and its metabolites with significant reductions in DA and its metabolites 1 month after the PAR-α-syn PFF injection in contrast to α-syn PFF (Fig. 5E and fig. S13). Three and 6 months after PAR-α-syn PFF or α-syn PFF injection there was no significant difference in the loss of DA and its metabolites (Fig. 5E and fig. S13). TH and DAT levels were also reduced after PAR-α-syn PFF compared to α-syn PFF three months after the injection, while there was no difference in the degree of loss at 6 months (fig. S14, A and B). α-syn pathology as assessed by immunostaining for p-α-syn in DA neurons was increased by PAR-α-syn PFF compared to α-syn PFF at 3 months and 6 months after injection (Fig. 5, C and D). PAR-α-syn PFF caused a deficit on the pole test at 3 months consistent with loss of DA neurons and DA deficits at 3 months, whereas there were no significant deficits in α-syn PFF or PAR injected mice (Fig. 5F and fig. S14C). Both forelimb plus hindlimb and forelimb grip strength were also reduced in PAR-α-syn PFF, but not α-syn PFF or PAR inject mice at 3 months (Fig. 5G and fig. S14D). At 6 months there was no significant difference in the behavioral deficits induced by PAR-α-syn PFF or α-syn PFF (Fig. 5, F and G, and fig. S14, C and D). Thus, PAR-α-syn PFF are substantially more neurotoxic then α-syn PFF in vivo.
Fig. 5. PAR-α-syn PFF strains are more neurotoxic in vivo.
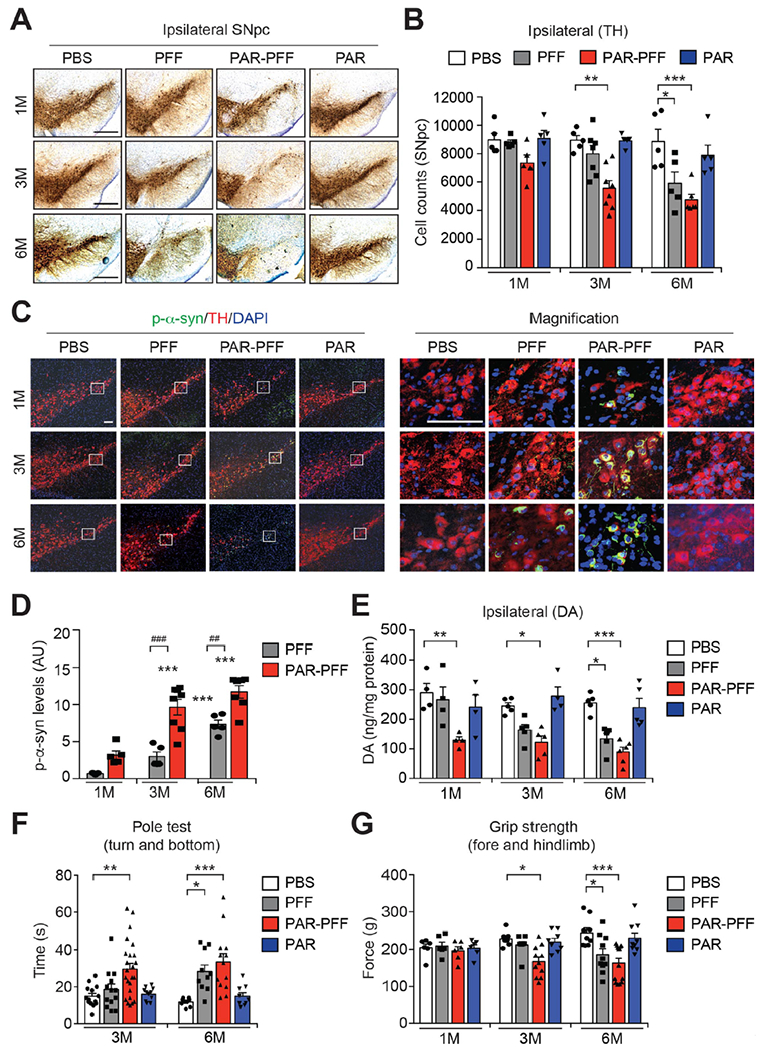
(A) Representative TH and Nissl staining of SNpc DA neurons of WT mice at 1, 3, and 6 months after instrastriatal PBS, α-syn PFF, PAR-α-syn PFF, or PAR injection. Scale bar, 400 μm. (B) Stereological counts. Bars represent mean ± s.e.m. Two-way ANOVA followed by Tukey’s post hoc test (n=5 to 8 mice per group). (C) Representative p-α-syn immunostaining in the SNpc of WT mice at 1, 3, and 6 months after instrastriatal PBS, α-syn PFF, PAR-α-syn PFF, or PAR injection. Scale bar, 100 μm. (D) Quantification of p-α-syn levels. Bars represent mean ± s.e.m. Two-way ANOVA followed by Tukey’s post hoc test (n=5 to 8 mice per group). (E) DA concentrations in the striatum of PBS, α-syn PFF, PAR-α-syn PFF, or PAR-injected mice at 1, 3, and 6 months measured by HPLC. Bars represent mean ± s.e.m. Two-way ANOVA followed by Tukey’s post hoc test (n=4 to 6 mice per group). (F and G) Behavioral abnormalities of PBS, α-syn PFF, PAR-α-syn PFF, or PAR-injected mice at 1, 3, and 6 months measured by pole test (F, n=9 to 24 mice per group) and grip strength test (G, n=6 to 14 mice per group). Data are the means ± s.e.m. Two-way ANOVA followed by Tukey’s post hoc test.
Increased levels of PAR in the CSF of PD patients
To determine whether PAR plays a role in patients with PD, PAR levels were monitored in the cerebrospinal fluid (CSF) of patients with PD versus controls (Table S1 and S2) using a sensitive ELISA for PAR (fig. S15A). PAR levels were elevated in PD patients compared to controls in two independent patient cohorts (Fig. 6, A and E). Interestingly, one of cohorts showed a positive correlation between PAR levels and either disease duration or progression (Fig. 6, B-D and F-H). As previously reported, PAR levels were increased in the substantia nigra of patients with PD compared to controls (19) (fig. S15, B and C, and Table S3).
Fig. 6. Increase of PAR levels in CSF of PD patients.
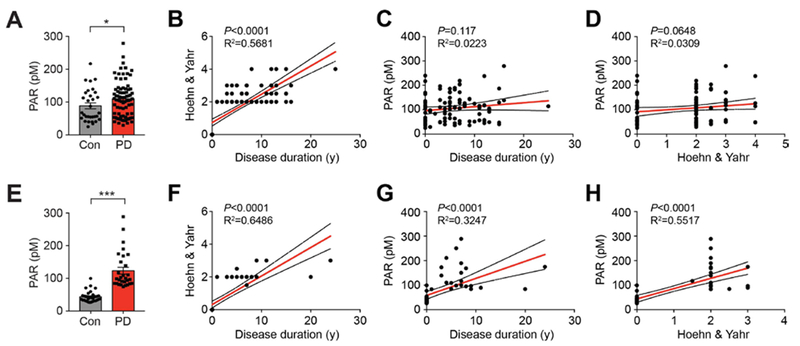
(A and E) Increase of PAR in CSF of PD patients. The levels of PAR in CSF of healthy controls (A; n=31, E; n=33) and PD patients (A; n=80, E; n=21) were determined by PAR ELISA. Bars represent mean ± s.e.m. Student t test with Welch’s correction (A) and Mann-Whitney test (E). *,#P < 0.05, ***P < 0.0005. (B and F) Correlation analysis between disease duration and Hoehn & Yahr. (C and G) Correlation analysis between disease duration and PAR levels. (D and H) Correlation analysis between Hoehn & Yahr and PAR levels in the two independent patient cohorts used in Fig. 6, A and E.
Discussion
Our results indicate that α-syn PFF kills neurons both in vitro and in vivo via activation of PARP-1 in a cell death process designated parthanatos (20). Knockout of PARP-1 and inhibition of PARP prevents the neurodegeneration and behavioral deficits initiated by an intrastriatal α-syn PFF injection. Activation of parthanatos seems to be the primary driver of α-syn PFF neurodegeneration since necroptosis and autophagy inhibitors had no effect on α-syn PFF neurotoxicity and there is only modest protection by caspase inhibition. It is known that α-syn PFF induce inflammatory mediator activation (21, 22), which likely contributes, in part, to cell death and accounts for the modest neuroprotection by the broad spectrum caspase inhibitor, Z-VAD. It will be important in future studies to explore the role of caspase activation, neuroinflammation and neurodegeneration induced by α-syn PFF.
For the studies reported here we used 5 μg/ml of α-syn PFF or PAR-α-syn PFF for the primary neuronal culture experiments, which represents a concentration of approximately 340 nM in monomeric equivalents. The actual concentration of α-syn PFFs would be lower. Because α-syn is thought to represent approximately 1% of soluble brain protein (23) its monomeric concentration is estimated be in the low micromolar range in brain. The concentration of higher order species of α-syn, which is not known, would be lower in the brain. For both the primary neuronal cultures and the intrastriatal injections 5 μg of α-syn PFF or PAR-α-syn PFF was used for each experiment. Because the concentrations used for these and related studies are within the range of the concentration of monomeric α-syn in the brain, the concentration of α-syn PFF or PAR-α-syn PFF is likely to be within the range of the concentration of higher orders species of α-syn in the brain. Providing some specificity to these experiments is the observation that the concentration of α-syn PFF used here and in other studies has no toxicity in the absence of endogenous α-syn (2, 4).
Recent studies have identified conformational variants of α-syn strains that exhibit distinct neurotoxicity, seeding abilities and propagation, which contribute to different properties of α-synucleinopathies (24, 25). Given that α-syn PFF induces PARP activation and PAR accumulation, PAR then accelerates α-syn fibrillization and changes the biochemical properties of α-syn PFF converting it to a more toxic strain. Consistent with this notion PAR-α-syn PFF shows an approximate 25 fold increase in α-syn aggregation and neurotoxicity compared to the parental α-syn PFF. Moreover PAR-α-syn PFF-injected mice show an accelerated disease progression and phenotype compared to α-syn PFF injected mice.
In addition to PAR levels being increased in cultured neurons and mouse brain, PAR levels in PD are elevated in the substantia nigra and in the CSF. The elevation of PAR in the CSF and brains of PD patients and evidence of PARP activation in the substantia nigra of PD patients suggests that PARP activation contributes to the pathogenesis of PD through parthanatos and conversion of α-syn to a more toxic strain. In future studies it will important to determine whether the increase of PAR in CSF from human PD correlates with disease severity or progression. Moreover, it will be important to determine whether it can serve as a theranostic biomarker for disease modifying therapies. Because PARP inhibitors are currently being used clinically as synergizing agents in the treatment of cancer (26) they could be considered for disease modification in PD (6).
Materials and Methods
Animal
C57BL/6 WT and PARP-1 KO mice were obtained from the Jackson Laboratories (Bar Harbor, ME). The littermates of WT and PARP-1 KO mice were used in experiments. All housing, breeding, and procedures were performed according to the NIH Guide for the Care and Use of Experimental Animals and approved by Johns Hopkins University Animal Care and Use Committee.
Preparation of α-syn PFF and PAR-α-syn PFF
Recombinant mouse α-syn proteins were purified as previously described (5). α-syn PFF were prepared in PBS by constantly agitating α-syn with a thermomixer (1,000 rpm at 37° C) (Eppendorf, Hamburg, Germany). After 7 days of incubation, the α-syn aggregates were diluted to 0.1 mg/ml with PBS and sonicated for 30 s (0.5 sec pulse on /off) at 10 % amplitude (Branson Digital Sonifier, Danbury, CT). Synthesis and purification of PAR polymer were performed as described (27). PAR-α-syn PFF was prepared by adding 5 nM or indicated dose of PAR in α-syn fibrillization reaction.
Stereotaxic injection of α-syn PFF
Two to 3-month-old WT and PARP-1 KO mice were deeply anesthetized with a mixture of ketamine (100 mg/kg) and xylazine (10 mg/kg). PBS, α-syn PFF (5 μg), PAR-α-syn PFF (5 μg) or PAR was unilaterally injected into striatum (2 μl per hemisphere at 0.4 μl/min) with the following coordinates: anteroposterior (AP) = +0.2 mm, mediolateral (ML) = + 2.0 mm, dorsoventral (DV) = +2.8 mm from bregma. After the injection, the needle was maintained for an additional 5 min for a complete absorption of the solution. After surgery, animals were monitored and post-surgical care was provided. Behavioral tests were performed 1, 3 and 6 months after injection and mice were euthanized for biochemical and histological analysis. For biochemical studies, tissues were immediately dissected and frozen at −80° C. For histological studies, mice were perfused with PBS and 4 % PFA and brains were removed, followed by fixation in 4% PFA overnight and transfer to 30% sucrose for cryoprotection.
Thioflavin T (ThT) binding assay
α-syn fibrillization with or without PAR was monitored with ThT fluorescence. Aliquots of 5 ul from the incubation mixture were taken at various time points, diluted to 100 ul with 25 uM ThT in PBS, and incubate for 10 min at room temperature. The fluorescence was recorded at 450 nm excitation and 510 nm emission using SpectraMax plate reader (Molecular Devices, Sunnyvale, CA). The experiments were performed in triplicate.
Transmission electron microscopy (TEM) measurements
α-syn PFF or PAR-α-syn PFF were adsorbed to glow discharged 400 meshed carbon coated copper grids (Electron Microscopy Sciences, Hatfield, PA) for 2 min, quickly washed twice with Tris-HCl (50 mM, pH 7.4), and floated upon two drops of 0.75% uranyl formate for 30 s each. The grids were allowed to dry before imaging on a Phillips CM 120 TEM operating at 80 kV. The images were captured and digitized with an ER-80 CCD (8 megapixel) by advanced microscopy techniques.
Intracellular delivery of PAR
Purified PAR was intracellularly delivered using BioPORTER (Genelnatis, San Diego, CA) according to the manufacturer’s instructions (9). PAR polymer was diluted to desired concentration with PBS. The diluted solution was added to the dried BioPORTER reagent and mixed gently, followed by incubation at room temperature for 5 min. The BioPORTER-PAR complex was added to cell culture after a wash in serum-free media and incubated for 3-4 h at 37° C. Cultures were subsequently used for experiments.
Tissue lysate preparation and western blot analysis
Human post mortem brain (Table S3) or mouse brain tissue were homogenized and prepared in lysis buffer [50 mM Tris-HCl (pH 7.4), 150 mM NaCl, 1 mM EDTA, 1 % Triton x-100, 0.5 % SDS, 0.5 % sodium-deoxycholate, phosphatase inhibitor mixture I and II (Sigma-Aldrich, St. Louis, MO), and complete protease inhibitor mixture (Roche, Indianapolis, IN)], using a Diax 900 homogenizer (Sigma-Aldrich). After homogenization, samples were rotated at 4 °C for 30 min for complete lysis, the homogenate was centrifuged at 15,000 × g for 20 min and the supernatants were used for further analysis. Protein levels were quantified using the BCA assay (Pierce, Rockford, IL), samples were separated using SDS-polyacrylamide gels and transferred onto nitrocellulose membranes. The membranes were blocked with 5 % non-fat milk in TBS-T (Tris-buffered saline with 0.1 % Tween-20) for 1 h, probed using primary antibodies (Table S4) and incubated with appropriate HRP-conjugated secondary antibodies (Cell signaling, Danvers, MA). The bands were visualized by ECL substrate.
Immunoprecipitation (IP), overlay, and in vitro ribosylation assay of PAR
The deletion mutants of α-syn-GFP were generated using site-directed mutagenesis (Agilent, Santa Clara, CA) according to the manufacturer’s instructions. SH-SY5Y cells were transfected with either α-syn-GFP or its deletion mutants by Polyfect (Qiagen, Hilden, Germany) for 36 h and then further incubated with 50 μM MNNG for 15 min. The cells were washed 2 times with PBS and harvested with lysis buffer [50 mM Tris-HCl (pH 7.4), 150 mM NaCl, 1 mM EDTA, 1 % Triton x-100, 0.5 % SDS, 0.5 % sodium-deoxycholate, phosphatase inhibitor mixture I and II (Sigma-Aldrich), and complete protease inhibitor mixture (Roche)]. The supernatants after centrifugation at 15,000 × g for 20 min were used for measuring the protein concentration by BCA assay. The same amount of proteins were incubated with anti-PAR antibody (Table S4) overninght at 4 °C, followed by incubation with PureProteome kappa Ig binder magnetic beads (Millipore, Burlington, MA) for 3 h at 4 °C. The IP complexes were washed 5 times with IP buffer and then denatured by boiling for 5 min after adding 2x Laemlli Buffer plus β-mercaptoethanol. For the PAR overlay assay, the equal amount of BSA or purified α-syn protein was spotted onto a nitrocellulose membrane. The membranes were washed once with TBS-T buffer and air-dried, followed by incubation with biotin-labeled PAR polymer for 1 h at room temperature in TBS-T buffer. After washing 3 times in TBS-T buffer, the membranes were blocked with 5 % non-fat milk for 1 h, probed using anti-PAR antibody. The bands were visualized by ECL substrate. For PARP-1 in vitro ribosylation assay, 1 μg of recombinant PARP-1, activated DNA and NAD+ (Trevigen, Gaithersburg, MD) in the presence or absence of indicated concentration of PARP inhibitors were incubated in PARP assay buffer (Trevigen) for 30 min at room temperature. For substrate ribosylation assay of PARP-1, we used 2 or 10 μg of purified α-syn and histone 2B (Abcam) protein in the same condition.
Endosome and exosome enrichment
Endosomes were enriched to detect internalized α-syn-biotin PFF as previously described (5). Primary cultured neurons from WT or PARP-1 KO were incubated with α-syn-biotin PFF for 1.5 h, followed by adding trypsin to remove the membrane-bound α-syn-biotin PFF. After washing with PBS, neurons were harvested and lysed using a syringe 20 time in lysis buffer [250 mM sucrose, 50 mM Tris-HCl (pH 7.4), 5 mM MgCl2, 1mM EDTA, 1mM EGTA] with a complete protease inhibitor mixture (Roche). The last pellet containing the endosomes were used for immunoblot analysis after sequential centrifugation at 1000 × g for 10 min, 16,000 × g for 20 min, and 100,000 × g for 60 min at 4° C). Exosomes were enriched to detect secreted α-syn as previously described (18). Culture supernatants of primary cortical neurons transduced with AAV-α-syn followed by incubated with 500 μM NMDA for 5 min were collected and spun at 300 × g for 10 min to remove cells. The supernatants were then sequentially centrifuged at 2000 × g for 10 min, 10,000 × g for 30 min, and 100,000 × g for 90 min at 4 °C). The last pellet containing exosomes was washed once with PBS and centrifuged again at 100,000 × g for 90 min. The remaining pellet was resuspended with lysis buffer.
Cell culture, transfection, primary neuronal culture and treatment
SH-SY5Y cells (ATCC, Manassas, VA) were cultured in DMEM containing 10 % fetal bovine serum and penicillin/streptomycin at 37 °C under 5% CO2. The cells were transfected using PolyFect reagent (Qiagen) according to the manufacturer’s instructions. Primary cortical neurons from WT or PARP-1 KO embryos were prepared as described previously (28). Briefly, the primary cortical neurons were cultured at embryonic day 16 in neurobasal media supplemented with B-27, 0.5 mM L-glutamine, penicillin and streptomycin (Invitrogen, Carlsbas, CA). ABT-888 (1 or 10 μM), AG-014699 (1 μM), BMN 673 (1 or 10 μM), Z-VAD (10 μM), Nec-1 (10 μM) or 3-MA (500 μM) was applied to neurons 1 h before α-syn PFF treatment. The neuron culture media was replaced with fresh medium alone or including cell death inhibitors every 3-4 days. α-syn PFF were added at 7 days in vitro (DIV) and further incubated for indicated times followed by cell death assay or biochemical experiments. Primary neurons were infected with AAV9-control sgRNA or AAV9-PARP-1 sgRNA (ViGene Biosciences, Rockville, MD), and AAV-α-syn WT or AAV-α-syn A53T at DIV 4-5.
Cell death and viability assessment
Primary cultured cortical neurons were treated with 5 μg/ml of α-syn PFF or PAR-α-syn PFF for 14 days. Percent of cell death was determined by staining with 7 μM Hoechst 33342 and 2 μM propidium iodide (PI) (Invitrogen). Images were taken and counted by Zeiss microscope equipped with automated computer assisted software (Axiovision 4.6, Carl Zeiss, Dublin, CA). After adding Alamar Blue (Invitrogen), cell viability was determined by fluorescence at excitation wavelength 570 nm and emission wavelength 585 nm (29).
Microfluidic chambers
Triple compartment microfluidic devices (TCND1000) were obtained from Xona Microfluidic, LLC (Temecula, CA). Glass coverslips were prepared and coated as described, before being affixed to the microfluidic device. Approximately 100,000 WT or PARP-1 KO neurons were plated per chamber individually. At 7 DIV, 5 μg/ml of α-syn PFF were added into chamber 1. To control for direction of flow, a 50 μl difference in media volume was maintained between chamber 1 and chamber 2 and chamber 2 and chamber 3 according to the manufacturers’ instructions. Neurons were fixed on day 14 after α-syn PFF treatment using 4 % paraformaldehyde in PBS. The chambers were then processed for immunofluorescence staining with p-α-syn antibody (Table S4).
Behavioral tests
The behavioral deficits in α-syn PFF injected WT or PARP-1 KO mice, α-syn PFF injected mice fed ABT-888, and α-syn PFF or PAR-α-syn PFF injected mice were assessed by the pole test and the grip strength test 1 week prior to sacrifice as the different cohorts. All the experiments were performed by investigators who are blind to genotypes or treatment condition and randomly allocated to groups.
Pole test.
A metal rod (75 cm long with a 9 mm diameter) wrapped with bandage gauze was used as the pole. Before the actual test, the mice were trained for two consecutive days and each training session consisted of three test trials. Mice were placed on 7.5 cm from the top of the pole and the time to turn and total time to reach the base of the pole were recorded. The end of test was defined as placing all 4 paws on the base. The maximum cutoff time to stop the test and recording was 60 s. After each trial, the maze was cleaned with 70% ethanol. In figure 3E, we used 4 males and 4 females for WT mice injected with PBS, 4 males and 3 females for WT mice injected with PFF, 3 males and 3 females for PARP-1 KO mice injected with PBS, and 5 males and 2 females for PARP-1 KO mice injected with PFF (Fig. 3E, left). We used 6 males and 5 females for PBS injected mice fed with chow, 16 males and 9 females for PFF injected mice fed with chow, 6 males and 6 females for PBS injected mice fed with ABT-888, and 15 males and 10 females for PFF injected mice fed with ABT-888 (Fig. 3E, right). In figure 5F, we used 7 males and 7 females for PBS, 8 males and 5 females for PFF, 13 males and 11 females for PAR-PFF, 6 males and 5 females for PAR-injected mice at 3 months, and 4 males and 5 females for PBS, 5 males and 5 females for PFF, 7 males and 6 females for PAR-PFF, 5 males and 4 females for PAR-injected mice at 6 months.
Grip strength test.
Neuromuscular function was measured by determining the maximal peak force developed by the mice using an apparatus (Bioseb, USA). Mice were placed onto a metal grid to grasp with either fore or both limbs that are recorded as ‘fore limb’ and ‘fore and hindlimb’, respectively. The tail was gently pulled and the force applied to the grid before the mice lose grip was recorded as the peak tension displayed in grams (g). In figure 3F, we used 4 males and 3 females for WT mice injected with PBS, 3 males and 3 females for WT mice injected with PFF, 3 males and 3 females for PARP-1 KO mice injected with PBS, and 5 males and 2 females for PARP-1 KO mice injected with PFF (Fig. 3F, left). We used 10 males and 8 females for PBS injected mice fed with chow, 18 males and 9 females for PFF injected mice fed with chow, 6 males and 6 females for PBS injected mice fed with ABT-888, and 19 males and 11 females for PFF injected mice fed with ABT-888 (Fig. 3F, right). In figure 5G, we used 3 males and 3 females for PBS, 3 males and 3 females for PFF, 3 males and 3 females for PAR-PFF, 3 males and 3 females for PAR-injected mice at 1 months, 4 males and 4 females for PBS, 4 males and 4 females for PFF, 6 males and 5 females for PAR-PFF, 4 males and 4 females for PAR-injected mice at 3 months, and 5 males and 4 females for PBS, 5 males and 5 females for PFF, 8 males and 6 females for PAR-PFF, 5 males and 4 females for PAR-injected mice at 6 months.
Dopamine and derivatives measurement using HPLC
Biogenic amine concentrations were measured by high-performance liquid chromatography with electrochemical detection (HPLC-ECD). The striatum was rapidly removed from the brain, followed by weighted and sonicated in ice cold 0.01 mM of perchloric acid containing 0.01 % EDTA. The 60 ng of 3,4-dihydroxybenzylamine (DHBA) was used as an internal standard. After centrifugation at 15,000 g for 30 min at 4° C, the supernatant was cleaned using a 0.2 μm filter and 20 μl of supernatant was analyzed in the HPLC column (3 mm × 150 mm, C-18 reverse phase column, AcclaimTM Polar Advantage II, Thermo Scientific) by a dual channel coulochem III electrochemical detector (Model 5300, ESA, Inc. Chelmsford, MA). The protein concentrations of tissue homogenates were measured using the BCA protein assay kit (Pierce). Data were normalized to protein concentrations and expressed in ng/mg protein.
Immunohistochemistry and immunofluorescence
Mice were perfused with PBS and 4 % PFA and brains were removed, followed by fixation in 4 % PFA overnight and transfer to 30 % sucrose for cryoprotection. Immunohistochemistry (IHC) and immunofluorescence (IF) was performed on 40 μm thick serial brain sections. Primary antibodies and working dilutions are detailed in Table S4. For histological studies, free-floating sections were blocked with 10 % goat serum in PBS with 0.2 % Triton X-100 and incubated with TH or p-α-syn antibodies followed by incubation with biotin-conjugated anti-rabbit or mouse antibody, respectively. After three times of washing, ABC reagent (Vector laboratories, Burlingame, CA) was added and the sections were developed using SigmaFast DAB peroxidase substrate (Sigma-Aldrich). Sections were counterstained with Nissl (0.09 % thionin). For the quantification, both TH- and Nissl-positive DA neurons from the SNpc region were counted by an investigator who was blind to genotypes or treatment condition with randomly allocated groups through optical fractionators, the unbiased method for cell counting, using a computer-assisted image analysis system consisting of an Axiophot photomicroscope (Carl Zeiss) equipped with a computer controlled motorized stage (Ludl Electronics, Hawthorne, NY), a Hitachi HV C20 camera, and Stereo Investigator software (MicroBright-Field, Williston, VT). The total number of TH-stained neurons and Nissl counts were analyzed as previously described(16). For immunofluorescent studies, double-labeled sections with TH and p-α-syn antibodies were incubated with a mixture of Alexa-fluor 488- and 594-conjugated secondary antibodies (Invitrogen). The fluorescent images were acquired by confocal scanning microscopy (LSM710, Carl Zeiss). All the images were processed by the Zen software (Carl Zeiss). The selected area in the signal intensity range of the threshold was measured using ImageJ software.
Nitric oxide (NO) measurement
NO levels were measured using NO assay kit (Abcam, Cambridge, MA) according to the manufacturer’s instructions. Briefly, the pellet of primary neurons or SNpc tissues were washed with ice-cold PBS, resuspended, and homogenized in ice-cold assay buffer. The supernatant after centrifugation at 16,000 × g for 5 min at 4° C were deproteinized and neutralized (pH 6.5-8) by adding 1M perchloric acid and 2M Potassium Hydroxide. After centrifugation at 13,000 × g for 15 min at 4°C, supernatant was reacted with nitrate reductase and cofactor at room temperature for 1 h to convert nitrate to nitrite. The amount of the azo compound converted from nitrite by Griess reagents were measured at OD540 nm.
Comet assay
Comet assay was performed according to the manufacturer’s instructions (Trevigen). Briefly, primary cortical neurons pre-treated with L-NAME (Sigma-Aldrich) followed by further incubated with α-syn PFF were washed with ice-cold PBS (Ca2+ and Mg2+ free), harvested, and resuspended in PBS at 1 × 10⁵ cells/ml. After combining with 1 % low melting point agarose in PBS at 42° C, 50 μl of the cell-agarose mixture was immediately placed on the Comet slide at 4° C in the dark for 30 min. Slides were lysed in lysis buffer and immersed with alkaline unwinding solution (200 mM NaOH, pH >13, 1 mM EDTA) for 1 hour at room temperature. After electrophoresis at 21 V for 30 min at 4° C, slides were rinsed twice with dH2O), fixed with 70 % ethanol for 5 min, and then stained with SYBR green for 5 min at 4° C. Images were captured using a Zeiss epifluorescent microscope (Axiovert 200M) and analyzed with the tail positive cells (% of total cells) and tail length (the length from the edge of the nucleus to the end of the comet tail).
Proteinase K (PK) digestion of α-syn PFF
PK digestion was performed as previously described (30). Ten micrograms of α-syn PFF or PAR-α-syn PFF were mixed with 0.5 to 2.5 μg/ml of PK in PBS and incubated at 37° C for 30 min. The reaction was stopped by adding 1 mM PMSF, boiled with SDS-sample buffer for 5 min. The bands of the PK digestion products were detected by immunoblotting using epitope-specific α-syn antibodies (Table S4).
Human CSF samples and PAR ELISA
Participants at the Johns Hopkins University site of the NINDS Parkinson’s Disease Biomarker Program (PDBP) underwent extensive clinical and cognitive testing and a lumbar puncture annually. The CSF was centrifuged, aliquoted, and stored at −80° C within one hour of acquisition at either the Cleveland Clinic Lou Ruvo Center for Brain Health Biobank (CBH-biobank) or Johns Hopkins University. Two different clones (#19 and #25) of monoclonal anti-PAR antibody were used for PAR ELISA. Anti-PAR antibody (capture antibody, clone #19) (5 μg/ml) was coated on 96-well microtiter plate (NUNC, Cat #46051), various concentration of purified PAR (0-200 nM, positive control) and CSF samples from either normal or PD patients were added to each well and incubated for 1 h at room temperature (RT). After washing the plates five times with PBST (0.05 % Tween20 in PBS buffer), the biotinylated PAR antibody (detection antibody, clone #25) was incubated for 1 h at RT. The color change was detected via HRP-conjugated streptavidin antibody (Thermo Scientific). Our assay can detect the PAR as low as 3 pM and is saturated at 50 nM.
Statistical analysis
All data are represented as mean ± s.e.m. with at least 3 independent experiments. Statistical analysis was performed using GraphPad Prism 7. Differences between 2 means and among multiple means were assessed by unpaired two-tailed student t test and ANOVA followed by Tukey’s post hoc test, respectively. The distribution of data from human CSF samples were assessed with D’Agostino & Pearson omnibus normality test and non-normally distributed data were analyzed with nonparametric test (Mann-Whitney test). Assessments with P < 0.05 were considered significant.
Supplementary Material
ACKNOWLEDGEMENTS
We thank I.-H. Wu for graphic art assistance, Dr. Hao Gu, for collecting data and writing assistance, N. Yoritomo and M. Gudavalli for assistance in patient recruitment and biospecimen collection and to the patients and families that volunteer and participate in research.
Funding: This work was supported by grants from the NIH/NINDS P50NS38377, R37NS067525, NS082205, U01NS082133, U01NS097049 and the JPB Foundation. UO1 NS100610 and the Jane and Lee Seidman Fund to J.B.L. The authors acknowledge the joint participation by the Adrienne Helis Malvin Medical Research Foundation through its direct engagement in the continuous active conduct of medical research in conjunction with The Johns Hopkins Hospital and the Johns Hopkins University School of Medicine and the Foundation’s Parkinson’s Disease Programs M-2016. T.M.D. is the Leonard and Madlyn Abramson Professor in Neurodegenerative Diseases.
Footnotes
Competing interests: J.L.B. consulting for Acadia Pharmaceuticals, Avid Radiopharmaceuticals, Axovant, Bracco Radiopharmaceuticals, Eisai, GE Healthcare, Takeda. T.M.D. is a member of the a member of the Board of Directors of the Bachmann Strauss Dystonia and Parkinson’s Disease Foundation, a member of the Executive Scientific Advisory Board of Michael J. Fox Foundation for Parkinson’s Research, a consultant and advisor to Sun Pharma Advanced Research Company Ltd., and serves on the advisory council of Aligning Science Across Parkinson’s. These arrangements have been reviewed and approved by the Johns Hopkins University in accordance with its conflict of interest policies.
T.-I.K., L.R., S.A.A.,V.L.D. and T.M.D have filed a U.S. patent entitled “Detection of PAR in the CSF of Patients with Parkinson’s Disease.”
Data and materials availability: All data are available in the manuscript or the supplementary material.
Supplementary Materials:
Figures S1 to S15
Tables S1 to S4
REFERENCES AND NOTES
- 1.Baba M et al. , Aggregation of alpha-synuclein in Lewy bodies of sporadic Parkinson’s disease and dementia with Lewy bodies. The American journal of pathology 152, 879–884 (1998). [PMC free article] [PubMed] [Google Scholar]
- 2.Volpicelli-Daley LA et al. , Exogenous alpha-synuclein fibrils induce Lewy body pathology leading to synaptic dysfunction and neuron death. Neuron 72, 57–71 (2011). [DOI] [PMC free article] [PubMed] [Google Scholar]
- 3.Fujiwara H et al. , alpha-Synuclein is phosphorylated in synucleinopathy lesions. Nat Cell Biol 4, 160–164 (2002). [DOI] [PubMed] [Google Scholar]
- 4.Luk KC et al. , Pathological alpha-synuclein transmission initiates Parkinson-like neurodegeneration in nontransgenic mice. Science 338, 949–953 (2012). [DOI] [PMC free article] [PubMed] [Google Scholar]
- 5.Mao X et al. , Pathological alpha-synuclein transmission initiated by binding lymphocyte-activation gene 3. Science 353, (2016). [DOI] [PMC free article] [PubMed] [Google Scholar]
- 6.Berger NA et al. , Opportunities for the repurposing of PARP inhibitors for the therapy of non-oncological diseases. Br J Pharmacol 175, 192–222 (2018). [DOI] [PMC free article] [PubMed] [Google Scholar]
- 7.Dawson TM, Dawson VL, Mitochondrial Mechanisms of Neuronal Cell Death: Potential Therapeutics. Annu Rev Pharmacol Toxicol 57, 437–454 (2017). [DOI] [PMC free article] [PubMed] [Google Scholar]
- 8.Sisay M, Edessa D, PARP inhibitors as potential therapeutic agents for various cancers: focus on niraparib and its first global approval for maintenance therapy of gynecologic cancers. Gynecol Oncol Res Pract 4, 18 (2017). [DOI] [PMC free article] [PubMed] [Google Scholar]
- 9.Andrabi SA et al. , Poly(ADP-ribose) (PAR) polymer is a death signal. Proc Natl Acad Sci U S A 103, 18308–18313 (2006). [DOI] [PMC free article] [PubMed] [Google Scholar]
- 10.Yu SW et al. , Mediation of poly(ADP-ribose) polymerase-1-dependent cell death by apoptosis-inducing factor. Science 297, 259–263 (2002). [DOI] [PubMed] [Google Scholar]
- 11.Swiech L et al. , In vivo interrogation of gene function in the mammalian brain using CRISPR-Cas9. Nat Biotechnol 33, 102–106 (2015). [DOI] [PMC free article] [PubMed] [Google Scholar]
- 12.Fatokun AA, Dawson VL, Dawson TM, Parthanatos: mitochondrial-linked mechanisms and therapeutic opportunities. Br J Pharmacol 171, 2000–2016 (2014). [DOI] [PMC free article] [PubMed] [Google Scholar]
- 13.Zhang J, Dawson VL, Dawson TM, Snyder SH, Nitric oxide activation of poly(ADP-ribose) synthetase in neurotoxicity. Science 263, 687–689 (1994). [DOI] [PubMed] [Google Scholar]
- 14.Kim MY, Zhang T, Kraus WL, Poly(ADP-ribosyl)ation by PARP-1: ‘PAR-laying’ NAD+ into a nuclear signal. Genes Dev 19, 1951–1967 (2005). [DOI] [PubMed] [Google Scholar]
- 15.Bonner WM et al. , GammaH2AX and cancer. Nat Rev Cancer 8, 957–967 (2008). [DOI] [PMC free article] [PubMed] [Google Scholar]
- 16.Karuppagounder SS et al. , The c-Abl inhibitor, nilotinib, protects dopaminergic neurons in a preclinical animal model of Parkinson’s disease. Sci Rep 4, 4874 (2014). [DOI] [PMC free article] [PubMed] [Google Scholar]
- 17.Altmeyer M et al. , Liquid demixing of intrinsically disordered proteins is seeded by poly(ADP-ribose). Nat Commun 6, 8088 (2015). [DOI] [PMC free article] [PubMed] [Google Scholar]
- 18.Emmanouilidou E et al. , Cell-produced alpha-synuclein is secreted in a calcium-dependent manner by exosomes and impacts neuronal survival. J Neurosci 30, 6838–6851 (2010). [DOI] [PMC free article] [PubMed] [Google Scholar]
- 19.Lee Y et al. , Parthanatos mediates AIMP2-activated age-dependent dopaminergic neuronal loss. Nat Neurosci 16, 1392–1400 (2013). [DOI] [PMC free article] [PubMed] [Google Scholar]
- 20.Galluzzi L et al. , Molecular mechanisms of cell death: recommendations of the Nomenclature Committee on Cell Death 2018. Cell Death Differ, (2018). [DOI] [PMC free article] [PubMed] [Google Scholar]
- 21.Codolo G et al. , Triggering of inflammasome by aggregated alpha-synuclein, an inflammatory response in synucleinopathies. PLoS One 8, e55375 (2013). [DOI] [PMC free article] [PubMed] [Google Scholar]
- 22.Wang W et al. , Caspase-1 causes truncation and aggregation of the Parkinson’s disease-associated protein alpha-synuclein. Proc Natl Acad Sci U S A 113, 9587–9592 (2016). [DOI] [PMC free article] [PubMed] [Google Scholar]
- 23.Iwai A et al. , The precursor protein of non-A beta component of Alzheimer’s disease amyloid is a presynaptic protein of the central nervous system. Neuron 14, 467–475 (1995). [DOI] [PubMed] [Google Scholar]
- 24.Brundin P, Melki R, Prying into the Prion Hypothesis for Parkinson’s Disease. J Neurosci 37, 9808–9818 (2017). [DOI] [PMC free article] [PubMed] [Google Scholar]
- 25.Peng C, Gathagan RJ, Lee VM, Distinct alpha-Synuclein strains and implications for heterogeneity among alpha-Synucleinopathies. Neurobiol Dis 109, 209–218 (2018). [DOI] [PMC free article] [PubMed] [Google Scholar]
- 26.Lord CJ, Ashworth A, PARP inhibitors: Synthetic lethality in the clinic. Science 355, 1152–1158 (2017). [DOI] [PMC free article] [PubMed] [Google Scholar]
- 27.Affar EB et al. , Immunological determination and size characterization of poly(ADP-ribose) synthesized in vitro and in vivo. Biochim Biophys Acta 1428, 137–146 (1999). [DOI] [PubMed] [Google Scholar]
- 28.Kam TI et al. , FcgammaRIIb-SHIP2 axis links Abeta to tau pathology by disrupting phosphoinositide metabolism in Alzheimer’s disease model. Elife 5, (2016). [DOI] [PMC free article] [PubMed] [Google Scholar]
- 29.Wang Y et al. , A nuclease that mediates cell death induced by DNA damage and poly(ADP-ribose) polymerase-1. Science 354, (2016). [DOI] [PMC free article] [PubMed] [Google Scholar]
- 30.Guo JL et al. , Distinct alpha-synuclein strains differentially promote tau inclusions in neurons. Cell 154, 103–117 (2013). [DOI] [PMC free article] [PubMed] [Google Scholar]
Associated Data
This section collects any data citations, data availability statements, or supplementary materials included in this article.