

Abstract
Background:
Unconditional probability of dying because of four major non-communicable diseases (NCDs) between 30 and 70 years of age is the selected global indicator to measure the impact of NCD prevention and control programs.
Objective:
To calculate the unconditional probability of dying and age-specific mortality rate because of major NCDs in India from 2001 to 2013.
Methods:
This study used multiple data sources that are available in the public domain—Census 2001 and 2011, Sample Registration System, causes of death reports in 2001–03, 2004–06, and 2010–13. Unconditional probability of dying between ages 30 and 70 years during 2001, 2006, and 2013 was calculated by the formula suggested by the World Health Organization. Line graphs were used to depict time trends in age-specific mortality rates over the years in four major NCDs (cardiovascular diseases, cancer, diabetes, and chronic respiratory diseases).
Results:
The age-specific mortality rate because of four NCDs showed a decrease of 51 deaths per 100,000 population from 2001 to 2013. Of the four NCDs, age-specific mortality rate was highest in cardiovascular diseases (238.2/100,000 population) and least in diabetes mellitus (21.9/100,000 population); it was 76.3 and 58.2/100,000 population for cancer and chronic respiratory diseases, respectively. The probability of dying was very less and was almost the same from 30 to 44 years of life and increased steeply after that till 70 years of life; and it was more in males (24%) compared with females (17.4%).
Conclusion:
Although India has shown a decreasing trend in premature mortality because of NCDs in the past decade, the rate of decrease is not on par to achieve the global “25 × 25” target.
KEY WORDS: Age-specific mortality rate, non-communicable disease, probability of dying
Introduction
Non-communicable diseases (NCDs) would significantly account for the increase in global mortality in the future with a projected 15% increase in the current decade (2010–20). Among the World Health Organization (WHO) regions, the South East Asian Region (SEAR) is projected to account for the highest number of deaths because of NCDs, with about 10.4 million deaths in the year 2020.[1]
Most of the countries have recognized that NCDs pose a significant public health problem and require specific attention. This has led to initiation of NCD prevention and control programs.[1] But many countries did not have monitoring or evaluation components in their national policies and plans. In 2013, WHO adopted a comprehensive global monitoring framework (GMF) for the prevention and control of NCDs which included a set of nine voluntary targets to be achieved by 2025.[2] Thus, all countries committed to achieving a 25% reduction in premature mortality from NCDs by 2025.
In low- and middle-income (LMIC) countries, about half of the deaths that occur because of NCDs happen in less than 70-year-olds compared with only about one-fourth of deaths because of NCDs under 70 years in high-income countries.[1] Premature deaths lead to a huge economic impact because of loss of productivity.[3] Hence, unconditional probability of dying between 30 and 70 years of age was selected as a global indicator to measure impact of NCD prevention and control programs.[2] The first estimate of this indicator was reported for WHO regions from a modeling study in the year 2010.[4] In 2015, at the South Asian Association for Regional Cooperation (SAARC) meet, India stressed that studies should be conducted to estimate the baseline values of each NCD target using the existing resources.[5,6]
Hence, using the available national data on mortality in India, unconditional probability of dying because of four major NCDs [cardiovascular diseases (CVD), cancer, diabetes, and chronic respiratory diseases] was estimated in the age group of 30 and 70 years from 2001 to 2013.
Materials and Methods
This study used multiple data sources that are available in the public domain. We have accessed the demographic data from census of India for years 2001 and 2011. The census of India, conducted every 10 years, is the largest census done globally and covers the whole population of the country. The age, gender, and area-specific mortality rates were obtained from the Sample Registration System (SRS).[7,8] The SRS is done every year to provide demographic indicators and vital statistics in India since the year 1970. The causes of death data were obtained from the causes of death reports from SRS.[9,10] The 2001–03 cause of death study had covered a total of 113,692 deaths and the 2010–13 study had covered 182,827 deaths making it the largest study in ascertaining the cause of death available in India.[9,10] The SRS causes of death study had covered all the states and union territories of India and used WHO-suggested post death verbal autopsy instrument to ascertain the cause of death. The classification of deaths was done according to the International Classification of Disease, tenth revision (ICD-10). The ICD-10 codes used in the causes of death reports in 2001–03 and 2010–13 are shown in Table 1.[9,10]
Table 1.
NCD categories and the corresponding ICD-10 codes adopted in the causes of death reports in 2001-03 and 2010-13
| NCD category | 2001, ICD-10 codes | 2013, ICD-10 codes |
|---|---|---|
| Malignant and other neoplasms | C00–C97, D00–D48 | C00–C45, C47–C97, D00–D48, N60, N62–N64, N87, R59 |
| Diabetes mellitus | E10–E14 | E10–E14 |
| Neuro-psychiatric conditions | F01–F99, G06–G73, G90–G99 | F00–F09, F11–F52, F54–F99, G10–G44, G47–G80, G90–G99, R26–R29, R40–R49, R56, R90 |
| Cardiovascular diseases | I00–I52, I60–I69, I70–I99, G81–83, R96 | G45–G46, G81–G83, I00–I28, I31, I34–I38, I42–I84, I86–I99, R00–R01, R03, R55, R96* |
| Respiratory diseases | J30–J99 | J30–J31, J33–J35, J37–J64, J66–J84, J90–J99, R04–R06, R84, R91 |
| Digestive diseases | K20–K23, K25–K31, K35–K38, K40–K67, K70–K93 | B18, F10, I85, K20–K60, K62–K63, K66, K70–K80, K82–K93, R10–R19, R63, R85, X45, Y15, Y90, Y91 |
| Genito-urinary diseases | N00-N64, N75-N99 | N00–N08, N11–N29, N31–N33, N35–N40, N42–N48, N50–N51, N75–N86, N88–N99, R30–R39, R80, R82, R86, R87 |
| Congenital anomalies | Q01–Q99 | Q00–Q99 |
| Other NCDs† | D55–D89, E03–E07, E15–E16, E20–E35, E51–E89, H00–H62, H68–H95, K00–K14, L00–L99, M00–M02, M05–M09, M11–M14, M20–M36, M60–M99 | D55–D63, D65–D83, D86–D89, E03–E07, E15–E16, E20–E35, E65–E90, H00–H06, H11–H59, H61–H62, H69, H72–H95, K00–K01, K03, K06–K14, L05, L10–L99, M02–M54, M61–M85, M87–M99, R20–R23, R70–R74, R76–R77, R81 |
NCD: Non-communicable disease, ICD-10=International Classification of Disease, tenth revision. *R96: sudden deaths are in “perinatal conditions” (when age <1 year), in “cardiovascular diseases” (when age >30 years) and else in “ill-defined conditions” †Musculoskeletal diseases were classified separately under NCDs in 2001-03 but were included in “Other NCDs category” in 2010-13
The age- and gender-wise comparison of the population in 2001 and 2011, obtained from the census data, was presented as population pyramid. As there was not much difference in the age and sex distribution between the two population pyramids, for this study the population in 2011 census data was considered as a standard reference population.[11]
To estimate the number of deaths because of NCDs, the total population was taken from the census data, and the crude death rate was obtained from SRS reports of years 2001 and 2013. Crude death rate was multiplied by the total population to get the number of total deaths occurring because of all causes. The proportion of deaths caused because of NCDs was obtained from report on causes of deaths in India in 2001–03 and 2010-13. The number of deaths because of NCDs was then obtained by multiplying the proportion mortality rate because of NCDs with the number of deaths occurred.
The total number of deaths and NCD deaths were estimated for less than 14, 15–44, 45–69, and 70 years and above for years 2001 and 2013. The 5-year age categories’ mortality death rates of both 2001 and 2013 were applied to the 2011 census population, and the number of deaths in the 5-year age groups was calculated as shown in the equation. Similarly, the proportional mortality rate because of NCDs in 2001 and 2013 was applied and deaths because of NCDs were calculated. At the end, the number of deaths in the considered four age groups was calculated as shown in the equation below:[12]
DNCD=∑Pi*ASDRi*Ni
DNCD = total number of deaths because of NCDs
Pi = total number of population in the age group interval “i”
ASDRi = age-specific death rate in the age group interval “i”
Ni = proportion of deaths contributed by NCDs in the age group interval “i”
Similarly, the total number of deaths because of NCDs and the relative change in mortality between the urban and rural and also male and female were calculated. Age-specific mortality rates between ages 30 and 70 years from CVDs, cancer, diabetes, and chronic respiratory diseases (four major NCDs) in India during 2001, 2006, and 2013 were estimated. The age group of 30–70 years was categorized at 5-year intervals, and crude death rates for each interval obtained from SRS reports were applied to get the number of deaths in each category. The proportional mortality rate of cancer, CVDs, diabetes, and chronic respiratory diseases was applied separately, and the number of deaths because of each of these diseases was calculated. Finally, the total number of deaths was added in each interval to obtain the number of deaths caused because of each of the four diseases in the age group of 30–70 years and was divided by the total population in the age group and was expressed as the number of deaths per 100,000 population. This was calculated separately for the years 2001, 2006, and 2013 using the respective crude death rates and disease-specific proportional mortality rates.[9,10,13]
We also estimated the combined mortality rate of the four NCDs considered by adding up the deaths caused by all the four diseases. This was also calculated separately for males and females using gender-specific data of population, crude death rate, and also disease-specific proportional mortality rate.[12]
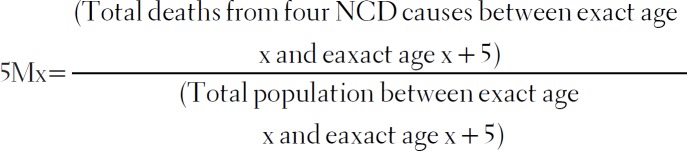
Unconditional probability of dying between ages 30 and 70 years from CVD diseases, cancer, diabetes, or chronic respiratory diseases (four NCD causes) during 2001, 2006, and 2013 was calculated by the formula suggested by the WHO. We first calculated age-specific mortality rate for each 5-year age group between 30 and 70 years. We then translated the 5-year death rate to the probability of death in each 5-year age range using the following equation:[12]
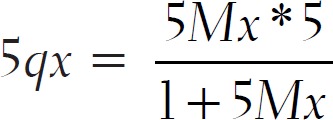
We then calculated unconditional probability of death from ages 30 to 70 using the below equation:[12]
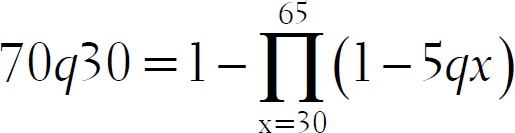
This unconditional probability of dying between ages 30 and 70 years from four NCD causes in India during 2001, 2006, and 2013 was calculated for the total population, males and females separately in this age group.
Data analysis
All the required data needed for the study were entered in Microsoft Excel 2010. All the required calculations were made by creating formulae in Microsoft Excel 2010. NCD proportional mortality rate and probability of dying because of NCDs were expressed as percentage. Age-specific mortality rate was reported as the number of deaths per 100,000 population. Line graphs were used to depict time trend in age-specific mortality rates over the years in four major NCDs and also the change in probability of dying at 5-year age intervals.
Results
The total population according to 2011 census was 1,210,854,977. By applying the overall crude death rates of 8.4 in the year 2001 and 7.0 in the year 2013, we observed that there were 10,171,182 and 8,475,985 deaths, respectively. The NCD proportionality death rate was 42.4 and 49.2 in the years 2001 and 2013, respectively. Thus, there were 4,312,581 deaths in 2001 and 4,170,185 deaths in 2013 caused because of NCDs. There was an overall decrease of 3.4% in the deaths caused because of NCDs in the year 2013 compared with that in the year 2001 [Tables 2 and 3]. It was seen that there was a 3% increase in deaths because of CVDs, 2% increase in deaths because of digestive diseases, and 1% increase in deaths because of diabetes. There was a decrease in deaths caused because of respiratory diseases (4.8%) and cancer (1%) [Table 4].
Table 2.
The estimated number of deaths because of NCDs and the decrease in deaths because of NCDs among different age groups in India from 2001 to 2013
| Age group (years) | Standard reference total Population (2011 census)* | Total number of deaths† | Total number of deaths because of NCDs† | Relative decrease in mortality because of NCDs/100,000‡ | ||
|---|---|---|---|---|---|---|
| 2001 | 2013 | 2001 | 2013 | |||
| 0-14 | 372,444,116 | 2,590,855 | 1,422,044 | 187,610 | 147,397 | 21,434 |
| 15-44 | 579,538,383 | 1,617,148 | 1,205,330 | 536,039 | 495,094 | 7,638 |
| 45-69 | 214,652,326 | 3,355,645 | 2,724,696 | 2,119,645 | 1,901,560 | 10,289 |
| ≥70 | 39,730,350 | 3,226,994 | 3,384,207 | 1,765,165 | 1,648,109 | 6,631 |
NCD: Non-communicable disease, SRS: Sample Registration System, *Persons with unknown age have been excluded †Calculated using the 5-year interval age-specific crude death rates obtained from SRS reports 2001 and 2013 and the corresponding age-specific NCD proportional mortality rate obtained from report on causes of deaths in India in 2001-03 and 2010-13. ‡Calculated by the ratio between the difference in deaths between 2013 and 2001 divided by number of deaths occurred in 2001 multiplied by 100,000
Table 3.
Gender- and area-wise estimated number of deaths among males and females because of NCDs and the decrease in deaths because of NCDs in India from 2001 to 2013
| Gender/area | Standard reference total population (2011 census) | Crude death rate (/1000 population)* | Proportion of deaths because of NCDs† | Total number of deaths | Total number of deaths because of NCDs | Relative decrease in mortality because of NCDs/100,000‡ | ||||
|---|---|---|---|---|---|---|---|---|---|---|
| 2001 | 2013 | 2001 | 2013 | 2001 | 2013 | 2001 | 2013 | |||
| Male | 623,270,258 | 8.8 | 7.5 | 45.0 | 51.8 | 5,484,778 | 4,674,527 | 2,468,150 | 2,421,405 | 1,894 |
| Female | 587,584,719 | 8.0 | 6.4 | 39.1 | 45.8 | 4,700,678 | 3,760,542 | 1,837,965 | 1,722,328 | 6,292 |
| Rural | 833,748,852 | 9.1 | 7.5 | 39.7 | 46.9 | 7,587,115 | 6,253,116 | 3,012,084 | 2,932,711 | 2,635 |
| Urban | 377,106,125 | 6.3 | 5.6 | 55.7 | 57.0 | 2,375,769 | 2,111,794 | 1,323,303 | 1,203,723 | 9,037 |
NCD: Non-communicable disease, *Obtained from SRS reports 2001 and 2013 †Obtained from report on causes of deaths in India in 2001-03 and for 2010-13 ‡Calculated by the ratio between the difference in deaths between 2013 and 2001 divided by number of deaths occurred in 2001 multiplied by 100,000
Table 4.
Distribution of NCD deaths in different NCD categories during 2001 and 2013 in India (number of deaths calculated to the total population according to census 2011)
| NCD category* | 2001, n | 2013, n |
|---|---|---|
| Malignant and other neoplasms | 579,757 | 517,035 |
| Diabetes mellitus | 152,568 | 194,948 |
| Neuro-psychiatric conditions | 132,225 | 93,236 |
| Cardiovascular diseases | 1,912,182 | 1,974,905 |
| Respiratory diseases | 884,893 | 652,650 |
| Digestive diseases | 335,649 | 415,323 |
| Genito-urinary diseases | 193,253 | 220,376 |
| Congenital anomalies | 61,027 | 50,856 |
| Other NCDs | 61,027 | 50,856 |
| Total deaths | 4,312,581 | 4,170,185 |
NCD: Non-communicable disease, *Categories is as per the causes of deaths report 2010-13, India
The age-specific mortality rate in the age group of 30–70 years because of four NCDs shows a decrease of 51 deaths per 100,000 population from 2001 to the year 2013. Of the four NCDs, age-specific mortality rate was highest in CVDs (238.2/100,000 population) and least in diabetes mellitus (21.9/100,000 population) as on 2013 [Figure 1]. The unconditional probability of dying in the age group of 30–70 years because of four NCDs also has a decline of 3% in the same period. The probability of dying was very less and almost same from 30 to 44 years of life and increased steeply after that till 70 years of life. The probability of dying was more in males (24%) compared with females (17.4%) as on 2013. The decreasing trend was noted to be similar in both the genders [Table 5 and Figure 2].
Figure 1.
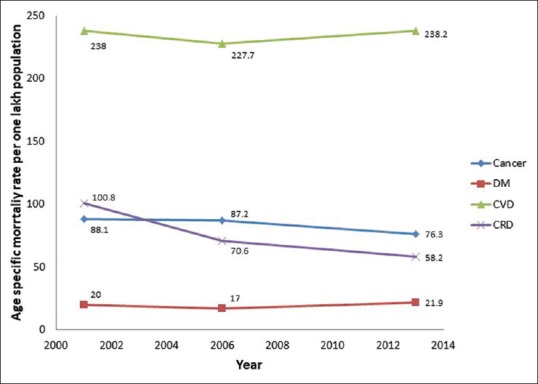
Age-specific mortality rate between ages 30 and 70 years from cardiovascular diseases (CVD), cancer, diabetes mellitus (DM), and chronic respiratory diseases (CRD) in India during 2001, 2006, and 2013
Table 5.
Unconditional probability of dying and age-specific mortality rate between ages 30 and 70 years from cardiovascular diseases, cancer, diabetes, and chronic respiratory diseases (four NCD causes) in India during 2001, 2006, and 2013
| Year | Age-specific mortality rate between 30 and 70 years because of four NCD causes (per 100,000 population) | Probability of dying between 30 and 70 years because of four NCD causes (expressed as %) | ||||
|---|---|---|---|---|---|---|
| Total | Male | Female | Total | Male | Female | |
| 2001 | 447.6 | 520.2 | 373.9 | 23.71 | 27.36 | 19.97 |
| 2006 | 402.5 | 469.2 | 339.2 | 21.26 | 24.73 | 18.11 |
| 2013 | 394.5 | 462.9 | 325.4 | 20.76 | 24.01 | 17.40 |
NCD:Non-communicable disease
Figure 2.

Unconditional probability of dying between ages 30 and 70 years at 5-year age intervals from cardiovascular diseases (CVD), cancer, diabetes mellitus (DM), and chronic respiratory diseases (CRD) in India during 2001, 2006, and 2013
Discussion
This study intended to capture the changes in NCD mortality from 2001 to 2013 based on various indicators. We found that there was an overall decrease in NCD mortality by 3.4% in 2013 compared with 2001. Age-specific mortality rate in the age group of 30 and 70 years from the four major NCDs was 51/100,000 population, with CVDs being the highest contributor among the four NCDs. The unconditional probability of dying was found to be 20.8% as on 2013 with males found to be at a higher risk.
Absolute number of deaths because of NCDs
Our study estimated the number of deaths that occurred because of NCDs (census 2011 population as a reference) which shows that actually there is a decrease in the number of deaths caused because of NCDs as a whole by 3.4% in the same reference period. As this result was obtained after taking age-specific mortality and the corresponding NCD proportional mortality rates in 2001 and 2013, it is expected to be a better indicator of the performance of health systems in India with regard to NCDs. Although the result is contrasting, it shows that the work toward decreasing NCD mortality has started but still a lot has to be done to achieve the targets set by WHO. This study also showed that the deaths have decreased in almost all the age groups with highest reduction in the age group between 0 and 14 years and least between 15 and 44 years. The study also finds that the decrease in deaths because of NCDs was much higher in females and also in urban areas. Thus, it put forward the need to improve health systems in rural areas with special concentrated efforts on NCDs and also interventions targeting men between 15 and 44 years of age, which is the need of the hour.
We also calculated the proportion of deaths contributed by each of the NCDs keeping the calculated number of deaths with reference population as denominator. It was found that there was a marginal increase in mortality because of CVDs (about 3%) and digestive diseases (about 4%) with other diseases showing an increase or decrease by around 1%–2% only. This shows an importance to detect the CVD risks early and start effective interventions at community level rather than individual risk approach as advised by WHO so as to reduce mortality because of CVDs.
Unconditional probability of dying between ages 30 and 70 years from CVDs, cancer, diabetes, and chronic respiratory diseases
The WHO “Global framework for NCD monitoring” set nine targets to be achieved by 2025. These targets were mainly set to decrease the global mortality because of four main NCDs. The unconditional probability of dying between 30 and 70 years of age is the indicator for the first target which calls for a 25% reduction in mortality because of the four main NCDs by the year 2025.[2]
The probability of dying between 30 and 70 years of age as of 2009 was found to be 39% for the SEAR.[14] A modeling study has showed that the probability of dying between the ages of 30 and 70 years from the four main NCDs in 2010 was 29% men and 21% in women in southeast Asia.[4] The WHO NCD country profiles’ report (2014) has calculated the probability of dying between ages 30 and 70 years from the four main NCDs for all the countries. Among the 11 SEAR countries, India stands next only to Korea with 26% probability of dying because of four major NCDs in 30–70 years age group.[5] This value is much higher than the value obtained in our study (20.8%). This may be because of the fact as stated in the report that the estimates were not done using any national-level mortality data. The results of this study thus provide more credibility as the estimate is based on national-level mortality reports. This can be used as the baseline level to assess the country's progress in terms of decreasing premature NCD mortality.
The probability of dying was found to be more in males, which can be attributed to the increased prevalence of risk factors among males especially tobacco and alcohol use. The steep increase in the probability of dying after the age of 44 years gives us an understanding that there is a spurt in these four NCDs after the age of 44 years and is at a level where mortality is difficult to avert. Thus, the importance of early diagnosis of these NCDs and effective management is to be established. Unless these measures are ensured throughout the country among all different sections of population, it may be difficult to achieve the global target by India in the near future.
As reported by WHO, 25% relative reduction in premature mortality over 15 years was calculated keeping 2% annual reduction with compounding for 15 years.[2] The study results show that there is only 2% reduction in probability of dying in 12 years because of the four major NCDs in the age group of 30 and 70 years. Although this is an experience from previous decade wherein the programs for NCDs were in their infancy and would take some time to show effects. This huge gap has to be covered with immediate effects so as to not lag behind the global target. One of the many steps taken by the Government of India is the introduction of the National Program for Prevention and Control of Cancer, Diabetes, Cardiovascular diseases and Stroke (NPCDCS) in 2010. This has a provision of an NCD clinic to be established in all functioning primary health centers (PHCs) in India, where treatment is provided free of cost. It also has a referral link to higher centers for management of complications. Although this program is in the implementation phase, it is expected to cover all the districts in the near future.[15] India has also taken many initiatives to act at the risk factor-level management especially against tobacco use by setting up a “National Tobacco Control Program” which is scaled up to 53 districts over 29 states in 2013–14. This program is set to be expanded to all the districts in a phased manner during the 12th Five-Year Plan.[16] The experience from the best performing countries over the period of 1980–2010 has shown very substantial declines in mortality because of NCDs can be achieved, and that the proposed target is achievable.[14] India needs to strengthen the existing programs especially at the PHC level so that the target can be achieved.
Age-specific mortality rate between ages 30 and 70 years from CVDs, cancer, diabetes, and chronic respiratory diseases
Although probability of dying because of four major NCDs is the selected indicator to measure the premature mortality because of NCDs, we feel it also has certain limitations. Since the reduction in one of the four NCDs may be masked by the increase in another, it may not be a useful guide to select targeted interventions. Thus, in this study we have tried to calculate age-specific mortality rate between the age groups of 30 and 70 years for each of the four main NCDs to check for the progress in the 12 years of study reference period (2001–13). Although age-specific mortality rates were calculated in the past, this is the first attempt to calculate in this standard age group as suggested by WHO. This study also captured that age-specific mortality rates were higher among males. The trend in the 12 years show a major decrease in mortality because of chronic respiratory diseases, and also a positive decline is seen among cancer [Figure 1]. But an increasing trend was noted in CVDs and diabetes which suggests that efforts need to be focussed on these two diseases and effective strategies need to be adopted to make this a declining trend in future.
The study has few strengths. This is the first study from SEAR country to calculate the national-level results on probability of dying because of four NCDs in the age group of 30 and 70 years. This study has also calculated age-specific mortality rates for the four major NCDs in the same age group and has identified that it can be used as a process indicator for the first NCD global target.
This study has few limitations. First, as we have concentrated on calculating first NCD global target, the other major causes of NCD mortality such as road traffic injuries and stroke were not evaluated. Second, as we have used country-level reports to estimate the deaths and calculate the indicators, the inherent flaws in country-wide reports could not be addressed. In calculating the probability of dying because of four major NCDs, WHO suggests that disaggregation of data based on place of residence, socio-economic status, and gender will add more value to the indicator. Although this study calculated disaggregate data by gender, it was not able to disaggregate in the other two suggested variables because of the lack of available data. We would thus recommend that the reports in future can be given according to the domains as asked by the WHO so that calculations can be done for further global comparisons and also to draw further implications from the indicator.
Conclusion
Although India has shown a decreasing trend in premature mortality because of NCDs in the past decade, the rate of decrease is not on par to achieve the global “25 × 25” target. Age-specific mortality rates because of each of the major four NCDs in the age group of 30 and 70 years can be used as a process indicator so as to monitor the progress and also to formulate interventions accordingly. This study calls for setting up of national-level NCD targets for 2025 based on the current existing scenario in India.
Financial support and sponsorship
Nil.
Conflicts of interest
There are no conflicts of interest.
References
- 1.World Health Organization. Global status report on noncommunicable diseases. Geneva: WHO; 2010. [Last accessed on 2018 Mar 17]. Available from: http:// apps.who.int/iris/bitstream/10665/44579/1/9789240686458_eng. pdf . 2011. Internet. [Google Scholar]
- 2.World Hea lth Organiza t ion. NCD global monit o r ing framework [Internet] Geneva: WHO; 2013. [Last accessed on 2018 Mar 17]. cited 2018 Mar 17. Available from: http://www.who.int/nmh/global_monitoring_ framework/2013-11-06-who-dc-c268-whp-gap-ncds-techdoc-def3. pdf?ua=1 . [Google Scholar]
- 3.Bloom DE, Cafiero-Fonseca ET, Candeias V, Adashi E, Bloom L, Gurfein L, et al. Economics of non-communicable diseases in India: The costs and returns on investment of interventions to promote healthy living and prevent, treat, and manage NCDs [Internet] World Economic Forum. 2014. [Last accessed on 2018 Mar 17]. Available from: http://www3.weforum. org/docs/WEF_EconomicNonCommunicableDiseasesIndia_ Report_2014.pdf .
- 4.Kontis V, Mathers CD, Bonita R, Stevens GA, Rehm J, Shield KD, et al. Regional contributions of six preventable risk factors to achieving the 25 × 25 non-communicable disease mortality reduction target: A modelling study. Lancet Glob Health. 2015;3:e746–57. doi: 10.1016/S2214-109X(15)00179-5. [DOI] [PubMed] [Google Scholar]
- 5.World Health Organization. Noncommunicable diseases country profiles 2014 [Internet] Geneva: WHO; 2014. [Last accessed on 2018 Mar 17]. Available from: http:// apps.who.int/iris/bitstream/10665/128038/1/9789241507509_eng. pdf . [Google Scholar]
- 6.Ministry of Health and Family Welfare. Meeting of Health Ministers of SAARC Countries [Internet] New Delhi: Press Information Bureau, Government of India; 2015. [Last accessed on 2018 Mar 17]. Available from: http://pib.nic.in/newsite/ mbErel.aspx?relid=118623 . [Google Scholar]
- 7.Central Bureau of Health Intelligence. Estimated age (by sex) specific death rates in India 2001 [Internet] New Delhi: DGHS, MoHFW, India; 2001. [Last accessed on 2018 Mar 17]. Available from: http://cbhidghs.nic.in/ writereaddata/linkimages/209_20044907270910.pdf . [Google Scholar]
- 8.Registrar General of India. SRS statistical report 2013 [Internet] New Delhi: Census of India: Sample Registration System; 2013. [Last accessed on 2018 Mar 17]. Available from: http://www.censusindia.gov.in/vital_statistics/ SRS_Report_2013/12._SRS_Statistical_Report_2013-Detailed_Tables. xlsx . [Google Scholar]
- 9.Registrar General of India. Causes of death in India 2001-2003. Censu of India: Sample Registration System, MoHFW, India. 2009 [Google Scholar]
- 10.Registrar General of India. Causes of death in India 2010-2013 [Internet] New Delhi: Census of India: Sample Registration System; 2015. [Last accessed on 2018 Mar 17]. Available from: http://www.censusindia.gov.in/vital_statistics/VA_Report_2010-2013_Release.xlsx . [Google Scholar]
- 11.Registrar General of India. Census 2011: Five year age group data—C-14 tables (India/States/UTs/District) (Total, SC/ ST)) [Internet] New Delhi: Census of India: Population Enumeration Data; 2011. [Last accessed on 2018 Mar 17]. Available from: http://www.censusindia.gov. in/2011census/C-series/c-14/DDW-0000C-14.xls . [Google Scholar]
- 12.World Health Organization. Noncommunicable diseases global monitoring framework: Indicator definitions and specifications [Internet] Geneva: WHO; 2013. [Last accessed on 2018 Mar 17]. Available from: http:// www.who.int/nmh/ncd-tools/indicators/GMF_Indicator_Definitions_ FinalNOV2014.pdf?ua=1 . [Google Scholar]
- 13.Causes of death in India 2004-2006 [Internet] New Delhi: Census of India: Sample Registration System; 2007. [Last accessed on 2018 Mar 17]. Available from: http://www.censusindia.gov.in/vital_statistics/ consolidated_DATA_2004-6_FINAL.pdf . Registrar General of India. [Google Scholar]
- 14.World Health Organization. Revised WHO Discussion Paper: A comprehensive global monitoring framework including indicators and a set of voluntary global targets for the prevention and control of noncommunicable diseases [Internet] Geneva: WHO; 2012. [Last accessed on 2018 Mar 17]. Available from: http://www.who.int/nmh/events/2012/discussion_ paper3.pdf . [Google Scholar]
- 15.National Program for Prevention and Control of Cancer, Diabetes, Cardio Vascular Diseases and Stroke (NPCDCS): Operational guidelines (revised: 2013-17) New Delhi: Directorate General of Health Services Ministry of Health & Family Welfare, Government of India; 2013. Ministry of Health and Family Welfare. [Google Scholar]
- 16.Press release—December 2013 [Internet] New Delhi: Press Information Bureau, Governmen of India; 2013. [Last accessed on 2018 Mar 17]. Ministry of Health and Family Welfare. Available from: http://pib.nic.in/newsite/PrintRelease. aspx?relid=102221 . [Google Scholar]