

Abstract
Somatic mosaicism in the human brain may alter function of individual neurons. We analyzed genomes of single cells from the forebrains of three human fetuses (15 to 21 weeks post-conception) using clonal cell populations. We detected 200–400 single nucleotide variations (SNVs) per cell. SNV patterns resembled those found in cancer cell genomes, indicating a role of background mutagenesis in cancer. SNVs with a frequency of >2% in brain were shared with the spleen, revealing a pre-gastrulation origin. We reconstructed cell lineages for the first five post-zygotic cleavages and calculated a mutation rate of ~1.3 per division per cell. Later in development, during neurogenesis, the mutation spectrum shifted towards oxidative damage and the mutation rate increased. Both neurogenesis and early embryogenesis exhibit drastically more mutagenesis than adulthood.
One-sentence summary (no more than 15 words, no acronyms, don’t repeat the title):
Hundreds of oxidative damage-related somatic mutations per cells accumulate during neurogenesis.
General-reader summary (non-technical, no more than 100 words, no acronyms):
Mutations accumulate in human cells during development and after birth. We showed that hundreds of mutations are present in each fetal brain cell at midterm pregnancy. Mutagenesis is higher during brain development than during the first few cell divisions of the human embryo right after conception and both are drastically higher than during adulthood. The signature of mutations during brain growth is related to damage by oxygen.
Somatic mutagenesis is one of the emerging areas of vertebrate genome biology. Several studies revealed extensive genomic mosaicism marked by hundreds of single nucleotide variants (SNVs) per cell in somatic tissues of the human body such as skin fibroblasts, intestine, liver, and colon (1–3). Mosaic copy number alterations and insertions of retrotransposable elements are also common (4–10). Mosaicism is prominent in the central nervous system, with implications for brain evolution and the genomic underpinnings of human neuropsychiatric disorders (11, 12). Roughly 1500 SNVs might be present in mature neurons from the adult human cortex, only detectable in the analyzed cell and thought to be related to transcriptional activity (13). However, the temporal origin of these SNVs during development is unknown. Furthermore, the use of in vitro whole genome amplification (WGA) from single nuclei is prone to experimental artifacts mimicking SNVs (14, 15). Here we describe the discovery and analysis of mosaic SNVs in neuronal progenitor cells in three fetal human brains. Individual progenitor cells were allowed to proliferate into clonal cell populations, which provided insights into the genomes of the founder cells (Fig. S1) and provide an estimation of the frequency and mutation spectrum of mosaic mutations in human development avoiding WGA-associated artifacts.
Discovery and validation of mosaic SNVs
Brains were collected from phenotypically normal postmortem human fetuses ranging in age from 15 to 21 weeks post-conception. Based on comparing counts of germline SNVs (3809591 for subject 316, 4316547 for subject 320, and 3746847 for subject 275) to those derived by the 1000 Genomes Project across different human sub-population, we concluded that subjects 316 and 275 were of non-African origin, whereas subject 320 (male, 17 pcw) was of African descent.
From a bulk culture of dissociated cells of the VZ/SVZ of the frontal cortex (FR), parietal cortex (PA) or basal ganglia (BG), we grew 31 single cell derived clonal cell populations each containing few thousand cells, using the limiting dilution approach. Few possible divisions prior to dilution are not likely to contribute significantly to the mutation landscape in each cell. DNA extracted from the individual clones, the source tissue of germinal zones, and the spleen was sequenced to a minimum of 30X genome coverage (Fig. S1). For 3 clones we could not derive enough cells, hence DNA was amplified by multi-displacement amplification (MDA) before sequencing.
Mosaic SNVs present in the founder cell of the clones were discovered by comparing genomes of clones to each other and to genomes of the germinal zone tissue and spleen (Table S1). We selected those calls with over 35% variant allele frequency (VAF) in clones as candidate mosaic SNVs. This limit was chosen to exclude mutations arising during culture, which should have a VAF of 25% or less. The distribution for the SNV discovery dataset is centered at around a VAF of 50% based on read depth, as expected for true mosaic variants (Figs. S1 and S2).
When comparing clones to each other, we filtered the resulting calls based on conformity of their recurrence to clones that are expected and are not expected to carry the same mosaic SNVs (Fig. S3). Calls from such clone-to-clone comparisons were 98.9% concordant with calls from comparing clones to VZ/SVZ brain tissue or spleen (Fig. 1a). However, among 68 calls made exclusively from clone-to-clone comparison, 31 (46%) were missed from clone-to-brain tissue or clone-to-spleen comparisons because they corresponded to SNVs present in tissues at high frequency (Fig. 1c), demonstrating the advantage of the clone-to-clone comparison approach. Therefore, the clone-to-clone comparison represents an alternative design for the study of mosaicism to the use of familial trios (1).
Figure 1.
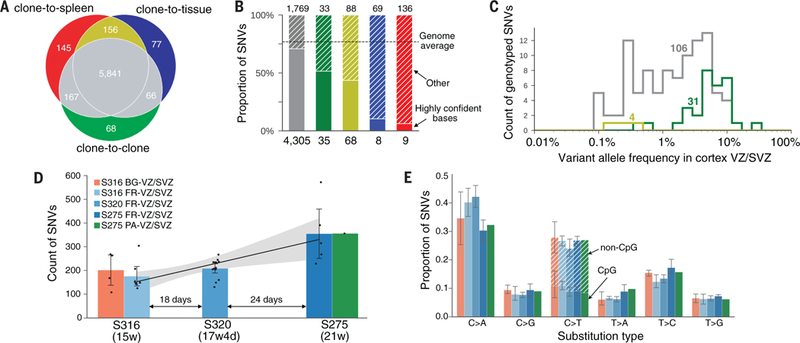
SNV discovery in brains. a) Three approaches of discovering mosaic SNVs were contrasted: comparing clones to the VZ/SVZ tissue of origin, comparing clones to the spleen, and comparing clones with each other (see Fig. S3). The three approaches give largely concordant calls. The comparison is for calls from all three brains. b) Calls unique to clone-to-original tissue (in blue) and clone-to-spleen (in red) discovery approaches are dramatically enriched for bases with less confident calling (as defined by the mask of the 1000 Genomes Project). These residual calls were not included in the final call set. c) VAF of genotyped SNVs from deep re-sequencing in all three brains. The clone-to-clone discovery approach allows finding high frequency mosaic SNVs in brain tissue (green line) that are missed from clone-to-tissue/spleen comparisons. d) Counts of mosaic SNVs per clone increase linearly with fetal age. e) Contribution of each substitution type to the mutation spectrum is not different between different fetuses and brain regions.
Eight randomly selected SNVs were all confirmed in the clones using PCR and Sanger sequencing (Table S2). As an additional validation strategy, we designed an oligonucleotide library complementary to the loci of all 6288 SNVs comprising the discovery dataset and performed capture and deep re-sequencing (to ~1000X coverage) in the DNA from 10 clones. This confirmed the 50%-centered VAF distribution for a majority of SNVs, with a minority (5.1%) having VAF lower than 35%, perhaps indicating that these could had arisen during cell culturing (Fig. S1 and S4). Accordingly, we estimated our false positive rate at around 5%. From an in-silico comparison of our clones with the unrelated and well characterized cell line NA12878 we estimated that the sensitivity for discovering mosaic SNVs in the clones was ~83% (Fig. S5).
Mosaic SNV counts, mutation spectra and distributions across brain regions
SNVs were found at rates of 108–572 per clone, with clones from older brains containing more variants (Fig. 1d), which averages to 200–400 SNVs after adjustment for discovery sensitivity and false positives. No differences in SNV counts for clones from frontal and parietal cortex and from frontal cortex and basal ganglia of the same brain were noticeable (Fig. 1d). Similarly, the relative contributions of substitution types to the mutation spectrum were the same for clones from different brains and from different brain regions (Fig. 1e). Overall, the transition to transversion ratio Ti/Tv was 0.6, with the most frequent substitution type being C:G>A:T transversion. This perhaps reflects DNA damage by oxidation, resulting in 8-Oxoguanine that is later fixated to threonine through incorrect base pairing with adenine (16). The second most common substitution was C:G>T:A transition, which is thought to be caused by deamination of cytosine and 5-methylcytosine (16). Linear approximation of the increase in SNV counts over time allowed estimating a mutation rate of 5.1 (95% CI 1.5 to 9) SNVs per day per progenitor during neurogenesis. This projects to a rate of roughly 8.6 (95% CI 1.6 to 20) SNVs per division per progenitor, assuming that the length of cell cycle of cortical progenitors is between 27 to 54 hours based upon studies in primates (17). The large interval of this estimation is due to uncertainties in both the per day increase in SNVs and in the length of the cell cycle. Inter-individual variability may further widen the confidence interval of this estimate.
To genotype the presence of variants across brains we used the above referenced capture library to conduct deep sequencing (~1000X coverage) in the source tissue (dorsal and basal germinal layers), in the corresponding outer layers containing mature neurons (frontal, parietal cortex and basal ganglia, respectively), as well as in other brain regions (occipital cortex, cerebellum) and in a peripheral tissue, the spleen (Table S3). A total of 144 SNVs was reliably genotyped, from 11 to 68 in each tissue, including spleen, with VAFs between 0.3% and 30% (Fig. 2a and S6). High VAFs for 7 such SNVs were further cross-confirmed with an orthogonal technique, droplet digital PCR (Table S2 and Fig. S7-S17). However, for hundreds of SNVs at much lower VAF (typically below 1%) the evidence for their presence in each tissue was not significant, likely because of their low VAFs in tissues.
Figure 2.
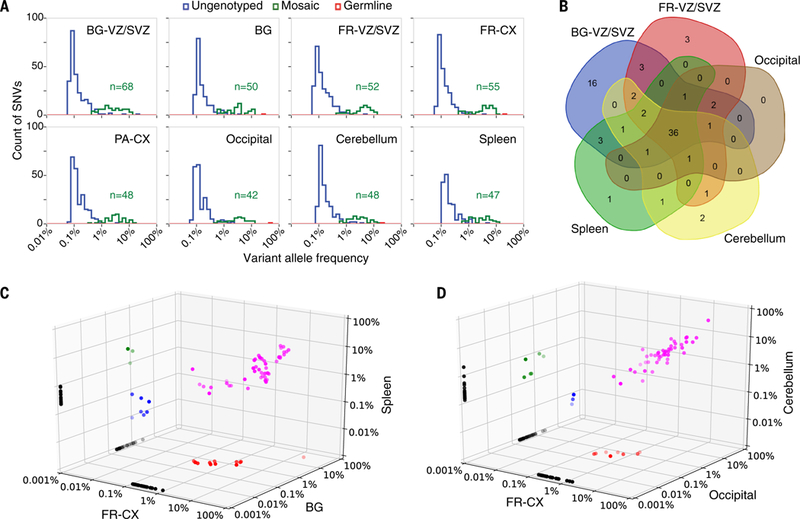
Genotyping of SNV in original tissues. a) Several dozens of mosaic SNVs with VAF of 0.3% to 30% in tissues from various brain regions and from spleen are genotyped by the capture-resequencing approach (green line). For hundreds more SNVs, the evidence for presence in tissue is indistinguishable from background noise (blue line). b) Venn diagram of genotyped mosaic SNVs across brain regions and spleen for subject 316. Almost 60% of mosaic SNVs could be genotyped in one or more brain regions and spleen and 44% could be genotyped in all brain regions and spleen. c,d) Comparative VAFs for mosaic SNVs across different brain regions and spleen for the same subject. Many SNVs are shared by multiple brain regions and by brain and spleen with similar VAFs (shared across two tissues are in green, red and blue, while shared across three tissues are in magenta).
Almost 60% of the genotyped SNVs (1.4% of total SNVs) and 92% of the SNVs with VAF above 2% in at least one brain region had non-zero VAF in the spleen (Figs. 2b,c, S6, and S18). Since the brain is of neuroectodermal origin and the spleen of mesodermal origin, these shared SNVs likely occurred prior to gastrulation, when the mesoderm, ectoderm and endoderm differentiate from a single-layered epithelium. This suggestion is consistent with the range of VAFs of these shared SNVs, as there are about 12 cell divisions prior to gastrulation (18), corresponding to expected VAFs from 0.03% to 25% in somatic tissues, depending on how early in embryogenesis variants have occurred. Some SNVs were shared between the spleen and only some of the brain regions (Figs. 2b,c, S6 and S18). This could indicate regional sub-lineages, i.e., that non-mixing sets of progenitors generate neurons in different brain regions, and that these distinct populations of progenitors may not have a common ancestor with cells in spleen. But conducting more sensitive assays is necessary to exclude the possibility of incomplete genotyping. Another observation pointing to an early origin of the mutations is that the overlap between SNVs in the basal ganglia VZ/SVZ and cortical VZ/SVZ with the respective differentiated regions was less than the overlap between the four regions together (Fig. S18), suggesting that most of the genotyped mutations found in the brain arise at least before the splitting between basal and dorsal regions of the telencephalon, i.e., at around neural plate stage or earlier.
Genotyped mosaic SNVs clearly cluster by similar VAFs in each brain (Figs. 3 and S19). Based on the average values of the frequencies for each cluster and sharing of such SNVs between clones, we concluded that these clusters likely represent variants created during sequential post-zygotic cleavages. Assuming equal contribution of dividing cells to tissues, we reconstructed the cell progeny tree and determined the precise origin of 84 mutations during the first 5 post-zygotic cleavages (Figs. 3b and S19). These mutations typically had VAF above 1%, while the remaining ones, typically with VAF below 1%, were assigned to later divisions. Only two SNVs had conflicting assignment between clusters and clones, which perhaps could be explained by mis-clustering or incorrect discovery/genotyping in clones. Alternatively, these conflicts along with the high VAFs for the very first SNV in the tree (Fig. 3a) may indicate an unequal lineage contribution to tissues due to asymmetric division, unequal proliferation, or positive/negative selection (19).
Figure 3.
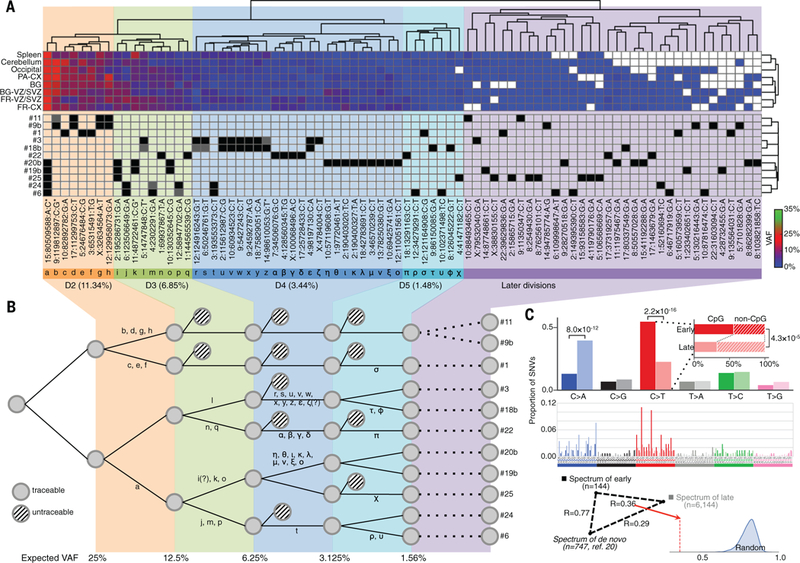
Reconstruction of mosaic SNV mutations during early development of subject 316. a) Hierarchical clustering of SNVs genotyped in the different brain regions and spleen by their VAFs revealed grouping consistent with SNVs sharing between clones (white squares represent zero VAF). Black and gray squares denote, respectively, SNVs discovered in clones and SNVs missed during discovery but genotyped afterwards. For completeness five SNVs (marked with *) were included in the analysis if present in multiple clones but the corresponding VAF estimation from capture-seq was not available. Their VAFs were estimated from whole genome tissue sequencing. Based on the corresponding average VAF (shown underneath each cluster), each cluster was assigned to consecutive post-zygotic divisions: D1 (no SNVs observed), D2, D3, D4, and D5. b) The reconstructed cell progeny tree during those divisions had only two conflicts of SNVs assignment, denoted by “?”, between clusters and clones. “Expected VAF” denotes VAF of mutations arising at each stage assuming equal contribution of all progenies to tissues. c) Mutational spectra of likely early mosaic SNVs (solid colors), and presumably later arising SNVs (shaded colors), are different. The difference in the spectra is due to the shift in frequency of C:G>T:A transitions, particularly in in CpG motifs, and in C:G>A:T transversions. The spectrum of early SNVs is much closer to the spectrum for de novo SNVs in the human population (triangle with correlation R-values). Random distribution represents correlation coefficients when randomly but proportionally subsampling early and late mutations.
Using the trees we estimated the average mutation rates per division per daughter cell in the early human embryo as 1.66±0.24, 1.18±0.33, and 1.05±0.22 for brains of the subjects 316, 320, and 275 respectively. The weighted average and variance of the 3 measurements is 1.3±0.15, consistent with the rate of 1.2 estimated from analysis of de novo SNVs in familial trios (20), and lower than the lower bound estimate for mutability of neuronal progenitors, thereby suggesting that the mutation rate during neurogenesis is higher than that in the early embryo.
We then split the set of mosaic SNVs into early origin – those genotyped in tissues by capture experiments, and likely late origin – those not genotyped. The spectrum of early mosaic mutations (i.e., the frequency of nucleotide substitution in the context of tri-nucleotide motifs) bears little resemblance to the spectrum of SNVs occurring later in neuronal progenitors, revealing a shift in mutagenesis during development (Fig. 3c). Early mutations had the same 2.2 Ti/Tv ratio as germline variants and had a larger fraction of C:G>T:A transitions overall (p-value of 2.2×10⁻¹⁶ by Fischer’s exact test), and particularly in CpG motifs (p-value of 4.3×10⁻⁵ by Fisher’s exact test), implicating the spontaneous deamination of 5-methylcytosine as a contributor to the mutagenic process (16). The signature of earlier mutations was also similar to the signature of de novo mutations in the human population (20). As some of early mutations can be passed to the next generation through the germline lineage, the convergence of their spectrum with de novo and germline variants is expected. Later mutations, on the other hand, had a larger contribution of C:G>A:T transversions (p-value of 8.0×10⁻¹² by Fisher’s exact test), implicating oxidative damage as a significant contributor to the mutagenic process (16). Furthermore, mutation spectrum for these transversions was most similar (correlation R=0.90) to the spectrum observed in MUTYH-defective colorectal cancer, where repair of 8-oxoguanine, the product of oxidative damage, is compromised (21).
Properties of mosaic SNVs
For the following analyses we used all mosaic SNVs in the discovery dataset from all clones, totaling to 6288, as mutation spectra for the three brains were extremely similar (Fig. S20). The distribution between neighboring mosaic SNVs was consistent with uniform random placement across the genome (Fig. S21). In line with this, no enrichment of exonic and intronic SNVs in any gene ontology category was observed either when assuming uniform background mutation rate or using as a background mosaic SNVs from liver, intestine, colon, or fibroblasts (1, 2). Roughly 3% of SNVs may have a functional consequence either by affecting protein coding sequence or gene regulation (Fig. S21 and Table S4). This projects to about 12 non-benign SNVs per progenitor cell at 20 post-conception weeks. A significant depletion of mosaic SNVs was observed in DNase hypersensitive sites relative to flanking regions (Fig. 4a). The depletion was more pronounced (10% vs 5%) when utilizing DNase hypersensitive sites for fetal brain rather than for a lymphoblastoid cell line, suggesting a relation between cells’ epigenome and the genesis of mutations. Since no such depletion was observed in coding relative to intronic gene regions, the depletion is not the result of negative selection, rather likely reflects better repair efficiency in open DNA regions, as was observed for somatic mutations in cancers (22, 23).
Figure 4.
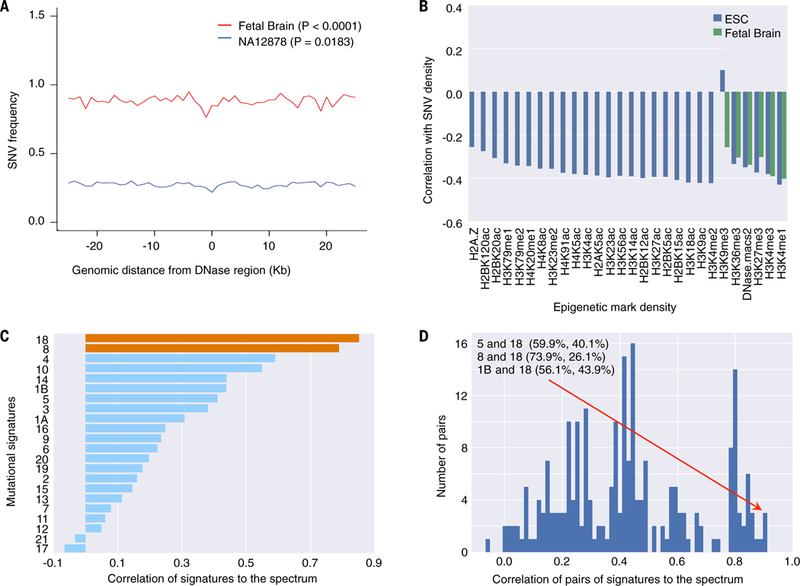
Properties of mosaic SNVs in brain. a) Depletion of mosaic SNVs in DNase hypersensitive sites, possibly indicating a better efficiency of DNA repair pathways in those regions (22, 23). b) Density of mosaic SNVs correlates negatively with histone marks in embryonic stem cells and fetal brain, revealing similarity to somatic SNVs in cancers. c) Mutational signatures 8 and 18 found in brain cancers have highest correlations with the mutation spectrum of mosaic SNVs. d) Exhaustive combinations of pairs of signatures consistently shows that signatures 1B and 5 also contribute to description of the mutation spectrum in combination with signature 18. Thus, signature 18 is the best descriptor of mosaic SNVs in developing brain.
Similar to somatic SNVs in cancers (24) and mosaic SNVs in skin fibroblasts (1), we found that the density of mosaic SNVs in the brain correlates negatively with most histone marks in fetal brain and embryonic stem cells (Fig. 4b). Comparison of our mosaic SNVs with mutational signatures found in cancer (25, 26) revealed that signatures 18 and 8, found, respectively, in neuroblastoma and medulloblastoma, as well as their combination, are the best descriptors for the spectrum of mosaic mutations in the developing brain (Fig. 4c,d). Mosaic SNVs were equally well described by the combination of signatures 5 with 18 and 1B with 18. Therefore, signature 18 with suspected etiology of oxidative damage (27), consistently contributed to the mutation spectrum of mosaic SNVs in fetal brain progenitors. This signature was mostly similar to late SNVs, while signature 1B to the early ones (Fig. S22).
Implications for development and disease
Our study uncovered extensive mosaicism in human fetal brain, with 200–400 SNVs present per brain progenitor cell at 15–21 weeks of gestation. This amount of mosaicism is likely inherited by cortical postmitotic neurons, as neurogenesis ends around 20 weeks in humans (28). Indeed, our estimate is in good agreement with the estimate that postmitotic neurons have ~300–900 mosaic SNV within one year of birth {aao4426 Lodato}. There is an order of magnitude difference between numbers of mosaic SNVs and de novo SNPs (20) implying a higher effect of mosaic SNVs on normal brain development and disease. Indeed we estimate that up to 12 non-benign mutations can be present in neuronal progenitors and consequently transmitted to a sizable fraction of daughter neurons. It is conceivable that in rare cases some of these mutations may have strong deleterious effect, for example, initiate overgrowth (29, 30) or neoplastic transformation by knocking out key genes. Indeed, the resemblance of mosaic SNVs in fetal brain to somatic mutations in brain cancers and particularly to medulloblastoma supports the theory that cancer driving mutations can happen by chance during background mutagenesis (31).
As dozens of discovered mutations happen prior to gastrulation, our study demonstrates that early post-zygotic mutations can be reconstructed from the analysis of a handful of clones and tissues, opening an avenue for charting individualized mosaicism maps. As mosaic variants can contribute to interindividual phenotypic differences and have been implicated in individual’s disease risk, we suggest that knowing the individual “mosaicome” could be as important as knowing the individual germline genome, particularly given the much stronger selection acting on germline variants and the lower penetrance of mosaic variants that is likely to be translated in milder phenotypes.
We also discovered a shift in mutagenesis during development characterized by an increased mutation rate and a change in frequency of substitution types. We cannot rule out that the increased mutation rate can be partially explained by inter-individual variation, although we have no evidence for such variability. The shift occurs sometime between early cleavages and neurogenesis and may be the consequence of physiological, biochemical, and gene expression changes related to the generation of neurons from neural stem cells. Alternatively, the shift may reflect more general developmental processes common to all tissues during organogenesis, and, based on increased counts of mutations related to oxidative damage, could be coupled to higher availability of radical oxygen species after development of the cardio-vascular system of the embryo. If this is the case, we predict that mutation spectra and rates per division undergo a similar shift during development across all somatic lineages.
Our estimated average mutation rate of 5.1 SNVs per day per neuronal progenitor during neurogenesis implies that neurons generated at early and later stages of neurogenesis will carry different burdens of mosaic variants. This rate is three orders of magnitude higher than 0.4 to 2 mutations per year accumulated in the germline lineage of adults (20, 32, 33). It is also 50 times higher than the rate in postnatal stem cells of the small intestine, colon and liver, estimated to be 36 mutations per year (2). Therefore, our results show that the prenatal period is intrinsically highly mutagenic likely the consequence of oxidative damage coupled with more frequent cell divisions.
We found no difference in SNV count between progenitors from cortex and from basal ganglia, implying that mosaicism accumulates at similar rates across the brain during neurogenesis. With the observed rate of 5.1 SNVs per day per neuronal progenitor one can project that cells in the forebrain SVZ and hippocampal subgranular zone, where neurogenesis and gliogenesis continues for more extended time periods (34–36), would accumulate about one thousand mosaic mutations by the time of birth. This estimate is consistent with the estimates of about 1000 mosaic SNVs present in skin fibroblast cells and in stem cells of colon and intestine in children (1, 2); indeed, mutations rates in all somatic proliferative cell lineages during prenatal development may be similar.
Supplementary Material
Acknowledgments
This work was supported by the HPC facilities operated by, and the staffs of, the Yale Center for Research Computing and Yale’s W.M.Keck Biotechnology Laboratory, as well as NIH grants RR19895 and RR029676–01, which helped fund the cluster. The sequencing data from this study have been deposited to the NIH NIMH Data Archives (https://data-archive.nimh.nih.gov) under collection ID # 2330. This work was funded by the Mayo Clinic Center For Individualize Medicine and by NIH grants R01 MH100914 (FMV), U01 MH106876 (FMV, AA, AEU), U01 MH106874 (NS), P50 MH106934 (NS), and R03 CA191421 (AA). AA is also a Visiting Professor at Yale Child Study Center. Supplement contains additional data.
References
- 1.Abyzov et al. , One thousand somatic SNVs per skin fibroblast cell set baseline of mosaic mutational load with patterns that suggest proliferative origin. Genome Res, gr.215517.116 (2017). [DOI] [PMC free article] [PubMed] [Google Scholar]
- 2.Blokzijl F et al. , Tissue-specific mutation accumulation in human adult stem cells during life. Nature. 538, 260–264 (2016). [DOI] [PMC free article] [PubMed] [Google Scholar]
- 3.Saini N et al. , The Impact of Environmental and Endogenous Damage on Somatic Mutation Load in Human Skin Fibroblasts. PLoS Genet. 12, e1006385 (2016). [DOI] [PMC free article] [PubMed] [Google Scholar]
- 4.Abyzov et al. , Somatic copy number mosaicism in human skin revealed by induced pluripotent stem cells. Nature. 492, 438–442 (2012). [DOI] [PMC free article] [PubMed] [Google Scholar]
- 5.O’Huallachain M, Karczewski KJ, Weissman SM, Urban AE, Snyder MP, Extensive genetic variation in somatic human tissues. Proc Natl Acad Sci USA. 109, 18018–18023 (2012). [DOI] [PMC free article] [PubMed] [Google Scholar]
- 6.McConnell MJ et al. , Mosaic copy number variation in human neurons. Science. 342, 632–637 (2013). [DOI] [PMC free article] [PubMed] [Google Scholar]
- 7.Laurie CC et al. , Detectable clonal mosaicism from birth to old age and its relationship to cancer. Nat Genet. 44, 642–650 (2012). [DOI] [PMC free article] [PubMed] [Google Scholar]
- 8.Jacobs KB et al. , Detectable clonal mosaicism and its relationship to aging and cancer. Nat Genet. 44, 651–658 (2012). [DOI] [PMC free article] [PubMed] [Google Scholar]
- 9.Evrony GD et al. , Single-neuron sequencing analysis of l1 retrotransposition and somatic mutation in the human brain. Cell. 151, 483–496 (2012). [DOI] [PMC free article] [PubMed] [Google Scholar]
- 10.Baillie JK et al. , Somatic retrotransposition alters the genetic landscape of the human brain. Nature. 479, 534–537 (2011). [DOI] [PMC free article] [PubMed] [Google Scholar]
- 11.Insel TR, Brain somatic mutations: the dark matter of psychiatric genetics? Mol. Psychiatry. 19, 156–158 (2014). [DOI] [PubMed] [Google Scholar]
- 12.McConnell MJ et al. , Intersection of diverse neuronal genomes and neuropsychiatric disease: The Brain Somatic Mosaicism Network. Science. 356, eaal1641 (2017). [DOI] [PMC free article] [PubMed] [Google Scholar]
- 13.Lodato MA et al. , Somatic mutation in single human neurons tracks developmental and transcriptional history. Science. 350, 94–98 (2015). [DOI] [PMC free article] [PubMed] [Google Scholar]
- 14.Chen C et al. , Single-cell whole-genome analyses by Linear Amplification via Transposon Insertion (LIANTI). Science. 356, 189–194 (2017). [DOI] [PMC free article] [PubMed] [Google Scholar]
- 15.Dong X et al. , Accurate identification of single-nucleotide variants in whole-genome-amplified single cells. Nat Methods (2017), doi: 10.1038/nmeth.4227. [DOI] [PMC free article] [PubMed] [Google Scholar]
- 16.Bacolla A, Cooper DN, Vasquez KM, Mechanisms of base substitution mutagenesis in cancer genomes. Genes (Basel). 5, 108–146 (2014). [DOI] [PMC free article] [PubMed] [Google Scholar]
- 17.Kornack DR, Rakic P, Changes in cell-cycle kinetics during the development and evolution of primate neocortex. Proc Natl Acad Sci USA. 95, 1242–1246 (1998). [DOI] [PMC free article] [PubMed] [Google Scholar]
- 18.Moore KL, Persaud TVN, Torchia MG, Before We Are Born (Elsevier Health Sciences, 2015). [Google Scholar]
- 19.Ju YS et al. , Somatic mutations reveal asymmetric cellular dynamics in the early human embryo. Nature. 6, 216 (2017). [DOI] [PMC free article] [PubMed] [Google Scholar]
- 20.Rahbari R et al. , Timing, rates and spectra of human germline mutation. Nat Genet. 48, 126–133 (2016). [DOI] [PMC free article] [PubMed] [Google Scholar]
- 21.Viel A et al. , A Specific Mutational Signature Associated with DNA 8-Oxoguanine Persistence in MUTYH-defective Colorectal Cancer. EBioMedicine. 20, 39–49 (2017). [DOI] [PMC free article] [PubMed] [Google Scholar]
- 22.Perera D et al. , Differential DNA repair underlies mutation hotspots at active promoters in cancer genomes. Nature. 532, 259–263 (2016). [DOI] [PubMed] [Google Scholar]
- 23.Sabarinathan R, Mularoni L, Deu-Pons J, Gonzalez-Perez A, Lopez-Bigas N, Nucleotide excision repair is impaired by binding of transcription factors to DNA. Nature. 532, 264–267 (2016). [DOI] [PubMed] [Google Scholar]
- 24.Polak P et al. , Cell-of-origin chromatin organization shapes the mutational landscape of cancer. Nature. 518, 360–364 (2015). [DOI] [PMC free article] [PubMed] [Google Scholar]
- 25.Alexandrov LB et al. , Signatures of mutational processes in human cancer. Nature. 500, 415–421 (2013). [DOI] [PMC free article] [PubMed] [Google Scholar]
- 26.Lawrence MS et al. , Mutational heterogeneity in cancer and the search for new cancer-associated genes. Nature. 499, 214–218 (2013). [DOI] [PMC free article] [PubMed] [Google Scholar]
- 27.Helleday T, Eshtad S, Nik-Zainal S, Mechanisms underlying mutational signatures in human cancers. Nat. Rev. Genet. 15, 585–598 (2014). [DOI] [PMC free article] [PubMed] [Google Scholar]
- 28.Pollen AA et al. , Molecular identity of human outer radial glia during cortical development. Cell. 163, 55–67 (2015). [DOI] [PMC free article] [PubMed] [Google Scholar]
- 29.Poduri A et al. , Somatic activation of AKT3 causes hemispheric developmental brain malformations. Neuron. 74, 41–48 (2012). [DOI] [PMC free article] [PubMed] [Google Scholar]
- 30.Lee JH et al. , De novo somatic mutations in components of the PI3K-AKT3-mTOR pathway cause hemimegalencephaly. Nat Genet. 44, 941–945 (2012). [DOI] [PMC free article] [PubMed] [Google Scholar]
- 31.Tomasetti C, Vogelstein B, Cancer etiology. Variation in cancer risk among tissues can be explained by the number of stem cell divisions. Science. 347, 78–81 (2015). [DOI] [PMC free article] [PubMed] [Google Scholar]
- 32.Michaelson JJ et al. , Whole-genome sequencing in autism identifies hot spots for de novo germline mutation. Cell. 151, 1431–1442 (2012). [DOI] [PMC free article] [PubMed] [Google Scholar]
- 33.Jónsson H et al. , Parental influence on human germline de novo mutations in 1,548 trios from Iceland. Nature. 549, 519–522 (2017). [DOI] [PubMed] [Google Scholar]
- 34.Gage FH, Neurogenesis in the adult brain. J. Neurosci. 22, 612–613 (2002). [DOI] [PMC free article] [PubMed] [Google Scholar]
- 35.Ernst A et al. , Neurogenesis in the striatum of the adult human brain. Cell. 156, 1072–1083 (2014). [DOI] [PubMed] [Google Scholar]
- 36.Gonçalves JT, Schafer ST, Gage FH, Adult Neurogenesis in the Hippocampus: From Stem Cells to Behavior. Cell. 167, 897–914 (2016). [DOI] [PubMed] [Google Scholar]
- 37.Hindson CM et al. , Absolute quantification by droplet digital PCR versus analog real-time PCR. Nat Methods. 10, 1003–1005 (2013). [DOI] [PMC free article] [PubMed] [Google Scholar]
- 38.Won H et al. , Chromosome conformation elucidates regulatory relationships in developing human brain. Nature. 538, 523–527 (2016). [DOI] [PMC free article] [PubMed] [Google Scholar]
- 39.Chadwick LH, The NIH Roadmap Epigenomics Program data resource. Epigenomics. 4, 317–324 (2012). [DOI] [PMC free article] [PubMed] [Google Scholar]
- 40.Chen L, Liu P, Evans TC, Ettwiller LM, DNA damage is a pervasive cause of sequencing errors, directly confounding variant identification. Science. 355, 752–756 (2017). [DOI] [PubMed] [Google Scholar]
Associated Data
This section collects any data citations, data availability statements, or supplementary materials included in this article.