

Significance
All animals have associated microbial communities called microbiomes that influence the physiology and fitness of their host. It is unclear to what extent individual microbial species versus interactions between them influence the host. Here, we mapped all possible interactions between individual species of bacteria against Drosophila melanogaster fruit fly fitness traits. Our approach revealed that the same bacterial interactions that shape microbiome abundances also shape host fitness traits. The fitness traits of lifespan and fecundity showed a life history tradeoff, where equal total fitness can be gotten by either high fecundity over a short life or low fecundity over a long life. The microbiome interactions are as important as the individual species in shaping these fundamental aspects of fly physiology.
Keywords: microbiome, higher-order interactions, fitness landscape, Drosophila, life history tradeoffs
Abstract
Gut bacteria can affect key aspects of host fitness, such as development, fecundity, and lifespan, while the host, in turn, shapes the gut microbiome. However, it is unclear to what extent individual species versus community interactions within the microbiome are linked to host fitness. Here, we combinatorially dissect the natural microbiome of Drosophila melanogaster and reveal that interactions between bacteria shape host fitness through life history tradeoffs. Empirically, we made germ-free flies colonized with each possible combination of the five core species of fly gut bacteria. We measured the resulting bacterial community abundances and fly fitness traits, including development, reproduction, and lifespan. The fly gut promoted bacterial diversity, which, in turn, accelerated development, reproduction, and aging: Flies that reproduced more died sooner. From these measurements, we calculated the impact of bacterial interactions on fly fitness by adapting the mathematics of genetic epistasis to the microbiome. Development and fecundity converged with higher diversity, suggesting minimal dependence on interactions. However, host lifespan and microbiome abundances were highly dependent on interactions between bacterial species. Higher-order interactions (involving three, four, and five species) occurred in 13–44% of possible cases depending on the trait, with the same interactions affecting multiple traits, a reflection of the life history tradeoff. Overall, we found these interactions were frequently context-dependent and often had the same magnitude as individual species themselves, indicating that the interactions can be as important as the individual species in gut microbiomes.
In 1927, Steinfeld (1) reported that germ-free flies live longer than their microbially colonized counterparts, suggesting that bacteria hinder host fitness. This observation, that the microbiome can impact aging, has been replicated in flies and vertebrates (2, 3). However, a decrease in lifespan does not necessarily indicate a negative impact on the host. Organisms in their environment are selected for their fitness, which is a function of lifespan, fecundity, and development time (4). Life history tradeoffs allow local adaptation. For instance, by increasing fecundity at the expense of lifespan (5–7), an organism can use either short or long generation times to achieve equal fitness. These observations set up two major questions: What is the role of an individual bacterial species versus interactions between them in determining host lifespan, and how is the microbiome effect on lifespan related to overall host fitness?
Identifying the host effects of specific bacteria has been difficult, in part, due to high gut diversity but also because interactions between bacteria can depend on context (8). Nonadditive effects of more than two variables are called higher-order interactions, and they indicate that interactions depend on context. For example, a bacterium may produce a specific B-vitamin in response to its neighbors (9, 10). This response may impact the host, and host feedbacks can mitigate or exacerbate changes in the microbial community (11). However, specific examples may be misleading, as the true complexity of a gut microbiome has never been exhaustively quantified. Thus, it remains an outstanding challenge to reverse-engineer the interaction networks that characterize microbiome/host effects relative to host interactions with individual bacterial species. Doing so would allow us to address the role of microbial community complexity in shaping host fitness. However, quantifying the set of all possible interactions of n species is a combinatorial problem involving 2n distinct bacterial communities. As n approaches the diversity of the mammalian gut with hundreds of species, this challenge becomes experimentally unfeasible.
The gut microbiome of the fruit fly Drosophila melanogaster is an effective combinatorial model because as few as five species of bacteria consistently inhabit the gut of wild and laboratory flies (12–14), yielding 25 possible combinations of species. Because early work on the fruit fly microbiome suggested that it is a transient community consisting only of recently ingested bacteria (15), we set up our experiments to maintain bacterial colonization through frequent ingestion. However, newer studies demonstrate that a modified fly diet as well as specific bacterial strains make for a persistent gut microbiome (16, 17), suggesting similarities with higher organisms. Here, we isolated the five core laboratory fly gut bacteria species in culture: Lactobacillus plantarum (Lp), Lactobacillus brevis (Lb), Acetobacter pasteurianus (Ap), Acetobacter tropicalis (At), and Acetobacter orientalis (Ao). These fermentative lactic acid bacteria and acetic acid bacteria commonly occur in the wild fly gut (14, 18, 19), where they can maintain a stable association (16, 17). We constructed germ-free flies by surface-sterilizing the embryos and reinoculated the newly emerged adult flies via continuous association with defined flora using established protocols (17, 20). We made the 32 possible combinations of the five bacterial species and then quantified the microbiome composition and resultant host phenotypes of (i) development time, (ii) reproduction, and (iii) lifespan to determine the relationship between gut microbe interactions and host fitness. We tested to what extent the presence and abundance of individual bacterial species account for the fly physiology phenotypes we measured.
Finally, we introduce a mathematical framework to deconstruct microbiome/host complexity by making a conceptual analogy between the bacterial species interactions and genetic epistasis (21, 22). This approach revealed significant context-dependent interactions between two, three, four, and five species that have large impacts on host physiology, contributing to differential life history strategies.
Results
Microbiome Diversity Confers a Life History Tradeoff.
We hypothesized that microbiome-induced lifespan changes might be due to changes in life history strategy, such as a tradeoff with fecundity. We therefore set up an experiment to measure how defined species compositions change each of the host fitness traits of lifespan, fecundity, and development time, which have been found to covary in life history tradeoffs (5, 6). We measured these traits concomitantly in the same experiment so that we could sum them together to calculate overall fly fitness (Fig. 1A). Equal fly fitness despite different lifespan and fecundity would indicate a life history tradeoff.
Fig. 1.

Microbiome induces a life history tradeoff between lifespan and reproduction. (A) Experimental design. The multicolor pies indicate which species are present in a given combination, along with the corresponding binary code. Each species abbreviation (Lp, Lb, Ap, At, and Ao) is indicated above its corresponding locus in the binary string. Both notations, colored pies and binary codes, are used consistently throughout the paper. The color code is included redundantly in the figures to aid the reader. (B) Single bacterial associations decrease the fly lifespan. (B, Inset) Microbiome diversity decreases the fly lifespan. Error bars show SEM. (C) In agreement with prior reports, higher total fecundity is associated with a shorter lifespan. This tradeoff is apparent for average daily fecundity, as well as for total fecundity per female. SEMs are provided in SI Appendix, Table S1. (D) Fitness calculations using a Leslie matrix reveal roughly constant fitness across different microbiomes. Error bars are SE of the estimate. (E) Lifespan/fecundity tradeoff can be broken by putting flies on antibiotics after their peak reproduction (red circles represent gnotobiotic flies treated with antibiotics; Materials and Methods) after 21 d, which encompasses the natural peak fecundity (SI Appendix, Fig. S5). Note the shifts in lifespan between the regular treatment, the antibiotic treatment, and the late-life bacterial inoculation treatment. The lifespan was significantly extended, whereas total fecundity stayed high. Shifting germ-free (GF) flies to gnotobiotic treatment after 21 d posteclosion decreased the lifespan without increasing reproduction (blue circles represent GF flies made gnotobiotic 21 d posteclosion) (n = 100 flies per treatment for the standard and antibiotic-treated experiments and n = 60 flies per treatment for the GF switched to gnotobiotic experiment). Error bars show SEM.
We first isolated each of the five species of bacteria found in our laboratory flies: Lp, Lb, Ap, At, and Ao, consistent with culture-independent sequencing (14, 18, 23). To test whether groups of bacteria have additive effects, we made each of the 32 possible combinations of the five species (including germ-free; Fig. 1A). We then made germ-free flies and inoculated them with defined bacteria compositions at 5–7 d posteclosure to reduce variation in development and gut maturation (24).
We performed five technical replicates of each experiment with 10 males and 10 females together in the same vial. The five replicates were performed over two separate biological replicates for a total of 100 adult flies per each of the 32 treatments. We transferred the flies every 3 d to fresh food that was inoculated with fresh bacteria to reduce the effects of bacterial growth on the food. To measure lifespan, we recorded the number of live flies daily. To measure fecundity, we kept the old vials that flies were transferred from and counted the number of emerged live adults. To measure development time in the population experiments where egg laying took place for 3 d, we counted the number of days for the first adult to emerge from a pupal case.
We first asked the role of individual bacterial species on fly lifespan. Consistent with previous studies, our germ-free flies survived the longest (Fig. 1B and SI Appendix, Table S1). However, only Lp, At, and Ao had a shortened lifespan, while flies aged with Lb and Ap had equivalent survival to germ-free flies. We next asked the effect of microbial diversity on fly lifespan. Germ-free flies survived ∼20% longer than flies colonized by all five bacteria (mean lifespan ± SEM: 53.5 ± 1.5 germ-free vs. 43.5 ± 1.1 for the gnotobiotics of the five species). Overall, we found a decrease in survival over many bacterial associations as we increased gut diversity (Fig. 1B, Inset and SI Appendix, Figs. S1 and S2; r = −0.54, P = 0.002, n = 32 associations, Spearman correlation), consistent with the gut microbiome having a pathogenic effect on the host. No consistent differential effect on lifespan was observed between males and females (SI Appendix, Fig. S3; t = −0.60, P = 0.55, n = 158 vials).
We next asked whether the reduction in lifespan was offset by a life history tradeoff in fecundity. Decreased lifespan corresponded to an increase in fecundity for female flies (Fig. 1C and SI Appendix, Table S1; total daily fecundity vs. lifespan: r = −0.50, P = 0.003, n = 32, Spearman correlation) and is not explained by differences in fly activity (SI Appendix, Fig. S4). Such life history tradeoffs are well documented in the literature and are believed to constitute a differential allocation of resources between long-term body maintenance and reproduction (4, 25).
A true tradeoff is one that allows an individual organism to adapt its life history strategy with equal overall fitness. Fitness is a function of fecundity, development, and lifespan, which gives an estimate of the maximum rate of population growth. We wondered whether the observed differences in lifespan were balanced by differential rates of fecundity and development or whether these differences in fly physiology actually made flies with distinct microbiome compositions more and less fit. To address this question, we combined our data for development, fecundity, and lifespan (SI Appendix, Table S1) in a Leslie matrix (26), a classic model of discrete population growth, to calculate organismal fitness under each bacterial association. Overall, fitness was constant across many distinct bacterial associations (Fig. 1D). Thus, the changes in lifespan we observed are consistent with a differential allocation of resources to reproduction, a true life history tradeoff, meaning that microbiome composition sets a fly’s life history strategy to maximize either reproduction or longevity. Walters et al. (27) show evidence that such microbiome-based fitness tradeoffs also occur in wild flies.
Reproduction Cannot Be Increased by Midlife Microbiome Addition.
The life history tradeoff suggests that a fly born into stark conditions in the wild could maximize its fitness by first acquiring a longevity-promoting microbiome and then converting to a fecundity-promoting one when environmental conditions improve. Female flies are primarily reproductive in the first part of their life, with a gradual decay in fecundity approaching middle age (SI Appendix, Fig. S5). To test whether individual flies can switch life history strategy to match their microbiome, we aged germ-free flies for 21 d (roughly middle age) and then associated these flies with fecundity-promoting bacteria. There was no significant increase in total fecundity for these flies and a significant decrease in lifespan compared with germ-free flies (Fig. 1E; P = 0.054 for fecundity, n = 275 flies pooled across four bacterial combinations, two-sample one-sided t test; P > 0.05 for all pairwise combinations after Tukey’s multiple comparison correction; P = 2 × 10⁻⁷ for lifespan, n = 400 flies pooled across four bacterial combinations, two-sample one-sided t test; P < 0.001 for 4/4 combinations after Tukey’s correction, n = 100 flies per combination, two-sample one-sided t tests). These results are consistent with the simple hypothesis that a fly’s reproductive window cannot be extended by late-life improvement in nutrition.
Microbiome Interactions Can Change Host Physiology.
We hypothesized that the microbiome may shorten lifespan through a process independent of reproduction. To examine this hypothesis, we used antibiotics to remove the microbiome of high-fecundity female flies and measured the resulting change in lifespan. We first allowed female flies with high-fecundity microbiomes to reproduce for 21 d (to a level greater than the total lifetime fecundity of germ-free flies; SI Appendix, Fig. S5), and we subsequently eliminated the microbiome using an antibiotic mixture (ampicillin, tetracycline, rifamycin, and streptomycin). In general, the midlife elimination of gut flora lengthened the female fly lifespan by roughly 15% compared with flies continuously fed live bacteria (Fig. 1E; P = 9 × 10⁻⁷, n = 560 flies pooled across bacterial combinations; P < 0.05 for four of seven combinations after Tukey’s correction for multiple pairwise comparisons, n = 80 flies per combination, two-sample one-sided t test). Total fecundity decreased slightly (Fig. 1E; P = 0.01, n = 560 flies pooled across bacterial combinations; P > 0.05 for all seven combinations after Tukey’s correction for multiple pairwise comparisons, n = 80 flies per combination, two-sample one-sided t test). This result demonstrates that the life history tradeoff is not necessarily fixed and suggests that the fly lifespan is shortened by some aspect of the bacteria rather than by reproduction. However, two specific bacterial combinations yielded no increase in lifespan when removed from their host by antibiotics: Ao and Lp+Lb+Ao, suggesting a memory in host physiology induced by these two combinations. Interestingly, neither the intermediate microbiome composition, Lp+Ao, nor the similar composition, Lp+At+Ao, (Fig. 1E; with antibiotic elimination of the microbiota-extending lifespan) showed this memory, suggesting specificity of the microbiome composition in this metabolic memory. These experiments demonstrate that interactions between bacteria can significantly impact the host’s ability to adjust its physiology.
Both Lower and Higher-Order Microbiome Interactions Change Host Physiology.
We next calculated to what extent microbiome interactions change fly physiology. We applied a multivariate linear regression model, a common statistical test for interactions between experimental variables (28, 29). Here, our variables are the five bacterial species. We detected evidence of widespread pairwise interactions in the data (SI Appendix, Tables S2–S5). Higher-order interactions are nonadditive effects of more than two variables, which would complicate efforts to predict the physiology of hosts with high-diversity microbiomes. We checked for three-way, four-way, and five-way interactions using the same statistical approach. Higher-order interactions for lifespan, fecundity, development, and bacterial composition were evident at each level of diversity (SI Appendix, Tables S2–S5), indicating that species interactions, rather than just their direct effects, change host phenotypes. Many of these interactions have equivalent magnitude to the impacts of individual species. For instance, the average lifespan of germ-free flies is 53 d (Fig. 1B, Inset). Individually, Ao can shorten lifespan by 10 d. Pairwise interactions can change mean lifespan by 8 d (SI Appendix, Table S4). Likewise, flies colonized by all five species of bacteria survive an average of 43 d. Microbiome interactions account for a 13-d (28%) increase in lifespan over the additive prediction (SI Appendix, Table S4). Overall, these findings demonstrate that microbiome interactions can have major impacts on host physiology.
To confirm these interactions, we next asked whether the physiology of flies with more than one bacterial species could be predicted by simply averaging the phenotypes of flies with the corresponding single-species associations [Fig. 2 (e.g., for combination Lp-Lb-Ap, phenotypes of flies living with Lp, Lb, or Ap were averaged) and SI Appendix, Math Supplement, section 9]. This model showed minor predictive power for development time (27% total correct: three of 10 two-way, three of 10 three-way, zero of five four-way, and one of one five-way interactions predicted), better prediction of lifespan (65% total correct: nine of 10 two-way, six of 10 three-way, two of five four-way, and zero of one five-way phenotypes predicted), and reasonably accurate prediction of average daily fecundity (81% total correct: seven of 10 two-way, nine of 10 three-way, four of five four-way, and one of one five-way phenotypes predicted). We also measured total bacterial abundances in the flies (SI Appendix, Table S1), which had little predictive power in the simple averaging model (20% total correct: four of 10 two-way, one of 10 three-way, zero of four four-way, and zero of one five-way phenotypes predicted). We next asked whether averaging data from the corresponding species pairs could predict phenotypes of three-, four- and five-way combinations [Fig. 2 (e.g., for combination Lp-Lb-Ap, phenotypes of flies living with either Lp-Lb, Lp-Ap, or Lb-Ap were averaged) and SI Appendix, Math Supplement, section 9]. This model overall correctly predicted 78% of the fly traits (Fig. 2; 15 of 16 for development; nine of 16 for lifespan, 15 of 16 for fecundity, and 11 of 16 for bacterial load), indicating that pairwise interactions account for a majority of host variation. However, in the remaining cases (up to 44% unpredicted for lifespan), failure of this simple model indicates higher-order interactions within the gut microbiome. Taking these analyses together with the life history tradeoff, microbiome/host interactions (including those of higher-order) can significantly impact fly fitness traits. In a later section, we analyze these interactions comprehensively to show how the context of bystander species influences these interactions.
Fig. 2.

Microbiome interactions impact host lifespan and bacterial load. Mean fecundity per female per day was measured concomitantly with development time and adult survival over the flies’ lifespans. (A) Variation in fecundity decreases as gut diversity increases. Median (n = 65) vials measured per bacterial treatment. (B) As described in SI Appendix, Math Supplement, section 9, daily fecundity in multispecies bacterial combinations can be predicted by averaging either the corresponding phenotypes of the single-species associations or the corresponding phenotypes of the pairwise species associations. Error in the predictions (averaging prediction minus measured trait value) is displayed. Single-species averaging predictions are shown in gray, and species pair averaging predictions are shown in black. Error bars are 95% confidence intervals (SI Appendix, Math Supplement, section 9). (C) Number of days to adulthood was measured as the first pupa to emerge from an individual fly vial during the lifespan experiment. Median (n = 24) per bacterial treatment (SI Appendix, Fig. S2). (D) Averaging models as in B applied to development data. (E) Lifespan decreases as gut diversity increases. Median (n = 100) flies per bacterial treatment. (F) Averaging models as in B applied to lifespan data. (G) Mean bacterial load averaged over 48 replicates per combination. (H) Averaging models as in B applied to bacterial load. Error bars for all plots are 95% confidence intervals. Colored pies on the x axis of B, D, F, and H indicate bacteria combinations and are consistently ordered with A, C, E, and G.
Bacterial Presence/Absence, More than Abundance, Impacts Fly Physiology.
The differences in host physiology we observed resulting from different microbiome compositions could be due not only to which species are present but also to their abundances. We reasoned that if a particular bacterial species drives a host physiological trait, then its abundance should be correlated with that trait. We therefore measured the abundances of individual bacterial species in the flies to determine the relationship to different fly physiologies. We first prepared gnotobiotic flies as before by inoculating 5- to 7-d-old mated germ-free flies with defined bacterial compositions. Flies were transferred to fresh food inoculated with fresh bacteria every third day for a total duration of 10 d before they were washed in 70% ethanol, crushed, plated, and colony-forming units (CFUs) were enumerated (Fig. 3A). The experiments were performed in two biological replicates for a total of 12 female and 12 male flies that were analyzed for each of the 32 bacterial combinations (Fig. 3B). The total bacterial load was higher when more species were present (r = 0.63, P = 0.0001, n = 31 bacterial combinations, Pearson correlation). However, on a species-by-species basis, abundance stayed constant or decreased as species diversity increased (Fig. 3C; Lp: r = −0.07, P = 0.8; Lb: r = −0.37, P = 0.2; Ap: r = −0.50, P = 0.06; At: r = −0.59, P = 0.02; Ao: r = −0.55, P = 0.03; Spearman correlations), suggesting competition plays a role in the interactions. To quantify the robustness of bacterial association in our experiments, we prepared a parallel experiment with the only difference being that after the initial 10 d of inoculation, flies were transferred daily to fresh, germ-free food for five subsequent days before enumeration of CFUs as before. Only very minor differences occurred between the two experiments (SI Appendix, Fig. S6), with the flies transferred daily to germ-free food for 5 d surprisingly having slightly higher CFU counts than flies plated directly after day 10 of inoculation (Wilcoxon rank sum test, median CFUs for flies transferred to germ-free food: 105.65 CFUs vs. flies directly plated after day 10 of inoculation: 105.59 CFUs, P = 0.01, n = 1,536 individual flies). Because only minor differences were observed, we merged the two experiments to increase statistical power. Median total bacterial load ranged from 49,000 CFUs per fly for Ap alone to 737,000 CFUs per fly for Lb+At+Ao, with an overall median of 425,000 CFUs per fly (Fig. 3B). The robust colonization observed despite daily transfer to germ-free food indicates the gut microbiome is persistent under these conditions, which is in contrast to some previous reports (15, 23). Two variables that could account for this difference are different bacterial strains (16, 17) and our use of a fly food with minimal microbial growth inhibitors (30).
Fig. 3.

Microbiome abundances correlate with some host physiology traits. (A) Gnotobiotic flies were associated with defined bacterial flora for 10 d before washing, crushing, and CFU enumeration. (B) Mean microbiome load (log10 scale) and relative abundances of the different species (linear scale) for all 32 possible combinations of the five species (n = 24 replicate flies from two independent biological replicates were measured per combination). (C) Total bacterial load increases as the number of species increases, but Lb abundance drops. Mean abundances were calculated from B as a function of the number of species present (complete data are provided in SI Appendix, Fig. S6). The black line indicates mean total bacterial load per fly computed over all combinations with the given number of species. (D) Lp abundance (from B) correlates with increased female fly fecundity (from Fig. 1C). (E) Ao abundance (from B) correlates with decreased fly lifespan (from Fig. 1C). (F) Development time from embryo to adult is accelerated by live bacteria. The development assay from Fig. 2B was repeated with variation in food preparation and source of embryos. The term “standard” indicates data from the fitness experiment in Fig. 2B; “germ-free” indicates embryos from germ-free females placed directly on fresh food inoculated with defined bacteria; and “heat-killed” and “non–heat-killed” indicate vials from the fitness experiment cleared of flies and either seeded directly with germ-free embryos (non–heat-killed) or placed at 60 °C for 1 h and checked for sterility (heat-killed) before being seeded with germ-free embryos. The number below the x axis indicates the number of replicate vials assessed. Complete bacterial combinations and individual replicates of F are provided in SI Appendix, Fig. S10. All error bars show SEM.
To test whether bacterial abundances drive fly physiology, we next compared the individual species abundances and total bacterial abundances in adult flies with the fly physiology phenotypes (Fig. 2 A, C, E, and G and SI Appendix, Fig. S2). We first calculated the correlation between individual species abundances and each host physiology trait (SI Appendix, Fig. S7). Of 20 possible correlations, two significant correlations were found: (i) between Lp abundance and total female fecundity (Fig. 3D; r = 0.52, P = 0.04, n = 16) and (ii) between Ao abundance and decreased lifespan (Fig. 3E; r = −0.53, P = 0.03, n = 16), indicating that these two individual species can explain 27% and 28% of the variation in fecundity and lifespan, respectively. We did not detect other significant relationships between bacterial load and host physiology, leaving the remaining variation (73% of fecundity and 72% of lifespan) unexplained by individual species abundances. However, as we show in Fig. 1E, the interaction between Ao and Lp can dramatically alter the fly’s ability to adjust its physiology when treated with antibiotics, with a 21% change in lifespan (Fig. 1E). Thus, individual bacterial species loads are not necessarily expected to determine impacts on the host.
As a secondary test that bacterial abundance drives fly phenotypes, we examined both load and phenotype variation. If the load of individual bacterial species drives host physiology traits, we would expect that higher variation in bacterial load would correspond to higher variation in host traits, yielding a positive correlation. When we calculated the relationship between bacterial load variation and host trait variation, we found no statistical evidence for an association (SI Appendix, Fig. S8). Taken together, these results suggest that the long-term presence of bacterial species is more indicative of their effect on host physiology than their abundances.
Live Bacteria Speed Up Fly Development.
We did find one notable exception to the presence/absence rule: Ao abundance in the food sped up larval development time significantly (Fig. 2C and SI Appendix, Fig. S9; r = −0.95, P = 0.003, n = 7 bacterial combinations with Ao, Spearman correlation). However, consistent with the adult results, there was no correlation with fly physiology for the four other species. We next tested whether there was a maternal effect on development time by removing the maternal bacterial association. We prepared the vials for this development experiment by first setting up a replicate fitness experiment (as in Fig. 1A). After the first transfer to fresh vials, we took the used vials, allowed all larvae to form pupae, and then removed the pupae. Eggs from germ-free mothers developing in these vials had an equal rate of development to the fitness experiment (Fig. 3F; paired sample t test, P > 0.18, n = 500), indicating no maternal effect. We then tested whether live bacteria aid the flies under these conditions. We performed a duplicate experiment but heat-killed the vials in a humidified (to prevent drying) 60 °C chamber for 1 h (and tested for sterility). All of the sterile vials were inoculated with ∼30 germ-free embryos each. Flies in heat-killed vials developed ∼8 h more slowly (Fig. 3F; paired sample t test, P < 0.005, n = 16), suggesting that active bacterial metabolism (31) speeds up fly development (Fig. 3F and SI Appendix, Fig. S10). Finally, we asked whether bacteria degrade the fly food. We harvested eggs from germ-free flies, associated them with all 32 bacterial combinations on fresh food, and measured development times. This experiment uncovered a significant acceleration in development time compared with the fitness experiment (SI Appendix, Fig. S10). These experiments demonstrate context dependence in terms of timing in microbiome associations.
Mathematics of Genetic Epistasis Allow Quantification of Context Dependence in Microbiome Interactions.
Our results indicate that microbiome interactions play a significant role in fly physiology. However, interactions between species often depend upon the context of which other species are present. There is not a universally accepted mathematical framework to calculate the strength of context-dependent interactions in the microbiome; however, genetic epistasis provides a template. We make the explicit analogy between genes in a genome and microbial species in a microbiome, using presence/absence of microbial species (Fig. 3).
Here, we apply the combinatorial approach (Box 1) developed by Beerenwinkel, Pachter, and Sturmfels (BPS) (21) to calculate epistatic interactions between microbiome bacteria in n dimensions, where n is the number of bacterial species considered. To apply these methods, we identify the 32 bacterial combinations encoded as in Fig. 1A with the vertices of a 5D cube (an illustration of this association is provided in Fig. 4A). In this association, we think of presence and absence of microbial species as treatment conditions. The method determines interactions directly, rather than as a regression (Box 1 and SI Appendix, Math Supplement, sections 5 and 6).
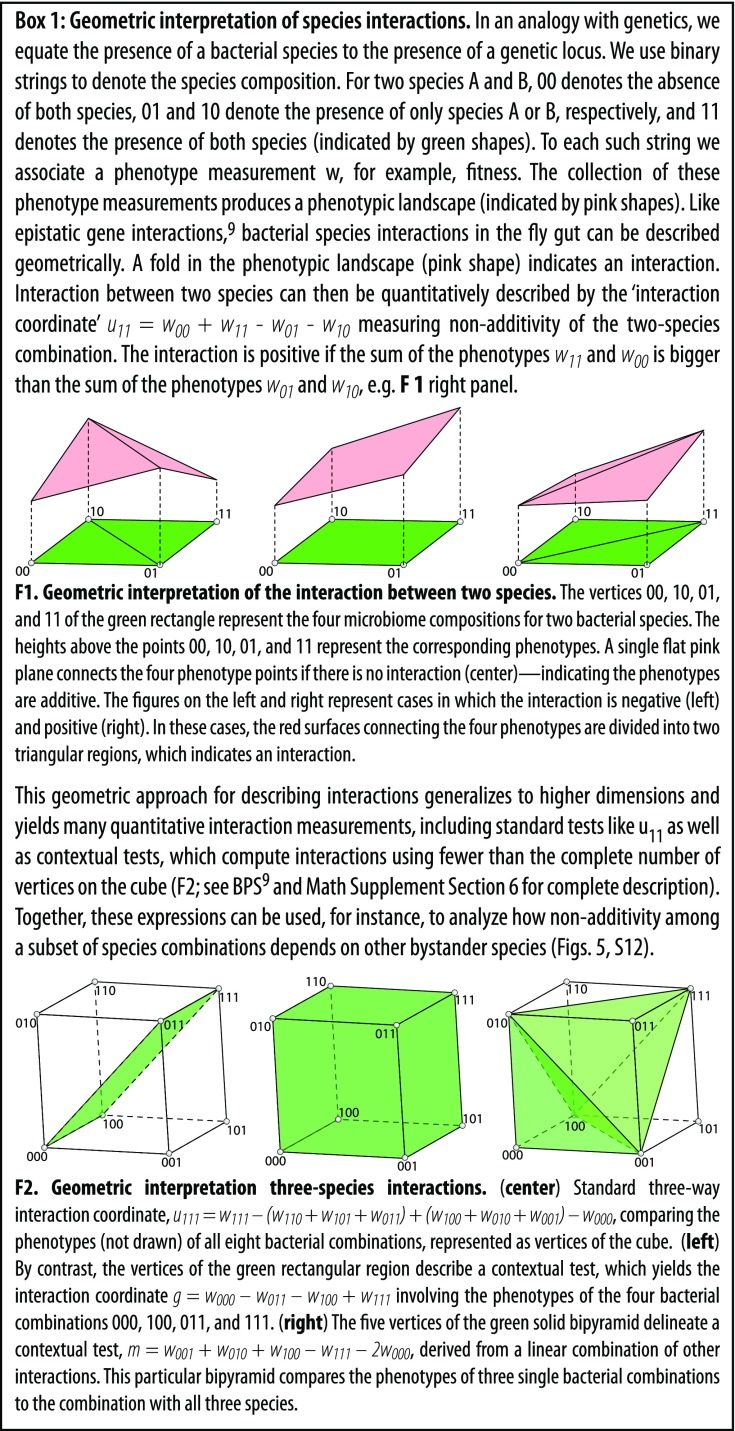
Fig. 4.

Microbiome interactions change host physiology. (A) Coded bacterial combinations correspond to the vertices the 5D cube. For daily fecundity (B), development (C), lifespan (D), and bacterial load (E), we calculated interactions for standard tests (pink dots) and contextual tests (blue dots) using means and propagated SEs for all phenotype traits (SI Appendix, Table S1). The P values of all standard and contextual tests were pooled and adjusted for multiple comparisons using the Benjamini–Hochberg method (dark fill color, significant; open circles, nonsignificant). Standard tests with species identities are provided in SI Appendix, Fig. S12.
We compared this framework with the outcome of the multiple linear regression model and found that the results correlated well with the regression coefficients (32) (SI Appendix, Math Supplement, section 4; Figs. S11 and S12; and Tables S2–S5). We call these BPS interactions “standard tests.” The results of these tests and the species involved in each one of them are presented in SI Appendix, Fig. S12. The BPS method tests many more interactions, such as conditional and marginal epistasis, which we refer to as “contextual tests.” These tests revealed significant effects of species interactions on host physiology and total bacterial load (Fig. 4 B–E), with many pairwise and higher-order interactions. These conditional and marginal tests are interesting because they signify that a particular interaction depends on the presence/absence of additional species.
Interestingly, bacterial load interactions tended to be negative (Fig. 4E), suggesting that interactions speed up development and reduce total bacterial load. Negative epistasis in genetics suggests that two loci are in the same pathway (i.e., they are redundant). By analogy, negative microbiome epistasis suggests that redundant mechanisms, such as nutrition (33), might moderate these interactions. In contrast, lifespan interactions tended to be positive (Fig. 4D). By analogy with genetics, this suggests that synergistic bacterial interactions modulate multiple pathways that affect lifespan. Fecundity interactions suggest both synergy and redundancy (Fig. 4B).
The magnitudes of the interactions, when normalized to the number of bacterial species present, were often as large as the effects of individual species introductions (SI Appendix, Math Supplement, section 7.1), indicating that species interactions are equally as important as the individual species themselves.
Host/Microbiome Interactions Are Conditional.
An example of context dependence is a conditional interaction, which is when two species interact differently depending on the presence of a third species (or more). To test for conditional interactions, we calculated pairwise interactions for each pair of species with each other possible combination of the remaining three species (Fig. 5A and SI Appendix, Fig. S13 A–C). For instance, the standard pairwise “interaction coordinate” is the equation
which calculates the interaction between Lp and Ao alone, where signifies the interaction between the first and fifth loci (Box 1). The term is the mean phenotype measured for flies with no bacteria, is for flies with both Lp and Ao, is for flies with Lp only, and is for flies with Ao only (Fig. 1A, binary code notation; Box 1; and SI Appendix, Math Supplement, sections 5 and 6). Similarly, the interaction coordinate
calculates the interaction between Lp and Lb when Ap is present. We refer to as a standard test because it calculates the interaction between all species present in the formula. We refer to as a contextual test because it evaluates the Lp and Lb interaction in the context of the bystander, Ap. By comparing the standard and contextual tests, we found that all pairwise interactions depend on context for at least one set of bystanders (Fig. 5A and SI Appendix, Fig. S13 A–C), which is analogous to conditional epistasis in genetics (21). This context is visualized in Fig. 5 and SI Appendix, Fig. S12 by the cases where the different colored points, which represent different sets of bystander species, do not coincide for a given test. In some cases, a bystander increases the magnitude of an interaction; in other cases, a bystander diminishes or annihilates the interaction. Thus, the interactions measured by the test change depending on the different bystander species. We next extended this analysis to ask if three-way interactions are also context-dependent. Similar to the pairwise case, three-way interactions almost always [231 of 240 (96%)] can change depending on the bystander species (Fig. 5B and SI Appendix, Fig. S13 D–F).
Fig. 5.

Interactions between bacteria that impact the fly lifespan depend on the context of bystander species. (A) For the fly lifespan trait, the pairwise interaction was calculated between each pair of species for each set of possible bystander species. For each test (e.g., 11***), the 1’s indicate the species for which the interaction test is calculated and the asterisks indicate the possible bystander species. The binary code (e.g., 101) in the legend indicates which of the three possible bystanders is present. For instance, 000 indicates no bystanders and is shown by a black square. Note that the interactions change depending on the bystanders present. (B) For the fly lifespan trait, the four different three-way interactions were calculated with each possible set of bystander species. Interactions between sets of three species [equations: g = square, i = circle, k = triangle, m = ex (x), n = *, u111 = diamond; SI Appendix, Math Supplement, sections 5 and 6] are compared to determine (i) whether the context of other species changes interactions and (ii) whether additive contextual tests can describe cases of nonadditive standard tests. Each of the 10 combinations of three species (denoted in panel titles as k, l, and m) is compared, along with the four variants of bystander species (denoted in the panel titles as * and shown by the different colored symbols). The differences between the colors for a given interaction test indicate that bystanders change interactions. Error bars indicate propagated SEM.
Some Higher-Order Interactions Can Be Explained by Lower-Order Interactions.
In comparing the standard and contextual tests, we observed some specific cases where a standard test indicated a nonadditive interaction, while certain related contextual tests for the same species composition indicated an additive interaction (Fig. 5 and SI Appendix, Fig. S13; compare the different tests in Box 1, F2). For instance, consider the standard test for lifespan interactions (black diamonds in Fig. 5B) between Lp, Lb, and Ao (red, yellow, and green pie symbols in Fig. 5B). It indicates a significant interaction between these three species shortening lifespan. However, the contextual test (i = w000 − w010 − w101 + w111; black circles in Fig. 5B and SI Appendix, Math Supplement, section 6) indicates no interaction because its value is not significantly different from zero. This signifies that by considering Lp and Ao together as a single bacterial species, the Lp+Lb+Ao lifespan is predictable as the sum of the lifespans of Lb-colonized flies and Ap+Ao-colonized flies relative to germ-free flies. Therefore, our methods suggest that interactions between specific species groups account for some higher-order interactions (Fig. 5 and SI Appendix, Fig. S13 and Math Supplement, Fig. 1). While we discovered no consistent patterns enabling the inference of these groups a priori (Fig. 5 and SI Appendix, Fig. S13), the presence of these groups as well as the averaging approach (Fig. 2) together suggest a path to predictability. These results emphasize that bacterial species interactions significantly change the impacts of other individual species in the microbiome. A major challenge for the future will be to discover the rules and mechanisms by which these low-dimensional interactions scale under increasing diversity.
Microbial Abundance Interactions Correlate with Host Physiology Interactions.
Are interactions between bacteria linked with host physiology? We first tested whether microbial interactions detected through CFU counts were correlated with interactions detected through development, fecundity, and lifespan (SI Appendix, Fig. S14). Focusing on the statistically significant interactions, there is a strong correlation between the interaction strengths across these distinct phenotypes (SI Appendix, Fig. S14D), indicating that the same microbiome abundance interactions also are associated with fly physiology interactions and the life history tradeoff. Thus, interactions calculated from bacterial species abundances may be predictive of fly traits. This relationship is notably in contrast to the relationship between the individual bacterial species abundances and fly physiology phenotypes, where only two weak correlations were established (Fig. 3 D and E and SI Appendix, Figs. S7 and S8).
We next asked how the pairwise interactions between individual bacteria species change under increasing numbers of species present (Figs. 4 and 5). We used the abundance data for individual species (Fig. 3 and SI Appendix, Fig. S6) to calculate the pairwise interaction strengths between the five species.
We first calculated the pairwise correlations in species abundances as a function of the total number of species present in the gut (Fig. 6A). Correlations became more negative for individual species pairs as diversity increased (SI Appendix, Math Supplement, sections 10.3 and 10.4; P = 0.03, n = 10 species pairs, Kendall’s tau and Wilcoxon signed rank), consistent with stronger competition at higher diversity.
Fig. 6.

Microbiome interactions stabilize diversity in the fly gut. (A) Pairwise correlations in abundance for the five species of bacteria in fly guts with totals of two, three, four, and five species present. More positive correlations are apparent at low diversity, whereas more negative correlations occur as diversity increases (P = 0.03; SI Appendix, Math Supplement, section 10.4). Direct calculation of interaction strength (34) at low (B, one to two species) and high (C, four to five species) diversity based on CFU abundance data (Fig. 3B and SI Appendix, Fig. S6) revealed asymmetrical interactions that decrease in strength at higher diversity (SI Appendix, Math Supplement, section 10.1 and Fig. S15). Consistent with the correlations in A, more negative interactions occur in more diverse guts.
We then calculated the directional interactions (i.e., A → B vs. B → A) using Paine’s classic approach (34), where interaction strength is based on the change in abundance of one species when a second species is removed (Fig. 6 B and C and SI Appendix, Math Supplement, section 10.1 and Fig. S15 A and B). Comparing the pairwise interaction maps at high and low diversity, we found that interactions are generally positive when only two species are present, consistent with interactions between two species in vitro (SI Appendix, Fig. S15C). However, interactions become more negative at higher diversity, consistent with increasing competition. An alternate approach to calculate the interactions, by fitting the classic generalized Lotka–Volterra model (SI Appendix, Math Supplement, section 10.2), gave qualitatively similar results (SI Appendix, Fig. S15 D and E). However, parametrizing the model on low-diversity data did a poor job of estimating the bacterial abundances at higher diversity, with n ≥ 3 species (SI Appendix, Math Supplement, section 10.3; P = 0.8, binomial test, n = 16), in agreement with the changing interaction landscape at higher diversity (Fig. 6 and SI Appendix, Fig. S15).
Lastly, we asked if the interaction networks we calculated are consistent with the maintenance of diversity we observe. We calculated the asymmetry in the interaction network using the approach of Bascompte et al. (35), where asymmetry of interactions is indexed from 0 (perfectly symmetrical) to 2 (exactly opposite). For the low-diversity case, the mean asymmetry is 1.04 (SD = 0.13), and for the high-diversity case, the mean asymmetry is 0.77 (SD = 0.08) (SI Appendix, Math Supplement, section 10.1), indicating significant asymmetry. Furthermore, analysis of the variation in total bacterial load between individual flies showed a decreased coefficient of variation for high diversity (SI Appendix, Math Supplement, section 9.5 and Figs. S16 and S17; P = 0.02, Wald test). Together with the strength of interactions (Fig. 6), these calculations are consistent with community stability at higher diversity (36).
Discussion
Bacterial Abundance Interactions May Damage the Host.
The biological interactions determining the bacterial community in the fly gut involve more than just pairs of species (37) (Figs. 4–6 and SI Appendix, Figs. S13 and S15). These interactions generally become weaker and more negative as diversity increases, which is consistent with community stability through competition. Without some sort of stabilizing interactions, some species should simply go extinct by chance. We do not observe evidence for these extinctions. We also acknowledge that this five-species gut community may have been selected for its stability in the fly vial environment. Time series perturbation experiments could be a better way to directly evaluate community stability (38). The negative interactions we detect in the microbiome are associated with shorter lifespans in the host flies, suggesting that negative bacterial interactions may damage the host. Consistent with this finding, microbiome removal by antibiotic treatment typically extended lifespan (Fig. 1E). We speculate that molecular mechanisms for microbial damage to the host could include nutrient depletion (SI Appendix, Fig. S10), toxic secondary metabolite production, trigger of host immunity (11), and physical injury through bacterial secretion systems, which have been shown to kill flies during Vibrio/Acetobacter interactions (39).
How Much Do Higher-Order Interactions Matter?
While we found that higher-order interactions occur and are responsible for significant changes in fly physiology, we also found that lower-order interactions between bacterial pairs can account for more than half of the phenotypes in three-, four-, and five-way bacterial combinations (Figs. 2 and 5). Thus, to harness predictive power from low-diversity microbiomes, we must identify the reasons why simple predictions work and when they do not. However, the lack of convergence in traits such as lifespan and bacterial abundances suggests different rules may apply to different phenotypes, and it is unclear what rules will apply to more diverse host/microbiome systems. Furthermore, different conditions, such as diet composition, could drastically change the microbiome interactions. Decomposing interactions in increasingly diverse systems remains an important goal for future studies.
Microbiome Interactions Mediate a Life History Tradeoff Between Lifespan and Fecundity.
Overall, we found that interactions in the fruit fly gut microbiome structure both the fitness of the fly and the composition of the microbiome (Figs. 2 and 4–6 and SI Appendix, Figs. S13 and S15). The magnitudes of these interactions are often equivalent to the effects of individual species. Thus, microbiome interactions (and not just individual species) can be a major driver of host physiology. Many studies have documented changes in fly lifespan as a function of various factors, including diet, host genetics, and microbiome composition (2, 33, 40, 41). Our study suggests that microbiome composition and the timing of the association can have major impacts on lifespan as well as life history tradeoffs (25). Walters et al. (27) show the consequences of this tradeoff for ecology and evolution of wild flies.
The Drosophila Gut Microbiome Serves as an Effective Model of Microbiome Complexity.
A pervasive challenge in host/microbiome science is the complexity of most host-associated microbiomes. D. melanogaster has a naturally low-diversity microbiome, which facilitates the study of this complexity. Regarding the suitability of this model, a major question is whether such a simple system with just five species can recapitulate the complex phenotypes associated with higher-diversity microbiomes, such as humans and plants. The fact that we observe emergent properties in this simple and tractable five-species community makes it an attractive model. Based on our empirical results, we argue that interacting groups, rather than just individual species, may be fundamental building blocks of these microbiome/host relationships.
Materials and Methods
Additional details are provided in SI Appendix.
Fly Stock Maintenance.
Fly stocks were maintained at 25 °C and 60% humidity on a standard Bloomington diet, with 12:12 h light/dark cycles, and confirmed to be free of known RNA viruses by RT-PCR (17). Germ-free fly stocks were kept in sterile conditions over multiple generations to reduce heterogeneity due to parental nutrition from microbiome variability.
Gnotobiotic Fly Preparation.
We identified five unique species in our laboratory flies (Lp, Lb, Ap, At, and Ao) (17), which we then isolated in culture. To prepare the inoculum for flies, bacteria were grown overnight in De Man, Rogosa, and Sharpe (MRS) medium in a 30 °C Innova 4000 shaker (New Brunswick) at 200 rpm. The bacteria were resuspended at 108 cells per milliliter in sterile PBS for fly gnotobiotic preparations (20). A total of 5 × 10⁶ CFUs (50 μL of 108 bacteria per milliliter in 1× PBS) were inoculated per fly vial. The 32 combinations of the five bacterial strains were mixed using a Beckman Coulter Biomek NXP workstation to standardize the inoculum. Germ-free mated flies 5–7 d posteclosion were sorted into these vials.
Check for Contamination and Correct Colonization.
All fly work, including media preparation and transfers to fresh food, was performed in a tissue culture hood using sterile technique. Correct association and contamination were assessed by plating and 16S PCR followed by Sanger sequencing to confirm species identities.
Bacterial Load Counts from Individual Flies.
Flies were washed in 70% ethanol and then bead-beaten in 96-well plates using a custom-built attachment. Lysates were pinned with a 96-pin replicator (Boekel) onto selective media, visually scored, and then enumerated using a standard curve (SI Appendix, Fig. S18).
Fitness Calculations.
We estimated fitness for each bacterial treatment using a Leslie matrix (1,000 replicates randomly sampled per treatment).
Statistical Analyses.
All statistics were calculated using R (v.3.3.3) (28) unless otherwise noted. Pearson correlations were for normally-distributed data versus Spearman correlations when the data were not distributed normally.
Data and Software Availability.
Data and software presented in this study are available online in the Dryad Digital Repository (doi:10.5061/dryad.2sr6316) and on the Nextjournal platform (https://nextjournal.com/csi/microbiome-interactions-shape-host-fitness/).
Supplementary Material
Acknowledgments
Holger Elbe and Michael Joswig (Technical University of Berlin) scrutinized data to ensure correctness. A National Science Foundation Graduate Research Fellowship supported E.W.J. under Grant 1650114. The Royal Society of New Zealand partially supported A.G. through a Rutherford Discovery Fellowship, Project RDF-17-UOO-007. The David and Lucile Packard Foundation and the Institute for Collaborative Biotechnologies supported J.M.C. through Grant W911NF-09-0001 from the US Army Research Office. An NIH Director’s Early Independence Award (1DP5OD017851) and a William Bowes Research Fellowship (to W.B.L.) from the Department of Molecular & Cell Biology, University of California, Berkeley supported A.L.G., V.Z., B.O., and W.B.L. The content of the information does not necessarily reflect the position or the policy of the Government, and no official endorsement should be inferred. The funders had no role in study design, data collection and analysis, decision to publish, or preparation of the manuscript.
Footnotes
Conflict of interest statement: W.B.L. cofounded uBiome, Inc. and owns stock in the company.
This article is a PNAS Direct Submission.
Data deposition: Data and software presented in this study have been deposited in the Dryad Digital Repository database, datadryad.org/ (doi: 10.5061/dryad.2sr6316), and on the Nextjournal platform (https://nextjournal.com/csi/microbiome-interactions-shape-host-fitness).
This article contains supporting information online at www.pnas.org/lookup/suppl/doi:10.1073/pnas.1809349115/-/DCSupplemental.
References
- 1.Steinfeld HM. 1927. Length of life of Drosophila melanogaster under aseptic conditions. PhD dissertation, pp 1–47.
- 2.Clark RI, et al. Distinct shifts in microbiota composition during Drosophila aging impair intestinal function and drive mortality. Cell Rep. 2015;12:1656–1667. doi: 10.1016/j.celrep.2015.08.004. [DOI] [PMC free article] [PubMed] [Google Scholar]
- 3.Smith P, et al. Regulation of life span by the gut microbiota in the short-lived African turquoise killifish. eLife. 2017;6:e27014. doi: 10.7554/eLife.27014. [DOI] [PMC free article] [PubMed] [Google Scholar]
- 4.Travers LM, Garcia-Gonzalez F, Simmons LW. Live fast die young life history in females: Evolutionary trade-off between early life mating and lifespan in female Drosophila melanogaster. Sci Rep. 2015;5:15469. doi: 10.1038/srep15469. [DOI] [PMC free article] [PubMed] [Google Scholar]
- 5.Roff DA, Fairbairn DJ. The evolution of trade-offs: Where are we? J Evol Biol. 2007;20:433–447. doi: 10.1111/j.1420-9101.2006.01255.x. [DOI] [PubMed] [Google Scholar]
- 6.Stearns SC. Trade-offs in life-history evolution. Funct Ecol. 1989;3:259–268. [Google Scholar]
- 7.van Noordwijk AJ, de Jong G. Acquisition and allocation of resources: Their influence on variation in life history tactics. Am Nat. 1986;128:137–142. [Google Scholar]
- 8.Cho I, Blaser MJ. The human microbiome: At the interface of health and disease. Nat Rev Genet. 2012;13:260–270. doi: 10.1038/nrg3182. [DOI] [PMC free article] [PubMed] [Google Scholar]
- 9.Degnan PH, Taga ME, Goodman AL. Vitamin B12 as a modulator of gut microbial ecology. Cell Metab. 2014;20:769–778. doi: 10.1016/j.cmet.2014.10.002. [DOI] [PMC free article] [PubMed] [Google Scholar]
- 10.Seth EC, Taga ME. Nutrient cross-feeding in the microbial world. Front Microbiol. 2014;5:350. doi: 10.3389/fmicb.2014.00350. [DOI] [PMC free article] [PubMed] [Google Scholar]
- 11.Rolig AS, Parthasarathy R, Burns AR, Bohannan BJM, Guillemin K. Individual members of the microbiota disproportionately modulate host innate immune responses. Cell Host Microbe. 2015;18:613–620. doi: 10.1016/j.chom.2015.10.009. [DOI] [PMC free article] [PubMed] [Google Scholar]
- 12.Ryu JH, et al. Innate immune homeostasis by the homeobox gene caudal and commensal-gut mutualism in Drosophila. Science. 2008;319:777–782. doi: 10.1126/science.1149357. [DOI] [PubMed] [Google Scholar]
- 13.Wong CNA, Ng P, Douglas AE. Low-diversity bacterial community in the gut of the fruitfly Drosophila melanogaster. Environ Microbiol. 2011;13:1889–1900. doi: 10.1111/j.1462-2920.2011.02511.x. [DOI] [PMC free article] [PubMed] [Google Scholar]
- 14.Chandler JA, Lang JM, Bhatnagar S, Eisen JA, Kopp A. Bacterial communities of diverse Drosophila species: Ecological context of a host-microbe model system. PLoS Genet. 2011;7:e1002272. doi: 10.1371/journal.pgen.1002272. [DOI] [PMC free article] [PubMed] [Google Scholar]
- 15.Blum JE, Fischer CN, Miles J, Handelsman J. Frequent replenishment sustains the beneficial microbiome of Drosophila melanogaster. MBio. 2013;4:e00860-13. doi: 10.1128/mBio.00860-13. [DOI] [PMC free article] [PubMed] [Google Scholar]
- 16.Pais IS, Valente RS, Sporniak M, Teixeira L. Drosophila melanogaster establishes a species-specific mutualistic interaction with stable gut-colonizing bacteria. PLoS Biol. 2018;16:e2005710. doi: 10.1371/journal.pbio.2005710. [DOI] [PMC free article] [PubMed] [Google Scholar]
- 17.Obadia B, et al. Probabilistic invasion underlies natural gut microbiome stability. Curr Biol. 2017;27:1999–2006.e8. doi: 10.1016/j.cub.2017.05.034. [DOI] [PMC free article] [PubMed] [Google Scholar]
- 18.Staubach F, Baines JF, Künzel S, Bik EM, Petrov DA. Host species and environmental effects on bacterial communities associated with Drosophila in the laboratory and in the natural environment. PLoS One. 2013;8:e70749. doi: 10.1371/journal.pone.0070749. [DOI] [PMC free article] [PubMed] [Google Scholar]
- 19.Adair KL, Wilson M, Bost A, Douglas AE. Microbial community assembly in wild populations of the fruit fly Drosophila melanogaster. ISME J. 2018;12:959–972. doi: 10.1038/s41396-017-0020-x. [DOI] [PMC free article] [PubMed] [Google Scholar]
- 20.Newell PD, Douglas AE. Interspecies interactions determine the impact of the gut microbiota on nutrient allocation in Drosophila melanogaster. Appl Environ Microbiol. 2014;80:788–796. doi: 10.1128/AEM.02742-13. [DOI] [PMC free article] [PubMed] [Google Scholar]
- 21.Beerenwinkel N, Pachter L, Sturmfels B. Epistasis and shapes of fitness landscapes. Stat Sin. 2007;17:1317–1342. [Google Scholar]
- 22.Bordenstein SR, Theis KR. Host biology in light of the microbiome: Ten principles of holobionts and hologenomes. PLoS Biol. 2015;13:e1002226. doi: 10.1371/journal.pbio.1002226. [DOI] [PMC free article] [PubMed] [Google Scholar]
- 23.Wong AC-N, Chaston JM, Douglas AE. The inconstant gut microbiota of Drosophila species revealed by 16S rRNA gene analysis. ISME J. 2013;7:1922–1932. doi: 10.1038/ismej.2013.86. [DOI] [PMC free article] [PubMed] [Google Scholar]
- 24.O’Brien LE, Soliman SS, Li X, Bilder D. Altered modes of stem cell division drive adaptive intestinal growth. Cell. 2011;147:603–614. doi: 10.1016/j.cell.2011.08.048. [DOI] [PMC free article] [PubMed] [Google Scholar]
- 25.Chippindale AK, Leroi AM, Kim SB, Rose MR. Phenotypic plasticity and selection in Drosophila life-history evolution. I. Nutrition and the cost of reproduction. J Evol Biol. 1993;6:171–193. [Google Scholar]
- 26.Leslie PH. On the use of matrices in certain population mathematics. Biometrika. 1945;33:183–212. doi: 10.1093/biomet/33.3.183. [DOI] [PubMed] [Google Scholar]
- 27.Walters AW, et al. 2018. The microbiota influences the Drosophila melanogaster life history strategy. arXiv:10.1101/471540. Preprint, posted November 16, 2018. PLoS Biol, in press.
- 28.R Core Team 2017. R: A Language and Environment for Statistical Computing (R Foundation for Statistical Computing, Vienna), Version 3.3.3.
- 29.Stevens MH. A Primer of Ecology with R. Springer; New York: 2009. [Google Scholar]
- 30.Obadia B, Keebaugh ES, Yamada R, Ludington WB, Ja WW. Diet influences host-microbiota associations in Drosophila. Proc Natl Acad Sci USA. 2018;115:E4547–E4548. doi: 10.1073/pnas.1804948115. [DOI] [PMC free article] [PubMed] [Google Scholar]
- 31.Fischer CN, et al. Metabolite exchange between microbiome members produces compounds that influence Drosophila behavior. eLife. 2017;6:e18855. doi: 10.7554/eLife.18855. [DOI] [PMC free article] [PubMed] [Google Scholar]
- 32.Weinberger ED. Fourier and Taylor series on fitness landscapes. Biol Cybern. 1991;65:321–330. [Google Scholar]
- 33.Yamada R, Deshpande SA, Bruce KD, Mak EM, Ja WW. Microbes promote amino acid harvest to rescue undernutrition in Drosophila. Cell Rep. 2015;10:865–872. doi: 10.1016/j.celrep.2015.01.018. [DOI] [PMC free article] [PubMed] [Google Scholar]
- 34.Paine RT. Food-web analysis through field measurement of per capita interaction strength. Nature. 1992;355:73–75. [Google Scholar]
- 35.Bascompte J, Jordano P, Olesen JM. Asymmetric coevolutionary networks facilitate biodiversity maintenance. Science. 2006;312:431–433. doi: 10.1126/science.1123412. [DOI] [PubMed] [Google Scholar]
- 36.Gellner G, McCann KS. Consistent role of weak and strong interactions in high- and low-diversity trophic food webs. Nat Commun. 2016;7:11180. doi: 10.1038/ncomms11180. [DOI] [PMC free article] [PubMed] [Google Scholar]
- 37.Grilli J, Barabás G, Michalska-Smith MJ, Allesina S. Higher-order interactions stabilize dynamics in competitive network models. Nature. 2017;548:210–213. doi: 10.1038/nature23273. [DOI] [PubMed] [Google Scholar]
- 38.Inamine H, et al. Spatiotemporally heterogeneous population dynamics of gut bacteria inferred from fecal time series data. MBio. 2018;9:e01453-17. doi: 10.1128/mBio.01453-17. [DOI] [PMC free article] [PubMed] [Google Scholar]
- 39.Fast D, Kostiuk B, Foley E, Pukatzki S. Commensal pathogen competition impacts host viability. Proc Natl Acad Sci USA. 2018;115:7099–7104. doi: 10.1073/pnas.1802165115. [DOI] [PMC free article] [PubMed] [Google Scholar]
- 40.Ja WW, Carvalho GB, Madrigal M, Roberts RW, Benzer S. The Drosophila G protein-coupled receptor, Methuselah, exhibits a promiscuous response to peptides. Protein Sci. 2009;18:2203–2208. doi: 10.1002/pro.221. [DOI] [PMC free article] [PubMed] [Google Scholar]
- 41.Brummel T, Ching A, Seroude L, Simon AF, Benzer S. Drosophila lifespan enhancement by exogenous bacteria. Proc Natl Acad Sci USA. 2004;101:12974–12979. doi: 10.1073/pnas.0405207101. [DOI] [PMC free article] [PubMed] [Google Scholar]
Associated Data
This section collects any data citations, data availability statements, or supplementary materials included in this article.