

Summary
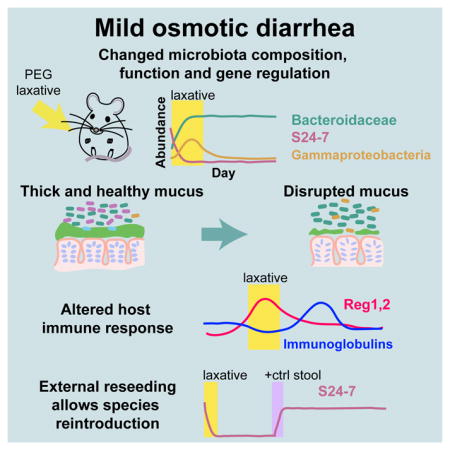
Osmotic diarrhea is a prevalent condition in humans caused by food intolerance, malabsorption, and widespread laxative use. Here, we assess the resilience of the gut ecosystem to osmotic perturbation at multiple length and time scales using mice as model hosts. Osmotic stress caused reproducible extinction of highly abundant taxa and expansion of less prevalent members in human and mouse microbiotas. Quantitative imaging revealed decimation of the mucus barrier during osmotic perturbation, followed by recovery. The immune system exhibited temporary changes in cytokine levels and a lasting IgG response against commensal bacteria. Increased osmolality prevented growth of commensal strains in vitro, revealing one mechanism contributing to extinction. Environmental availability of microbiota members mitigated extinction events, demonstrating how species reintroduction can impact community resilience. Our findings demonstrate that even mild osmotic diarrhea can cause lasting changes to the microbiota and host, and lay the foundation for interventions that increase system-wide resilience.
Keywords: PEG, diarrhea, S24-7, transcriptomics, metagenomics, proteomics, immune monitoring, osmotic perturbation, microbiota, microbiome
ETOC
Mild and transient diarrhea caused by an over-the-counter laxative leads to long-term changes in the gut microbiome of mice
Introduction
Diverse forces can affect microbiota colonization and replacement, yet a paucity of foundational knowledge limits the ability to predict community response to perturbations and to control reprogramming. Perturbations such as fever or diarrhea are perceived as transient. However, temperature and osmolality induce rapid and drastic changes in microbial physiology, and hence may represent additional levers to aid rational community manipulation. Osmolality, the concentration of solute particles in a solution, is a fundamental property affecting bacterial growth, with the steady-state growth rate of a number of species decreasing as the environmental osmolality is increased (Christian and Scott, 1953; Scott, 1953), independent of osmolyte identity (Christian, 1955). Within a mammalian host, osmolality is tightly regulated in blood (Burg and Ferraris, 2008), although it varies in the intestine (Shiau et al., 1985), due to the absorption and secretion of luminal contents and water by epithelial cells. Osmotic diarrhea is a common medical condition that can arise in a variety of situations including lactose intolerance, and celiac and pancreatic disease (Walker et al., 1990). In addition to natural causes, osmotic diarrhea can also be induced. Osmotic laxatives exploit the inability of the epithelium to absorb either specific compounds (such as polyethylene glycol, PEG), or excessive amounts of solutes (such as salts). These unabsorbed solutes osmotically draw water from the intestinal epithelium into the lumen, leading to increased intestinal motility and decreased stool consistency (Klaschik et al., 2003). Over-the-counter osmotic laxatives are prevalent in the industrialized world; Miralax (PEG with average molecular weight 3350) is the second-leading digestive remedy in the United States (Statista, 2014). Alongside prevalent and long-term use due to habituation and dependence, osmotic laxatives are frequently abused by people with eating disorders (Roerig et al., 2010); a reported 10–60% of patients with anorexia or bulimia nervosa use laxatives as a method of weight control, leading to chronic diarrhea (Roerig et al., 2010). Despite widespread usage and occurrence, current understanding of the impact of osmotic laxatives and osmotic diarrhea on the gut microbiota is limited, hindering the development of therapeutic strategies.
The community of microbes living in and on our bodies is intimately connected with diverse aspects of human biology ranging from immune status to metabolic function (Fetissov, 2016; Louis et al., 2014), and shifts in host diet can cause large-scale extinction of commensal species (Sonnenburg et al., 2016). Successful introduction of novel species or re-introduction of extinct species to ecological niches is aided by a deep understanding of the local habitat, microclimate, and other abiotic factors affecting the environment (Haddad et al., 2015). The digestive tract is composed of numerous dynamic and diverse environments created by microbial metabolism and by host attempts to regulate physical and chemical parameters such as temperature, pH, water content, and salt (Donaldson et al., 2016; Tropini et al., 2017). In addition to substantial variation in these parameters along the healthy gut, most diseases cause dramatic changes in the host environment. Cancer and fever increase temperature (Cunha, 2007), inflammatory bowel disease alters gut pH (Nugent et al., 2001), and diarrhea triggers alteration in intestinal osmolality (Shiau et al., 1985). Despite progress in describing gut microbiota composition across various hosts, which have provided insight into the effects of microbiota alteration on human health (Gilbert et al., 2016), the stability of this ecosystem in the face of inevitable environmental perturbations remains poorly understood.
Previous studies have shown that increased gut motility can cause changes in microbiota membership. Still, the factors mediating these changes and their duration are unclear (Fukuyama et al., 2017; Gorkiewicz et al., 2013; Jalanka et al., 2014; Kashyap et al., 2013; Roager et al., 2016). Medically, osmotic diarrhea that lasts less than 14 days is considered an acute and self-limiting condition that does not cause long-lasting effects. If so, then this condition provides the opportunity to understand gut microbiota resilience; however, the host-microbe axis of potential long-term changes has not been adequately interrogated.
In this study, we address numerous facets of host and microbial dynamics during osmotic diarrhea. We use a common, over-the-counter medical laxative to induce mild osmotic diarrhea in a mouse model harboring either a mouse, human, or three-species microbiota. We determine key aspects of microbiota and host response to this perturbation, which dramatically shifts intestinal osmolality and stool motility, encompassing a wide range of state measurements to characterize resilience and health. We find that osmotic perturbation can lead to a new steady state in the microbiota, extinction of key taxa, and lasting changes in the adaptive immune response. By contrast, certain host biological variables such as intestinal mucus and cytokines exhibit resilience after profound perturbation. We further show that increased osmolality impairs in vitro growth of a key taxon that undergoes extinction in vivo. Lastly, we demonstrate that reduced sanitation that provides access to lost taxa restores the original microbiota composition, preventing microbial extinction during diarrhea. Our study provides a powerful and generalizable framework for investigating microbiota resilience to gut perturbation.
Results
Mild Osmotic Diarrhea Alters Microbiota Composition
We employed a humanized microbiota mouse model to determine how osmotic diarrhea impacts gut microbiota composition during and after the perturbation. Germ-free Swiss-Webster mice were colonized with a human microbiota (Methods), (Marcobal et al., 2013; Sonnenburg et al., 2016). To induce diarrhea, we administered 15% PEG in the drinking water of co-housed mice for six days, followed by a PEG-free recovery period (Figure 1A); this treatment was designed to be appreciably milder than PEG-based bowel preparations frequently used to completely clear out the intestines. We measured microbiota membership with 16S rRNA sequencing, and found that the bacterial community similarity measured by principal coordinate analysis (PCoA) shifted within the first 24 h of PEG treatment (Figure 1B, S1A). The abundances of almost all taxa (100% of phyla, classes, and orders, 96% of families, and 97% of genera) equilibrated within 7 days following the end of the PEG treatment (p>0.05 in a comparison of days 13 and 20). However, this steady state was highly distinct from the pre-treatment baseline (Figure 1B, S1A), with more than 75% of the final bacterial abundance representing taxa that were significantly altered relative to baseline two weeks after the cessation of the treatment (p<0.001 at the genus level). In comparison, only 5% of the taxa abundance of control mice (that did not undergo the PEG treatment and were housed in separate cages from sample mice) was significantly different over the same time period. The alpha diversity was also impacted during and after treatment, with a significant decrease during diarrhea (p<10−6, ANOVA) and a return to a stable, but sub-baseline level two weeks post-treatment (day 20, p<0.001, ANOVA) (Figure 1C). To rule out potential sources of variation independent of the treatment, we performed permutational multivariate analysis of variance (PERMANOVA, Methods) on our 16S data. We found no significant effect on being cage mates, or on gender (p>0.05. Figure S1A).
Figure 1. Mild Osmotic Diarrhea Leads to Long-term Changes in Gut Microbiota Membership.

See also Figures S1, S2 and Table S1.
(A) Schematic of experimental design and collection protocol.
(B) The first coordinate of a Principal Coordinate Analysis shows that the composition and beta diversity of the initial microbiota community was not restored two weeks after PEG treatment and diarrhea (Figure S1A).
(C) Alpha-diversity decreased during diarrhea and remained significantly lower than baseline two weeks post-diarrhea.
(D) The highly abundant S24–7 family underwent extinction during PEG treatment, and was replaced by the Bacteroidaceae family. The points represent the mean fractional abundance, and the bars represent the standard error of the mean (s.e.m.).
(E) Dynamic abundance data for each taxon in Figure S2 were classified as PRE (before PEG, controls), DURING (PEG treatment) and POST (1 and 2 weeks of recovery after PEG). The time points in these classifications were averaged (details in Figure S1B) and used to compute taxa enrichment ratios. Akk, Akkermansia; β, Betaproteobacteria; γ, Gammaproteobacteria; Bac, Bacteroidaceae; Firm, Firmicutes; Clos, Clostridia.
To determine which microbes were responsible for the change in diversity, we interrogated 16S rRNA dynamics at various taxonomic levels. Very abundant members became undetectable during the PEG administration and did not recover even after cessation of the treatment, contributing to the long-term change in beta diversity (Figure 1B). In particular, the S24-7 family (order Bacteroidales), a common commensal in homeothermic animals including humans (Ormerod et al., 2016) and recently found to be highly specific for the animal gut (Thompson et al., 2017), underwent apparent extinction in all mice (no detectable sequencing reads) within the first three days of PEG treatment, despite initially comprising nearly 50% of the total microbial abundance (Figure 1D). Concurrently, the Bacteroidaceae family (also order Bacteroidales) underwent a large expansion in all mice from ~20% to ~60% of the total abundance (Figure 1D). Interestingly, the large shifts in these two families canceled at the order level, highlighting the need to analyze abundance changes at different taxonomic levels (Figure 1E, S2, S1B, Methods). Other taxa experienced transient shifts in abundance due to diarrhea, including the Verrucomicrobiae, which steadily decreased by ~25-fold, and the Gammaproteobacteria, which increased from almost undetectable levels to ~6% during treatment, but returned to extremely low levels after 10 days (Figure S1C).
To test the hypothesis that the abundances of more closely related taxa are more likely to be anti-correlated, similar to the replacement of S24-7 by Bacteroidaceae, we performed a correlation analysis on the taxonomic abundance dynamics at the family level (Table S1). We focused on families with negative correlation coefficient, suggesting potential niche competition. S24-7 and Bacteroidaceae exhibited the largest negative correlation coefficient (cc), with a value of −0.9. Families belonging to the same order were significantly more anti-correlated (cc = −0.41) compared to taxa that were more distantly related (cc = −0.28, p = 5×10⁻⁶). This finding suggests that bacterial families are more likely to be replaced by members within the same order.
A Conventional Microbiota Recapitulates the Dynamic Response of Humanized Mice to Osmotic Diarrhea
Next, we asked whether the microbiota response to osmotic diarrhea was sensitive to the starting membership of the community. We wondered whether a microbiota better adapted to the host (i.e., a mouse microbiota) would respond in a more resilient manner. Mice harboring a conventional microbiota showed large dynamical shifts in microbiota membership in response to PEG treatment that were similar to humanized mice (Figure 2A,B, S3A). Specifically, the abundant S24-7 family (22% abundance pre-PEG in this community) became undetectable during and after PEG treatment, while Bacteroidaceae concurrently increased in abundance (Figure S3A). Similar to humanized mice, Gammaproteobacteria increased in abundance during diarrhea and decreased back to baseline early in the recovery (Figure S1C, S3A). To systematically assess the similarity between dynamics, we compared all taxa shared between the humanized and conventional microbiota, and determined whether there were significant changes during two transitions: (i) pre-PEG to PEG, and (ii) PEG to post-PEG. More than 70% of taxa showed similar behavior (significant increase/decrease or no significant change) across the two communities, a level of concordance significantly higher than expected by chance, (44%, p<0.01 at the genus level; Figure S3B; Methods).
Figure 2. A Conventional Microbiota Shows Changes in Composition Consistent with Those in Humanized Microbiota During PEG Treatment, and No Decrease in Culturable Density.

See also Figure S3.
(A,B) Taxon enrichment during vs. pre-PEG (A) and post- vs. pre-PEG (B) treatment for a conventional microbiota exhibited similar patterns as in humanized mice (Figure 1E).
(C) The mass of the cecum increased significantly during diarrhea, while the masses of the small and large intestines were not affected (mean and s.d.).
(D) Culturable bacterial densities in the cecum did not decrease significantly during diarrhea. The points represent the (mean and s.d).
(E) Total aerobic CFU counts in PBS-washed intestines increased significantly in the cecum during PEG treatment compared to control (untreated) mice (mean and s.d.).
Viable Bacterial Load Does Not Decrease During Osmotic Diarrhea
Having observed large changes in relative abundance during PEG treatment and recovery, we asked whether the viable bacterial load was affected by PEG treatment. After six days, the total mass of the cecum from mice treated with PEG was approximately three times that of untreated mice (1.42 g vs. 0.52 g, p=0.0002, ANOVA), consistent with reduced water retention in host cells from the osmotic laxative (Figure 2C). The masses of the small and large intestines were unchanged (Figure 2C). Despite the prolonged perturbation, the densities of culturable aerobic and anaerobic bacteria from cecal contents of conventional mice did not decrease during PEG treatment (Figure 2D). Similarly, total culturable microbial loads were not decreased in the different gastrointestinal compartments during diarrhea (Figure 2E. S3C). Altogether, these results indicate that PEG-induced osmotic diarrhea applies a broad-spectrum perturbation to the gut microbiota that causes large shifts in microbiota membership, but nevertheless bacterial density and load are remarkably stable.
Host Epithelium, Mucus Layer, and Luminal Environment are Disrupted During PEG Treatment
Since we found that Akkermansia (phylum Verrucomicrobia), a notable human microbiota member specializing in host mucus consumption, decreased in abundance during diarrhea (Figure S1C), we hypothesized that PEG may lead to reduced mucus availability. We harvested and fixed intestinal segments from our humanized mouse experiment and prepared them for imaging (Methods) (Earle et al., 2015). In an untreated mouse, the mucus protecting the distal colonic epithelium was thick and continuous (mean: 34.2 ± 9.7 μm; Figure 3A,B) (Desai et al., 2016; Earle et al., 2015; Johansson et al., 2013). During diarrhea, we observed a striking decrease in mucus thickness (mean: 10.0 ± 1.9 μm, p=0.016, ANOVA; Figure 3A–C S4A,B). Occasional areas of sparse mucus during and immediately after PEG treatment also exposed the epithelium to direct contact with bacteria (Figure 3A inset, S4A). Nonetheless, the mucus recovered to nearly full thickness within three days after cessation of PEG treatment, with complete recovery by day 20 (mean: 36.9 ± 12.5 μm, p>0.05 compared to pre-PEG thickness), indicating resilience of the mucus layer following the decimation caused by osmotic diarrhea.
Figure 3. The Colonic Environment and Mucus Are Disrupted During Mild Osmotic Diarrhea.

See also Figure S4.
(A) (Top) schematic of distal colon morphology observed during dissection. (Bottom) Fluorescently labeled distal colon sections before (left), during (middle), and after (right) PEG treatment. Inset in day 6 image illustrates bacteria in direct contact with the epithelium (arrow). Blue, DAPI staining in the epithelium; red, DAPI staining in gut lumen, including bacteria and plant matter; green, combined MUC2 antibody and UEA-1 staining.
(B) Quantification of mucus thickness distributions along the epithelium shows that during PEG treatment, the mucus was often completely abraded, unlike in control mice.
(C) Mucus thickness determined from UEA-1 (red) and MUC2 (blue) signals decreased during PEG treatment, but recovered to pre-treatment levels by three days after treatment ends (mean and s.e.m., n=2–5).
(D) Host epithelial nuclei flattened and became more elongated during diarrhea due to water excretion.
(E) Quantification of epithelial nuclei flattening (Methods) shows that nuclei were significantly flatter during PEG treatment than prior to the perturbation (0.43 vs. 0.30, respectively, p=0.0034, ANOVA; mean and s.d.).
(F) Fluorescence micrographs of regions of the colon not occupied by a pellet (as shown in top schematic), stained as in (A). Bacteria (red arrows) were rarely observed in these sections of the colon.
(G) Expression of mucin glycoside hydrolases assessed by RNA-seq in a three-member model microbiota (Fig. S4F) was significantly downregulated during PEG treatment (median 6.8×10⁻⁶ vs. 14×10−6, p=0.0002).
In bacteria, increased osmolality is known to cause a reduction in cell volume due to passive water excretion, a process that occurs on the time scale of seconds (Rojas et al., 2014; Tropini et al., 2014). To determine whether the epithelium exhibited similar signs of osmolality shift, we assayed the morphological response of epithelial cells. During diarrhea, the morphology of the epithelial nuclei was reversibly altered, with host nuclei clearly elongated and stretched days after the onset of PEG treatment (Figure 3D,E), a change In shape consistent with osmotic perturbation and water excretion. This shape change was most extreme at the beginning of PEG treatment, with nuclei exhibiting a slow relaxation back to their pre-treatment morphology that lasted several days after treatment stopped, suggesting a time scale of recovery similar to that observed for mucus.
PEG treatment also resulted in striking changes to the luminal contents. In an untreated colon, regions with concentrated bacteria and plant matter compacted into a pellet (Earle et al., 2015) were interspersed by sections of collapsed epithelium separated essentially by mucus alone, with very few bacteria present (Figure 3F). By contrast, during diarrhea, pellets were not present and the distribution of material within the colon appeared homogenous, possibly owing to increased liquidity of luminal contents. Thus, the physical structure of the intestine was reconfigured during osmotic diarrhea. To investigate whether decreased mucus thickness affected epithelial physiology, we analyzed haemotoxylin and eosin (H&E)-stained sections of the colon and ileum. There was no significant epithelial damage, no neutrophil or eosinophil infiltration, and no significant accumulation of lymphoid cells or granulocytic infiltrates, indicating no histological inflammation (Figure S4C).
Osmotic Stress Genes are Over-represented During PEG Treatment
The profound alteration of microbiota composition caused by osmotic diarrhea prompted us to investigate whether the community gene content, as an indicator of functional capacity, was altered during and after the perturbation. We performed Illumina HiSeq shotgun sequencing on DNA prepared from individual mouse cecal contents. To investigate whether the osmotic changes had an impact on community functionality, we analyzed the changes in genetic functional pathways using the MG-RAST pipeline and SEED Subsystems annotation (Meyer et al., 2008) (Methods). Consistent with the use of an osmotic laxative and stool consistency change in the gut, genes involved in osmotic and desiccation stress and membrane transport significantly increased in abundance, unlike genes involved in acid and heat stress, which were significantly under-represented (Figure S4D). These data suggest that osmotic disturbance leads to a large shift in the community functional potential, possibly by selecting for community members well-adapted to withstand the associated stress.
Functional Consequences of a Mucus-depleting Perturbation
The large changes in the colonic environment and microbiota composition during mild osmotic diarrhea motivated us to investigate functional changes within the community during PEG treatment at the transcriptional level. To eliminate the confounding effects of large-scale changes in community composition, we employed a gnotobiotic mouse model with a defined microbiota composed of three bacterial species from distinct phyla that we predicted were unlikely to undergo replacement during osmotic perturbation. We isolated two members from control mice of our humanized experiment: Enterococcus hirae (Eh) and a previously unannotated Lachnospiraceae (La). The third member we selected was Bacteroides thetaiotaomicron (Bt), a well-characterized representative of the Bacteroidaceae family that can consume mucus (Desai et al., 2016; Earle et al., 2015). We colonized germ-free mice with this defined community, and exposed them to a similar experimental regimen as the humanized mice (Methods, Figure lA. S4E). During PEG treatment, Eh abundance increased from ~10% to ~30% by the second day after starting PEG treatment, coincident with decreases in Bt and La abundances (Figure S4E). All three species stabilized at these new levels for the rest of PEG treatment; Bt and Eh abundances returned to pre-treatment levels within two days after PEG removal, while the low-abundance La was still increasing back to pre-treatment levels by day 13 (Figure S4E).
We prepared samples from cecal contents for RNA-seq (Methods), and identified the most affected genes (Figure S4F). Within the glycoside hydrolases, mucin-degrading enzymes were significantly under-expressed during diarrhea (Figure 3G). Although mucus can serve as a structural scaffold and nutrient source to support the microbial community during times of perturbation, these data indicate that the community was less reliant on mucus as a carbon source during osmotic diarrhea, consistent with the reductions in Verrucomicrobia abundance (Figure S1C) and mucus thickness (Figure 3A) in mice harboring a complex community.
PEG Treatment Impacts Host Immune Responses
Changes to the mucosal environment have previously been shown to impact inflammatory responses (Chassaing et al., 2015; Desai et al., 2016; Earle et al., 2015), prompting us to investigate whether PEG treatment caused a change in innate and adaptive immunity to commensal microbes. To query the innate host response in an unbiased fashion, we analyzed the secreted cecal host proteome and monitored its dynamics over the course of our humanized mouse experiment (Methods). The secreted host proteome showed distinct dynamical patterns during and after PEG treatment.
Longitudinal protein clustering showed significantly enriched lithostathine (RegI) during diarrhea, and enriched immunoglobulins during recovery (Figure 4A,B, S5A, Table S2). Lithostatine is a member of the Reg family of C-type lectins, which are anti-bacterial innate mucosal immune effectors (Cash et al., 2006). To investigate the adaptive immune response, we collected serum from the three-member-colonized gnotobiotic mice, and performed an ELISA assay against each of the members of the gnotobiotic community (Methods). Bt and Eh-specific IgG in the serum transiently increased after PEG treatment compared to untreated control mice, indicating that diarrhea stimulates an adaptive immune response to gut commensals (Figure 4C,D). In the case of Bt, median IgG levels had not returned to baseline by day 20. Interestingly, the IgG response to Eh continued to increase even at the end of the time course, despite bacterial abundances having returned to baseline levels by two days after the cessation of PEG treatment (Figure S4E), illustrating distinct trajectories of the immune response to different gut commensals (Figure 4C–E). Notably, the host immune system responded to Bt capsular polysaccharides undergoing phase-variable expression over the course of the perturbation (Figure 4F–H, S5B,C). While the IgG response peaked well after PEG treatment was initiated, affected cytokine levels changed at the beginning of PEG treatment and re-equilibrated before the last day of osmotic diarrhea (Figure S5D). Thus, the time scale of immune response varies across bacterial species, and in some cases only re-equilibrates weeks after the perturbation. In sum, these data show that even mild osmotic diarrhea can impact the immune system of the host, in both punctuated and sustained fashions.
Figure 4. Mild Osmotic Diarrhea Affects Host Immune Responses.

See also Figure S5 and Table S2.
(A) Quantitative proteomics of ceca revealed host proteins that are correlated with diarrhea induction. The scale represents the Z-score (Methods).
(B) Immunoglobulins were downregulated during diarrhea and then increased back to control levels during recovery. A cluster of proteins upregulated during PEG (top) included lithostathine (Reg1, Reg2), ferritin (Fth1), and other digestive and pancreas-secreted proteins.
(C–E) Serum IgG ELISA against whole cells of E. hirae (Eh, C) and B. thetaiotaomicron (Bt, D) showed significant increases due to PEG treatment, with Eh continuing to increase two weeks after the end of treatment. A Lachnospiraceae member (E) did not show significant increases, although some mice had more than three-fold higher levels of IgG one week after the end of treatment. Each time point represents three mice except for day 3, which is represented by two mice.
(F) The Bt expression ratio of capsular polysaccharide loci CPS4 to CPS5 increased significantly during PEG treatment.
(G,H) Serum IgG ELISA against Bt cells expressing only CPS4 (G) or CPS5 (H) showed significant increases one week after the end of PEG treatment.
To further investigate whether osmotic diarrhea led to other types of host responses not detectable by H&E stain, we queried the host stool proteome for proteins known to be involved in epithelial damage repair (Figure S4C). We analyzed the annexin (A2, A4, A7, and A13) and cadherin (1, 17, and related family members 2 and 5) protein families. Overall, we found stability in the secreted host proteome of these repair proteins across time points during and following osmotic diarrhea (ANOVA, p>0.05 comparing control, day 6, 7, 9, 13, 20, Figure S5E); Cadherin 1 was among a group of proteins significantly depleted during diarrhea compared to the rest of the time course (Cdh1, Figure 4A), consistent with detectable but mild epithelial response to the treatment. To investigate whether host mucus production was altered during diarrhea, we analyzed MUC2 levels present in the host proteome. We found no significant difference in MUC2 over the time course (Figure S5F), suggesting that the observed reduction in mucus is not due to decreased production by the host. Combined with the lack of epithelial damage observed in scoring of H&E-stained sections (Figure S4C), these results indicate that, despite the depletion of the mucus layer at the epithelial interface, the host epithelium is not damaged during PEG treatment.
Increased Osmolality Strongly Inhibits S24-7 Growth In Vitro
We hypothesized that changes to intestinal osmolality during osmotic diarrhea would cause host-independent effects on the microbiota. During our conventional mouse experiment, we measured the extent to which PEG treatment changed intestinal solute concentration by extracting the liquid fraction of the cecal contents and measuring the osmolality (Methods). During PEG treatment, the osmolality increased significantly to a mean 810 mOsm/kg (from 533 mOsm/kg, p=0.0006), while blood osmolality remained unchanged (Figure 5A). This osmolality shift, equivalent to more than six atmospheres of osmotic pressure, can greatly impact bacterial physiology (Christian, 1955).
Figure 5. S24–7 Isolate Does Not Grow In Vitro at In Vivo PEG Diarrhea Osmolality Levels.

See also Figure S6.
(A) Cecum osmolality increased significantly during osmotic diarrhea, while blood osmolality was maintained.
(B–F) In vitro growth of B. thetaiotaomicron (B), E. hirae (C), M. intestinale (S24–7 family) (D–E), and a Lachnospiraceae member (F) was negatively impacted by increased osmolality via PEG addition as measured by growth rate (left) and maximum OD (right) normalized to the maximum value across all concentrations of all osmolytes (Mean and s.d., n=3; Figure S6). M. intestinale showed no growth at 720 mOsm/kg PEG, whereas the other three species grew at much higher osmolalities. In (B,C) and (F), NaCl and sorbitol data were used to create the linear fits (black solid lines), while in (E) PEG was also included. The dotted lines represent 95% confidence intervals of the linear fits.
We therefore investigated the in vitro growth response of an S24-7 isolate (Muribaculum intestinale, Methods) and the three members of the gnotobiotic community experiment. We grew each organism in media containing increasing amounts of various osmolytes (sorbitol, sodium chloride, or PEG) across a range spanning the measured in vivo osmolality, and characterized population growth parameters (Figure 5B–F, S6A). All species exhibited large, osmolyte-independent growth defects with increasing osmolality (Figure 5B–F, S6A), qualitatively similar to previous findings (Christian and Scott, 1953; Scott, 1953). S24-7 showed the largest growth defect out of the tested organisms, exhibiting no growth at osmolalities greater than 700 mOsm/kg independent of solute (Figure 5D,E), while the other tested species sustained growth at those osmolalities (Figure S6A). These data suggest that S24-7 might be incapable of growth during osmotic diarrhea specifically due to the high osmolality (Figure 5A), and hence undergo extinction due to displacement. PEG showed the largest effect of the three osmolytes for La, Bt, and Eh, indicating that PEG might have additional cytotoxicity effects that are osmolality-independent. Bt and S24-7 showed larger reductions in growth rate and maximum optical density than Eh or La at a given osmolality (Figure 5). As Bt and S24-7 are Gram-negative whereas Eh and La are Gram-positive, these data could be explained by a general trend in which Gram-negative species are more sensitive to the osmotic environment, potentially due to the different architecture of their cell walls.
Reduced Sanitation and Lower PEG Concentration Allow S24-7 Maintenance
The high sensitivity of S24-7 to osmolality prompted us to ask whether this family would be maintained under a lower dose of PEG, and whether reintroduction after the cessation of osmotic diarrhea would allow recolonization. To test the effect of environmental availability of S24-7, we performed a PEG-treatment experiment in which we did not change mouse cages upon the end of PEG treatment, as we did in all previous experiments (Figure 1A); instead, we changed the cages on day 10, four days after the beginning of the recovery period (Figure 6A). We reasoned that not changing cages would provide a natural reservoir of bacteria during recovery either via coprophagy or passive exposure.
Figure 6. Lack of sanitation rescues S24–7 extinction.

See also Figure S7 and Table S3.
(A) Experimental schematic and collection protocol with schedule of cage cleaning. Three cohorts of mice were treated with 5, 10, and 15% PEG in the cage drinking water.
(B) Relative abundances of S24–7 (left), Bacteroidaceae (middle) and Gammaproteobacteria (right) at different PEG concentrations. Mean and s.e.m. (n=3).
(C) The first coordinate of a Principal Coordinate Analysis for 15% PEG shows that the composition and beta diversity of the initial microbiota community was restored two weeks after PEG treatment and diarrhea.
(D) Introduction of stool from control mice (inset, purple rectangle) after 4 weeks of S24–7 absence following PEG treatment allowed recolonization by S24–7. Mean and s.e.m. (n=3).
We administered various concentrations of PEG in the water (5%, 10%, and 15%) and assessed the stool consistency (Bristol stool score), mouse mass change, and microbiota composition by 16S rRNA sequencing (Figure 6A, S7A,B). Despite the lower (more solid) stool scores in 5% and 10% PEG mice compared to 15% PEG (Figure S7A), we nonetheless observed large changes in microbiota composition, including a graded response to PEG treatment in several taxa. Specifically, we found that 46 out of 170 taxa (across phylum to genus levels) showed a monotonic increase or decrease in abundance during PEG as a function of PEG concentration (Table S3); notable examples were S24-7 and Gammaproteobacteria (Figure 6B, Table S3). At lower PEG concentrations, a smaller fraction of taxa exhibited altered abundance, with 29.9% of genera showing statistically unchanged abundance for 5% PEG, 22.5% for 10% PEG, and 17.6% for 15% PEG (which comprise 84%, 75%, and 67% of the total number of genera, respectively). Nonetheless, at all PEG concentrations, we observed distinctive decreases in S24-7 and increases in Bacteroidaceae (Figure 6B). While S24-7 became undetectable during 10% and 15% treatment, the family was maintained at a stable, low level during 5% PEG treatment and thereafter was detectable in all cages (Figure 6B), indicating that it can be maintained at lower PEG doses. Moreover, unlike in our previous experiments, S24-7 returned to pre-treatment levels in mice treated with 5%, 10% and 15% PEG, signifying that reintroduction from the cage reservoir was sufficient to restore its contribution to community composition. In fact, for 10% and 15% treatment, 99% and 96%, respectively, of the genera exhibited statistically unchanged abundances between controls and 2 weeks post-PEG treatment (comprising 96% and 89% of the total number of genera, respectively), demonstrating that lack of cage sanitation allowed the community to return to the pre-treatment state upon PEG removal, despite the massive compositional changes during treatment (Figure 6B,C, S7C). Interestingly, the post-treatment S24-7 levels In mice treated with 5% PEG were significantly different from 10% or 15% (Figure 6B), and only 69% of taxa were unchanged between control and post-PEG samples, indicating that the final microbiota state is PEG dose-dependent.
These data showing the recovery of S24-7 suggested that lost taxa might be able to re-colonize microbiotas in which they were undetectable for several days. We challenged mice that had undergone PEG treatment and had no detectable S24-7 after four weeks with freshly collected stool from control mice that had not undergone any treatment (Figure 6D). S24-7 was at detectable levels by one day following the addition of control stool (day 35), and was statistically indistinguishable from pre-treatment levels within 2 days (~20% abundance, day 36; Figure 6D). Consistent with the occupation of a similar niche, increase of S24-7 during stool mixing coincided with decrease of the Bacteroidaceae family, which returned to the original levels (Figure S7D). Thus, while co-housing of PEG-treated mice in clean cages is not sufficient for the re-establishment of S24-7 (Figure 1D), the presence of S24-7 in the environmental reservoir is sufficient to re-establish its presence in the host following osmotic perturbation, reversing extinction.
Discussion
In this study, we have shown that an osmotic laxative can cause a long-lasting perturbation to the gut microbiota that is similar across different initial microbiota compositions (Figure 1, 2, S4E). Our results suggest that the response of the microbiota to PEG treatment is influenced by host-related factors such as colonic mucus loss and changes in immune system function, as well as host-independent growth inhibition due to changed osmolality. The very prevalent family S24-7 becomes effectively extinct during diarrhea (Figure 1D,E, 2B, S3A), and is not resilient to the treatment without external re-seeding (Figure 6B,D). Importantly, S24-7 extinction during osmotic diarrhea indicates that the factors that dictate a taxon’s ability to flourish at steady state are discrete from the ability to persist through perturbation. This finding parallels the eradication of Clostridium difficile using a fecal microbiota transplant (FMT) as the perturbation (van Nood et al., 2013). We still do not know whether S24-7 actively reinforces its own existence, similar to C. difficile toxin production. Furthermore, our data demonstrate that a taxon capable of expanding to high levels during perturbations, such as the Bacteroidaceae, can be held at bay by the prevailing community.
As the microbiota becomes incorporated into personalized medical approaches, the ability to improve or ablate resilience of particular parameters of the microbial ecosystem and host interaction will be imperative. Gut microbiota resilience has historically been addressed from the standpoint of membership dynamics during and after the perturbation. Our current study shows that higher taxonomic levels can exhibit only subtle dynamical patterns that mask more dramatic changes occurring in specific subtaxa. This is consistent with competition between closely related clades that utilize similar resources, and have the potential for exchanging niches. Moreover, our data illustrates how a focus on 16S rRNA sequencing provides only a limited understanding, and is blind to important insights such as the effect of diarrhea on host mucus (Figure 3), spatial organization of the gut microbiota (Figure S4G), or the immune responses that continue to change after microbiota composition has equilibrated (Figure 4).
The extinction of S24-7 family members indicates that they generally have low fitness during PEG treatment. S24-7 is a largely uncultured and minimally characterized family (Ormerod et al., 2016). In vitro growth of an S24-7 isolate showed a significantly reduced tolerance to increased osmolality compared to other commensals (Figure 5). The loss of species in the industrialized microbiota is well-documented (Blaser and Dominguez-Bello, 2016; Sonnenburg et al., 2016), and the recovery of S24-7 by environmental availability (Figure 6) highlights the relevance of sanitization in the extinction and re-acquisition of microbiota members following perturbations. Carefully timed recolonization strategies may be required to restore taxa that have been lost, and may be implemented to mitigate additional extinction of species during microbiota-disrupting perturbations. We do not yet know whether loss of S24-7 may lead to negative or positive health outcomes; regardless, the overall reduced diversity experienced after osmotic diarrhea (Figure 1C) has been linked to common Western diseases such as Crohn’s disease, ulcerative colitis, or irritable bowel syndrome (Lozupone et al., 2012). Our study shows that decreased diversity due to PEG treatment may be reversed via reintroduction of the pre-disturbance microbiota (Figure S7E).
While PEG treatment significantly reshaped the microbiota, we found that the host was largely resilient to osmotic perturbation. The gut luminal and epithelial environment were grossly altered during mild osmotic diarrhea; nonetheless, recovery ensued within days of the end of the perturbation (Figure 3). Thinning of the mucosal layer during the perturbation (Figure 3A) was correlated with reduction of the mucus-consuming bacterium Akkermansia (Figure S1C) and a decrease in mucin glycoside hydrolase expression (Figure 3G), suggesting a microbiota-driven feedback mechanism aiding mucus resilience. Consistent with these observations, other studies have found that increased mucin utilization is correlated with increases in mucin-degrading species (Schwab et al., 2014). While the mucus recovered after cessation of PEG treatment (Figure 3A), the transient decrease in mucosal barrier function can have important implications for the interaction between host and microbiota. Given our previous observation that the enteric pathogen Clostridium difficile is better able to colonize mice following PEG treatment (Ferreyra et al., 2014), our current findings highlight possible infection-promoting side effects of common laxatives.
Our results also Indicate that the Immune system responds to PEG perturbation In both global and microbe-specific manners, and the response persists approximately one week after diarrhea (Figure 4). This result argues strongly against the perception that osmotic diarrhea has minor Impact on the host. Inflammatory diarrhea has long been known to lead to an immune response (Hodges and Gill, 2014), and here we demonstrate that the immune system is also altered by osmotic diarrhea. These unintended consequences of PEG treatment are particularly important in light of the increased use of osmotic laxatives in pediatric populations, where the long-term health impact of PEG-related immune response is currently unknown.
Here, we have employed a multi-scale and multi-pronged methodology to define the impact of osmotic diarrhea on the gut microbiota. We still do not fully comprehend the complex landscape of microbial fitness in the gut, and simplified in vitro experiments will likely aid in teasing apart host-independent effects related to osmolality changes. Species-dependent sensitivity to increasing osmolality (Figure 5) indicates that simple biophysical constraints may shape the gut community response. As phages rely on host growth conditions to infect bacteria, the disrupted environment is likely to affect their invasion and thereby impact microbiota membership; in support of this hypothesis, we observed that viruses indeed undergo distinct dynamical patterns during PEG treatment (Figure S7F,G). Still, there are many unknown drivers of community membership during perturbations. On short time scales (minutes), the response of bacterial cells to osmotic shocks can impact growth rate (Rojas et al., 2014; 2017), and may set an initial benchmark for microbiota survival. Furthermore, as intestinal motility increases and mucus is depleted, adhesion of bacteria to surfaces and their ability to colonize crypts may play an important role in maintaining microbial gut residence in the face of large-scale perturbations such as diarrhea. Lastly, a major component of adaptation to a dysbiotic environment is the ability to survive the host immune response, and hence is key to ensuring long-term survival. As the microbiota is increasingly appreciated as an essential part of our health, translating these key insights will be essential for generating novel probiotic strategies that address the unintended consequences of osmotic laxatives. More generally, an improved understanding of the connections between the physicochemical environment and microbiota composition and function is likely to increase the success rate of diverse microbiota-targeted therapeutic approaches.
STAR Methods
KEY RESOURCES TABLE
| REAGENT or RESOURCE | SOURCE | IDENTIFIER |
|---|---|---|
| Antibodies | ||
| Mouse Mucin 2 Antibody (H-300) | Santa Cruz Biotechnology | sc-15334 |
| Alexa Fluor® 488-AffiniPure Donkey Anti-Rabbit IgG (H+L) | Jackson ImmunoResearch | 711-545-152 |
| HRP-conjugated goat anti-mouse IgG | Abcam | ab6789 |
| HRP-conjugated goat anti-mouse IgA | Abcam | ab97235 |
| Bacterial and Virus Strains | ||
| Bacteroides thetaiotaomicron VPI-5482 | ATCC | ATCC 29148 |
| Enterococcus hirae | This study | N/A |
| Lachnospiraceae sp. | This study | N/A |
| Muribaculum intestinale | DSMZ | DSMZ 28989 |
| Chemicals, Peptides, and Recombinant Proteins | ||
| Rhodamine-labeled Ulex Europaeus Agglutinin I | Vector Labs | Cat# RL-1062 |
| Polyethylene glycol (PEG) 3350 | MiraLAX, Bayer | MiraLAX |
| Chopped meat medium (CM) | Anaerobe Systems | AS-811 |
| Columbia blood agar | Anaerobe Systems | AS-895 |
| RNAprotect | Qiagen | 76506 |
| TRIzol | Ambion | 15596-026 |
| cOmplete EDTA-free protease inhibitor cocktail | Roche | 11697498001 |
| Critical Commercial Assays | ||
| Ribo0 Epidemiology kit | Illumina | MRZE724 |
| HT Illumina Stranded mRNA kit | Illumina | RS-122-2103 |
| RNeasy Mini kit | Qiagen | 74106 |
| TruSeq Nano DNA library prep | Illumina | FC-121-4003 |
| DC Protein Assay | BioRad | 500-0112 |
| 1-step ABTS kit | ThermoFisher | 37615 |
| PowerSoil HT DNA Isolation Kit | Qiagen | 12955 |
| Puregene | Qiagen | 158567 |
| DNeasy Blood and Tissue | Qiagen | 69504 |
| Deposited Data | ||
| Proteomics dataset | ProteomeXchange | PXD009364, DOI: 10.6019/PXD009364 |
| Metagenomics, metatranscriptomics and 16S dataset | Stanford Digital Repository | https://purl.stanford.edu/kw691rt5031 |
| Experimental Models: Organisms/Strains | ||
| Swiss Webster Mice – Germ Free | Taconic | SW GF |
| Swiss Webster Mice – Restricted Flora | Taconic | SW RF |
| Oligonucleotides | ||
| Bacteroides FISH probe: CCAATGTGGGGGACCTT | Manz et al., 1996 | N/A |
| Lachnospiraceae FISH probe: TCTTCCCTGCTGATAGA | Kong et al., 2010 | N/A |
| Enterococcus FISH probe: TCACGCGGCGTTGCTC | Küsel et al., 1999 | N/A |
| Software and Algorithms | ||
| QIIME v.1.8 | Caporaso et al., 2011 | N/A |
| BacSpace | Earle et al., 2015 | N/A |
| DEseq2 | Anders and Huber, 2010 | N/A |
| FastQC v. 0.11.4 | FastQC | N/A |
| Cutadapt v. 1.9.1 | Martin, 2011 | N/A |
| BWA v. 0.7.10 | Li and Durbin, 2010 | N/A |
| Diamond v. 0.8.18 | Buchfink et al., 2014 | N/A |
| R v. 3.2.1 | Ihaka and Gentleman, 1996 | N/A |
| MATLAB 2017a | Mathworks | N/A |
| ggplot2 v. 2.1.0 | WickhamHadley | N/A |
| bowtie2 v. 2.3.09 | (Ben Langmead and Salzberg, 2012 | N/A |
| Trimmomatic 0.36 | Bolger et al., 2014 | N/A |
| metaSPAdes v. 3.10.1 | Nikolenko et al., 2013; Nurk et al., 2017 | N/A |
| VirSorter v. 1.0.3 | Roux et al., 2015 | N/A |
| Anvi’o v. 3 | Eren et al., 2015 | N/A |
| Prokka v. 1.10 | Seemann, 2014 | N/A |
| Super-deduper v. 2.0 | Petersen et al. 2015 | N/A |
| ProteomeDiscoverer v. 2.1.0.81 | ThermoFisher | N/A |
| Qlucore | Qlucore | N/A |
CONTACT FOR REAGENT AND RESOURCE SHARING
Further information and requests for resources and reagents should be directed to and will be fulfilled by the Lead Contact, Justin Sonnenburg (jsonnenburg@stanford.edu).
EXPERIMENTAL MODEL AND SUBJECT DETAILS
MICE
All animal experiments were performed in accordance with the Stanford Institutional Animal Care and Use Committee. All animals were 6–12 weeks of age, both genders were used, and all mice were co-housed with at least two mice per cage. At least three mice per group/condition were used and littermates of the same sex were randomly assigned to experimental groups. For gnotobiotic mouse experiments, Swiss-Webster germ-free (GF) mice were maintained in gnotobiotic isolators and either humanized at eight weeks of age by oral gavage of 200 μL of fecal sample from a healthy human donor, or gavaged with a 1:1:1 optical density (OD) at 600 nm mix of isolated bacterial cultures from stationary phase for the three-member community study. Mice were fed an autoclaved standard diet (Purina LabDiet 5K67) for the duration of their lives. After four or two weeks of equilibration for the humanized and three-member communities, respectively, 15% polyethylene glycol (PEG) 3350 (Miralax) was added to the drinking water for six days, followed by two weeks of recovery with non-supplemented water, unless otherwise stated. Swiss-Webster mice with a conventional mouse microbiota were also used following the regimen described above for humanized gnotobiotic mice.
BACTERIA
All bacteria used in the study were grown anaerobically (85% N2, 10%CO2, 5% H2) at 37°C. Bacteroides thetaiotaomicron VPI-5482 was grown in tryptone - yeast extract - glucose (TYG) growth medium (per liter: 10 g Bacto Tryptone, 5g yeast extract, 2g glucose, 0.5g L-cysteine, 100 ml of 1 M pH 7.2 KPO4, 1 ml of 1 mg/ml vitamin K3 solution, 40 ml of TYG salts solution (per liter: 0.5 g MgSO4-7H2O, 10 g NaHCO3, 2 g NaCl), 1 ml of 0.8% CaCl2 solution, and 1 ml of 0.4 mg/ml FeSO4, autoclaved then added 1 ml hematin-histidine solution (12 mg hematin dissolved in 10 mL 0.2 M pH 8 histidine solution)). The S24–7 representative (Muribaculum intestinale, DSMZ 28989) was grown on chopped meat medium (CM, Anaerobe Systems AS-811) or Columbia blood agar (DSMZ Medium 693, Anaerobe systems AS-895); all other isolates were grown in GAM medium (Gifu anaerobic broth, per liter: Peptic digest of animal tissue 10.0 g, Papaic digest of soyabean meal 3.0 g, Proteose peptone 10.0 g, Digested serum 13.5 g, Yeast extract 5.0 g, Beef extract 2.2 g, Liver extract 1.2 g, Dextrose 3.0 g, Potassium dihydrogen phosphate 2.5 g, Sodium chloride 3.0 g, Starch - Soluble 5.0 g, L-Cysteine hydrochloride 0.3 g, Sodium thioglycollate 0.3 g, final pH (at 25°C) 7.3±0.1 and autoclaved.)
The 16S rRNA gene for Muribaculum intestinale was present in our humanized mouse microbiota at 98% similarity (within a single OTU, 185550, present at 10−4 relative abundance in humanized control mice, Figure S6B) and was therefore chosen for in vitro characterization. For plate reader experiments, S24–7 was grown in 20% spent CM in mYCFA (DSMZ Medium 1611, per liter: Casitone 10 g, Yeast extract 2.50 g, Glucose 5 g MgSO4 × 7 H2O 45 mg, CaCl2 × 2 H2O 90 mg, K2HPO4 0.45 g, KH2PO4 0.45 g, NaCl 0.9 g, NaHCO3 4 g, L-Cysteine-HCl 1 g, Hemin 10 mg; Volatile fatty acids: Acetic acid 1.90 ml, Propionic acid 0.70 ml, iso-Butyric acid 90 μl, n-Valeric acid 100 μl, iso-Valeric acid 100 μl; Vitamin solution, per liter: Biotin 2 mg, Folic acid 2 mg, Pyridoxine-HCl 10 mg, Thiamine-HCl × 2 H2O 5 mg, Riboflavin 5 mg, Nicotinic acid 5 mg, D-Ca-pantothenate 5 mg, Vitamin B12 0.10 mg, p-Aminobenzoic acid 5 mg Lipoic acid 5 mg. Ingredients were dissolved (except NaHCO3, hemin, cysteine) in water and boiled for 10 min, then cooled to room temperature. NaHCO3, hemin, cysteine were added, pH-adjusted to 6.7–6.8, and autoclaved).
All media were supplemented with a range of concentrations of sodium chloride, sorbitol, or PEG (Miralax) as stated in the text, and filtered before use. Cells were grown overnight in medium with no added solutes and then back-diluted into the supplemented medium. Due to the slow growth of S24–7, overnight cultures from a single colony into 7 mL CM were inoculated at 1:5 dilution. All other cultures were inoculated 1:100 from an overnight culture from a single colony. PEG addition to CM media led to an increase in optical density, likely due to protein precipitation.
Bacterial growth curves were obtained using a PowerWave 340 plate reader (BioTek, Winooski, VT) at 37 °C inside an anaerobic chamber. At least three replicates were performed for each growth condition. OD600 measurements were collected every 15 min, unless otherwise stated. Growth rates were calculated from a linear fit of the region of the growth curve exhibiting linearity in log space after background absorbance subtraction from un-inoculated wells.
METHOD DETAILS
Tissue Collection and Imaging
Mice were sacrificed throughout the experiment by carbon dioxide asphyxiation followed by cervical dislocation or cardiac puncture. Sections of the colon and cecum were collected and immediately fixed in methacarn solution (60% dry methanol, 30% chloroform, 10% glacial acetic acid) and processed in paraffin as previously described (Earle et al., 2015; Johansson and Hansson, 2012). Briefly, after 3 hrs to 2 weeks of fixation, sections were washed twice in dry methanol for 30 min, twice in absolute ethanol for 20 min and twice in xylene for 15 min. The sections were then submerged in paraffin at 70°C for two hours. Paraffin blocks were cut into 4 μm sections and deparaffinized for immunofluorescence and fluorescence in situ hybridization staining as previously described (Earle et al., 2015; Johansson and Hansson, 2012), and detailed below.
For immunofluorescence, sections were dewaxed by an initial incubation at 60°C and two additional incubations in xylene, for 10 min each. The samples were then hydrated in solutions with decreasing concentration of ethanol (100, 95, 70, 50, and 30%) for 5 min each. Sections were washed in PBS and marked with a PAP (liquid blocker) pen. Block solution (5% fetal bovine serum in PBS) was added and incubated in darkness in a humid chamber for 30 min at room temperature. The specific antibody for MUC2, the primary intestinal mucin, (Santa Cruz Biotechnology, diluted 1:100 in block solution) was added to the slide and incubated in darkness for 4–24 hrs at 4°C. The slides were washed three times in PBS. The secondary antibody was diluted in block solution 1:100, combined with DAPI (Sigma, 1:500 dilution) and UEA-1 (Rhodamine Labeled Ulex Europaeus Agglutinin I from Vector labs, 1:50 dilution), and added to the sample. After incubation in the dark in a humid environment at room temperature for 2 hrs, the slides were washed three times in PBS for 10 min each. The slides were allowed to dry completely and mounted the sections using Prolong antifade mounting media, and set at room temperature. The slides were thereafter stored at 4°C.
For FISH staining, slides were dewaxed in xylene as described above, and then incubated with 99.5% ethanol for 5 min, and then allowed to air dry. 50 μL of hybridization solution (20 mM Tris–HCl, pH 7.4, 0.9 M NaCl, 0.1% (w/v) SDS, with 10% (v/v) formamide stored at 100%, pre-warmed to 50°C) were added to the FISH probes of interest (final 0.5 μg/probe) and spotted onto each section. Probes specific to Bacteroides (CCAATGTGGGGGACCTT (Manz et al., 1996)), Lachnospiraceae (TCTTCCCTGCTGATAGA (Kong et al., 2010)), and Enterococcus (TCACGCGGCGTTGCTC (Küsel et al., 1999)) were used. The liquid was overlaid with a soft coverslip (Hybrislip, Grace Labs), placed in a humid chamber and incubated at 50°C for 3 hrs. The slides were then incubated in FISH washing buffer (20 mM Tris–HCl, pH 7.4, 0.9 M NaCl) at 50°C for 10–20 min. The slides were washed in PBS for 10 min. 1 μl of DAPI was dissolved in 100 μl PBS with added 1:50 UEA-1, and incubated at 4°C for 45 min. The slides were then washed in PBS three times. The slides were air dried and mounted using Vectashield Antifade.
Images were collected using a Zeiss LSM 700 or 880 confocal microscope with the ZEN 2012 software. Mucus thickness was quantified using the analysis platform BacSpace (Earle et al., 2015).
Cecal contents were collected and were either immediately used, or frozen in liquid nitrogen and stored for later analysis. Blood was collected via cardiac puncture and was immediately used for analysis.
DNA Extraction from Fecal Pellets, 16S rRNA Sequencing, and 16S analysis
Fecal DNA was extracted using a MoBio PowerSoil HT DNA Isolation Kit. Amplicons of the V4 region were generated using the primers 806rB (GGACTACNVGGGTWTCTAAT) and 515fBC (GTGYCAGCMGCCGCGGTAA) or 806R (GGACTACHVGGGTWTCTAAT) and 515F (GTGCCAGCMGCCGCGGTAA), and barcoded by sample. Purified PCR products were pooled and sequenced on a MiSeq Illumina platform at the Mayo Clinic in Rochester, MN. Operational taxonomic units (OTUs) were picked on the Greengenes v. 13.8 database with a 97% similarity threshold using UCLUST (Edgar, 2010). Alpha- and beta-diversity measures were calculated using unweighted UniFrac18 on OTU tables rarified to 20,000 sequences (or 8,000 in the sanitation experiments). Principal coordinates were computed using QIIME v. 1.8 (Caporaso et al., 2011).
PERMANOVA was performed using the QIIME v.1.8 compare_categories.py script on all sample abundances labeled by gender and cage. Covariance analysis was performed on abundances across all measurements (samples and controls) in the humanized experiment using MATLAB, and normalized by the number of observations. Correlation coefficients c were calculated comparing abundances at the family level. Only observations that showed statistically significant anti-correlated dynamics were further analyzed (c<0 and p<0.05, testing against the null hypothesis that there is no relationship between the observed abundances). To analyze the dependence of covariance on taxonomic distance, each pair of taxonomic assignments was compared and classified based on the presence of a common node (kingdom, phylum, class, order, family), and ANOVA statistics were applied to determine whether more related pairs had more negative correlation coefficients.
Isolation of Bacteria from Fecal Pellets
Fecal pellets from humanized mice were resuspended in PBS and plated on Gifu anaerobic broth agar (GAM with 15% agar, VWR) and blood agar (Brain Heart Infusion Blood Agar (BHI-BA, Becton Dickinson) with 10% (v/v) defibrinated horse blood (Lampire Biological Laboratories)). Single colonies were grown in GAM medium, supplemented with glycerol to 25% and frozen. DNA was extracted from a pure culture of the Lachnospiraceae isolate using the Puregene kit (Qiagen) Gram-positive protocol.
Host Nuclei Morphology Measurements
A custom watershed algorithm was developed in MATLAB to segment nuclei from the DAPI channel of the epithelium region identified by the BacSpace program (Earle et al., 2015). Segmented nuclei were fitted to ellipses and the degree of flattening was calculated as the difference between the semi-major axis and semi-minor axis normalized by the semi-major axis. At least 100 nuclei were quantified per time point.
Quantification of Spatial Organization in Three-member Community
Quantification of distance between different species was performed as previously described (Earle et al., 2015). Briefly, thresholded images in each channel were used to compute the distance map to the nearest other species in MATLAB. Distances were computed between the two species with dedicated fluorescence channels, specifically, Lachnospiraceae and B. thetaiotaomicron. E. hirae was labeled in the same channel as the mucus and was therefore not used in the quantification of spatial organization.
Osmolality Measurements
Cecal contents were collected after sacrificing the mice and immediately centrifuged at 16,000g for 20 min at 4°C. The osmolality of the cecal supernatant or medium of interest was measured using an Advanced Instruments Model 3320 Osmometer provided by the Biomaterials and Advanced Drug Delivery Laboratory at the Stanford University School of Medicine. Blood collected by cardiac puncture was left at room temperature for 30 min and then spun down at 250g for 15 min. The plasma was collected and subjected to osmolality measurement. Eight mice were used for the PEG measurements and twenty for the control measurements.
Quantification of Microbial Abundances
Fecal, cecal, and intestinal bacterial colony forming units (CPUs) were quantified by duplicate sampling with 1-μL loops and subsequent dilution and spot plating on BHI-BA. For intestinal contents, 1 μL was either sampled after washing the intestinal section with PBS or after removing the contents directly. To determine densities, the samples were weighed to estimate total volume. Stool density was assumed to be that of water, after empirically testing the weight and volume relation of several stool samples with various consistencies. Plates were incubated overnight at 37°C in an anaerobic chamber or aerobically, as appropriate.
Quantification of Compositional Dynamics
Abundances were averaged across time points as shown in Figure S1B: pre-PEG (day 0, controls), during PEG (days 3 and 6), and post-PEG (1 and 2 weeks after the cessation of treatment). When comparing humanized and conventional microbiota, the dynamics were assessed as “different” if there were no common behaviors (e.g., increasing in one cohort vs. decreasing or not significant in the other) in the transitions from pre-PEG to during, and during to post-PEG. The behavior was assessed as “one-match” if either the pre-PEG to during or during to post-PEG transition showed the same increasing, decreasing, or unchanged pattern, while “two-match” indicated the same pattern for both transitions. p-values were calculated by scrambling the taxonomic assignments of one community and repeating the analysis for 100,000 iterations to determine the expected comparison in a random assignment. Extinction was defined as dropping below the levels of detection (0 counts) and never reappearing. Data were compiled and plotted using MATLAB.
Transcriptomic Analyses
RNA was extracted from cecal contents stabilized with RNAprotect (QIAGEN) using TRIzol (ThermoFisher) and the manufacturer’s protocol. Briefly, ~200 μL cecal contents were precipitated by centrifugation and the supernatant was subjected to bead-beating with 1 mL TRIzol and glass beads. 200 μL chloroform were added to the tube, vortexed, and after centrifuging the aqueous phase was removed. Nucleic acids were precipitated on ice using 3M sodium acetate and 100% ethanol, and RNA was purified using an RNeasy Mini kit (Qiagen).
RNA was extracted from in vitro cultures using an RNeasy Mini kit (Qiagen) with the manufacturer’s Mechanical Disruption of Bacteria and Purification of Total RNA from Bacterial Lysate protocols. Ribosomal RNA was removed using a Ribo0 Epidemiology kit (Illumina). A sequencing library was prepared using a standard HT Illumina Stranded mRNA kit (Illumina). Libraries were pooled according to the manufacturer’s protocol and submitted for paired-end sequencing on an Illumina HiSeq platform at Beijing Genomics Institute (BGI Americas).
Glycoside Hydrolase Analyses
Glycoside hydrolase (GH) imputations were performed as previously described (Yin et al., 2012), using 345 CAZyme HMMs based on the 03/17/2015 CAZyDB database. Expression levels were normalized using standard DEseq2 normalization (Anders and Huber, 2010). Mucin hydrolases were characterized as ones that contained the following GH types: GH33, CBM40, GH29-B, GH29A, CBM32, GH29, CBM32, FIVAR, GHnc, GH95, CBM51, GH101, GH129, GH20, GH2, GH42, GH84, GH89, UNK, and Fn3 (Sonnenburg et al., 2016).
Metagenomic Analyses from Cecal Contents
DNA was extracted from cecal contents using a phenol chloroform-based extraction with bead-beating as previously described (Ley et al., 2005). Cecal contents were collected from three control mice, three mice at the peak of diarrhea (day 6), and two mice at the end of the recovery period (day 20). Briefly, 200 mg of materials were weighed and added to a screw-cap tube with 300–500μl equivalent of beads. 500 μl of Buffer A, then 210 μl of 20% SDS were added. 500 μl of Phenol:Chloroform:isoamyl alcohol (PCI, 25:24:1) were added and the tubes were sealed and beat on high for 2 minutes using a tube bead beater. The tubes were then spun at 13,300g at 4°C for 3 min. The aqueous phase was removed and added to a clean tube. 500 μl of the PCI solution was added and mixed by inversion. The samples were spun at 13,300g at 4°C for 3 min. The aqueous phase was removed and added to a clean tube. 500 μl of PCI were added and the samples were spun at 13,300g at 4°C for 3 min until the interface was free of proteins. 1/10 volume of 3 M sodium acetate and 1 volume of isopropanol were added and mixed by inversion. The samples were placed on dry ice for 20 min to allow for precipitation. The tubes were then spun at 16,000g for 20 min, and decanted. 1 ml of room-temperature ethanol was added and decanted, then air dried. The pellet was suspended in 200 μl of TE buffer (10 mM Tris, 1 mM EDTA pH 8). The extracted DNA was cleaned up with a Blood and Tissue Qiagen Kit.
DNA was prepared for sequencing using the TruSeq Nano DNA library prep (Illumina). DNA was sheared to achieve an average insert size of 550 bp. Libraries were pooled according to Illumina’s manufacturer protocol and sequenced using an Illumina HiSeq platform at the Mayo Clinic in Rochester, MN.
Functional and Phage Analyses of Metagenomics Data
Raw reads were uploaded to the MG-RAST metagenomics analysis server and analyzed using the SEED subsystems functional annotation database and RefSeq taxonomic annotation with default cutoffs (Meyer et al., 2008). The read numbers for each category were compiled and plotted using MATLAB.
Humanized-Mouse Metagenomics Data Analyses
Raw reads were assessed for nucleotide quality and adapter contamination with FastQC v. 0.11.4. Contaminating sequencing adapters, terminal bases below PHRED quality score 30, and trimmed reads shorter than 80 bp were removed with Cutadapt v. 1.9.1 (Martin, 2011). Reads identified as originating from the host were removed by alignment to the GRCm38.p3 mouse genome with BWA v. 0.7.10 (Li and Durbin, 2010). Remaining reads were mapped to the UniRef50 functionally annotated gene family database (accessed 10/20/16) (Suzek et al., 2015) at the protein level using the Diamond v. 0.8.18 aligner (Buchfink et al., 2014). Gene counts so obtained were imported into R v. 3.2.1 (Ihaka and Gentleman, 1996). Genes with at most one read at all time points were excluded from analysis. Pairwise similarities between time points were calculated using the vegan v. 2.4-1 library (Dixon, 2003) and the Chao similarity index (Chao et al., 2005), and plotted with the ggplot2 v. 2.1.0 library (WickhamHadley). Differential gene abundances were calculated and visualized with DEseq2 (Anders and Huber, 2010).
Humanized-Mouse Metagenomics Phage Analysis
Metagenomic reads were filtered using bowtie2 v. 2.3.09 (Ben Langmead and Salzberg, 2012) against an index containing the mouse reference genome (GRCm38_p4) and phiX. Filtered reads were processed using Trimmomatic v. 0.36 to remove adapters (TruSeq3-PE-2.fa:2:30:12:1:true (Bolger et al., 2014)) and quality trimmed (Leading:3 Trailing:3 MaxInfo:30:0.2 MinLen:25). All filtered, trimmed reads were error-corrected using BayesHammer contained within metaSPAdes v. 3.10.1 (Nikolenko et al., 2013; Nurk et al., 2017). Filtered, trimmed, error-corrected reads for all time points were assembled together in a single assembly using metaSPAdes with default parameters (assembly only, K = 21, 33, 55). VirSorter v. 1.0.3 (Roux et al., 2015) was used to predict which contigs longer than 5000 bp were bacteriophages by querying against the database containing phage clusters from both RefSeq and curated viromes. Collections of phage contigs were visualized using Anvi’o v. 3 (Eren et al., 2015). Contigs were hierarchically clustered (Euclidean distance, Ward linkage) based on their detection in each sample, where detection is defined as the percentage of each contig covered at least 1x by mapped reads for a given sample.
Defined-Consortium Mouse Metagenomics and Metatranscriptomics Data Analyses
A reference gene set was created from the combined gene annotations of the three organisms in the three-member defined community. For B. thetaiotaomicron and E. hirae, CDS annotations of genomic references sequences were obtained from NCBI RefSeq (genomic accessions NC_004663.1 and NC_018081.1, respectively, accessed 5/25/2016). For the Lachnospiraceae isolate, de novo annotation of the assembled reference genome was performed using Prokka v. 1.10 (Seemann, 2014).
For DNA and RNA sequencing, raw reads were assessed for nucleotide quality and adapter contamination with FastQC v. 0.11.4. Duplicated DNA sequences were removed with Super-deduper v. 2.0 (Petersen et al., 2015). For DNA reads, contaminating sequencing adapters, terminal bases below PHRED quality score 30, and trimmed reads shorter than 80 bp were removed with Cutadapt v. 1.9.1 (Martin, 2011). DNA and RNA reads were aligned to the defined gene set with BWA v. 0.7.10 (Li and Durbin, 2010). Gene counts so obtained were imported into R v. 3.2.1 (Ihaka and Gentleman, 1996). For DNA sequencing, genes with at most 1 read at all time points were excluded from further analysis. Differential gene abundances were calculated and visualized with DEseq2 (Anders and Huber, 2010). Transcriptional data in the heatmaps were normalized with the standard DEseq2 normalization (Anders and Huber, 2010).
Total Proteome Sample Preparation, TMT Labelling, and High-pHRP Fractionation for Proteome Analyses
Mouse cecal contents were processed for proteome analysis as previously described (Lichtman et al., 2015). Briefly, 20–40 mg of cecal contents were recovered from 18 mice and solubilized in 8 M urea. Insoluble material and intact microbes were serially removed through slow (2,000 rpm, Eppendorf 5415 R) and fast (35,000 rpm, Optima MAX Ultracentrifuge) centrifugation steps. The resulting supernatant was reduced and alkylated with iodoacetimide, and proteins were precipitated with trichloroacetic acid (TCA). Proteins were solubilized in 100 mM Tris (pH 8.0). SDS gel sample loading buffer (50 mM Tris HCI pH 6.8, 2% SDS, 10% glycerol, 0.1% chromophenol blue) was added to the sample and denatured at 90°C, and briefly separated by SDS-PAGE (gel migration distance 0.5 cm). Proteins were digested in-gel with trypsin as previously described (Elias et al., 2005), and desalted by C18 solid-phase extraction (Sep-Pak Waters, Milford, MA). Peptides were labeled using TMT 10-plex labeling reagents (Pierce) according to the manufacturer’s instructions and as previously described (Zhang and Elias, 2017). Due to the number of samples, two sets of nine samples were run, with the tenth TMT channel containing a control that combined all of the nine channels in the TMT run.
Mass Spectrometry Analyses of the GRANTA Proteomes
TMT-labeled peptides were re-suspended in 20 μl 5% formic acid, and 2 μl of each peptide sample were combined, 10% of which was injected for LC-MS analysis with an LTQ Orbitrap Elite. Peptides were eluted from a C18 reverse-phase column. MS run time was 120 min with a flow rate of 400 nL/min. The linear gradient eluted 8–40% buffer B (0.2% (v/v) formic acid, 5% DMSO, and 94.8% (v/v) acetonitrile) for 90 min. Then, over 7 min the gradient eluted 40–60% buffer B. Over the next 6 min, the gradient eluted 60–98% buffer B. In the remainder of the time the linear gradient returned from 98% to 2% buffer B. TMT reporter ions were measured in MS4 spectra collected with the Multi-Notch method as previously described (McAlister et al., 2014).
Computational Interpretation of the Cecal Proteome
Raw TMT data were analyzed using ProteomeDiscoverer v. 2.1.0.81 (ThermoFisher Scientific, San Jose, CA). SEQUEST search used the Mus musculus protein database with a fully tryptic search. The maximum number of allowed missed cleavages was 2, the minimum allowed peptide length was 7, and the maximum allowed peptide length was 144. Precursor mass tolerance was 10 ppm. Fragment mass tolerance was 0.6 Da. Static modifications included the N terminus for the TMT 10-plex modification and carbamidomethylation. Dynamic modifications included oxidation, phosphorylation, and acetylation. Percolator peptide filtering was at a target FDR of 1%. Protein counts were normalized using the total peptide amount and scaled using the two control channels from the two TMT 10-plex runs. Normalized, scaled data was then analyzed in Qlucore (Qlucore, AB, Lund, Sweden). A two-group comparison between diarrhea versus other produced a p-value of 0.097 and variance filter of 0.25. The heatmap in Figure 4A shows proteins that were present after filtering at these values of p and variance. In Figure 4A, N/A protein refers to an immunoglobulin. In Figure 4B proteins were clustered using a weighted square error function as employed by MFuzz (Kumar and E Futschik, 2007).
Immunoassays
Three-member community species and Bt capsule mutants (Porter et al., 2017) were individually grown overnight in their preferred medium, after a 1:10,000 dilution of an overnight culture started from a single colony. Protein levels were quantified for each culture and normalized to 1 mg/ml using the Bio-Rad DC Protein Assay kit according to the manufacturer’s protocol. Whole bacterial cell immunoassays were performed with minor modifications to a previously published protocol (Elder et al., 1982). Briefly, cells were washed twice with PBS (pH 7.4) and re-suspended in 50 mM sodium carbonate (pH 9.6). Cells were then seeded in a Corning 96-well polystyrene high protein binding plate and incubated overnight at 4°C, at a final protein concentration of 0.25 mg/mL for capsule mutants and 0.1 mg/ml for three-member community immunoassays. Wells were decanted and washed three times with 300 μL/well of PBST (1X phosphate buffered saline (pH 7.4) with 0.1% (v/v) Tween-20). Appropriately diluted serum (1:200 in PBST) or cecal contents (100 mg:900 μl fecal extraction buffer with cOmplete EDTA-free protease inhibitor cocktail from Roche, vortexed and centrifuged) was added to the wells (100 μL volume) and incubated at room temperature for 2 h. The wells were then washed three times with 300 μL/well of PBST, and then HRP-conjugated goat anti-mouse IgG (Abcam, Cat. # ab6789) or anti-mouse IgA (Abcam, Cat. # ab97235) was added, diluted at 1:10,000 (IgA) or 1:50,000 (IgG) in PBST at a final volume of 100 μL/well. Wells were incubated at room temperature for 3 hrs and then washed three times with 300 μL/well of PBST. Color was developed using the 1-step ABTS kit (ThermoFisher) according to the manufacturer’s protocol.
QUANTIFICATION AND STATISTICAL ANALYSIS
ANOVA statistics (balanced one-way) were used for comparisons in any measurement that included more than two groups; otherwise, a paired-sample t-test was applied. Significant changes were defined as p<0.05. p-values were represented in plots as follows: p>0.05, ‘n.s.’ (not significant, may not be indicated), p≤0.05, ‘*’, p≤0.01, ‘**’, p≤0.001, ‘***’, p≤0.0001, ‘****’.
Data were plotted using custom MATLAB software. In figures with boxplots, the central mark represents the median and the edges indicate the 25th and 75th percentiles. Whiskers extend to the most extreme points excluding outliers, which are plotted using the ‘+’ symbol.
In data from the humanized experiment for which the standard error is plotted, 9<n<18 for each time point except day 13 and 20, for which n=4 and 2, respectively. In the conventional mouse experiments, n=3 for each time point for which the standard error is plotted.
DATA AND SOFTWARE AVAILABILITY
Proteomics data are available via ProteomeXchange with identifier PXD009364. Metagenomics, transcriptomics and 16S sequencing data are available at the Stanford Digital Repository: https://purl.stanford.edu/kw691rt5031.
Supplementary Material
(A) Scatter plot from Principal Coordinate Analysis shows that the initial microbiota composition is not restored 2-weeks post-PEG treatment and diarrhea. (Right) Variation due to co-housing and gender does not contribute significant variation.
(B) Depiction of classification and calculations of dynamical data used to achieve map in Figure 1E. To quantify the large amounts of dynamical data across the phylogenetic tree, we classified bacterial abundance into three categories: PRE, not exposed to diarrhea (day 0 and controls); DURING, during the peak of diarrhea (days 3–6); and POST, at the end of the recovery (days 13 and 20). The time points in these classifications were averaged to create the bar plots to the right of the arrow. The taxon enrichment DURING vs. PRE-PEG (Figure 1E left) was calculated as log2 of the ratio of the DURING and PRE bars for each taxon, at each level (phylum to genus, vertical axis). Similarly, the taxon enrichment POST vs. PRE (Figure 1E right) was calculated as log2 of the ratio of the POST and PRE bars. We then calculated the abundance enrichment relative to pre-diarrhea for all significantly changed taxa (p<0.05), and plotted this contribution as a 2-dimensional phylogenetic heatmap.
(C) The abundance of certain microbial classes exhibited significant changes during PEG treatment and then quickly returned to pre-PEG levels once PEG was removed. Points represent the mean fractional abundance, and the bars represent the standard error of the mean (s.e.m.).
A) Abundance covariance matrix.
B) Abundance correlation coefficient matrix.
C) Abundance correlation coefficient matrix p-value.
Node area and branch thickness are linearly related to the abundance in control mice that did not undergo PEG treatment. Boxes highlight taxa that were discussed further in the main text.
(A) In a conventional mouse microbiota, the highly abundant S24–7 family underwent extinction during PEG treatment and was replaced by the Bacteroidaceae family, while Gammaproteobacteria increased in abundance during PEG treatment. Points represent the mean fractional abundance, and the bars represent s.e.m.
(B) Comparison of taxa dynamics between humanized and conventional microbiota. Abundance changes were compared between PRE vs. DURING and DURING vs. POST diarrhea and labeled as statistically different (p<0.05, increased or decreased) or unchanged (p>0.05). Taxa classified as different shared no commonality in dynamical comparisons between humanized and conventional mice; “One match” indicates that either PRE vs. DURING or DURING vs. POST behaved similarly; “Two-match” indicates both dynamical comparisons were similar between the microbiota.
(C) Total number of culturable bacteria did not decrease during diarrhea, independent of collection method. Bars represent the mean total colony forming units, and the error bars represent the standard deviation (s.d.).
(A) Fluorescently-labeled distal colon (stained as in Figure 3A) throughout the experiment. During and just after diarrhea, bacteria were found in direct contact with the epithelial layer (days 6 and 7, red arrows).
(B) Mucus layer was significantly thinner during PEG treatment.
(C) H&E staining revealed no significant inflammation or infiltrates in the mouse colonic epithelium.
(D) Stress response level 2 SEED category showed significantly increased “Osmotic” and “Dessication stress” genes, while other stress genes were overall decreased in representation. The bars represent the mean and the error bars represent s.d.
(E) Microbial abundance dynamics of three members of a gnotobiotic community. The points represent the mean fractional abundance, and the error bars represent s.e.m.
(F) Log2 heatmap of the most differentially abundant transcripts during the PEG time course in the three-member community experiment as measured by RNA-seq.
(G) Fluorescently labeled distal colon in a three-member community, stained as in Figure 3 but with Fluorescence In Situ Hybridization probes specific to Bacteroides (white), Lachnospiraceae (red), and Enterococcus (green). The plots (bottom panels) show the distribution of intercell distances (the mean across three separate colon sections is shown with a solid line, and the shaded area shows s.d., Methods) in mice colonized with the three bacterial members in (E). The spatial organization of the community changed during PEG treatment; specifically, the distance from each Bt cell to the nearest La increased, indicating that Bt was less well mixed with the community during PEG treatment compared to the control.
(A) Longitudinal protein clustering from proteomics analysis shows distinct dynamical patterns. Proteins were clustered using a weighted square error function in MFuzz (Methods). Cluster 1 shows upregulated immunoglobulin protein clusters on day 9.
(B) Serum IgG ELISA against whole cells expressing no capsule locus continued to increase after PEG treatment.
(C) Cecal IgA ELISA against whole cells expressing CPS4, CPS5, or no capsular polysaccharide loci continued to increase after PEG treatment.
(D) Serum cytokine levels were affected during PEG treatment but re-equilibrated before the end of PEG treatment.
(E) Proteins in the annexin and cadherin families showed relative stability (fecal log abundance) throughout the time course. Error bars represent s.e.m.
(F) MUC2 protein levels did not change significantly throughout the time course. Error bars represent s.e.m.
(A) Effects of osmotic perturbation vary depending on osmolyte and osmolality (Methods). Background-subtracted (from negative controls) average growth curves and s.d. for M. intestinale, E. hirae, B. thetaiotaomicron and a Lachnospiraceae isolate. All tested taxa were negatively affected by increased osmolality via addition of PEG, sodium chloride (NaCl), or sorbitol.
(B) In vivo abundance dynamics (mean and s.e.m.) for S24–7 OTU 185550, which has 98% sequence V4 region rRNA similarity to M. intestinale, for control untreated mice (left) and treated humanized mice (right).
(A) Bristol stool score during PEG treatment increases with PEG dosage.
(B) Change in mouse weight during PEG treatment increases with PEG dosage.
(C) Scatter plot of Principal Coordinate Analysis shows that the initial microbiota composition for 15% PEG-treated mice was restored within two weeks post-PEG treatment if cage changes were limited (Figure 6A).
(D) Bacteroidaceae abundance fluctuated in response to PEG and control stool introduction. Points represent the mean fractional abundance, and the error bars represent s.e.m.
(E) Alpha diversity (PD whole tree) decreased during PEG treatments, and then remained stable at pre-treatment levels following addition of control stools.
(F) Viruses identified in metagenomics data from our humanized mouse experiment using RefSeq on MG-RAST (Methods) exhibited distinct dynamics during and following PEG treatment. Points represent the mean fractional abundance, and the error bars represent s.d.
(G) Phages identified in metagenomics data from our humanized mouse experiment using VirSorter (Methods) show distinct dynamics during and following PEG treatment. ‘Reads mapped’ represents the number of reads from each individual sample that were successfully mapped onto the co-assembly of all samples. ‘Length’ indicates the length of the phage contigs (Methods).
Table lists the proteins associated with each cluster shown in Figures 4B and S5A.
A) Taxa monotonically increasing in different concentrations of PEG (5,10,15%). Pre PEG: day 0, PEG: days 3,5,6; Level 2: phylum; Level 3: class; Level 4: order; Level 5: family; Level 6: genus.
B) Taxa monotonically decreasing in different concentrations of PEG (5,10,15%). Pre PEG: day 0, PEG: days 3,5,6; Level 2: phylum; Level 3: class; Level 4: order; Level 5: family; Level 6: genus.
Highlights.
Mild osmotic diarrhea leads to long-term changes in gut microbiota membership
Prevalent S24-7 family undergoes extinction unless re-introduced
The mucus barrier is transiently disrupted during osmotic diarrhea
Mild osmotic diarrhea induces host innate and adaptive immune responses
Acknowledgments
The authors would like to thank Daniel Fisher, Thad Hughes, Dylan Dodd, Will Van Treuren and Gabe Billings for useful discussions, and Gabriela Fragiadakis and Shuo Han for critical readings of the manuscript. The authors acknowledge support from a James S. McDonnell Postdoctoral Fellowship (to C.T.), the Allen Discovery Center at Stanford on Systems Modeling of Infection (to K.M.N. and K.C.H.), the Stanford Center for Systems Biology under NIH grant P50-GM107615 (to K.C.H.), National Institutes of Health NIDDK R01-DK085025 (to J.L.S.), a Discovery Innovation Fund Award (to J.E.E.), Stanford ChEM-H seed funding (to J.E.E.), NSF Graduate Research Fellowships (to E.L.M. and C.G.G.), and NCI K08 CA184420 (to A.S.B.). K.C.H. and J.L.S. are Chan Zuckerberg Biohub Investigators.
Footnotes
Declaration of Interests
The authors declare no competing interests.
Author Contributions
C.T and J.L.S. designed research; C.T., E.L.M., K.N., E.P.C, C.G., and B.F. performed research; C.T., J.E.E., A.S.B, K.C.H., and J.L.S. contributed new reagents/analytic tools; C.T., B.D.M., and E.L.M. analyzed data; S.H. provided gnotobiotic technical support; D.M.B. provided histology scoring; C.T., K.C.H., and J.L.S wrote the paper; all authors reviewed the paper before submission.
Publisher's Disclaimer: This is a PDF file of an unedited manuscript that has been accepted for publication. As a service to our customers we are providing this early version of the manuscript. The manuscript will undergo copyediting, typesetting, and review of the resulting proof before it is published in its final citable form. Please note that during the production process errors may be discovered which could affect the content, and all legal disclaimers that apply to the journal pertain.
References
- Anders S, Huber W. Differential expression analysis for sequence count data. Genome Biol. 2010;11:R106. doi: 10.1186/gb-2010-11-10-r106. [DOI] [PMC free article] [PubMed] [Google Scholar]
- Ben Langmead, Salzberg SL. Fast gapped-read alignment with Bowtie 2. Nat Chem Biol. 2012;9:357–359. doi: 10.1038/nmeth.1923. [DOI] [PMC free article] [PubMed] [Google Scholar]
- Blaser MJ, Dominguez-Bello MG. The Human Microbiome before Birth. Cell Host and Microbe. 2016;20:558–560. doi: 10.1016/j.chom.2016.10.014. [DOI] [PubMed] [Google Scholar]
- Bolger AM, Lohse M, Usadel B. Trimmomatic: a flexible trimmer for Illumina sequence data. Bioinformatics. 2014;30:2114–2120. doi: 10.1093/bioinformatics/btu170. [DOI] [PMC free article] [PubMed] [Google Scholar]
- Buchfink B, Xie C, Huson DH. Fast and sensitive protein alignment using DIAMOND. Nat Meth. 2014;12:59–60. doi: 10.1038/nmeth.3176. [DOI] [PubMed] [Google Scholar]
- Burg MB, Ferraris JD. Intracellular organic osmolytes: function and regulation. J Biol Chem. 2008;283:7309–7313. doi: 10.1074/jbc.R700042200. [DOI] [PMC free article] [PubMed] [Google Scholar]
- Caporaso JG, Lauber CL, Walters WA, Berg-Lyons D, Lozupone CA, Turnbaugh PJ, Fierer N, Knight R. Global patterns of 16S rRNA diversity at a depth of millions of sequences per sample. Proceedings of the National Academy of Sciences. 2011;108(Suppl 1):4516–4522. doi: 10.1073/pnas.1000080107. [DOI] [PMC free article] [PubMed] [Google Scholar]
- Cash HL, Whitham CV, Hooper LV. Refolding, purification, and characterization of human and murine RegIII proteins expressed in Escherichia coli. Protein Expr Purif. 2006;48:151–159. doi: 10.1016/j.pep.2006.01.014. [DOI] [PMC free article] [PubMed] [Google Scholar]
- Chao A, Chazdon RL, Colwell RK, Shen TJ. A new statistical approach for assessing similarity of species composition with incidence and abundance data. Ecology Letters. 2005;8:148–159. [Google Scholar]
- Chassaing B, Koren O, Goodrich JK, Poole AC, Srinivasan S, Ley RE, Gewirtz AT. Dietary emulsifiers impact the mouse gut microbiota promoting colitis and metabolic syndrome. Nature. 2015;519:92–96. doi: 10.1038/nature14232. [DOI] [PMC free article] [PubMed] [Google Scholar]
- Christian J. The influence of nutrition on the water relations of Salmonella oranienburg. Australian Journal of Biological Sciences. 1955;8:75–82. [Google Scholar]
- Christian J, Scott WJ. Water relations of salmonellae at 30 C. Australian Journal of Biological Sciences. 1953;6:565–573. [PubMed] [Google Scholar]
- Cunha BA. Fever of Unknown Origin: Focused Diagnostic Approach Based on Clinical Clues from the History, Physical Examination, and Laboratory Tests. Infectious Disease Clinics of North America. 2007;21:1137–1187. doi: 10.1016/j.idc.2007.09.004. [DOI] [PubMed] [Google Scholar]
- Desai MS, Seekatz AM, Koropatkin NM, Kamada N, Hickey CA, Wolter M, Pudlo NA, Kitamoto S, Terrapon N, Muller A, et al. A Dietary Fiber-Deprived Gut Microbiota Degrades the Colonic Mucus Barrier and Enhances Pathogen Susceptibility. Cell. 2016;167:1339–1353. e21. doi: 10.1016/j.cell.2016.10.043. [DOI] [PMC free article] [PubMed] [Google Scholar]
- Dixon P. VEGAN, a package of R functions for community ecology. J Veg Sci. 2003;14:927. [Google Scholar]
- Donaldson GP, Lee SM, Mazmanian SK. Gut biogeography of the bacterial microbiota. Nat Rev Microbiol. 2016;14:20–32. doi: 10.1038/nrmicro3552. [DOI] [PMC free article] [PubMed] [Google Scholar]
- Earle KA, Billings G, Sigal M, Lichtman JS, Hansson GC, Elias JE, Amieva MR, Huang KC, Sonnenburg JL. Quantitative Imaging of Gut Microbiota Spatial Organization. Cell Host and Microbe. 2015;18:478–488. doi: 10.1016/j.chom.2015.09.002. [DOI] [PMC free article] [PubMed] [Google Scholar]
- Edgar RC. Search and clustering orders of magnitude faster than BLAST. Bioinformatics. 2010;26:2460–2461. doi: 10.1093/bioinformatics/btq461. [DOI] [PubMed] [Google Scholar]
- Elder BL, Boraker DK, Fives-Taylor PM. Whole-bacterial cell enzyme-linked immunosorbent assay for Streptococcus sanguis fimbrial antigens. J Clin Microbiol. 1982;16:141–144. doi: 10.1128/jcm.16.1.141-144.1982. [DOI] [PMC free article] [PubMed] [Google Scholar]
- Eren AM, Esen ÖC, Quince C, Vineis JH, Morrison HG, Sogin ML, Delmont TO. Anvi’o: an advanced analysis and visualization platform for ‘omics data. PeerJ. 2015;3:e1319. doi: 10.7717/peerj.1319. [DOI] [PMC free article] [PubMed] [Google Scholar]
- Ferreyra JA, Wu KJ, Hryckowian AJ, Bouley DM, Weimer BC, Sonnenburg JL. Gut Microbiota-Produced Succinate Promotes C. difficile Infection after Antibiotic Treatment or Motility Disturbance. Cell Host and Microbe. 2014;16:770–777. doi: 10.1016/j.chom.2014.11.003. [DOI] [PMC free article] [PubMed] [Google Scholar]
- Fetissov SO. Role of the gut microbiota in host appetite control: bacterial growth to animal feeding behaviour. Nature Reviews Endocrinology. 2016 doi: 10.1038/nrendo.2016.150. [DOI] [PubMed] [Google Scholar]
- Fukuyama J, Rumker L, Sankaran K, Jeganathan P, Dethlefsen Les, Relman DA, Holmes SP. Multidomain analyses of a longitudinal human microbiome intestinal cleanout perturbation experiment. PLoS Comput Biol. 2017;13:e1005706. doi: 10.1371/journal.pcbi.1005706. [DOI] [PMC free article] [PubMed] [Google Scholar]
- Gilbert JA, Quinn RA, Debelius J, Xu ZZ, Morton J, Garg N, Jansson JK, Dorrestein PC, Knight R. Microbiome-wide association studies link dynamic microbial consortia to disease. Nature. 2016;535:94–103. doi: 10.1038/nature18850. [DOI] [PubMed] [Google Scholar]
- Gorkiewicz G, Thallinger GG, Trajanoski S, Lackner S, Stocker G, Hinterleitner T, Gülly C, Högenauer C. Alterations in the Colonic Microbiota in Response to Osmotic Diarrhea. PLoS ONE. 2013;8:e55817. doi: 10.1371/journal.pone.0055817. [DOI] [PMC free article] [PubMed] [Google Scholar]
- Haddad NM, Brudvig LA, Clobert J, Davies KF, Gonzalez A, Holt RD, Lovejoy TE, Sexton JO, Austin MP, Collins CD, et al. Habitat fragmentation and its lasting impact on Earth’s ecosystems. Science Advances. 2015;1:e1500052–e1500052. doi: 10.1126/sciadv.1500052. [DOI] [PMC free article] [PubMed] [Google Scholar]
- Hodges K, Gill R. Infectious diarrhea. Gut Microbes. 2014;1:4–21. doi: 10.4161/gmic.1.1.11036. [DOI] [PMC free article] [PubMed] [Google Scholar]
- Ihaka R, Gentleman R. R: A Language for Data Analysis and Graphics. Journal of Computational and Graphical Statistics. 1996;5:299. [Google Scholar]
- Jalanka J, Salonen A, Salojärvi J, Ritari J, Immonen O, Marciani L, Gowland P, Hoad C, Garsed K, Lam C, et al. Effects of bowel cleansing on the intestinal microbiota. Gut. 2014 doi: 10.1136/gutjnl-2014-307240. gutjnl–2014–307240. [DOI] [PubMed] [Google Scholar]
- Johansson MEV, Hansson GC. Mucins. Humana Press; 2012. Preservation of Mucus in Histological Sections, Immunostaining of Mucins in Fixed Tissue, and Localization of Bacteria with FISH; pp. 229–235. [DOI] [PubMed] [Google Scholar]
- Johansson MEV, Gustafsson JK, Holmén-Larsson J, Jabbar KS, Xia L, Xu H, Ghishan FK, Carvalho FA, Gewirtz AT, Sjövall H, et al. Bacteria penetrate the normally impenetrable inner colon mucus layer in both murine colitis models and patients with ulcerative colitis. Gut. 2013 doi: 10.1136/gutjnl-2012-303207. gutjnl–2012–303207. [DOI] [PMC free article] [PubMed] [Google Scholar]
- Kashyap PC, Marcobal A, Ursell LK, Larauche M, Duboc H, Earle KA, Sonnenburg ED, Ferreyra JA, Higginbottom SK, Million M, et al. Complex interactions among diet, gastrointestinal transit, and gut microbiota in humanized mice. Gastroenterology. 2013;144:967–977. doi: 10.1053/j.gastro.2013.01.047. [DOI] [PMC free article] [PubMed] [Google Scholar]
- Klaschik E, Nauck F, Ostgathe C. Constipation—modern laxative therapy. Support Care Cancer. 2003;11:679–685. doi: 10.1007/s00520-003-0525-x. [DOI] [PubMed] [Google Scholar]
- Kong Y, He M, McAlister T, Seviour R, Forster R. Quantitative Fluorescence In Situ Hybridization of Microbial Communities in the Rumens of Cattle Fed Different Diets. Appl Environ Microbiol. 2010;76:6933–6938. doi: 10.1128/AEM.00217-10. [DOI] [PMC free article] [PubMed] [Google Scholar]
- Kumar L, Futschik EM. Mfuzz: a software package for soft clustering of microarray data. Bioinformation. 2007;2:5–7. doi: 10.6026/97320630002005. [DOI] [PMC free article] [PubMed] [Google Scholar]
- Küsel K, Pinkart HC, Drake HL, Devereux R. Acetogenic and sulfate-reducing bacteria inhabiting the rhizoplane and deep cortex cells of the sea grass Halodule wrightii. Appl Environ Microbiol. 1999;65:5117–5123. doi: 10.1128/aem.65.11.5117-5123.1999. [DOI] [PMC free article] [PubMed] [Google Scholar]
- Ley RE, Bäckhed F, Turnbaugh P, Lozupone CA, Knight RD, Gordon JI. Obesity alters gut microbial ecology. Proc Natl Acad Sci USA. 2005;102:11070–11075. doi: 10.1073/pnas.0504978102. [DOI] [PMC free article] [PubMed] [Google Scholar]
- Li H, Durbin R. Fast and accurate long-read alignment with Burrows–Wheeler transform. Bioinformatics. 2010;26:589–595. doi: 10.1093/bioinformatics/btp698. [DOI] [PMC free article] [PubMed] [Google Scholar]
- Louis P, Hold GL, Flint HJ. The gut microbiota, bacterial metabolites and colorectal cancer. Nat Rev Microbiol. 2014;12:661–672. doi: 10.1038/nrmicro3344. [DOI] [PubMed] [Google Scholar]
- Lozupone CA, Stombaugh JI, Gordon JI, Jansson JK, Knight R. Diversity, stability and resilience of the human gut microbiota. Nature. 2012;489:220–230. doi: 10.1038/nature11550. [DOI] [PMC free article] [PubMed] [Google Scholar]
- Manz W, Amann R, Ludwig W, Vancanneyt M, Schleifer KH. Application of a suite of 16S rRNA-specific oligonucleotide probes designed to investigate bacteria of the phylum cytophaga-flavobacter-bacteroides in the natural environment. Microbiology. 1996;142:1097–1106. doi: 10.1099/13500872-142-5-1097. [DOI] [PubMed] [Google Scholar]
- Marcobal A, Kashyap PC, Nelson TA, Aronov PA, Donia MS, Spormann A, Fischbach MA, Sonnenburg JL. A metabolomic view of how the human gut microbiota impacts the host metabolome using humanized and gnotobiotic mice. Isme J. 2013;7:1933–1943. doi: 10.1038/ismej.2013.89. [DOI] [PMC free article] [PubMed] [Google Scholar]
- Martin M. Cutadapt removes adapter sequences from high-throughput sequencing reads. EMBnet.Journal. 2011;17:10–12. [Google Scholar]
- Meyer F, Paarmann D, D’Souza M, Olson R, Glass EM, Kubal M, Paczian T, Rodriguez A, Stevens R, Wilke A, et al. The metagenomics RAST server – a public resource for the automatic phylogenetic and functional analysis of metagenomes. BMC Bioinformatics. 2008;9(19):386. doi: 10.1186/1471-2105-9-386. [DOI] [PMC free article] [PubMed] [Google Scholar]
- Nikolenko SI, Korobeynikov AI, Alekseyev MA. BayesHammer: Bayesian clustering for error correction in single-cell sequencing. BMC Genomics. 2013;14:S7. doi: 10.1186/1471-2164-14-S1-S7. [DOI] [PMC free article] [PubMed] [Google Scholar]
- Nugent SG, Kumar D, Rampton DS, Evans DF. Intestinal luminal pH in inflammatory bowel disease: possible determinants and implications for therapy with aminosalicylates and other drugs. Gut. 2001;48:571–577. doi: 10.1136/gut.48.4.571. [DOI] [PMC free article] [PubMed] [Google Scholar]
- Nurk S, Meleshko D, Korobeynikov A, Pevzner PA. metaSPAdes: a new versatile metagenomic assembler. Genome Res. 2017;27 doi: 10.1101/gr.213959.116. gr.213959.116–gr.213959.834. [DOI] [PMC free article] [PubMed] [Google Scholar]
- Ormerod KL, Wood DLA, Lachner N, Gellatly SL, Daly JN, Parsons JD, Dal’Molin CGO, Palfreyman RW, Nielsen LK, Cooper MA, et al. Genomic characterization of the uncultured Bacteroidales family S24–7 Inhabiting the guts of homeothermic animals. Microbiome. 2016;4:36. doi: 10.1186/s40168-016-0181-2. [DOI] [PMC free article] [PubMed] [Google Scholar]
- Petersen KR, Streett DA, Gerritsen AT, Hunter SS, Settles ML. Super Deduper, Fast PCR Duplicate Detection in Fastq Files. New York, NY, USA: ACM; 2015. pp. 491–492. [Google Scholar]
- Porter NT, Canales P, Peterson DA, Martens EC. A Subset of Polysaccharide Capsules in the Human Symbiont Bacteroides thetaiotaomicron Promote Increased Competitive Fitness in the Mouse Gut. Cell Host and Microbe. 2017;22:494–506. e498. doi: 10.1016/j.chom.2017.08.020. [DOI] [PMC free article] [PubMed] [Google Scholar]
- Roager HM, Hansen LBS, Bahl MI, Frandsen HL, Carvalho V, Gøbel RJ, Dalgaard MD, Plichta DR, Sparholt MH, Vestergaard H, et al. Colonic transit time is related to bacterial metabolism and mucosal turnover in the gut. Nature Microbiology. 2016;1:16093. doi: 10.1038/nmicrobiol.2016.93. [DOI] [PubMed] [Google Scholar]
- Roerig JL, Steffen KJ, Mitchell JE, Zunker C. Laxative Abuse Epidemiology, Diagnosis and Management. Drugs. 2010;70:1487–1503. doi: 10.2165/11898640-000000000-00000. [DOI] [PubMed] [Google Scholar]
- Rojas E, Huang KC, Theriot JA. Membrane tension and depolarization inhibit cell wall synthesis to ensure cell envelope homeostasis in Gram-positive bacteria. Cell Syst. 2017 In Press. [Google Scholar]
- Rojas E, Theriot JA, Huang KC. Response of Escherichia coli growth rate to osmotic shock. Proc Natl Acad Sci USA. 2014;111:7807–7812. doi: 10.1073/pnas.1402591111. [DOI] [PMC free article] [PubMed] [Google Scholar]
- Roux S, Enault F, Hurwitz BL, Sullivan MB. VirSorter: mining viral signal from microbial genomic data. PeerJ. 2015;3:e985. doi: 10.7717/peerj.985. [DOI] [PMC free article] [PubMed] [Google Scholar]
- Schwab C, Berry D, Rauch I, Rennisch I, Ramesmayer J, Hainzl E, Heider S, Decker T, Kenner L, Müller M, et al. Longitudinal study of murine microbiota activity and interactions with the host during acute inflammation and recovery. Isme J. 2014;8:1101–1114. doi: 10.1038/ismej.2013.223. [DOI] [PMC free article] [PubMed] [Google Scholar]
- Scott WJ. Water relations of Staphylococcus aureus at 30 C. Australian Journal of Biological Sciences. 1953;6:549–564. [PubMed] [Google Scholar]
- Seemann T. Prokka - rapid prokaryotic genome annotation. Bioinformatics. 2014 doi: 10.1093/bioinformatics/btu153. [DOI] [PubMed] [Google Scholar]
- Shiau YF, Feldman GM, Resnick MA, Coff PM. Stool electrolyte and osmolality measurements in the evaluation of diarrheal disorders. Ann Intern Med. 1985;102:773–775. doi: 10.7326/0003-4819-102-6-773. [DOI] [PubMed] [Google Scholar]
- Sonnenburg ED, Smits SA, Tikhonov M, Higginbottom SK, Wingreen NSN, Sonnenburg JL. Diet-induced extinctions in the gut microbiota compound over generations. Nature. 2016;529:212–215. doi: 10.1038/nature16504. [DOI] [PMC free article] [PubMed] [Google Scholar]
- Statista. Sales of top digestive remedies in the U.S. in 2014 | Statistic. 2014. [Google Scholar]
- Suzek BE, Wang Y, Huang H, McGarvey PB, Wu CH. UniRef clusters: a comprehensive and scalable alternative for improving sequence similarity searches. Bioinformatics. 2015;31:926–932. doi: 10.1093/bioinformatics/btu739. [DOI] [PMC free article] [PubMed] [Google Scholar]
- Thompson LR, Sanders JG, McDonald D, Amir A, Ladau J, Locey KJ, Prill RJ, Tripathi A, Gibbons SM, Ackermann G, et al. A communal catalogue reveals Earth’s multiscale microbial diversity. Nature. 2017;2:nature24621. doi: 10.1038/nature24621. [DOI] [PMC free article] [PubMed] [Google Scholar]
- Tropini C, Earle KA, Huang KC, Sonnenburg JL. The Gut Microbiome: Connecting Spatial Organization to Function. Cell Host and Microbe. 2017;21:433–442. doi: 10.1016/j.chom.2017.03.010. [DOI] [PMC free article] [PubMed] [Google Scholar]
- Tropini C, Lee TK, Hsin J, Desmarais SM, Ursell T, Monds RD, Huang KC. Principles of bacterial cell-size determination revealed by cell-wall synthesis perturbations. Cell Rep. 2014;9:1520–1527. doi: 10.1016/j.celrep.2014.10.027. [DOI] [PMC free article] [PubMed] [Google Scholar]
- van Nood E, Vrieze A, Nieuwdorp M, Fuentes S, Zoetendal EG, de Vos WM, Visser CE, Kuijper EJ, Bartelsman JFWM, Tijssen JGP, et al. Duodenal Infusion of Donor Feces for Recurrent Clostridium difficile. N Engl J Med. 2013;368:407–415. doi: 10.1056/NEJMoa1205037. [DOI] [PubMed] [Google Scholar]
- Walker HK, Hall WD, Hurst JW, Woods TA. Diarrhea. Boston: Butterworths; 1990. [PubMed] [Google Scholar]
- Wickham Hadley. ggplot2 - Elegant Graphics for Data Analysis [Google Scholar]
- Yin Y, Mao X, Yang J, Chen X, Mao F, Xu Y. dbCAN: a web resource for automated carbohydrate-active enzyme annotation. Nucleic Acids Res. 2012;40:W445–W451. doi: 10.1093/nar/gks479. [DOI] [PMC free article] [PubMed] [Google Scholar]
Associated Data
This section collects any data citations, data availability statements, or supplementary materials included in this article.
Supplementary Materials
(A) Scatter plot from Principal Coordinate Analysis shows that the initial microbiota composition is not restored 2-weeks post-PEG treatment and diarrhea. (Right) Variation due to co-housing and gender does not contribute significant variation.
(B) Depiction of classification and calculations of dynamical data used to achieve map in Figure 1E. To quantify the large amounts of dynamical data across the phylogenetic tree, we classified bacterial abundance into three categories: PRE, not exposed to diarrhea (day 0 and controls); DURING, during the peak of diarrhea (days 3–6); and POST, at the end of the recovery (days 13 and 20). The time points in these classifications were averaged to create the bar plots to the right of the arrow. The taxon enrichment DURING vs. PRE-PEG (Figure 1E left) was calculated as log2 of the ratio of the DURING and PRE bars for each taxon, at each level (phylum to genus, vertical axis). Similarly, the taxon enrichment POST vs. PRE (Figure 1E right) was calculated as log2 of the ratio of the POST and PRE bars. We then calculated the abundance enrichment relative to pre-diarrhea for all significantly changed taxa (p<0.05), and plotted this contribution as a 2-dimensional phylogenetic heatmap.
(C) The abundance of certain microbial classes exhibited significant changes during PEG treatment and then quickly returned to pre-PEG levels once PEG was removed. Points represent the mean fractional abundance, and the bars represent the standard error of the mean (s.e.m.).
A) Abundance covariance matrix.
B) Abundance correlation coefficient matrix.
C) Abundance correlation coefficient matrix p-value.
Node area and branch thickness are linearly related to the abundance in control mice that did not undergo PEG treatment. Boxes highlight taxa that were discussed further in the main text.
(A) In a conventional mouse microbiota, the highly abundant S24–7 family underwent extinction during PEG treatment and was replaced by the Bacteroidaceae family, while Gammaproteobacteria increased in abundance during PEG treatment. Points represent the mean fractional abundance, and the bars represent s.e.m.
(B) Comparison of taxa dynamics between humanized and conventional microbiota. Abundance changes were compared between PRE vs. DURING and DURING vs. POST diarrhea and labeled as statistically different (p<0.05, increased or decreased) or unchanged (p>0.05). Taxa classified as different shared no commonality in dynamical comparisons between humanized and conventional mice; “One match” indicates that either PRE vs. DURING or DURING vs. POST behaved similarly; “Two-match” indicates both dynamical comparisons were similar between the microbiota.
(C) Total number of culturable bacteria did not decrease during diarrhea, independent of collection method. Bars represent the mean total colony forming units, and the error bars represent the standard deviation (s.d.).
(A) Fluorescently-labeled distal colon (stained as in Figure 3A) throughout the experiment. During and just after diarrhea, bacteria were found in direct contact with the epithelial layer (days 6 and 7, red arrows).
(B) Mucus layer was significantly thinner during PEG treatment.
(C) H&E staining revealed no significant inflammation or infiltrates in the mouse colonic epithelium.
(D) Stress response level 2 SEED category showed significantly increased “Osmotic” and “Dessication stress” genes, while other stress genes were overall decreased in representation. The bars represent the mean and the error bars represent s.d.
(E) Microbial abundance dynamics of three members of a gnotobiotic community. The points represent the mean fractional abundance, and the error bars represent s.e.m.
(F) Log2 heatmap of the most differentially abundant transcripts during the PEG time course in the three-member community experiment as measured by RNA-seq.
(G) Fluorescently labeled distal colon in a three-member community, stained as in Figure 3 but with Fluorescence In Situ Hybridization probes specific to Bacteroides (white), Lachnospiraceae (red), and Enterococcus (green). The plots (bottom panels) show the distribution of intercell distances (the mean across three separate colon sections is shown with a solid line, and the shaded area shows s.d., Methods) in mice colonized with the three bacterial members in (E). The spatial organization of the community changed during PEG treatment; specifically, the distance from each Bt cell to the nearest La increased, indicating that Bt was less well mixed with the community during PEG treatment compared to the control.
(A) Longitudinal protein clustering from proteomics analysis shows distinct dynamical patterns. Proteins were clustered using a weighted square error function in MFuzz (Methods). Cluster 1 shows upregulated immunoglobulin protein clusters on day 9.
(B) Serum IgG ELISA against whole cells expressing no capsule locus continued to increase after PEG treatment.
(C) Cecal IgA ELISA against whole cells expressing CPS4, CPS5, or no capsular polysaccharide loci continued to increase after PEG treatment.
(D) Serum cytokine levels were affected during PEG treatment but re-equilibrated before the end of PEG treatment.
(E) Proteins in the annexin and cadherin families showed relative stability (fecal log abundance) throughout the time course. Error bars represent s.e.m.
(F) MUC2 protein levels did not change significantly throughout the time course. Error bars represent s.e.m.
(A) Effects of osmotic perturbation vary depending on osmolyte and osmolality (Methods). Background-subtracted (from negative controls) average growth curves and s.d. for M. intestinale, E. hirae, B. thetaiotaomicron and a Lachnospiraceae isolate. All tested taxa were negatively affected by increased osmolality via addition of PEG, sodium chloride (NaCl), or sorbitol.
(B) In vivo abundance dynamics (mean and s.e.m.) for S24–7 OTU 185550, which has 98% sequence V4 region rRNA similarity to M. intestinale, for control untreated mice (left) and treated humanized mice (right).
(A) Bristol stool score during PEG treatment increases with PEG dosage.
(B) Change in mouse weight during PEG treatment increases with PEG dosage.
(C) Scatter plot of Principal Coordinate Analysis shows that the initial microbiota composition for 15% PEG-treated mice was restored within two weeks post-PEG treatment if cage changes were limited (Figure 6A).
(D) Bacteroidaceae abundance fluctuated in response to PEG and control stool introduction. Points represent the mean fractional abundance, and the error bars represent s.e.m.
(E) Alpha diversity (PD whole tree) decreased during PEG treatments, and then remained stable at pre-treatment levels following addition of control stools.
(F) Viruses identified in metagenomics data from our humanized mouse experiment using RefSeq on MG-RAST (Methods) exhibited distinct dynamics during and following PEG treatment. Points represent the mean fractional abundance, and the error bars represent s.d.
(G) Phages identified in metagenomics data from our humanized mouse experiment using VirSorter (Methods) show distinct dynamics during and following PEG treatment. ‘Reads mapped’ represents the number of reads from each individual sample that were successfully mapped onto the co-assembly of all samples. ‘Length’ indicates the length of the phage contigs (Methods).
Table lists the proteins associated with each cluster shown in Figures 4B and S5A.
A) Taxa monotonically increasing in different concentrations of PEG (5,10,15%). Pre PEG: day 0, PEG: days 3,5,6; Level 2: phylum; Level 3: class; Level 4: order; Level 5: family; Level 6: genus.
B) Taxa monotonically decreasing in different concentrations of PEG (5,10,15%). Pre PEG: day 0, PEG: days 3,5,6; Level 2: phylum; Level 3: class; Level 4: order; Level 5: family; Level 6: genus.