Abstract
Recognition and removal of apoptotic cells by professional phagocytes, including dendritic cells and macrophages, preserves immune self-tolerance and prevents chronic inflammation and autoimmune pathologies1,2. The diverse array of phagocytes that reside within different tissues, combined with the necessarily prompt nature of apoptotic cell clearance, makes it difficult to study this process in situ. The full spectrum of functions executed by tissue-resident phagocytes in response to homeostatic apoptosis, therefore, remains unclear. Here we show that mouse apoptotic intestinal epithelial cells (IECs), which undergo continuous renewal to maintain optimal barrier and absorptive functions3, are not merely extruded to maintain homeostatic cell numbers4, but are also sampled by a single subset of dendritic cells and two macrophage subsets within a well-characterized network of phagocytes in the small intestinal lamina propria5,6. Characterization of the transcriptome within each subset before and after in situ sampling of apoptotic IECs revealed gene expression signatures unique to each phagocyte, including macrophage-specific lipid metabolism and amino acid catabolism, and a dendritic-cell-specific program of regulatory CD4+ T-cell activation. A common ‘suppression of inflammation’ signature was noted, although the specific genes and pathways involved varied amongst dendritic cells and macrophages, reflecting specialized functions. Apoptotic IECs were trafficked to mesenteric lymph nodes exclusively by the dendritic cell subset and served as critical determinants for the induction of tolerogenic regulatory CD4+ T-cell differentiation. Several of the genes that were differentially expressed by phagocytes bearing apoptotic IECs overlapped with susceptibility genes for inflammatory bowel disease7. Collectively, these findings provide new insights into the consequences of apoptotic cell sampling, advance our understanding of how homeostasis is maintained within the mucosa and set the stage for development of novel therapeutics to alleviate chronic inflammatory diseases such as inflammatory bowel disease.
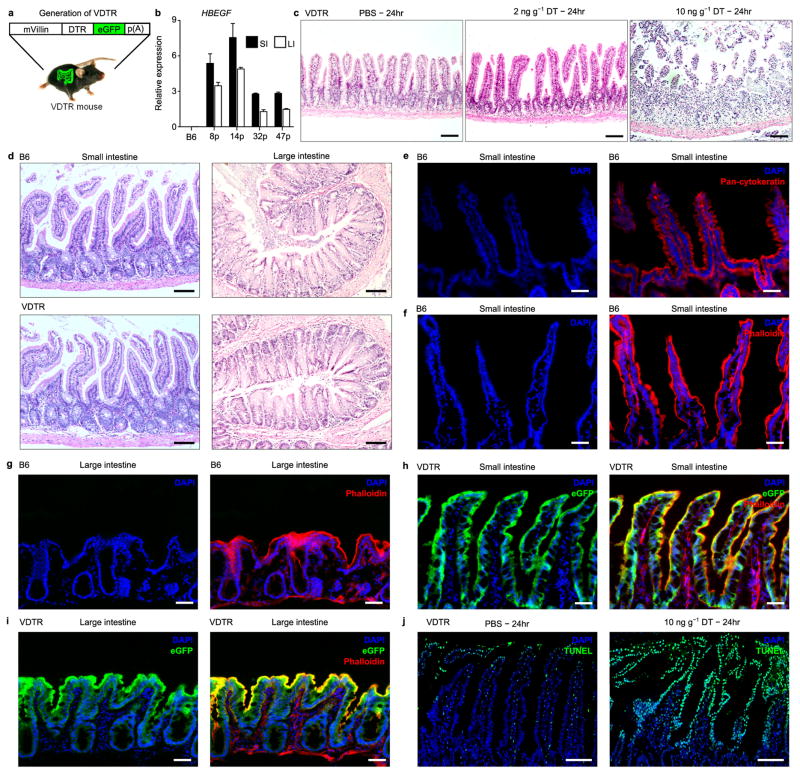
Clearance of apoptotic epithelial cells within the respiratory, colonic and post-weaning mammary epithelium can be conducted by aptly positioned neighbouring epithelial cells, which serve as non- professional phagocytes1,3. To examine whether apoptotic IECs are also recognized by professional phagocytes within the small intestinal lamina propria (SILP), we generated mice that express transgenic diphtheria toxin receptor (DTR) fused to enhanced green fluorescent protein (eGFP), driven by the epithelium-specific villin promoter (VDTR mice). This enabled the experimental induction of apoptosis and allowed for tracking of apoptotic cell phagocytosis by acquisition of eGFP. The villin promoter drove transgene expression in IECs of the small and large intestine (Extended data Fig. 1a, b). We observed no gross histological changes within the small or large intestine of VDTR mice relative to C57BL/6J (B6) controls (Extended data Fig. 1c, d). Extensive eGFP expression co-localized with epithelial pan-cytokeratin and the actin cytoskeletal binding agent phalloidin throughout the small and large intestinal epithelia (Fig. 1a and Extended data Fig. 1e–i). Injection of VDTR mice with 10 ng g−1 diphtheria toxin induced IEC death throughout the villi; dying IECs in control mice injected with phosphate buffered saline (PBS) were noted only at villi tips, characteristic of natural IEC turnover3 (Extended data Fig. 1j).
Figure 1. A novel mouse model for inducing apoptosis of IECs under non-inflammatory conditions.
a, Immunofluorescence for indicated markers on small intestine cryo-sections. b, qRT–PCR on VDTR ileum represents at least four independent experiments in duplicate. n =4 mice per group. One-way ANOVA; **P <0.01, *P < 0.05. NS, not significant. Data are mean ±s.e.m. c, Immunofluorescence for cleaved caspase 3 (CC3) on small intestine paraffin sections 4 h after administration of 2 or 10 ng g−1 diphtheria toxin (DT). Scale bars, 50 (a) and 100 (c) μm.
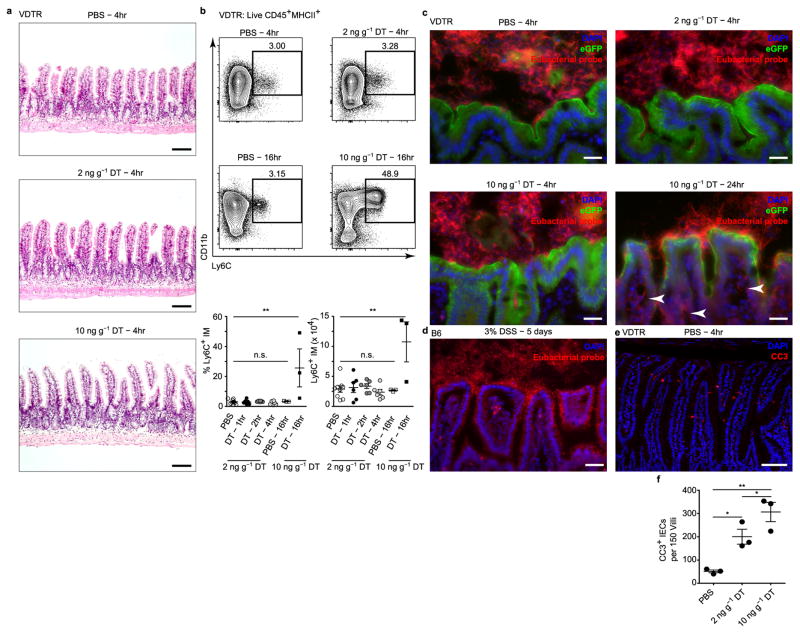
Lowering the dose of diphtheria toxin to 2 ng g−1 showed no evidence of causing epithelial erosion, villus atrophy or inflammatory cell infiltration over time (Extended data Figs 1c, right versus middle panels, 2a, b). Expression of inflammatory Il6, Il1b and Tnf genes was not induced in the ileum 4 h after administration of either 2 or 10 ng g−1 of diphtheria toxin. However, upregulation of these pro-inflammatory genes was observed 16 h after administration of 10 ng g−1 diphtheria toxin (Fig. 1b). We observed no bacterial translocation to the intestinal lamina propria after treatment with either dose of diphtheria toxin for 4 h, in contrast to 10 ng g−1 diphtheria toxin at 24 h or with 3% dextran sodium sulphate (DSS) (Extended data Fig. 2c, d). Staining for cleaved caspase-3 (CC3), a marker of early apoptosis, was significantly increased in a dose-dependent manner within the terminal ileum of diphtheria-toxin-treated compared to PBS-treated VDTR mice (Fig. 1c and Extended data Fig. 2e, f). We thus chose 2 ng g−1 as the diphtheria toxin dose concentration that would increase the likelihood of observing phagocytic sampling of apoptotic IECs without eliciting inflammation or epithelial barrier disruption.
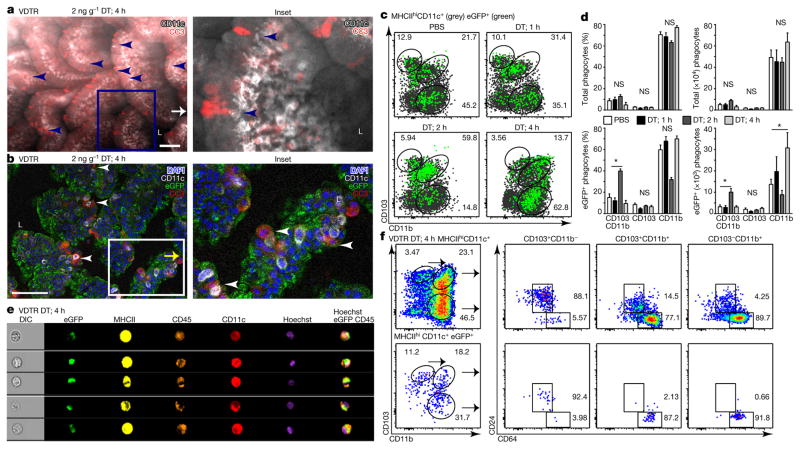
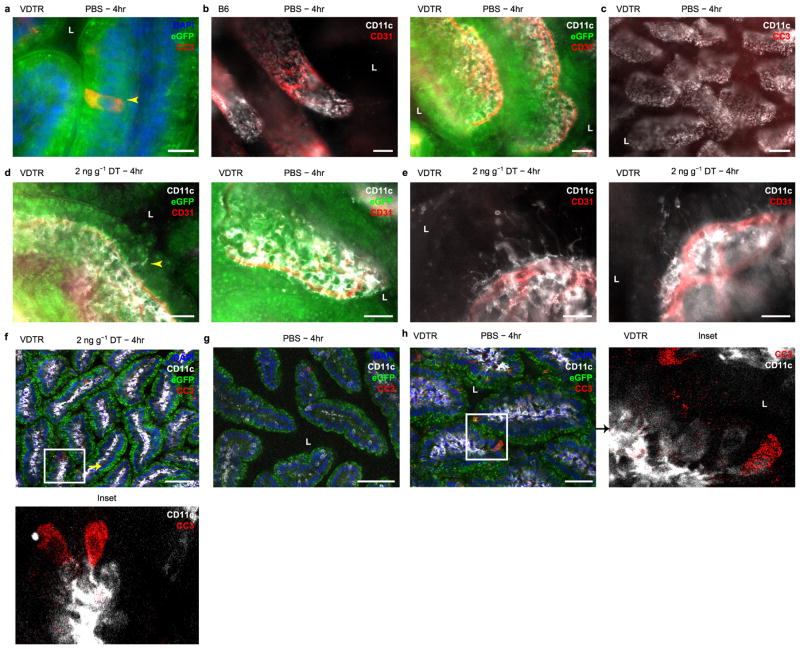
Using whole-mount microscopy on excised small intestine tissue, we localized CC3 labelling to eGFP+ IECs and CD11c expression to phagocytes, which appeared centrally within villi and proximally to the CD31+ vasculature (Extended data Fig. 3a, b). We detected numerous CC3+ IECs in the small intestine of diphtheria-toxin-treated VDTR mice (Fig. 2a and Extended data Fig. 3c). CD11c+ cells extended dendrites towards the base of apoptotic IECs upon diphtheria toxin treatment, into the space of the eGFP signal and not the lumen (as happens during soluble antigen retrieval6) (Fig. 2a and Extended data Fig. 3d). Some dendrites ended with globular shapes, characteristic of phagocyte sampling6 (Extended data Fig. 3e), and were observed in the same optical confocal section as CC3+ IECs (Fig. 2b and Extended data Fig. 3f). CC3+ IECs were also increased in diphtheria-toxin-treated mice (Fig. 2b) relative to control (Extended data Fig. 3g, h), consistent with the quantification in Extended data Fig. 2f.
Figure 2. A single CD103+ dendritic cell subset and two macrophage subsets sample apoptotic intestinal epithelial cells.
a, b, Conventional (without eGFP overlaid) (a) and confocal (b) whole-mount microscopy of VDTR ileum. Scale bars, 100 μm. Arrowheads in a indicate phagocytes near CC3+ IECs. L, lumen. c, Flow cytometry analysis of total (grey) and eGFP+ (green) phagocytes pre-gated on live CD45+MHCIIhiCD11c+ cells. d, Percentage and absolute number of phagocytes from c. e, ImageStream of SILP VDTR cells. Data represent three independent experiments. DIC, differential interference contrast microscopy. f, Flow cytometry analysis of total phagocytes with corresponding eGFP+ cells. Data are mean ±s.e.m., n = 3 B6 mice; n = 6 VDTR mice treated with 2 ng g−1 diphtheria toxin for 1–4 h; n = 9 VDTR mice treated with PBS; one-way ANOVA; *P <0.05; NS, not significant. Data in c, e, and f, represent SILP cells from VDTR mice, at least three independent experiments.
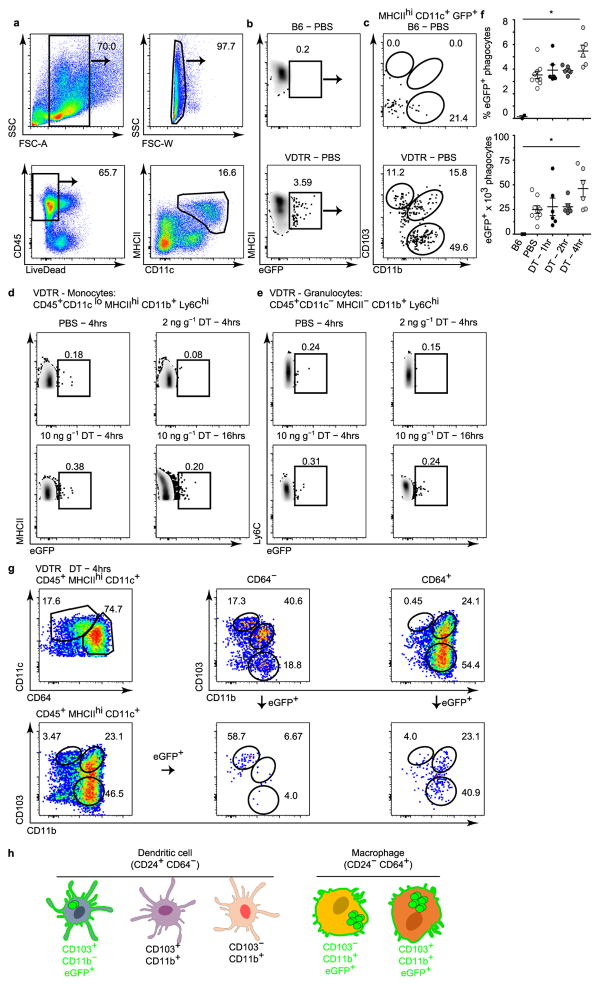
We monitored apoptotic IEC sampling by tracking the appearance of eGFP within phagocytes. We set sub-gates by flow cytometry within haematopoietic SILP cells (Extended data Fig. 4a) from VDTR mice, compared to B6 mice (Extended data Fig. 4b). All intestinal CD45+MHCII+CD11c+ phagocyte subsets, divided on the basis of surface expression of the integrins αE (CD103) and αM (CD11b)5, contained the eGFP label in VDTR mice, regardless of diphtheria toxin treatment. This indicated constitutive apoptotic IEC sampling, which was not observed for monocytes and granulocytes (Extended data Fig. 4b–e). The number of eGFP+ phagocytes was significantly increased 4 h after diphtheria toxin administration when compared to control (Extended data Fig. 4f). Of all eGFP+ phagocytes from diphtheria-toxin-treated mice (Extended data Fig. 4c), CD103+CD11b+ and CD103−CD11b+ (CD11b+) phagocytes were significantly increased at 2 h and 4 h, respectively, relative to PBS-treated mice (Fig. 2c, d). The total number of phagocytes was not increased relative to PBS-treated mice, suggesting that the increase in eGFP+ phagocytes was not due to an influx of cells, but rather an increase in phagocytes carrying apoptotic IEC cargo (Fig. 2c, d). ImageStream analyses showed eGFP+ inclusions within MHCII+CD45+CD11c+Hoechst+ phagocytes (Fig. 2e), indicating internalization of apoptotic bodies or degradation of formerly engulfed apoptotic IECs.
Assessment of the expression of CD64, a marker of macrophages in the mouse intestine6, and CD24, expression of which defines dendritic cells6, revealed that CD103+ phagocytes were predominately CD24+CD64−, defined as dendritic cells6 (Fig. 2f). Minor populations of CD24+CD64− dendritic cells were also present within the CD103+CD11b+ and CD11b+ phagocytes, which were otherwise predominantly comprised of CD24−CD64+ macrophages (Fig. 2f and Extended data Fig. 4g). The CD64+CD103+CD11b+ macrophage population was most notable as it has not previously been reported8, although its CD103 expression may be transient5. Of CD103+CD11b+ and CD103−CD11b+ phagocytes, only CD24−CD64+ macrophages contained the eGFP label (eGFP+), whereas CD24+CD64− dendritic cells did not (eGFP−)(Fig. 2f and Extended data Fig. 4g). Notably, only the CD103+ population of CD24+CD64− dendritic cells were eGFP+ (Fig. 2f and Extended data Fig. 4g). Thus, of the five phenotypically distinct SILP phagocytes, only CD11b−CD103+ (CD103+) dendritic cells and two macrophage subsets, CD103+CD11b+ and CD11b+, sample apoptotic IECs (Fig. 2f and Extended data Fig. 4h).
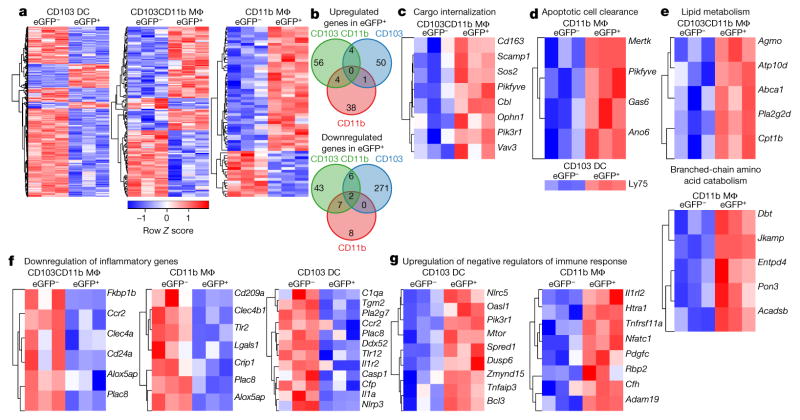
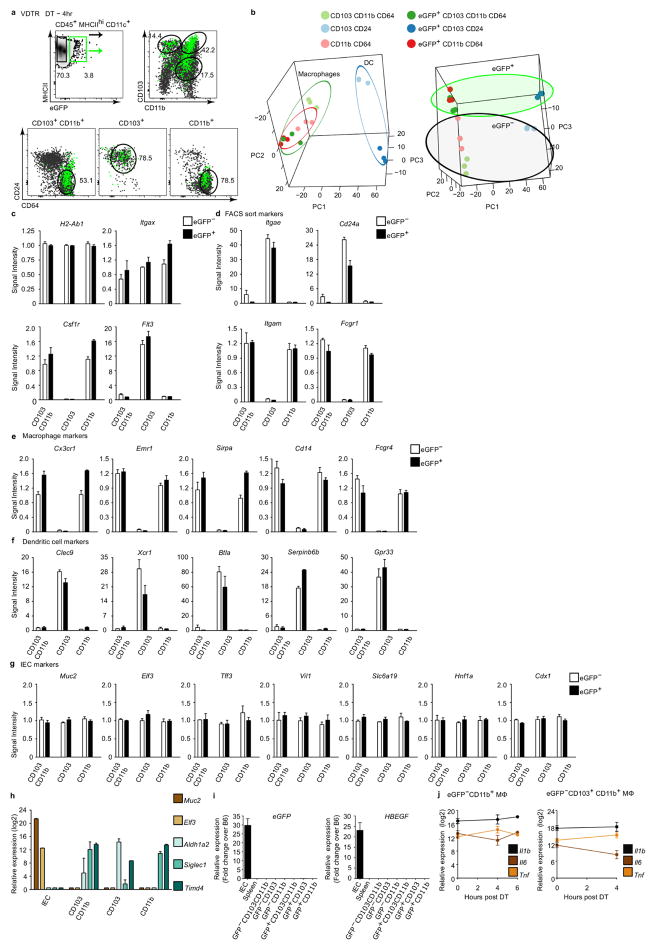
We next determined the transcriptional profiles that result from apoptotic IEC sampling by isolating the eGFP+ and equivalent eGFP− populations of each subset (Extended data Fig. 5a) 4 h after administration of 2ng g−1 diphtheria toxin, conditions that maintain a non-inflammatory state (Fig. 1 and Extended data Fig. 2). Principal component analysis of gene expression revealed distinct clustering into dendritic cells and macrophages, and further clustering based on eGFP content (Extended data Fig. 5b–f). Comparing gene expression profiles of eGFP+ and eGFP− phagocytes revealed predominant transcriptional downregulation in CD103+ dendritic cells and upregulation in macrophages after apoptotic IEC sampling (Fig. 3a). CD103+ dendritic cells had the most differentially expressed genes (334) followed by CD103+CD11b+ (122) and CD11b+ (60) macrophages (Fig. 3a, b). Each phagocyte upregulated unique sets of genes in response to apoptotic IECs, and only two genes, Plac8 and Itgb7 (Supplementary Information shows all gene names) were downregulated in all three of the groups, suggesting that apoptotic IEC sampling generates unique transcriptomes within each phagocytic cell subset.
Figure 3. Sampling apoptotic IECs in situ triggers a transcriptional ‘suppression of inflammation’ signature distinct for macrophages (Mϕ) and CD103+ dendritic cells (DC).
a, c–g, Hierarchical clustering of differentially expressed genes upregulated by at least 1.2 fold (ANOVA (q < 0.05) and Tukey’s honest significant difference (HSD) post-hoc test (P <0.05); −1.2 >fold-change >1.2); expressed by row Z scale and organized according to Gene Ontology as indicated. b, Venn diagrams of genes in a. Data represent five independent experiments, four mice per experiment, three biological replicates.
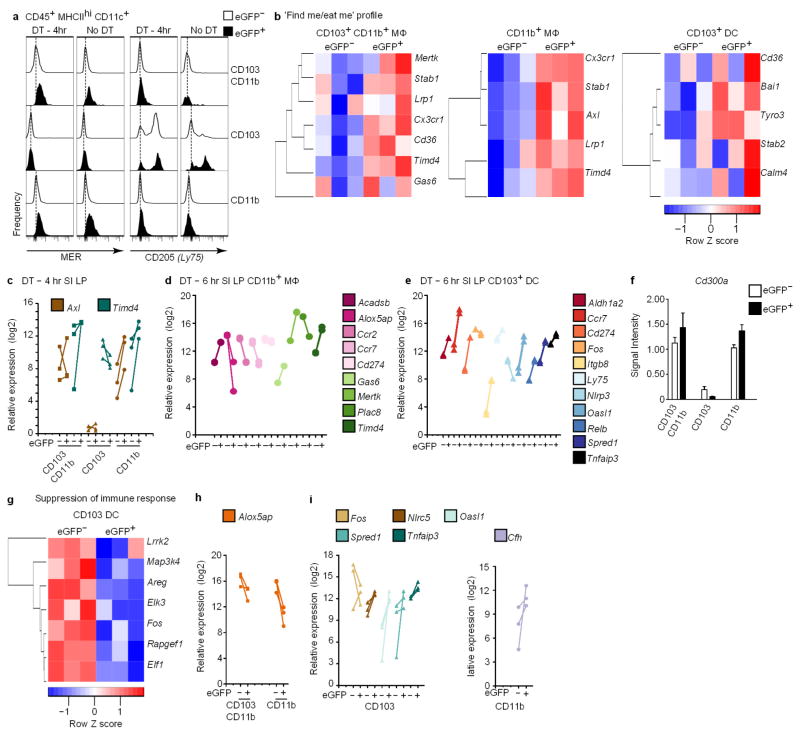
Several unique pathways were induced in apoptotic IEC-bearing eGFP+ macrophages, including those that facilitate internalization of cargo and clearance of apoptotic cells (Fig. 3c, d). CD103+CD11b+ and CD11b+ macrophages, which sampled the bulk of apoptotic IECs (Fig. 2c, d), significantly upregulated a distinct array of genes involved in apoptotic cell clearance, including Gas6, the scavenger receptor Cd163, and TAM family receptor Mertk (encoding MER)1, whereas CD103+ dendritic cells upregulated the endocytic receptor Ly75 (encoding CD205), which detects apoptotic cell ligands9 (Fig. 3d). Higher surface expression of MER in macrophages and CD205 in dendritic cells correlated with higher eGFP content, irrespective of diphtheria toxin treatment, validating the use of low doses of diphtheria toxin to increase apoptotic IEC numbers without major steady-state perturbations (Extended data Fig. 6a). Other genes whose expression correlated with eGFP content were differentially modulated in macrophages and CD103+ dendritic cells, including Cx3cr1, TAM family receptors Axl and Tyro3, and Stabilin family receptors Adgrb1 (also known as Bai1) Stab1 and Timd4 (Extended data Fig. 6b–e, confirming similar profiles at 6 h after diphtheria toxin administration), whereas Cd300a remained unchanged (Extended data Fig. 6f). Both macrophage subsets expressed Pikfyve, which is essential for phagosome maturation10 (Fig. 3c, d). Increased expression of genes involved in lipid processing and branched-chain amino acid catabolism was notable in apoptotic IEC-bearing CD103+CD11b+ and CD11b+ macrophages, respectively (Fig. 3e), and may reflect the increased catabolism of internalized apoptotic cargo metabolites. CD103+CD11b+ macrophages upregulated Abca1 expression, which increases cholesterol efflux and has been associated with engulfment of apoptotic cells and liver X receptor α function, which upregulates Mertk expression1. Similarly, CD11b+ macrophages upregulated Acadsb (Fig. 3e and Extended data Fig. 6d).
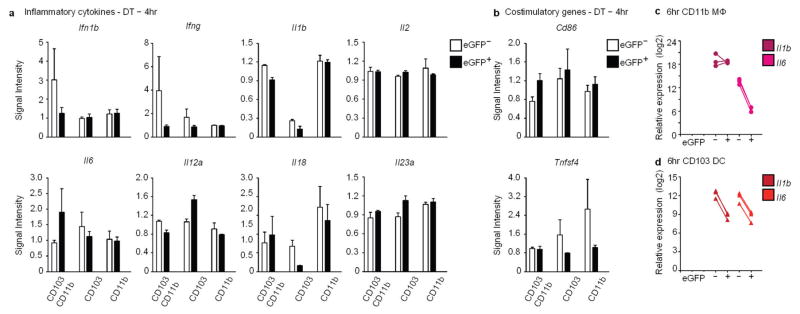
Profiling genes that were downregulated in response to apoptotic IEC sampling revealed two notable transcriptional signatures: the down-regulation of inflammatory genes and suppression of the immune response (Fig. 3f and Extended data Fig. 6g–i). Different sets of these genes were significantly downregulated in CD103+CD11b+ and CD11b+eGFP+ macrophages, including genes that encode the pattern recognition receptors Clec4a, Clec4b1, Cd209a and Tlr2 (Fig. 3f). Alox5ap, which facilitates inflammatory leukotriene biosynthesis, was significantly downregulated in both CD103+CD11b+ and CD11b+eGFP+ macrophages (Fig. 3f and Extended data Fig. 6d, h) reflecting previous findings that show suppression of 5-lipoxygenase by apoptotic cells11. CD103+ dendritic cells also significantly downregulated several innate immune genes including Tlr12, inflammasome-related Nlrp3, Casp1 and Il1a12 (Fig. 3f), as well as MAPK/ERK signalling (Lrrk2, Map3k4, Fos) (Extended data Fig. 6g, i) and Nlrp3, Fos at 6 h after diphtheria toxin administration (Extended data Fig. 6e). Classical and alternative complement genes C1qa and Cfp, respectively, were also downregulated in CD103+ dendritic cells (Fig. 3f), which may further dampen NLRP3 inflammasome activation13. Additionally, expression of Cfh, encoding a regulator of complement activation, was upregulated in eGFP+CD11b+ macrophages (Fig. 3g and Extended data Fig. 6i). Also notable was the significant upregulation of negative regulators of the immune response (Fig. 3g). CD103+ dendritic cells upregulated: Nlrc5 and Tnfaip3 (A20), which negatively regulate the NLRP3 inflammasome, type-I interferon (IFN) signalling and NF-κB activity14; Oasl1, which inhibits IRF7, a type-I IFN transcription factor15; and Spred1, which inhibits MAPK signalling16 (Extended data Fig. 6i, e, at 6 h after diphtheria toxin administration). Coupled with unchanged or downregulated gene expression profiles for inflammatory cytokines and co-stimulatory receptors in eGFP+ relative to eGFP− counterparts after diphtheria toxin treatment (Extended data Fig. 7), the overall phagocytic response to apoptotic IEC sampling in situ results in genome-wide transcriptional suppression of a set of inflammatory genes that is unique to each CD11c+ subset.
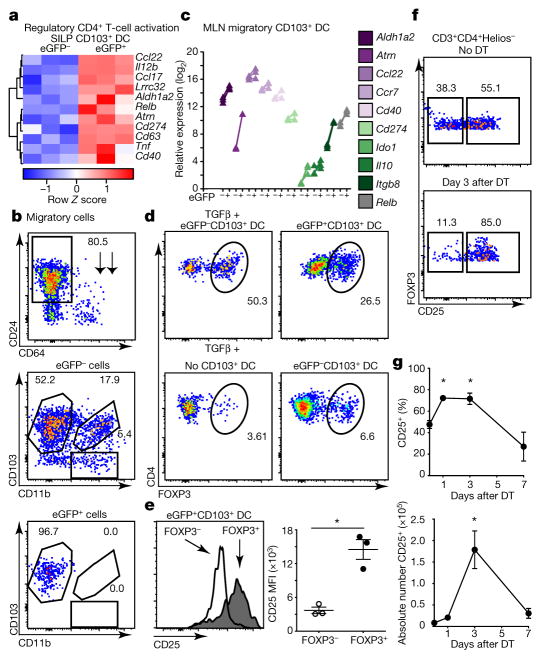
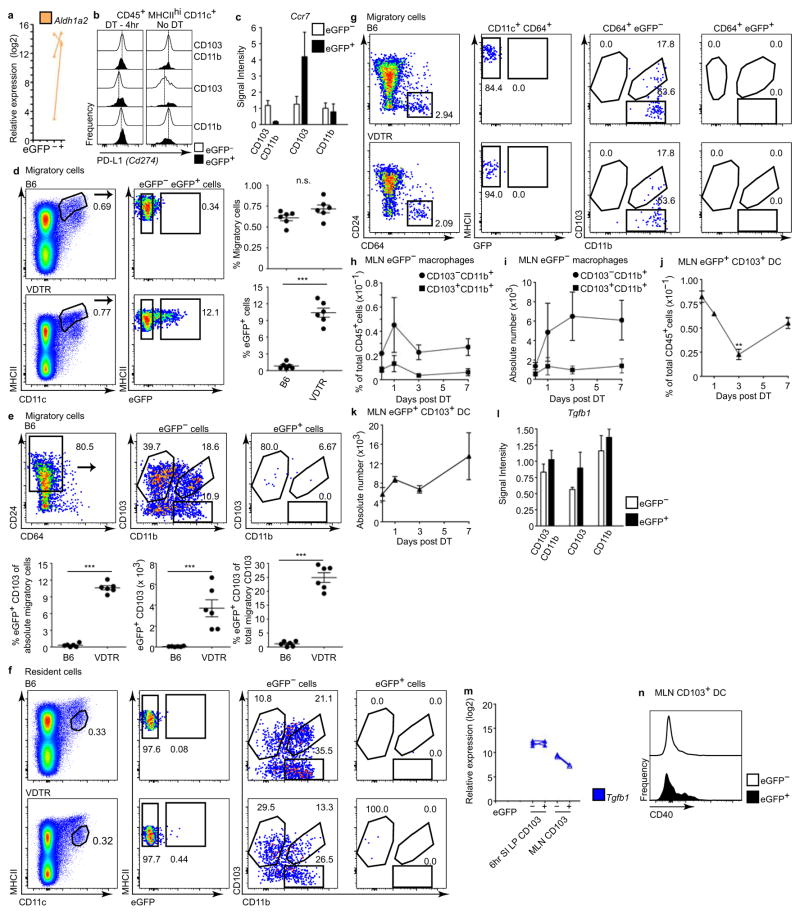
In contrast to macrophages, eGFP+CD103+ SILP dendritic cells showed a distinct transcriptional profile dominated by a ‘regulatory CD4+ T-cell activation’ signature (Fig. 4a, Extended data Fig. 6e at 6 h post-diphtheria toxin). These dendritic cells significantly upregulated genes that are required for regulatory CD4+ T-cell (Treg) recruitment, including chemokines Ccl22 and Ccl17 (ref. 17), and genes that promote Treg-mediated suppression—including the leucine-rich membrane protein Lrrc32, which retains latent TGFβ on Treg cells18 (Fig. 4a). Aldh1a2, which catalyses the synthesis of retinoic acid to further generate Treg in the periphery19, was also significantly upregulated (Fig. 4a, Extended data Fig. 8a), as were genes required for Treg expansion including the suppressive co-stimulatory molecule Cd274 (encoding PD-L1)5 (Fig. 4a), whose surface expression on eGFP+CD103+ dendritic cells after diphtheria toxin administration was the same as that of untreated VDTR mice (Extended data Fig. 8b). RelB and Cd40, involved in inducing Treg differentiation20, were also significantly upregulated (Fig. 4a). Thus, apoptotic IEC sampling by SILP CD103+ dendritic cells sets the stage for instructing differentiation of Treg cells, which are important mediators of intestinal tolerance and homeostasis19.
Figure 4. Apoptotic cell cargo endow migratory CD103+ dendritic cells with the ability to induce Treg-cell differentiation.
a, Hierarchical clustering of differentially expressed genes upregulated in CD103+ dendritic cells as in Fig. 3. b, d–f, Flow cytometry of untreated VDTR MLN phagocytes (b) and splenic CD4+ T cells (d–f) stained after co-culture with indicated ex vivo dendritic cells (d, e) or MLN CD4+ T cells stained ex vivo (f). Numbers indicate percentage of cells within gates. b, Migratory phagocytes pre-gated on live CD45+MHCIIhiCD11c+ cells. c, qRT–PCR for indicated genes representative of three independent analytical repeats with one biological replicate consisting of two mice. e, Geometric mean of CD25 (right panel) from d. Data represent two independent experiments, 2–3 replicates per condition. f, MLN Treg (pre-gated on CD3+CD4+Helios−) cells from VDTR mice untreated (top) and 3 days after 2 ng g−1 diphtheria toxin treatment (bottom). g, Quantification of data from f over time. n = 4 mice per time point; n =5 mice treated with PBS. One-way ANOVA; *P < 0.05. Data are mean ±s.e.m.
Highest expression of the chemotactic receptor Ccr7 in the SILP was observed in eGFP+CD103+ dendritic cells (Extended data Fig. 8c, 6e at 6 h), suggesting that CD103+ dendritic cells function as migratory phagocytes that traffic apoptotic IEC cargo from the lamina propria to the mesenteric lymph nodes (MLN). Migratory cells within the MLN of VDTR and B6 mice were similar, but eGFP+ phagocytes, which comprised approximately 10% of all migratory cells, were noted only in MLN of VDTR mice and without the need for treatment with diphtheria toxin, indicating the shuttling of apoptotic IEC cargo to the MLN under steady-state conditions (Fig. 4b and Extended data Fig. 8d, e, B6 mice). Of the migratory subsets, only CD103+CD11b−CD24+ dendritic cells were eGFP+, comprising approximately 25% of all CD103+ migratory cells (Fig. 4b and Extended data Fig. 8e), whereas MLN-resident CD103+ dendritic cells were eGFP− (Extended data Fig. 8f–k).
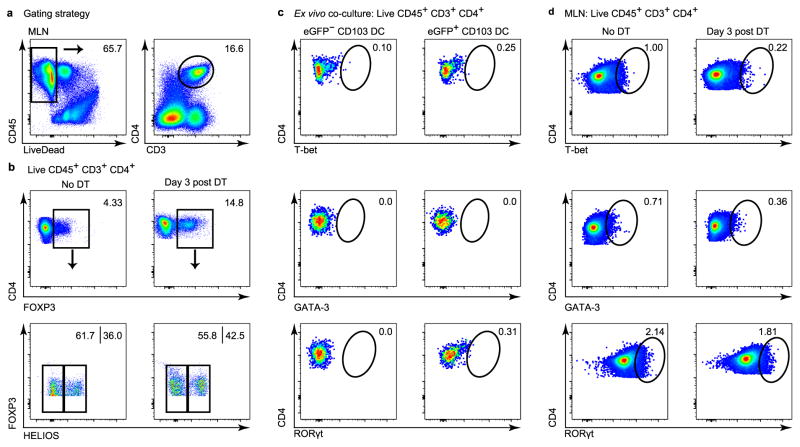
Within the MLN, migratory eGFP+CD103+ dendritic cells had a transcriptional profile (Fig. 4c) similar to that of SILP eGFP+CD103+ dendritic cells (Fig. 4a). Several transcripts affecting Treg cells were additionally increased in eGFP+ relative to eGFP−CD103+ MLN dendritic cells, including Ido1 and Il10 (ref. 20). Whereas levels of Tgfb1 transcripts, which encode a protein that facilitates Treg expansion19, were similar (Extended data Fig. 8l, m), those of Itgb8, which encodes a protein that activates TGFβ, were increased by approximately 10- and 20-fold in eGFP+ relative to eGFP−CD103+ MLN and SILP dendritic cells, respectively (Fig. 4c and Extended data Fig. 6e). This equated to an approximately 4-fold increase from the SILP to the MLN. T-cell co-stimulatory receptors (CD274, CD40) (Fig. 4a, c and Extended data Fig. 8b, n), and secreted signals (retinoic acid (via Aldh1a2), CCL22), were also increased relative to eGFP−CD103+ MLN dendritic cells (Fig. 4a, c). Consistent with this profile, eGFP+CD103+ dendritic cells induced an approximately 4-fold increase in Treg cells ex vivo, as marked by the Treg-specific transcription factor FOXP3, compared to eGFP− counterparts (26.5% versus 6.6%, respectively) and without added TGFβ (Fig. 4d). No Treg differentiation occurred when TGFβ was added alone without dendritic cells (Fig. 4d). Unlike FOXP3− T cells, these induced FOXP3+ Treg cells expressed the high-affinity IL-2 receptor CD25 (ref. 19; Fig. 4e). The number of Treg cells also increased in vivo following a single diphtheria toxin injection, as shown by increased CD45+CD3+CD4+FOXP3+ peripherally induced Treg cells marked by lack of Helios expression or transcription factors specific for other T-helper cell subsets (Fig. 4f, g and Extended data Fig. 9). Despite a predominant specificity of small intestine Treg cells for dietary antigens21, specificities for self-antigens remain possible. Thus, although CD103+ dendritic cells migrate to MLN regardless of the content of apoptotic IECs (Fig. 4b), only CD103+ dendritic cells carrying apoptotic IECs excelled at de novo Treg-cell differentiation.
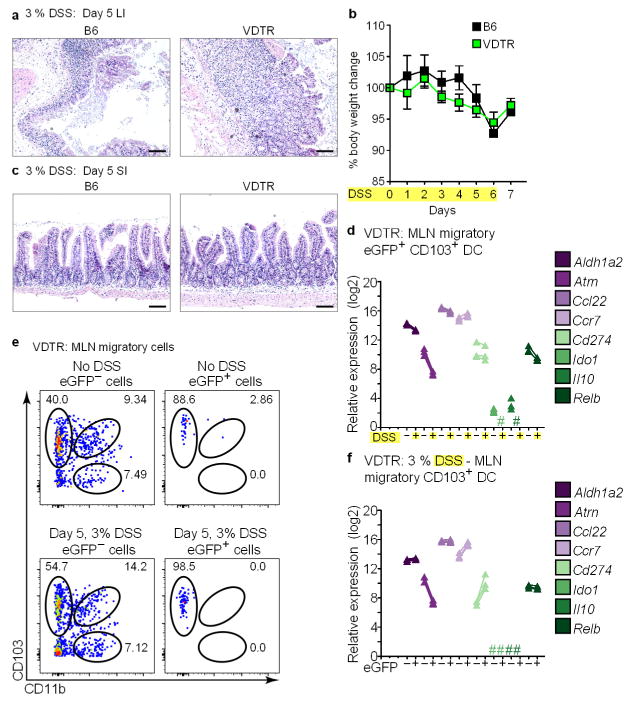
The transposition of differentially modulated genes with the 163 susceptibility loci identified through genome-wide association studies on inflammatory bowel disease (IBD)22 showed modulation of 41 IBD susceptibility genes upon apoptotic IEC sampling, with the majority expressed in CD103+ dendritic cells and some select genes shared between macrophages and the CD103+ dendritic cells and CD103+CD11b+ macrophages (Table 1). Although no single gene was expressed in all three populations, CD103+ dendritic cells and CD103+CD11b+ macrophages shared downregulation of Mrpl20 and Sept1 and upregulation of Il12b, encoding the p40 subunit shared by IL-12 and IL-23—and in which single nucleotide polymorphisms are associated with Crohn’s disease in Korean populations23. Macrophage subsets shared the downregulation of Lsp1, whereas CD103+ dendritic cells upregulated Pfkfb3. Lsp1 is involved in activation of PPARγ that enhances apoptotic cell phagocytosis and, together with Pfkfb3, suppresses diet-induced intestinal inflammation24. How allelic polymorphisms within IBD susceptibility loci affect genes involved in intestinal tolerance and homeostasis is not known. However, modelling the colonic epithelial ulcerations and cellular infiltration characteristic of IBD through the treatment of VDTR mice with DSS (Extended data Fig. 10a–c) showed downregulation of many of the Treg-cell activation genes differentially expressed both upon apoptotic IEC sampling by migratory eGFP+CD103+ MLN dendritic cells, such as Aldh1a2, Atrn, Ccl22, Cd274, Ido1, Il10 and Relb, and relative to those from untreated mice (Extended data Fig. 10d). CD103+ dendritic cells were the only phagocytic subset in DSS-treated VDTR mice that delivered apoptotic IEC cargo to the MLN (Extended data Fig. 10e), but many Treg activation genes were no longer upregulated in these cells within the MLN, with expression levels similar or even reduced relative to eGFP− counterparts (Extended data Fig. 10f). Taken together, these data suggest that inflammation alters the outcome of apoptotic cell sampling, and point to a possible disruption of the tolerogenic consequences of apoptotic IEC sampling during IBD.
Table 1.
Apoptotic IEC sampling induces transcriptional modulation of IBD susceptibility genes in intestinal lamina propria phagocytes
| CD103+CD11b+ MΦ | CD103+ dendritic cell | ||||||||
|---|---|---|---|---|---|---|---|---|---|
|
|
|
||||||||
| Gene | Regulation | Gene | Regulation | Gene | Regulation | Gene | Regulation | ||
| Il12b | up | Il12b | up | Sept1 | down | Hhex | down | ||
| Trpm2 | up | Lrrc32 | up | Rassf5 | down | Cast | down | ||
| Tmem132a | up | Pfkfb3 | up | Ptpn1 | down | Nusap1 | down | ||
| Lsp1 | down | Gca | up | Kif11 | down | Il1r2 | down | ||
|
|
|||||||||
| Rpl3 | down | Cd40 | up | Gpr183 | down | CD11b+ MΦ | |||
|
|
|||||||||
| Mrpl20 | down | Tnfaip3 | up | Slc25a28 | down | Gene | Regulation | ||
|
|
|||||||||
| Ak3 | down | Spred1 | up | Fuca2 | down | Il1rl2 | up | ||
| Ctsw | down | Lrrk2 | down | Mospd3 | down | Lsp1 | down | ||
|
|
|||||||||
| Sept1 | down | Plau | down | Ikzf1 | down | Differentially expressed | |||
|
|
|||||||||
| Dclre1b | down | Mrpl20 | down | Psmd3 | down | Phagocyte | Total | Up | Down |
|
|
|||||||||
| S100a10 | down | Fos | down | Acyp1 | down | CD103+ CD11b+ MΦ | 13 | 3 | 10 |
| Tnni2 | down | Notch2 | down | Sult1a1 | down | CD103+ DC | 30 | 7 | 23 |
| S100a11 | down | Donson | down | Bcap29 | down | CD11b+ MΦ | 2 | 1 | 1 |
Genes exhibiting upregulation or downregulation in each SILP phagocyte population upon apoptotic IEC sampling were overlapped with IBD susceptibility loci, which were downloaded from the GEO (accession number GSE57945, http://www.ncbi.nlm.nih.gov/geo/query/acc.cgi?acc=GSE57945)25. Genes in bold are shared. Total numbers of differentially expressed IBD genes is shown in the bottom right corner. MΦ, macrophage.
Apoptotic cells mediate their known roles in immunosuppression by pairing downregulation of inflammatory genes with upregulation of negative regulatory nodes that simultaneously target more than one pathway of inflammation. Apoptotic IECs also bestow the ability to instruct Treg-cell differentiation upon the single intestinal CD103+ dendritic cell subset tasked with their sampling. Innate immune recognition of apoptotic IECs is thus a critical component of the mechanisms that mediate gut homeostasis3,6.
Online Content Methods, along with any additional Extended Data display items and Source Data, are available in the online version of the paper; references unique to these sections appear only in the online paper.
METHODS
Mice
Plasmids containing the 9-kb mouse villin promoter (pBS-Villin)26,27 and simian diphtheria toxin receptor (HBEGF (‘DTR’)) with the enhanced green fluorescent protein (pDTR–eGFP) fusion gene28 have been previously described. The pDTR–eGFP was PCR amplified with primers harbouring a 5′ BsiWI site and a 3′ MluI site and cloned into pBS-Villin. The pBS-Villin/DTR–eGFP plasmid was verified by sequencing and the transgene was isolated from the plasmid by restriction enzyme digestion and gel purification. The transgene was microinjected into fertilized eggs from C57BL/6J mice (Jackson Laboratory) and transferred into oviducts of ICR foster mothers as previously described26. Identification of the transgenic mice was performed by PCR amplification using the following primers: 5′-ACTGCTCTCACATGCCTTCT-3′ and 5′-CTTCTTCCCTAGTCCCTTGC-3′. For diphtheria toxin administration, mice were injected intraperitoneally with 2 or 10 ng g−1 diphtheria toxin (EMD Chemicals) and humanely killed 1–24 h later29. Control mice were injected with PBS. For dextran sulphate solution (DSS) (MP Biomedicals) studies, mice were supplemented with 3% DSS in the drinking water for five days. On day three, water bottles were refilled with 3% DSS solution and on day five, replaced with fresh drinking water. Mice were weighed and monitored daily for signs of distress, morbidity or mortality during the course of the experiment until they were killed on day 7. Both male and female mice ages 6–8 weeks were used for all studies. All experiments were approved by the institutional animal care and use committee and carried out in accordance with the ‘Guide for the Care and Use of Laboratory Animals’ (NIH publication 86–23, revised 1985).
Isolation of professional phagocytes from the SILP
Before isolating professional phagocytes (‘phagocytes’), VDTR and VDTR negative littermate controls were intraperitoneally injected with PBS (vehicle) or diphtheria toxin (EMD Chemicals) at a low (2 ng g−1) or high (10 ng g−1) dose per body weight. Mice were then killed 1–24 h later and phagocytes were isolated from the SILP as previously described with some modifications30. In brief, the small intestine, including the duodenum, jejunum and ileum, was excised and Peyer’s patches removed. Next, the small intestine was opened longitudinally with surgical scissors and flushed with ice-cold PBS to remove the faecal content. Intestines were then cut into 0.5-cm pieces and transferred into 50-ml conical tubes containing 20 ml of PBS. Samples were then vigorously shaken for 30 s using the vortex genie (Scientific Industries) and passed over 100-μm nylon cell strainers (BD Falcon). Fresh PBS was added to the tissue samples and the shaking and filtering process was repeated a total of eight times. To isolate and remove the intestinal epithelial cell layer, samples were washed with 20 ml of warm PBS containing 3 mM EDTA and passed over cell strainers. This was repeated three times. Flow-through was kept as purified for IECs, whereas whole tissues were further processed to isolate dendritic cell and macrophage subsets. Next, samples were washed with ice-cold PBS followed by RPMI 1640 (Sigma) containing 5% FBS to remove the EDTA. Samples were then re-suspended with RPMI 1640 containing 5% FBS, 1 mg ml−1 collagenase D (Roche), and 1 mg ml−1 DNase I (Roche) and incubated in a 37 °C water bath for 60 min. Samples were shaken every 20 min during this time. At the completion of the incubation, samples were washed with FACS buffer to remove the collagenase and then passed through an 18-gauge needle followed by a 21-gauge needle to create a single-cell suspension. Phagocytes were then enriched from samples by using a 1.065 g ml−1 OptiPrep (Sigma) density gradient according to the manufacturer’s protocol. Following centrifugation, phagocytes were isolated from both low- and mid-density bands and finally re-suspended in FACS buffer for flow cytometric analyses.
Flow cytometric analyses
Mouse spleen was digested in parallel with small intestine samples and used for single-colour compensation controls. All samples were pretreated with Fc block for 10 min at 4 °C followed by fluorescently conjugated antibody labelling at 4 °C for 60 min. The following antibodies were used for these studies: Antibodies from BioLegend including Alexa Fluor 647- or 700-conjugated anti-CD11c (clone N418), PerCP/Cy5.5-conjugated anti-CD24 (clone M1/69), APC/Cy7-conjugated anti-CD45 (clone 30-F11), APC-conjugated anti-CD64 (clone X54-5/7.1), APC-conjugated anti-CD274 (clone 10F.9G2), PerCP/Cy5.5-conjugated anti-F4/80 (clone BM8), Alexa Fluor 700-conjugated anti-Ly-6c (clone HK1.4), and Phycoerythrin (PE) or Brilliant Violet 421-conjugated anti-MHCII I-A/I-E (clone M5/114.15.2); antibodies from eBioscience including FITC-conjugated anti-CD4 (clone RM4-5), PE/Cy7-conjugated anti-CD11b (clone M1/70) and PE-conjugated anti-CD103 (clone 2E7); and TxRed-conjugated anti-CD45 (clone 30-F11) from Invitrogen. Live/Dead Aqua (Life Technologies) was used to discriminate viable cells.
Identification of SILP phagocytes bearing apoptotic IECs
Phagocytes isolated from the SILP were surface stained for: APC/Cy7-conjugated anti-CD45, Alexa Fluor 700-conjugated anti-CD11c, Brilliant Violet 421-conjugated anti-MHCII I-A/I-E, PE/Cy7-conjugated anti-CD11b, PE-conjugated anti-CD103, PerCP/Cy5.5-conjugated anti-CD24, and APC-conjugated anti-CD64. The identification of phagocytes from VDTR mice with IEC cargo was determined by the presence of eGFP and this gate was defined on the basis of C57BL/6J and VDTR− littermate controls that were eGFP−. Sample acquisition was performed using the LSRFortessa (BD Biosciences) and data analyses were performed using the FlowJo analytical software (Tree Star).
Cell sorting
To sort phagocytes with and without apoptotic IEC cargo, the following surface markers were used: APC/Cy7-conjugated anti-CD45, Alexa Fluor 700-conjugated anti-CD11c, Brilliant Violet 421-conjugated anti-MHCII I-A/I-E, PE/Cy7-conjugated anti-CD11b, PE-conjugated anti-CD103, PerCP/Cy5.5-conjugated anti-CD24, and APC-conjugated anti-CD64. The identification of phagocytes from VDTR mice with IEC cargo was determined by the presence of eGFP and this gate was defined on the basis of C57BL/6J and VDTR− littermate controls that were eGFP−. Sorted populations were live, CD45+MHCII+CD11c+ phagocytes that were either eGFP− or eGFP+ including (i) CD103+CD11b−CD24+CD64− (hereafter CD103), (ii) CD103+CD11b+ CD24−CD64+ (hereafter CD103 CD11b), and (iii) CD103−CD11b+CD24− CD64+ (hereafter CD11b) for a total of six populations. Owing to the four-sample sort-maximum of the instrument, the three eGFP+ populations were collected first and then fresh collection tubes were added for the three eGFP− populations. Cells were sorted directly into 0.5 ml TRIzol LS reagent (Life Technologies) for microarray processing (see below). Each sort was performed at 4 h following diphtheria toxin administration and consisted of 3–4 pooled VDTR mice. The following are the cell yield ranges for each subset: 1,000–5,000 eGFP+CD103+; 3,000–9,000 eGFP+CD103+CD11b+; 10,000–40,000 eGFP+CD11b+; 4,500–10,000 eGFP−CD103+; 40,000–80,000 eGFP−CD103+CD11b+; and 30,000–100,000 eGFP−CD11b+. FACS was conducted on the FACSAria IIu SORP (BD Biosciences). The following are the RNA yield ranges for each subset: 200–2,400 pg eGFP+CD103+; 200–3,000 pg eGFP+CD103+CD11b+; 600–3,000 pg eGFP+CD11b+; 200–4,600 pg eGFP−CD103+; 600–5000 pg eGFP−CD103+CD11b+; and 450–4,000 pg eGFP−CD11b+. The purity and identity of each subset was validated as indicated in Extended data Fig. 5 and according to markers as previously reported31.
Image Stream
For analysis of IEC engulfment by CD11c+ phagocytes, single-cell suspensions were prepared as described for flow cytometric analyses and acquired using the IS 100 Imaging flow cytometer (Amnis Corp). Phagocytes with eGFP+ cargo were identified as those that contained single nuclei and were CD45+, CD11c+ and MHCII+. Data were analysed using IDEAS software (Amnis Corp) and spectrally compensated using a compensation matrix generated from the following single-colour controls; FITC-conjugated CD4, PE-conjugated MHCII, Alexa Fluor647-conjugated CD11c, TxRed-conjugated CD45, and Hoechst stain.
Real-time qRT–PCR
Total RNA was isolated from mouse small intestine using RNeasy mini-kit (Qiagen) and quantified by a spectrophotometer. Reverse transcription was performed with Superscript III (Invitrogen) and cDNA was synthesized using the Mastercycler ep (Eppendorf). Real-time quantitative RT–PCR was conducted in duplicate on a ViiA 7 Real-time PCR System (Life Technologies) using TaqMan quantitative PCR Master Mix at a concentration of 1× (Applied Biosystems) or SYBR Green Real-Time PCR Master Mixes for the eGFP and HBEGF (‘DTR’) transgenes. Samples were normalized to β-actin and relative expression was determined by 2-ΔΔCt method. Forward (FW) and reverse (RV) primers for SYBR Green include:
5′-AGCAAAGACCCCAACGAGAA-3′ eGFP FW, 5′-GGCGGCGGTC ACGAA-3′ eGFP RV; 5′-CACTTTATCCTCCAAGCCACAAG-3′ Hbegf FW, 5′-CTTTTCCCGTGCTCCTCCTT-3′ Hbegf RV.
All probe sequences are in the format: 5′ FAM-sequence-BHQ-1 3′ and together with forward (FW) and reverse (RV) primer pairs were synthesized by Biosearch Technologies. 5′-AGCCACCCCCACTCCTAAGAGGAGG-3′ Actb probe, 5′-GAAGTCCCTCACCCTCCCAA-3′ Actb FW, 5′-GGCATGGACGCGACCA-3′ Actb RV; 5′-AAATCGGTGATCCAGGGATTGTTCCA-3′ Acadsb probe, 5′-CCTCTGGTTTCCTCTATGGATGA-3′, Acadsb FW, 5′-TCCCT CCATATTGTGCTTCAAC-3′ Acadsb RV; 5′-CGGGACAGGGCAA CTCTTGCAA-3′ Aldh1a2 probe, 5′-GCTTGCAGACTTGGTGGAA-3′ Aldh1a2 FW, 5′-GCTTGCAGGAATGGCTTACC-3′ Aldh1a2 RV; 5′-CCCA CTTTCCTTGTGGTACTCTGGAC-3′ Alox5ap probe, 5′-CAACCAGA ACTGCGTAGATGC-3′ Alox5ap FW, 5′-GAAGGCGGCAGGGACTTG-3′ Alox5ap RV; 5′-TGCCTTTAGTGGCCTCATTGTTCC-3′ Atrn probe, 5′-GGACTCAA TCTACGCACCTCTGAT-3′ Atrn FW, 5′-GCCGTCTCATTGCCATCTCTT-3′ Atrn RV; 5′-TTGGCATCAATCTGAGCTGTTGGTG-3′ Axl probe, 5′-GCCCATCAACTTCGGAAGAAAG-3′ Axl FW, 5′-CCTCTGGC ACCTGTGATATTCC-3′ Axl RV; 5′-AGTGAAGGAGTTCTTCTGGACCTCAA-3′ Ccl22 probe, 5′-CACCCTCTGCCATCACGTT-3′ Ccl22 FW, 5′-ATCT CGGTTCTTGACGGTTATCA-3′ Ccl22 RV; 5′-CCACTGCTCATGGATATGT TGAACAATAGAGACC-3′ Ccr2 probe, 5′-AGGGTCACAGGATTAGG AAGGTT-3′ Ccr2 FW, 5′-CGTTCTGGGCACCTGATTTAA-3′ Ccr2 RV; 5′-CAG TGCCCAAGTGGAGGCCTTGATC-3′ Ccr7 probe, 5′-CACGCTG AGATGCTCACTGG-3′ Ccr7 FW, 5′-ATCTGGGCCACTTGGATGG-3′ Ccr7 RV; 5′-AGATTCGCTGTCACCAGCACAGACA-3′ Cd40 probe, 5′-TC TCAGCCCAGTGGAACA-3′ Cd40 FW, 5′-CGGTGCCCTCCTTCTTAACC-3′ Cd40 RV; 5′-CGAATCACGCTGAAAGTCAATGCCC-3′ Cd274 probe, 5′-CG GTGGTGCGGACTACAAG-3′ Cd274 FW, 5′-CCCTCGGCCTG ACATATTAGTTC-3′ Cd274 RV; 5′-TTCCCAGGGCTTGAGGCTCCC-3′ Cd300a probe, 5′-GGCCACCGTGAACATGACTA-3′ Cd300a FW, 5′-GCAG GAGAGCTAACACAGACAAC-3′ Cd300a RV; 5′-ATGGAAAATGG GTGGCGTCTAACCCA-3′ Cfh probe, 5′-CCGAACACTTGGCACTATTGTAA-3′ Cfh FW, 5′-CTCCGGGATGCCCACAAG-3′ Cfh RV; 5′-CCCTGAAC AACCAACAGATGACACTGG-3′ Elf3 probe, 5′-GGCACTGAAGAC TTGGTGTTG-3′ Elf3 FW, 5′-CCCTGAACAACCAACAGATGACACTGG-3′ Elf3 RV; 5′-AGCTGACAGATACACTCCAAGCGGA-3′ Fos probe, 5′-AG TGCCGGAATCGGAGGA-3′ Fos FW, 5′-TGCAACGCAGACTTCTCATC-3′ Fos RV; 5′-CTGCTCCTGCTGGCT TCCGAGT-3′ Gas6 probe, 5′-CTGGGCACTGCGCTTCTG-3′ Gas6 FW, 5′-CGCAACAGCACAGTGTGA-3′ Gas6 RV; 5′-TCTTATGCAGACTGTGTCCTGGCA-3′ Ido1 probe, 5′-GGGCC TGCCTCCTATTCTG-3′ Ido1 FW, 5′-CCCACCAGGAAATGAGAACAGA-3′ Ido1 RV; 5′-TCACAAGCAGAGCACAAGCCTGTC-3′ Il1b probe, 5′-AAAGAC GGCACACCCACCCTGC-3′ Il1b FW, 5′-TGTCCTGACCACTG TTGTTTCCCAG-3′ Il1b RV; 5′-TCTGCAAGAGACTTCCATCCAGTTGCCT-3′ Il6 probe, 5′-CCAGAAACCGCTATGAAGTTCC-3′ Il6 FW, 5′-TCACCA GCATCAGTCCCAAG-3′ Il6 RV; 5′-TTCAAACAAAGGACCAGCTGGACA-3′ Il10 probe, 5′-TCAGCCAGGTGAAGACTTTC-3′ Il10 FW, 5′-GGCAA CCCAAGTAACCCTTA-3′ Il10 RV; 5′-TAACTGGGATCCAGGCACGCC-3′ Ly75 probe, 5′-GTCAGACTTCAGGCCACTCAA-3′ Ly75 FW, 5′-TGACCCA CCAATCACAGGT-3′ Ly75 RV; 5′-TCCCTTACTTTATTAAGCAG CCTGAGAGTG-3′ Mertk probe, 5′-TGATCCCATATACGTGGAAGTTCA-3′ Mertk FW, 5′-CCTGGCAGGTGAGGTTGAAG-3′ Mertk RV; 5′-TTTGC GTCTGACTGCCGAGACTC-3′ Muc2 prob e, 5′-CCTGGCCT CTGTGATTACAAC-3′ Muc2 FW, 5′-GGTGCACAGCAAATTCCTTGTAG-3′ Muc2 RV; 5′-TCGCAACCAGATCGGAGATGTGG-3′ Nlrc5 probe, 5′-CCA GAACTCAGGAAATTTGACTTGA-3′ Nlrc5 FW, 5′-TTTGGCAAGA TGGCAGCTAA-3′ Nlrc5 RV; 5′-CTGCTGCCTCACTTCTAGCTTCTGC-3′ Nlrp3 probe, 5′-GTTGCCTGTTCTTCCAGACT-3′ Nlrp3 FW, 5′-GGC TCCGGTTGGTGCTTAG-3′ Nlrp3 RV; 5′-TAGGCTGCTTTGGGAA TGGCACC-3′ Oasl1 probe, 5′-CGCGTGCTCAAGGTACTCAAG-3′ Oasl1 FW, 5′-GACCAGCTCCACGTCTGTAG-3′ Oasl1 RV; 5′-TTGTGATGACTACATG GTCACACTCTTC-3′ Plac8 probe, 5′-GAACCCGATACGGCATTCCT-3′ Plac8 FW, 5′-TCTTGCCATCCAGCTCCTTAG-3′ Plac8 RV; 5-ACCAACACATCG ′ GAGCTGCGGA-3′ Relb probe, 5′-GAGCCTGTCTACGACAAGAAGTC-3′ Relb FW, 5′-GCCCGCTCTCCTTGTTGATTC-3′ Relb RV; 5′-AGTTATGCACGAGT GCGAGCTGT-3′ Spred1 probe, 5′-CGGCGACTTCTGACAACGATA-3′ Spred1 FW, 5′-GGTAGCCATCCACCACTTGAG-3′ Spred1 RV; 5′-AGAGGTC ACCCGCGTGCTAATGGTG-3′ Tgfb1 probe, 5′-CCCGAAGCGGACT ACTATGC-3′ Tgfb1 FW, 5′-ATAGATGGCGTTGTTGCGGT-3′ Tgfb1 RV; 5′-CTCTGCCTGCATCCAATCACTCTCA-3′ Timd4 probe, 5′-GGTCCG CCTTCACTACAGAATC-3′ Timd4 FW, 5′-GGCCTGAGTACGGCTATGTC-3′ Timd4 RV; 5′-TGGGCTTTCCGAATTCACTGGAGC-3′ Tnf probe, 5′-ATGC ACCACCATCAAGGACTCAA-3′ Tnf FW, 5′-ACCACTCTCCCT TTGCAGAACTC-3′ Tnf RV; 5′-TCAACTGGTGTCGTGAAGTCAGGA-3′ Tnfaip3 probe, 5′-TCCCTGGAAAGCCAGAAGAAG-3′ Tnfaip3 FW, 5′-GA GGCAGTTTCCATCACCATTG-3′ Tnfaip3 RV; 5′-TCCGGAGCTAC TTCAAGCAAGGC-3′ Vil1 probe, 5′-GGCAACGAGAGCGAGACTT-3′ Vil1 FW, 5′-CGCTGGACATCACAGGAGTT-3′ Vil1 RW.
cDNA Microarrays
A total of five sorting experiments with a pool of 3–4 mice were performed for the cDNA microarrays. Following cell sorting into TRIzol LS reagent, samples were shipped on dry ice to the Center for Functional Genomics and the Microarray & HT Sequencing Core Facility at the University at Albany (Rensselaer). A sample clean-up step was performed using RNeasy columns (Qiagen) that included DNase treatment. The isolated RNA was checked for quality using NanoDrop (Thermo Scientific) and Bioanalyzer (Agilent), following which 1 ng of total RNA was processed using WT-Ovation Pico RNA Amplification System (NuGEN). A total of three biological replicates were used for the microarray. When required, RNA was pooled from additional sorts to achieve the 1 ng of total RNA needed for the amplification system. The following are the sort experiments used for each sample: (2, 2 and 5, 2 and 5) eGFP+CD103+; (2, 3, 2 and 5) eGFP+CD103+CD11b+; (2, 4, 5) eGFP+CD11b+; (3, 2 and 4 and 5, 2 and 4 and 5) eGFP−CD103+; (2, 3, 4) eGFP−CD103+CD11b+; and (2, 3, 5) eGFP−CD11b+. RNA was reverse-transcribed and sense-target cDNAs were targeted using the standard NuGEN protocol and hybridized to Affymetrix mouse Gene 2.0 ST arrays. These arrays were then washed, stained on a FS 450 station, and scanned on a GeneChip 3000 7G scanner using Affymetric GeneChip Command Console Software (AGCC). The Affymetrix microarray data discussed in this publication have been deposited in NCBI’s Gene Expression Omnibus (GEO)32 and are accessible with the GEO series accession number GSE85682.
Code availability
Fold changes and statistical significance were identified as those genes that were differentially expressed between eGFP+ and eGFP− subsets by at least 1.2 fold (ANOVA (Benjamini–Hochberg false discovery rate correction Q < 0.05) and Tukey’s HSD post-hoc test (P <0.05; -1.2> fold >1.2) and determined using R software (version 3.2.0). Hierarchical clustering of differentially expressed genes meeting the aforementioned criteria were Z-scored and plotted with heatmap.2 (gplots version 2.17.0, CRAN/R). Principal component analyses of the 1,534 genes (ANOVA (Benjamini–Hochberg false discovery rate correction Q < 0.05); 4.8% of total) with the most variable expression in each CD11c+ subset with and without eGFP cargo were generated using R software which are freely available online.
Microscopy
Paraffin sections
Small and large intestine were dissected and fixed in 10% formalin (Fisher Scientific) for 24 h and then processed for paraffin embedding. Tissue blocks were then cut into 5-mm sections, de-paraffinized by xylene immersion, and hydrated by serial immersion in 100%, 90%, 80%, 70% ethanol and PBS. Antigen retrieval was performed by heating samples in a pressure cooker (Cuisinart) in citrate buffer solution (10 mM citric acid monohydrate, 0.05% Tween 20 and PBS). Sections were then washed twice in PBS, blocked for 30 min in blocking buffer (10% BSA, 0.3% Triton X-100 (Sigma) and TBS), and prepared for labelling. TdT-mediated dUTP nick end labelling (TUNEL) was performed using the in situ cell-death detection kit, TMR red (Roche), per the manufacturer’s instructions, stained with DAPI, and mounted using Fluoromount-G (Southern Biotech). For cleaved caspase-3 (Cell Signaling), samples were labelled for 60 min at room temperature, stained with DAPI, and mounted using Fluoromount-G. For paraffin images, eGFP signal was not present owing to sample quenching following paraffin embedding and processing.
Frozen sections
Small and large intestine were dissected and fixed overnight in 1.6% paraformaldehyde (Thermo Scientific) containing 20% sucrose at 4 °C. Samples were then placed in OCT (Tissue-Tek) and snap-frozen over dry ice. Tissue sections of 8-mm thickness were cut, air-dried and blocked using blocking solution. Tissues were then labelled using an Alexa Fluor 594-conjugated phalloidin (Invitrogen) or a primary mouse anti-mouse pan-cytokeratin antibody (clone PCK-26) (Abcam) for 60 min in a humidified atmosphere followed by a secondary goat anti-mouse Alexa Fluor 594 (Thermo Fisher Scientific) for 30 min, then stained with DAPI, and mounted using Fluoromount-G. For fluorescent in situ hybridization, small intestine and large intestine were dissected and prepared as described for frozen sections33. Following tissue blocking, sections were incubated with 0.45 pmol μl−1 eubacterial oligonucleotide probe (AminoC6 +Alexa Fluor 594) 5′-GCTGCCTCCCGTAGGAGT-3′; (Operon)33 in a pre-chilled hybridization buffer (Sigma) overnight at 4 °C. Sections were counterstained with DAPI and mounted with Fluoromount-G.
Whole-mount staining
To label small intestine tissues, the whole-mount histology protocol was modified from previously described methods34. In brief, small intestine samples were excised, opened longitudinally, and washed in ice-cold PBS. Samples were then cut to 1 cm in length and placed in 6-ml polypropylene tubes (BD Biosciences). Next, samples were incubated with Fc block at 10 μg ml−1 in 200 μl of 2% paraformaldehyde with 1% FBS, 0.3% Triton X-100 in PBS for 3 h at 4 °C with gentle rocking. After blocking and fixing, samples were put into new polypropylene tubes and labelled using 3 μg ml−1 of the following antibodies: PE-conjugated anti-CD11c (clone N418) (eBioscience), APC-conjugated anti-CD31 (clone 390) (eBioscience) and anti-cleaved caspase-3 at 1:100. All labelling was conducted in the dark at 4 °C with gentle rocking for 3 h. Finally, samples were washed for 30 min in the dark at 4 °C with fresh PBS and mounted for imaging.
Conventional microscopy was performed using the Eclipse Ni-E motorized upright microscope (Nikon) and images were acquired from paraffin, frozen, and whole mount tissue sections using a Nikon DS-Qi1 Mc camera. Cell quantification was calculated using NIS Elements imaging software (Nikon) and the object count application including intensity of stain thresholds and area restriction filters. Confocal microscopy was performed at the Microscope CORE at the Icahn School of Medicine at Mount Sinai using the Leica SP5 DM upright microscope and Leica LAS AF software.
In vitro T-cell differentiation
Naive mouse splenic CD4+ T cells were isolated by sorting with MACS CD4+ beads (Miltenyi Biotech) according to the manufacturer’s instructions and then by FACS using the FACSAria IIu SORP. T cells were sorted on the basis of the following criteria: live, CD45+CD3+CD4+ CD25−CD44−/lowCD62L+/high. Surface antibodies for sorting included: APC/Cy7-conjugated anti-CD45, eFluor 450-conjugated anti-CD3 (clone 145-2c11), PE-conjugated anti-CD4, APC-conjugated anti-CD25 (clone PC61.5), FITC-conjugated CD62L (clone MEL-14), and Alexa 700-conjugated anti-CD44 (clone IM7) (all eBiosciences). 1 ×10⁵ T cells were then cultured with 1 ×10⁴ eGFP+ or eGFP− CD103 dendritic cells sorted from the MLN which were identified as: live, CD45+MHCIIhiCD11c+, eGFP+ or eGFP−, CD103+CD11b− using the aforementioned antibodies for flow cytometry. These cells were cultured in round- bottom 96-well plates (Falcon) with complete IMDM (Gibco) supplemented with 10% FBS, 100 μg ml−1 penicillin, 100 μg ml−1 streptomycin, 2 mM -glutamine, 10 mM HEPES and 1 nM sodium pyruvate for 5 days. Additionally, all cultures were supplemented with 1 μg ml−1 of soluble anti-CD3 (clone 2C11) as well as 5 ng ml−1 of recombinant human anti-IL-2 (Pepro Tech) on days 2 and 4. A total of 2 ng ml−1 of recombinant human anti-TGFβ1 (clone 1D11 R&D systems) was added to culture wells where indicated on days 1 and 4. On day 5, cells were first surface stained with FITC-conjugated anti-CD25, PE/Cy7-conjugated anti-CD4, Alexa Fluor 700-conjugated anti-CD3, and APC/Cy7-conjugated anti-CD45, followed by fixation and permeabilization (using the concentrate and diluent provided by eBioscience), and finally intracellular staining for eFluor 450-conjugated anti-FOXP3 (clone FJK-16 s), PE-conjugated anti-RORγ(t) (clone B2D), PerCP-eFluor 710-conjugated anti-GATA-3 (clone TWAJ), and APC-conjugated anti-T-bet (clone eBio4B10) (all eBioscience).
Statistical analysis
Data are presented as mean ± s.e.m. Statistical significances were determined by a one-way ANOVA with Dunnett’s and Newman–Keuls post-tests or unpaired two-tailed t-test with Welch correction where specified. ***P <0.001, **P <0.01, *P < 0.05. NS, not statistically significant (P >0.05). No statistical methods were used to predetermine sample size. The experiments were not randomized and the investigators were not blinded to allocation during experiments and outcome assessment.
Data availability
The Affymetrix microarray data have been deposited in the NCBI Gene Expression Omnibus (GEO) under GEO series accession number GSE85682.
Extended Data
Extended Data Figure 1. No gross anatomical changes in the small or large intestine of VDTR mice.
a, The primate diphtheria toxin receptor (DTR)–eGFP transgene driven by the mouse villin promoter (mVillin). b, qRT–PCR for relative expression of primate diphtheria toxin receptor (HBEGF (‘DTR’)) mRNA in both the small and large intestine of four different DTR–eGFP transgenic (VDTR) founder lines. Founder 32p was selected to propagate the VDTR line on the basis of specific transgene expression in the intestinal tract and not in other organs. c, d, Haematoxylin and eosin staining (H&E) of small intestine and large intestine paraffin sections from treated VDTR (c) and untreated C57BL/6 (B6) and VDTR (d) as indicated. e–i, Immunofluorescence of small intestine (e, f, h) and large intestine (g, i) cryo-sections from indicated mice after staining with phalloidin or pan-cytokeratin and DAPI as indicated. j, TUNEL (eGFP-quenched after paraffin embedding). p(A), polyadenylation. Scale bars, 100 μm (c, d, j), 50 μm (e–i).
Extended Data Figure 2. The intestinal microenvironment does not become inflamed following 2 ng g−1 diphtheria toxin administration.
a, Haematoxylin and eosin stain of paraffin-embedded sections from small intestine of VDTR mice at 4 h following PBS or diphtheria toxin administration. b, Flow cytometry of SILP cells from VDTR mice treated with PBS or diphtheria toxin. Pre-gated on live CD45+MHCII+ cells. Numbers above gates indicate percentage of positively stained cells. Quantification is shown in bottom panels. IM, inflammatory monocytes. We noted no tissue destruction or discernible inflammation (a), nor infiltration of Ly6Chi monocytes35 (b) at 4 h with either dose of diphtheria toxin, in contrast to infiltration of these cells at 16 h following 10 ng g−1 diphtheria toxin. n = 9 mice for PBS, n = 6 mice for diphtheria toxin at 1–4 h, and n = 3 for PBS and diphtheria toxin at 16 h. One-way ANOVA; **P < 0.01; NS, not significant. Flow cytometry gates are representative of at least three independent experiments. Data are mean ±s.e.m. c, d, In situ hybridization with a eubacterial probe on large intestine cryo-sections following PBS or diphtheria toxin administration to VDTR mice (c), or 3% dextran sodium sulphate (DSS) treatment of B6 mice for 5 days (d). c, Arrowheads indicate presence of eubacterial probe in SILP. There was no bacterial translocation to the intestinal lamina propria at 4-h post-treatment with either 2 ng g−1 or 10 ng g−1 diphtheria toxin, as evidenced by luminal confinement of the in-situ-hybridized eubacterial probe signal, and similar to that in PBS-treated controls. e, Immunofluorescence on small-intestine paraffin sections stained with antibodies to CC3 at 4 h following PBS injection. f, Quantification from e and Fig. 1c. Scale bars, 100 μm (a, e), 25 μm (c, d).
Extended Data Figure 3. Ileum lamina propria CD11c+ phagocytes extend dendrites towards apoptotic intestinal epithelial cells.
a–h, Conventional (a–e) and confocal (f–h) whole-mount microscopy of excised ileum from B6 or VDTR mice following PBS or diphtheria toxin as indicated. b, c, e, eGFP not overlaid. Insets from f and h depicted in bottom and right panels, respectively, without eGFP overlay. L, lumen. Arrowhead in a points to a CC3+ IEC; in d, to a CD11c+ dendrite. Scale bars, 25 μm (a, e), 50 μm (b, d, h), 100 μm (c, f, g).
Extended Data Figure 4. Flow cytometry gating strategy for identifying CD11c+ and CD11c−/lo phagocytes in the SILP of VDTR mice.
a–e, g, Flow cytometric analyses of SILP cells from VDTR mice. Numbers indicate the percentage of gated populations. a, Gating strategy for total CD11c+ phagocytes. b, Identification of the eGFP+ gate on the basis of the small intestine cellular profile from B6 (eGFP−) mice. c, CD103 and CD11b expression on gated cells in b. d, Monocytes pre-gated on live CD45+CD11cloMHCIIhiCD11b+Ly6Chi cells. e, Granulocytes pre-gated on live CD45+CD11c−MHCII−CD11b+Ly6Chi cells. f, Percentage of cells and absolute numbers from b. g, Dendritic cells and macrophages pre-gated on live CD45+MHCIIhiCD11c+ cells, further identified as CD64− and CD64+, respectively. Gating on differential CD64 expression, followed by delineation of CD103 and CD11b expression, also distinguished two macrophage and three dendritic cell populations5. Data represent at least three independent experiments and in f, n = 3 B6 mice; n = 6 VDTR mice treated with 2 ng g−1 diphtheria toxin for 1–4 h; n = 9 VDTR mice treated with PBS; one-way ANOVA; *P < 0.05. Data are mean ±s.e.m. h, Schematic of SILP phagocytes that sample apoptotic IECs (green).
Extended Data Figure 5. eGFP+ and eGFP−CD11c+ phagocyte populations exhibit distinct transcriptional profiles.
a, FACS-sorted dendritic cell and macrophage populations from the SILP of VDTR mice at 4 h following diphtheria toxin administration using the gating strategy described in Fig. 2f, which included CD24 and CD64. b, Principal Component Analysis (PCA) of the 1,534 genes (ANOVA Q <0.05; 4.8% of total) with most variable expression in dendritic cell and macrophage (Mϕ) subsets, with (eGFP+) or without (eGFP−) apoptotic IEC cargo. PCA-separated macrophages from dendritic cells (left panel) and eGFP+ from eGFP− (right panel). We confirmed the purity and identity of sorted phagocytes on the basis of relative expression of genes encoding the molecules used for FACS sorting, as well as macrophage and dendritic-cell-specific genes. c–g, Signal intensity of genes encoding MHCII (H2-Ab1) and CD11c (Itgax), shared by both dendritic cells and macrophages, the macrophage-specific Csf1 receptor (Csf1r), and the dendritic-cell-specific kinase Flt3 (Flt3) in CD11c+ phagocytes31 (c); molecules used for FACS sorting (d); macrophage markers (e); dendritic cell markers (f); and IEC markers from analyses of microarray experiments (g). It should be noted that IEC-specific genes were not increased in eGFP+ compared to eGFP− phagocytes indicating negligible contamination by IEC-specific transcripts. Data represent five independent experiments with four mice per experiment and three biological replicates. White and black bars indicate expression from eGFP− and eGFP+ phagocytes, respectively. h, Validation by qRT–PCR for IEC-specific genes including Muc2 (mucin-2) and Elf3 (E74-like factor 3), which were not expressed by phagocytes but readily detectable in sorted IECs. Conversely, phagocyte-specific transcripts (Aldh1a2, Siglec1 and Timd4)31 were expressed in sorted phagocytes but not in IECs. Data represent two independent experiments depicting relative expression (log2). i, qRT–PCR quantification of relative eGFP expression and the primate diphtheria toxin receptor (HBEGF or ‘DTR’) from VDTR IECs, spleen cells, and eGFP− and eGFP+ phagocytes. As expected, expression of the eGFP and DTR (HBEGF) transgenes were confined to IECs in VDTR mice and not present in sorted dendritic cell or macrophages. Data represent two independent experiments depicting fold change over C57BL/6J litter mate controls. j, qRT–PCR relative expression (log2) of inflammatory transcripts from indicated eGFP− SILP macrophages over time. The unchanged expression of Il1b, Il6, and Tnf in eGFP−CD11b+ and CD103+CD11b+ macrophages, which served as sentinels of the microenvironment, provided further evidence for lack of inflammation induction by low-dose 2 ng g−1 diphtheria toxin. Note that the unique transcriptional profiles of eGFP+ phagocytes may belong to pre-existing subpopulations that become detectable only when marked by eGFP, owing to an inherently superior capacity for apoptotic cell sampling. However, we consider it more likely that the differential gene expression patterns between eGFP+ and eGFP− populations are a consequence of apoptotic IEC internalization. Data represent three independent analytical repeats and one biological replicate consisting of three mice per time point. Data are mean ±s.e.m.
Extended Data Figure 6. Further validation of the differential gene expression profiles following apoptotic IEC sampling.
a, Flow cytometry validation for MER and CD205 (Ly75) protein upregulation either in the steady state or 4 h after diphtheria toxin administration, reflecting transcript data shown in Fig. 3d. Flow cytometry representative of at least three independent experiments. b, g, Hierarchical clustering of differentially expressed ‘find me/eat me’ receptor (b) and ‘suppression of immune response’ (g) genes at 4 h after diphtheria toxin administration. Differences in expression did (g) and did not (b) meet statistical significance of at least 1.2-fold (ANOVA (Q < 0.05) and Tukey’s HSD post-hoc test (P <0.05); −1.2> fold > 1.2) comparing eGFP+ and eGFP− phagocytes at 4 h following diphtheria toxin administration; expressed by row Z scale and relative expression (log2). In b, upregulated genes correlating with eGFP content included Cx3cr1 (the receptor for the ‘find me’ signal fractalkine) and TAM family receptor Axl by CD11b+ macrophages, as well as Tyro3 by CD103+ dendritic cells. Different members of the Stabilin family of scavenger receptors, Adgrb1, Stab1/2, required for apoptotic cell clearance1, as well as Timd4, which binds to exposed phosphatidylserine, were differentially expressed by macrophages and CD103+ dendritic cells. Data represent five independent experiments with four mice per experiment and three biological replicates. Many genes in b and g remained differentially regulated at 6 h after diphtheria toxin administration (see d and e), showing a stable profile not unique to the 4-h time point. c, qRT–PCR validation for Axl and Timd4 in SILP phagocytes at 4 h after diphtheria toxin administration. d, e, qRT–PCR quantification of relative gene expression in the indicated eGFP− and eGFP+ populations (log2). CD11b+ macrophages (d) and CD103+ dendritic cells (e) from the SILP at 6 h following diphtheria toxin administration. Expression of Ccr7, encoding the chemotactic receptor required for migration into mesenteric lymph nodes where priming of naive T cells occurs, was higher in SILP eGFP+CD103+ dendritic cells, but not macrophages, relative to their eGFP− counterparts (Extended data Fig. 8c), and remained high in eGFP+CD103+ dendritic cells at 6 h after diphtheria toxin administration (e) compared to the downregulation by eGFP+ cells relative to eGFP−CD11b+ macrophages (d). Data represent two independent analytical repeats and one biological replicate consisting of three mice. f, Signal intensity of Cd300a, encoding an inhibitory receptor reported to bind apoptotic cell-exposed phosphatidylserine and suppress commensal-driven IFNβ production by large intestine lamina propria CD103−CD11b+CX3CR1+F4/80lo–int cells3, from microarray analyses conducted at 4 h after diphtheria toxin administration, showing similar levels in SILP eGFP+ and eGFP− macrophages and CD103+ dendritic cells indicated on the x axis. Data did not meet statistical significance of at least 1.2-fold (ANOVA (Q < 0.05) and Tukey’s HSD post-hoc test (P <0.05); −1.2> fold > 1.2) and represent five independent experiments with 4 mice per experiment and three biological replicates. Data are mean ± s.e.m. White and black bar graphs indicate expression from eGFP− and eGFP+ phagocytes, respectively. h, i, Microarray validation by duplicate qRT–PCR for indicated genes represent three independent experiments.
Extended Data Figure 7. Inflammatory cytokine and co-stimulatory genes in CD11c+ phagocytes are unchanged and decreased at 4 h and 6 h, respectively, following sampling of apoptotic IECs.
Signal intensity of genes encoding inflammatory cytokines (a), and co-stimulatory molecules (b), from microarray analyses conducted 4 h after diphtheria toxin administration on the SILP phagocyte populations indicated on the x axes where CD103CD11b and CD11b denote CD103+CD11b+ and CD11b+ macrophages, and CD103 denotes CD103+ dendritic cells. White and black bar graphs indicate expression from eGFP− and eGFP+ phagocytes, respectively. No statistically significant changes were observed as genes did not meet statistical significance of at least 1.2 fold (ANOVA (Q < 0.05) and Tukey’s HSD post-hoc test (P <0.05); −1.2> fold >1.2). Data represent five independent experiments with four mice per experiment and three biological replicates. c, d, qRT–PCR quantification of Il1b and Il6 transcripts expressed by eGFP+ and eGFP−CD11b+ macrophages (c) and CD103+ dendritic cells (d) from the SILP at 6 h after diphtheria toxin administration. Data represent three independent analytical repeats and one biological replicate consisting of three mice.
Extended Data Figure 8. Resident phagocytes in the mesenteric lymph node do not carry eGFP+ apoptotic IEC cargo.
a, Duplicate qRT–PCR quantification of Aldh1a2 transcript levels. b, Flow cytometry validation for CD274 protein expression at steady state or at 4 h after diphtheria toxin administration reflecting transcript data shown in Fig. 4a. Data represent at least three independent experiments. c, l, Signal intensity of Ccr7 (c) and Tgfb1 (l) from microarray analyses. Expression of Ccr7 was higher in SILP eGFP+CD103+ dendritic cells but not macrophages, relative to their eGFP− counterparts. Although Ccr7 transcripts showed a higher expression trend in CD103+ dendritic cells, relative expression of Ccr7 and Tgfb1 did not meet statistical significance of at least 1.2-fold (ANOVA (Q < 0.05) and Tukey’s HSD post-hoc test (P <0.05); −1.2 >fold > 1.2). Data represent five independent experiments with four mice per experiment and three biological replicates. d–g, Flow cytometric analyses of MLN cells from naive, untreated B6 and VDTR mice. d, e, ‘Migratory’ cells were pre-gated on live CD45+MHCIIhiCD11c+ cells. Quantification in right (d) and bottom (e) panels. f, ‘Resident’ cells were pre-gated on live CD45+MHCII+CD11c+ cells and these cells were eGFP−. n = 3 mice per experiment, n = 6 mice per group; unpaired two-tailed t-test with Welch’s correction; ***P <0.001. e, g, eGFP− and eGFP+ cells from d were further sorted on the basis of CD64, CD24, CD103 and CD11b expression. e, CD24+CD103+ dendritic cells from B6 control mice did not contain the eGFP label. g, The minor populations (~2%) of CD64+CD103+CD11b+ and CD64+CD11b+ macrophages within the migratory gate5 were also eGFP−. Data in e, g, represent three independent experiments. h–k, Flow cytometry analyses of migratory eGFP− and eGFP+ phagocytes in the MLN over time following a single injection of diphtheria toxin. Increasing the number of apoptotic IECs with diphtheria toxin treatment did not lead to a statistically significant increase in the frequency or absolute number of the indicated macrophage populations (h and i, respectively) or eGFP+CD103+ dendritic cells (j and k, respectively) over time within migratory MLN cells. This was expected given the non-inflammatory nature of the low dose diphtheria toxin and the small number (~0.5–2 ×10⁴) of total CD103+ dendritic cell within the SILP, of which an even smaller fraction (~10%) are eGFP+ (Fig. 2d). Data represent four independent experiments with 4 mice per time point. Data mean ±s.e.m. m, qRT–PCR for Tgfb1 from indicated cell populations. Data represent three independent analytical repeats and one biological replicate consisting of 3 mice. n, Flow cytometry for surface CD40 expression on migratory eGFP+ and eGFP− MLN CD103+ dendritic cells from untreated VDTR mice representative of four independent experiments.
Extended Data Figure 9. Naive CD4+ T cells co-cultured with eGFP+ or eGFP−CD103 dendritic cells from MLN do not differentiate into T-bet+, GATA-3+, or RORγt+ cells.
a, b, d, Flow cytometric analyses of VDTR MLN. a, b, Gating strategy for total CD45+CD3+CD4+ T cells. b, T cells pre-gated as in a from non-treated and 3 days post-diphtheria-toxin-treated VDTR mice. Peripherally induced Treg were identified as FOXP3+Helios− cells. c, Flow cytometric analyses of splenic CD4+ T cells cultured ex vivo at 1 ×10⁵ after enrichment of naive CD4+ T cells, for 5 days with FACS-sorted 1 ×10⁴ eGFP+ or eGFP−CD103+ MLN dendritic cells. Data represent two independent experiments. d, MLN CD4+ T cells from non-treated and day 3 post-diphtheria-toxin-treated VDTR mice. T-bet, GATA-3 and RORγt, characteristic of TH1, TH2 and TH17 cells, respectively, were not present in ex vivo co-cultures (c) or in the MLN of diphtheria-toxin-treated mice (d). At least three independent experiments were performed for flow cytometry studies. Numbers in plots indicate the percentage of positively stained cells within each gate.
Extended Data Figure 10. Inflammation does not alter the population of phagocytes that traffics apoptotic IEC cargo to MLN, but does alter its gene expression.
B6 and VDTR mice for 5 days received drinking water supplemented with 3% DSS (yellow highlight in b, d). On day 5, DSS treatment was stopped and replaced with fresh drinking water. a, c, Paraffin haematoxylin and eosin sections from the large intestine (a), and small intestine (c) of indicated mice. Scale bars, 100 μm. b, Change in weight shown on the y axis monitored daily as shown on the x axis. DSS treatment of VDTR mice (green line) was accompanied by weight loss similar to that observed in B6 mice (black line), with minimal damage to the terminal ileum, as expected. n = 4 mice per group. d, f, qRT–PCR for indicated transcripts expressed by migratory eGFP+CD103+ MLN dendritic cells from untreated and day 5 DSS-treated VDTR mice (d), and eGFP− and eGFP+CD103+ MLN dendritic cell isolated from day 5 DSS treated VDTR mice (f). #, not detected. Data represent three independent analytical repeats and one biological replicate consisting of two mice. e, Flow cytometry analyses of MLN migratory cells from day-5 DSS-treated and non-DSS-treated mice. Data represent two independent experiments consisting of two mice. Numbers near gates indicate the percentage of positively stained cells.
Supplementary Material
Acknowledgments
We are grateful to S. V. Chittur and M. Kuentzel, SUNY at the Albany Center for Functional Genomics. We thank M. Bogunovic at Pennsylvania State University, S. Jung at the Weizmann Institute of Science, Blander Laboratory members, J. Ochando and C. Bare at the Icahn School of Medicine Flow Cytometry Core, and M. A. Blander and S. J. Blander for discussions, help, and support. This work was supported by institutional seed funds to J.M.B. J.M.B. and her laboratory were supported by NIH grants AI095245, AI123284, DK072201, the Burroughs Wellcome Fund, and the Leukemia and Lymphoma Society. R.J.C. was supported by NIH training grants 2T32A1007605-11 and 5T32DK007792-12. G.Ba. was supported by the Crohn’s and Colitis Foundation of America (CCFA) Research Fellowship Award. B.M.H: NIAID contract HHSN272201000054C and U19 AI117873. J.C.: R01 DK092235, U01 DK62429, U01 DK062422, philanthropic SUCCESS, Sanford J. Grossman Charitable Trust. S.A.L. and G.C.F.: NIH 5P01DK072201-09 and 5R01CA161373-04, CCFA 330239, and SUCCESS. G.Bo.: Jenna and Paul Segal grant.
Footnotes
Supplementary Information is available in the online version of the paper.
Author Contributions R.J.C. and J.M.B: designed the study and wrote the manuscript. R.J.C. conducted most experiments; G.Ba. performed the initial set-up, protocol optimization and provided sorting expertise; L.M. performed initial VDTR characterizations; G.Bo. provided microarray and statistical analysis expertise; B.M.H. performed ImageStream acquisition and analyses; J.C. and K.G. performed IBD GWAS data comparison with differentially expressed phagocyte genes; G.C.F. and S.A.L.: VDTR strain derivation and data discussions. J.M.B. conceived the study.
The authors declare no competing financial interests.
Readers are welcome to comment on the online version of the paper.
References
- 1.Poon IK, Lucas CD, Rossi AG, Ravichandran KS. Apoptotic cell clearance: basic biology and therapeutic potential. Nat Rev Immunol. 2014;14:166–180. doi: 10.1038/nri3607. [DOI] [PMC free article] [PubMed] [Google Scholar]
- 2.Green DR, Ferguson T, Zitvogel L, Kroemer G. Immunogenic and tolerogenic cell death. Nat Rev Immunol. 2009;9:353–363. doi: 10.1038/nri2545. [DOI] [PMC free article] [PubMed] [Google Scholar]
- 3.Blander JM. Death in the intestinal epithelium—basic biology and implications for inflammatory bowel disease. FEBS J. 2016;283:2720–2730. doi: 10.1111/febs.13771. [DOI] [PMC free article] [PubMed] [Google Scholar]
- 4.Eisenhoffer GT, et al. Crowding induces live cell extrusion to maintain homeostatic cell numbers in epithelia. Nature. 2012;484:546–549. doi: 10.1038/nature10999. [DOI] [PMC free article] [PubMed] [Google Scholar]
- 5.Bekiaris V, Persson EK, Agace WW. Intestinal dendritic cells in the regulation of mucosal immunity. Immunol Rev. 2014;260:86–101. doi: 10.1111/imr.12194. [DOI] [PubMed] [Google Scholar]
- 6.Gross M, Salame TM, Jung S. Guardians of the gut – murine intestinal macrophages and dendritic cells. Front Immunol. 2015;6:254. doi: 10.3389/fimmu.2015.00254. [DOI] [PMC free article] [PubMed] [Google Scholar]
- 7.Khor B, Gardet A, Xavier RJ. Genetics and pathogenesis of inflammatory bowel disease. Nature. 2011;474:307–317. doi: 10.1038/nature10209. [DOI] [PMC free article] [PubMed] [Google Scholar]
- 8.Schlitzer A, et al. IRF4 transcription factor-dependent CD11b+ dendritic cells in human and mouse control mucosal IL-17 cytokine responses. Immunity. 2013;38:970–983. doi: 10.1016/j.immuni.2013.04.011. [DOI] [PMC free article] [PubMed] [Google Scholar]
- 9.Shrimpton RE, et al. CD205 (DEC-205): a recognition receptor for apoptotic and necrotic self. Mol Immunol. 2009;46:1229–1239. doi: 10.1016/j.molimm.2008.11.016. [DOI] [PMC free article] [PubMed] [Google Scholar]
- 10.Kim GH, Dayam RM, Prashar A, Terebiznik M, Botelho RJ. PIKfyve inhibition interferes with phagosome and endosome maturation in macrophages. Traffic. 2014;15:1143–1163. doi: 10.1111/tra.12199. [DOI] [PubMed] [Google Scholar]
- 11.Fang WF, et al. 5-Lipoxygenase activating protein (FLAP) dependent leukotriene biosynthesis inhibition (MK591) attenuates Lipid A endotoxin-induced inflammation. PLoS One. 2014;9:e102622. doi: 10.1371/journal.pone.0102622. [DOI] [PMC free article] [PubMed] [Google Scholar]
- 12.Blander JM. A long-awaited merger of the pathways mediating host defence and programmed cell death. Nat Rev Immunol. 2014;14:601–618. doi: 10.1038/nri3720. [DOI] [PubMed] [Google Scholar]
- 13.Arbore G, Kemper C. A novel “complement–metabolism–inflammasome axis” as a key regulator of immune cell effector function. Eur J Immunol. 2016;46:1563–1573. doi: 10.1002/eji.201546131. [DOI] [PMC free article] [PubMed] [Google Scholar]
- 14.Hu H, Sun SC. Ubiquitin signaling in immune responses. Cell Res. 2016;26:457–483. doi: 10.1038/cr.2016.40. [DOI] [PMC free article] [PubMed] [Google Scholar]
- 15.Lee MS, Kim B, Oh GT, Kim YJ. OASL1 inhibits translation of the type I interferon-regulating transcription factor IRF7. Nat Immunol. 2013;14:346–355. doi: 10.1038/ni.2535. [DOI] [PubMed] [Google Scholar]
- 16.Wakioka T, et al. Spred is a Sprouty-related suppressor of Ras signalling. Nature. 2001;412:647–651. doi: 10.1038/35088082. [DOI] [PubMed] [Google Scholar]
- 17.Guo Z, et al. CD4+CD25+ regulatory T cells in the small intestinal lamina propria show an effector/memory phenotype. Int Immunol. 2008;20:307–315. doi: 10.1093/intimm/dxm143. [DOI] [PubMed] [Google Scholar]
- 18.Tran DQ, et al. GARP (LRRC32) is essential for the surface expression of latent TGFβ on platelets and activated FOXP3+ regulatory T cells. Proc Natl Acad Sci USA. 2009;106:13445–13450. doi: 10.1073/pnas.0901944106. [DOI] [PMC free article] [PubMed] [Google Scholar]
- 19.Josefowicz SZ, Lu LF, Rudensky AY. Regulatory T cells: mechanisms of differentiation and function. Annu Rev Immunol. 2012;30:531–564. doi: 10.1146/annurev.immunol.25.022106.141623. [DOI] [PMC free article] [PubMed] [Google Scholar]
- 20.Maldonado RA, von Andrian UH. How tolerogenic dendritic cells induce regulatory T cells. Adv Immunol. 2010;108:111–165. doi: 10.1016/B978-0-12-380995-7.00004-5. [DOI] [PMC free article] [PubMed] [Google Scholar]
- 21.Kim KS, et al. Dietary antigens limit mucosal immunity by inducing regulatory T cells in the small intestine. Science. 2016;351:858–863. doi: 10.1126/science.aac5560. [DOI] [PubMed] [Google Scholar]
- 22.Jostins L, et al. Host–microbe interactions have shaped the genetic architecture of inflammatory bowel disease. Nature. 2012;491:119–124. doi: 10.1038/nature11582. [DOI] [PMC free article] [PubMed] [Google Scholar]
- 23.Moon CM, et al. Genetic variants in the IL12B gene are associated with inflammatory bowel diseases in the Korean population. J Gastroenterol Hepatol. 2013;28:1588–1594. doi: 10.1111/jgh.12214. [DOI] [PubMed] [Google Scholar]
- 24.Guo X, et al. Disruption of inducible 6-phosphofructo-2-kinase impairs the suppressive effect of PPARγ activation on diet-induced intestine inflammatory response. J Nutr Biochem. 2013;24:770–775. doi: 10.1016/j.jnutbio.2012.04.007. [DOI] [PMC free article] [PubMed] [Google Scholar]
- 25.Haberman Y, et al. Pediatric Crohn disease patients exhibit specific ileal transcriptome and microbiome signature. J Clin Invest. 2014;124:3617–3633. doi: 10.1172/JCI75436. [DOI] [PMC free article] [PubMed] [Google Scholar]
- 26.Bongers G, et al. The cytomegalovirus-encoded chemokine receptor US28 promotes intestinal neoplasia in transgenic mice. J Clin Invest. 2010;120:3969–3978. doi: 10.1172/JCI42563. [DOI] [PMC free article] [PubMed] [Google Scholar]
- 27.Madison BB, et al. Cis elements of the villin gene control expression in restricted domains of the vertical (crypt) and horizontal (duodenum, cecum) axes of the intestine. J Biol Chem. 2002;277:33275–33283. doi: 10.1074/jbc.M204935200. [DOI] [PubMed] [Google Scholar]
- 28.Jung S, et al. In vivo depletion of CD11c+ dendritic cells abrogates priming of CD8+ T cells by exogenous cell-associated antigens. Immunity. 2002;17:211–220. doi: 10.1016/s1074-7613(02)00365-5. [DOI] [PMC free article] [PubMed] [Google Scholar]
- 29.Saito M, et al. Diphtheria toxin receptor-mediated conditional and targeted cell ablation in transgenic mice. Nat Biotechnol. 2001;19:746–750. doi: 10.1038/90795. [DOI] [PubMed] [Google Scholar]
- 30.Bogunovic M, et al. Origin of the lamina propria dendritic cell network. Immunity. 2009;31:513–525. doi: 10.1016/j.immuni.2009.08.010. [DOI] [PMC free article] [PubMed] [Google Scholar]
- 31.Miller JC, et al. Deciphering the transcriptional network of the dendritic cell lineage. Nat Immunol. 2012;13:888–899. doi: 10.1038/ni.2370. [DOI] [PMC free article] [PubMed] [Google Scholar]
- 32.Edgar R, Domrachev M, Lash AE. Gene Expression Omnibus: NCBI gene expression and hybridization array data repository. Nucleic Acids Res. 2002;30:207–210. doi: 10.1093/nar/30.1.207. [DOI] [PMC free article] [PubMed] [Google Scholar]
- 33.Bongers G, et al. Interplay of host microbiota, genetic perturbations, and inflammation promotes local development of intestinal neoplasms in mice. J Exp Med. 2014;211:457–472. doi: 10.1084/jem.20131587. [DOI] [PMC free article] [PubMed] [Google Scholar]
- 34.Cummings RJ, et al. Exposure to ionizing radiation induces the migration of cutaneous dendritic cells by a CCR7-dependent mechanism. J Immunol. 2012;189:4247–4257. doi: 10.4049/jimmunol.1201371. [DOI] [PMC free article] [PubMed] [Google Scholar]
- 35.Shi C, Pamer EG. Monocyte recruitment during infection and inflammation. Nat Rev Immunol. 2011;11:762–774. doi: 10.1038/nri3070. [DOI] [PMC free article] [PubMed] [Google Scholar]
Associated Data
This section collects any data citations, data availability statements, or supplementary materials included in this article.
Supplementary Materials
Data Availability Statement
The Affymetrix microarray data have been deposited in the NCBI Gene Expression Omnibus (GEO) under GEO series accession number GSE85682.


